A Characterization of the Sea of Cortez, Gulf of California · 2014-12-06 · Erin Reed GIS in...
16
Erin Reed GIS in Watershed’s CE 394K A Characterization of the Sea of Cortez, Gulf of California Introduction The Sea of Cortez is a body of water enclosed on three sides by both the Baja Peninsula and Mainland Mexico. It is approximately 150 km wide and 1,100 km long. The topography varies greatly from the muddy Upper Northern Gulf with shallow depths of 200m to the coral reefs of the Southern opening where depths can increase beyond 3,600 m. The Sea of Cortez is known as a highly productive area especially for many small-scale fisheries whose nursery grounds are dependent on the brackish waters of the Upper Northern Sea of Cortez. Image 1- Study Area, Sea of Cortez in the Northern Hemisphere on a World Surface Sea Temperature Basemap.
Transcript of A Characterization of the Sea of Cortez, Gulf of California · 2014-12-06 · Erin Reed GIS in...

Erin Reed
GIS in Watershed’s CE 394K
A Characterization of the Sea of Cortez, Gulf of California
Introduction
The Sea of Cortez is a body of water enclosed on three sides by both the Baja Peninsula
and Mainland Mexico. It is approximately 150 km wide and 1,100 km long. The topography
varies greatly from the muddy Upper Northern Gulf with shallow depths of 200m to the coral
reefs of the Southern opening where depths can increase beyond 3,600 m. The Sea of Cortez is
known as a highly productive area especially for many small-scale fisheries whose nursery
grounds are dependent on the brackish waters of the Upper Northern Sea of Cortez.
Image 1- Study Area, Sea of Cortez in the Northern Hemisphere on a World Surface Sea Temperature
Basemap.

Image 2- Study Area with zonal divisions and a clear indication of bathymetry from North to South.
Taken from Lavin and Marinone 1998.
Objective
Understanding the relationship between environmental factors such as Sea Surface
Temperature (SST) and Scalar wind variables, U-wind and V-wind is important for
understanding the environment of the Sea of Cortez as a whole. Only with this preliminary
environmental understanding can biological implications for future work relating to maintaining
small-scale fisheries may be made. Using GIS techniques, a characterization of environmental
factors SST, U-wind, and V-wind will be made for the year of 1974 and isolating a typical
spawning month for many small scale fisheries (April) 1974 to observe regional variations.
Methods
Data used for this project was NOAA Earth System Research Laboratory Physical
Sciences Division (ESRL PSD) available as a monthly output for each variable in raster format
from the years 1960-2013. Data for the three variables (SST, U-wind and V-wind) were added
to an ArcGIS basemap, World Surface Sea Temperature. Addition of the majority of the monthly

raster datasets to the basemap was necessary to determine the most spatially accurate data to
describe the entirety of the Sea of Cortez. The year 1974 was used from this point forward
because it had the most spatially complete data sets throughout the North, Central, and South.
Identify was used continuously to obtain a general impression of how the three variables were
interacting with the system and how the system varied by latitude.
Part 1: Data selection and distribution
Image 3- Preliminary view of raster data with values for SST, U-wind, and V-wind determined
by Identify function.
Data was converted from raster to a point feature using the Raster to Point conversion tool. The
data was then exported from the geodatabase created in order to Extract Values to Points (spatial
analysis tool) to better understand the distribution of the data and define problematic data points
that might bias results. Data points indicated in Image 4 were deleted because they were mainly
stationed on the land versus the body of water.
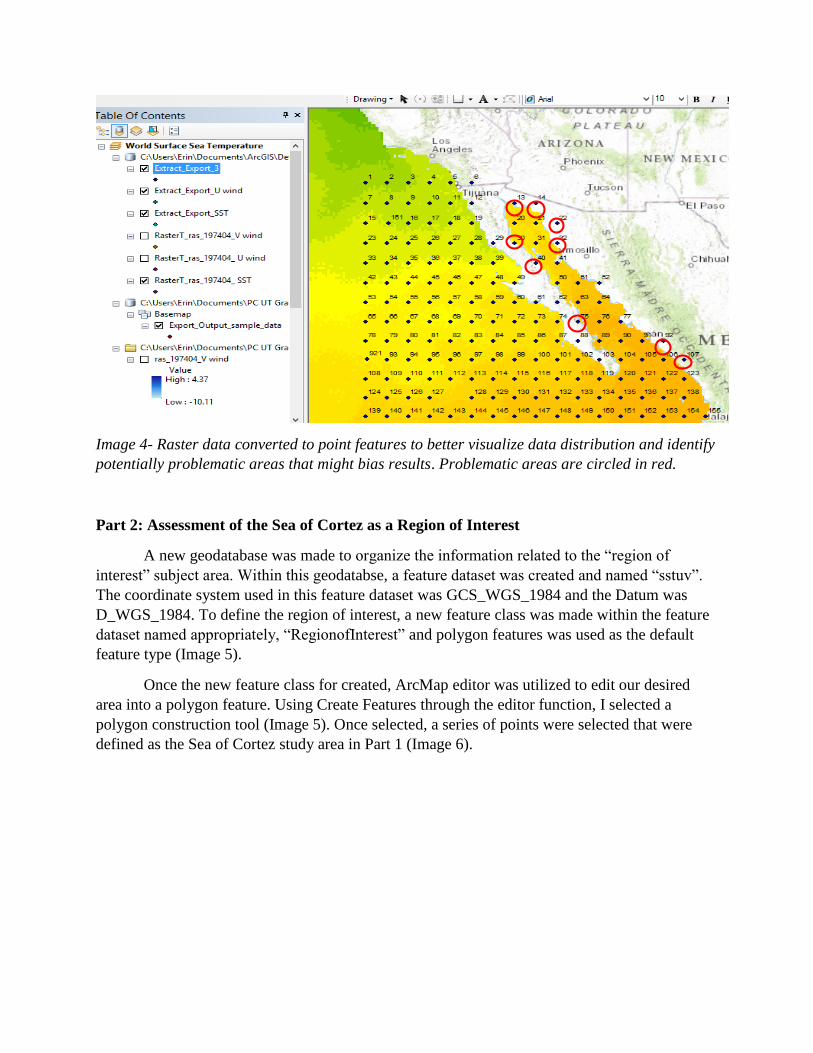
Image 4- Raster data converted to point features to better visualize data distribution and identify
potentially problematic areas that might bias results. Problematic areas are circled in red.
Part 2: Assessment of the Sea of Cortez as a Region of Interest
A new geodatabase was made to organize the information related to the “region of
interest” subject area. Within this geodatabse, a feature dataset was created and named “sstuv”.
The coordinate system used in this feature dataset was GCS_WGS_1984 and the Datum was
D_WGS_1984. To define the region of interest, a new feature class was made within the feature
dataset named appropriately, “RegionofInterest” and polygon features was used as the default
feature type (Image 5).
Once the new feature class for created, ArcMap editor was utilized to edit our desired
area into a polygon feature. Using Create Features through the editor function, I selected a
polygon construction tool (Image 5). Once selected, a series of points were selected that were
defined as the Sea of Cortez study area in Part 1 (Image 6).

Image 5- Selection windows for creating a new feature class (Left) and for editing the region of
interest using create features to construct a polygon feature (Right).
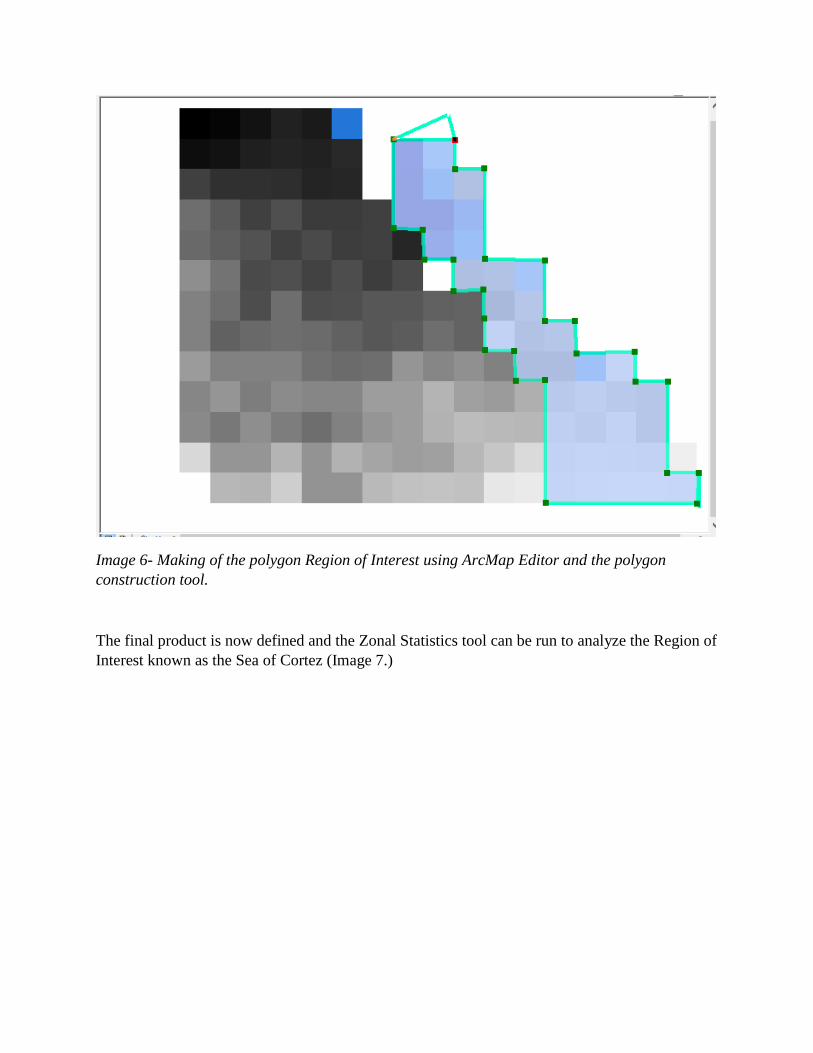
Image 6- Making of the polygon Region of Interest using ArcMap Editor and the polygon
construction tool.
The final product is now defined and the Zonal Statistics tool can be run to analyze the Region of
Interest known as the Sea of Cortez (Image 7.)
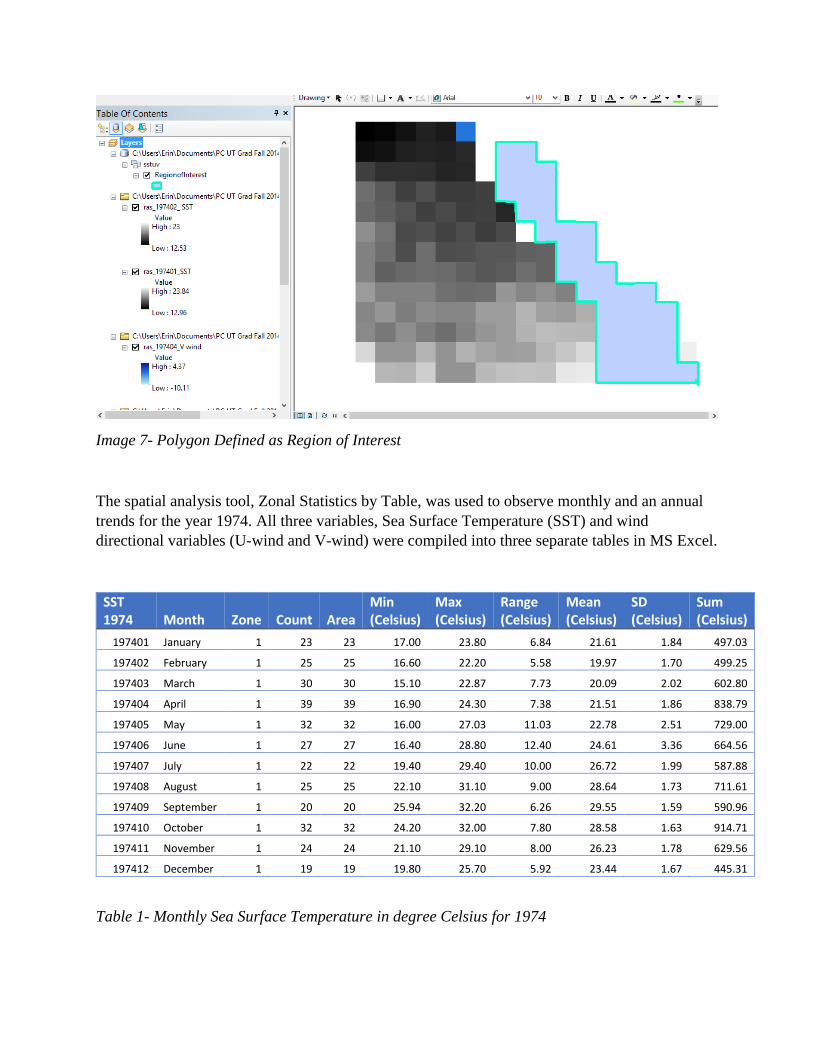
Image 7- Polygon Defined as Region of Interest
The spatial analysis tool, Zonal Statistics by Table, was used to observe monthly and an annual
trends for the year 1974. All three variables, Sea Surface Temperature (SST) and wind
directional variables (U-wind and V-wind) were compiled into three separate tables in MS Excel.
SST 1974 Month Zone Count Area
Min (Celsius)
Max (Celsius)
Range (Celsius)
Mean (Celsius)
SD (Celsius)
Sum (Celsius)
197401 January 1 23 23 17.00 23.80 6.84 21.61 1.84 497.03
197402 February 1 25 25 16.60 22.20 5.58 19.97 1.70 499.25
197403 March 1 30 30 15.10 22.87 7.73 20.09 2.02 602.80
197404 April 1 39 39 16.90 24.30 7.38 21.51 1.86 838.79
197405 May 1 32 32 16.00 27.03 11.03 22.78 2.51 729.00
197406 June 1 27 27 16.40 28.80 12.40 24.61 3.36 664.56
197407 July 1 22 22 19.40 29.40 10.00 26.72 1.99 587.88
197408 August 1 25 25 22.10 31.10 9.00 28.64 1.73 711.61
197409 September 1 20 20 25.94 32.20 6.26 29.55 1.59 590.96
197410 October 1 32 32 24.20 32.00 7.80 28.58 1.63 914.71
197411 November 1 24 24 21.10 29.10 8.00 26.23 1.78 629.56
197412 December 1 19 19 19.80 25.70 5.92 23.44 1.67 445.31
Table 1- Monthly Sea Surface Temperature in degree Celsius for 1974

U-wind 1974 Month Zone Count Area
Min (m/s)
Max (m/s)
Range (m/s)
Mean (m/s)
SD (m/s)
Sum (m/s)
197401 January 1 23 23 -1.41 3.89 5.30 1.10 1.37 25.26
197402 February 1 25 25 -1.41 3.92 5.34 1.53 1.35 38.29
197403 March 1 30 30 -0.90 4.75 5.65 2.27 1.42 68.06
197404 April 1 37 37 -2.07 4.01 6.08 1.66 1.52 61.40
197405 May 1 31 31 -4.63 5.37 10.00 1.75 2.21 54.23
197406 June 1 26 26 -3.28 5.59 8.87 0.90 1.90 23.48
197407 July 1 21 21 -1.89 5.26 7.15 0.60 1.60 12.53
197408 August 1 23 23 -3.10 2.28 5.38 0.20 1.26 4.63
197409 September 1 20 20 -1.05 4.54 5.59 1.40 1.48 28.00
197410 October 1 35 35 -0.91 3.58 4.49 1.44 1.22 50.33
197411 November 1 24 24 -1.74 3.70 5.44 1.32 1.36 31.79
197412 December 1 19 19 -4.10 3.57 7.67 0.32 1.85 6.08
Table 2- Monthly U-wind (m/s) for the year 1974
V-wind 1974 Month Zone Count Area
Min (m/s)
Max (m/s)
Range (m/s)
Mean (m/s)
SD (m/s)
Sum (m/s)
197401 January 1 23 23 -7.61 3.93 11.54 -3.13 2.38 -71.89
197402 February 1 25 25 -7.66 0.00 7.66 -4.24 1.64 -106.00
197403 March 1 30 30 -7.95 5.52 13.47 -1.84 2.65 -55.09
197404 April 1 37 37 -6.47 4.37 10.84 -1.74 2.39 -64.46
197405 May 1 31 31 -5.32 5.52 10.84 -0.54 2.61 -16.88
197406 June 1 26 26 -7.52 3.91 11.43 -0.57 3.09 -14.78
197407 July 1 21 21 -5.58 4.79 10.37 0.60 2.19 12.68
197408 August 1 23 23 -5.37 4.69 10.06 -0.22 2.06 -5.03
197409 September 1 20 20 -3.03 1.47 4.50 -0.81 1.16 -16.27
197410 October 1 35 35 -5.55 3.75 9.30 -1.83 1.85 -64.15
197411 November 1 24 24 -7.42 -1.06 6.36 -3.63 1.50 -87.14
197412 December 1 19 19 -7.28 3.14 10.42 -4.21 2.48 -80.00
Table 3- Monthly V-wind (m/s) for the year 1974
Part 3: Assessment of three Regions of Interest within the Sea of Cortez
The Region of Interest in Part 2 was then divided up into three geographical areas termed
Northern Gulf of California, Central Gulf of California, and Southern Gulf of California. The
division of area is to provide more information on the changing dynamics of SST and wind
directional variables as they change from North to South. The Northern GOC was defined by an

estimated Latitude of 32N to 28N. The Central GOC is defined by an estimated Latitude of 28N
to 24N. The Southern GOC is defined by an estimated latitude of 24N to 20N. Three new
feature classes were made and named, “RegionofInterest_North”, “RegionofInterest_Central”,
and” RegionofInterest_South”. ArcMap editor was used again to edit the features. Create Feature
was selected and edits were made using the same polygon constructional tool used in Part 2.
In order to analyze the newly created study areas in terms of their general location
(North, Central, South) the same spatial analyst tool was used, Zonal Statistics by Table. April is
a time period of particular interest because of the biological implications for spawning fisheries
in the Northern GOC, therefore only the month of April was used for this regional analysis.
Zonal Statistics by table was conducted 9 times, once for each variable in each of the three
created regions of interest. The information was then input into MS Excel see Table 4.
Image 9- North, Central, and South regions of Interest
1974 North Zone Count Area Min Max Range Mean SD SUM
SST 1 10 10 16.9 21.7 4.78 19.316 1.35 193.16
Uwind 1 9 9 -1.4 3.57 4.97 1.69 1.82 15.18
Vwind 1 9 9 -6.47 4.37 10.84 -0.69 3.69 -6.2
Table 4- Regional data for the North GOC, SST degree Celsius, U-wind (m/s), and V-wind (m/s).

1974 Central Zone Count Area Min Max Range Mean SD SUM
SST 1 12 12 18.5 22.9 4.4 21.24 1.18 254.92
Uwind 1 11 11 -2.07 3.86 5.93 1.34 1.67 14.77
Vwind 1 11 11 -5.83 -0.36 5.47 -2.41 1.65 -26.51
Table 5- Regional data for the Central GOC, SST degree Celsius, Uwind (m/s), and Vwind (m/s).
1974 South Zone Count Area Min Max Range Mean SD SUM
SST 1 17 17 21.03 24.3 3.27 22.98 0.9 390.71
Uwind 1 17 17 -0.36 4.01 4.37 1.85 1.186 31.45
Vwind 1 17 17 -3.62 2.07 5.69 -1.87 1.59 -31.74
Table 6- Regional data for the South GOC, SST degree Celsius, Uwind (m/s), and Vwind (m/s).
Results
Part 1 &2: Total Assessment of Sea of Cortez variation in SST, U-wind, and V-wind
A year time span divided into monthly increments appears to have a fairly regular
distribution over the entirety of the Sea of Cortez for SST. A curve produced in Table 7A,
indicates the mean SST has a very regular seasonal fluctuation during the year 1974. The
temperatures appear lowest from January-March (20-21C) and begin to increase in April. The
highest temperatures were noted in August-October (28-30C).
The wind variables appear to have an interesting seasonal fluctuation similar to SST
(Table 7B). The U-wind vector of scalar wind describes wind patterns on the x-axis from West
(-) to East (+). In the winter months, the mean U-wind appears to be strongly blowing from the
East (2.5 m/s) and then makes a steady change in magnitude from April to August where the
wind is ( 1.5-0 m/s). Due to its low magnitude, the wind is almost nonexistent during the late
Spring/ Summer (approximately 0.25 m/s) and then suddenly reappears in September with
magnitudes increasing from 0 to 1.50 m/s within a month’s time span. September through
November, there is an increased magnitude of approximately 1.50 m/s.
The vector variable V-wind has a seasonal pattern that coincides with U-wind and SST
changes (Table7C). V-wind is a vector of scalar wind that describes the y-axis wind direction
and magnitude. The mean V-wind in the winter months, particularly February, blows strongly
from the South (-4.25 m/s) and then has a very strong wind reversal right after February
beginning of March where the wind is beginning to lessen in magnitude until the Summer

months where there is no wind blowing N/S in May- Late June. A second drastic change from
June to July occurs as the wind gains magnitude and now blows from North to the South for the
remaining half of the year until the following February.
A
B

Table 7- Mean monthly variation for the year 1974, A) SST B) U-wind C) V-wind
Table 8- Combined monthly variation of all three variables, SST, U-wind, and V-wind
-10.00
-5.00
0.00
5.00
10.00
15.00
20.00
25.00
30.00
35.00
1 2 3 4 5 6 7 8 9 10 11 12
Month
Mean monthly variation in SST, U-wind, and V-wind 1974
SST U-wind V-wind
C
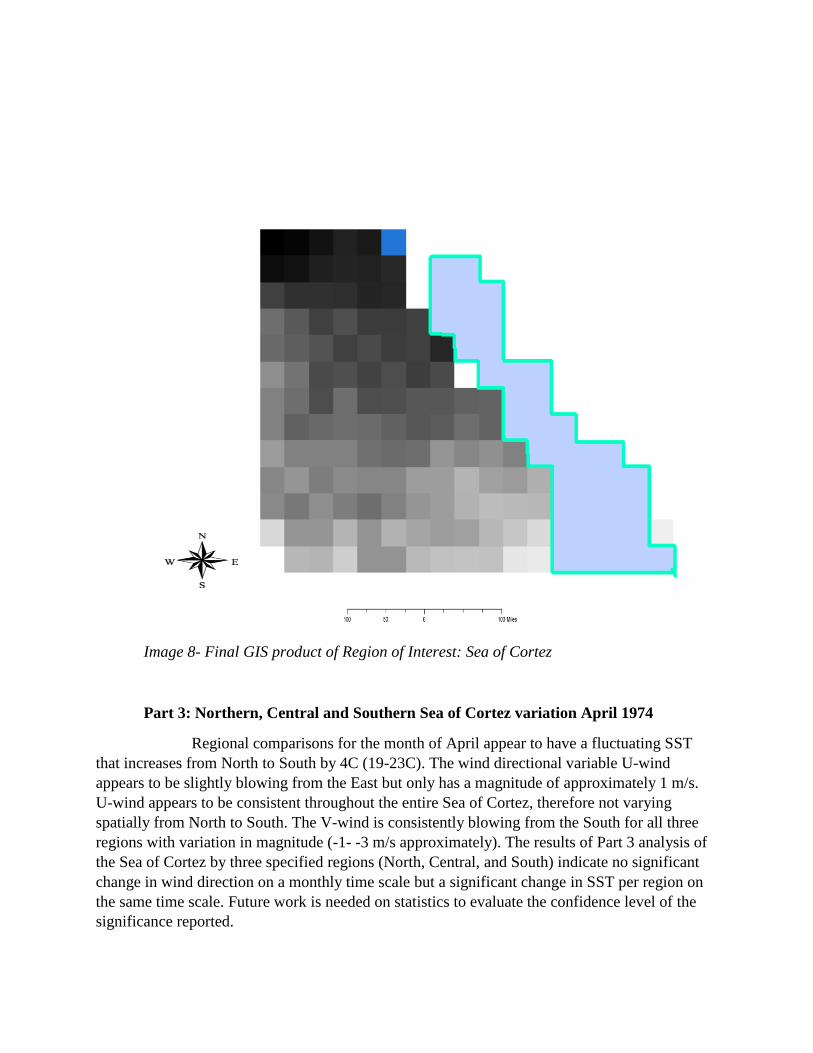
Image 8- Final GIS product of Region of Interest: Sea of Cortez
Part 3: Northern, Central and Southern Sea of Cortez variation April 1974
Regional comparisons for the month of April appear to have a fluctuating SST
that increases from North to South by 4C (19-23C). The wind directional variable U-wind
appears to be slightly blowing from the East but only has a magnitude of approximately 1 m/s.
U-wind appears to be consistent throughout the entire Sea of Cortez, therefore not varying
spatially from North to South. The V-wind is consistently blowing from the South for all three
regions with variation in magnitude (-1- -3 m/s approximately). The results of Part 3 analysis of
the Sea of Cortez by three specified regions (North, Central, and South) indicate no significant
change in wind direction on a monthly time scale but a significant change in SST per region on
the same time scale. Future work is needed on statistics to evaluate the confidence level of the
significance reported.

Table 9- Regional variation for a spring fish spawning month (April) in 1974. 1= North,
2=Central, 3=South.
Image 9- A GIS Final product Region’s of interest North GOC, Central GOC, and South
GOC.
-5
-3
-1
1
3
5
7
9
11
13
15
17
19
21
23
25
0 1 2 3
Region (North, Central, South)
Regional mean variation April 1974
SST Uwind Vwind

Discussion
The 1974 data indicates that the Sea of Cortez in the Gulf of California has
definite seasonality of its variables of SST, U-wind, and V-wind as indicated by Parts 1 and 2 in
this report. When analyzing the Sea of Cortez as a whole for the duration of a year, the SST has a
mean range of (20-30C) as indicated in Table 7A. The lowest temperatures are observed in the
Winter, January through March, where a steady increase in SST peaks in September and then
begins its annual decline during the Fall. The U-wind vector appears to have four strong
magnitude variations during each season, however the wind direction remains constant, always
blowing from the East due to the data’s constant positive value (Table 7B). Both U-wind and V-
wind variables are near 0 m/s during the summer months June-August (Table 8). The wind
blowing North to South, as indicated by V-wind, maintains two reversals in direction during an
annual period. During winter and late spring/early summer (February to June) the wind is
consistently blowing from the South with decreasing magnitudes (-4 to 0 m/s). In the late
summer after an approximate 2-3 month time period of almost no wind strength, the direction of
the wind changes to blow North to South for the remaining half of the year.
The SST, U-wind, V-wind variables appear to have similar characteristic changes across
the entire Sea of Cortez for a year’s time span. An increase in SST during the summer months
appears to coincide with a very strong decrease or lack or wind strength suggesting that the wind
is a strong force in the surface temperature of the upper water column. When this force dissipates
or disappears, sea surface temperatures (SST) are allowed to rise considerably during a 2-3
month time span before both the East and Northerly winds resume. The fact that both wind
variables become nonexistent and increase at the same time is an interesting point to delve into
for future research and hints at a greater atmospheric forcing on a global scale.
Regional differences were analyzed during the month of April, 1974 due to its relevance
as an important seasonal time period for commercially significant small-scale fisheries in the
GOC. The three regions described as North, Central, and South indicated the greatest variation in
the three variables occurred in SST (Table 9). The wind directional variables remained fairly
constant among a monthly time scale and in particular their magnitudes hovered between (-3 -1
m/s). SST was surprising for two reasons, first its amount of variation between the three areas
(~2C) per region and second because of the direction of increase in temperature. Due to drastic
differences in topography and depth of the North GOC versus the South GOC, I would expect a
larger temperature gradient between regions due to very shallow waters at in the North (~200m)
and very deep waters in the South (~1,100m) over such a latitudinal change as selected. Also the
temperature gradient of SST was obviously warmer in the South (23C) and cooler in the North
(19C). This was quite possibly the most surprising regional characteristic observed because
warmer temperatures were assumed to be more easily created in shallow water versus deep
waters due to the Pacific Ocean’s high heat capacity. The amount of data points in the North
versus the South used for this study might create some bias in SST but it is obvious that there is
some other forcing agent, possibly a large body of warm water that enters the mouth of the GOC
that influences SST greatly.

Conclusion
In conclusion the Sea of Cortez is a dynamic area for both current and future research.
This research concluded that the Sea of Cortez when observed as a whole over an annual time
span, has very definite seasonality characteristics for the variables SST, U-wind, and V-wind.
Wind is an important forcing mechanism for controlling SST especially during the summer
months when the wind declines drastically for 2-3 months resulting in a rise in SST by
approximately 5C due to the lack of surface mixing created by wind.
Regionally, the study observed that the Sea of Cortez during April 1974, exhibits curious
indications for SST and wind variables. Wind appears to be minimally affected on a monthly
time scale and therefore both variables remain relatively constant. A definite 2C increase in SST
going from North to South contradicted previous assumptions and leaves more questions for
further inquiry. Questions still remain as to these effects on biological interactions, in particular,
those of aggregate spawning fish species that spawn only in April with the Lunar cycles and only
in the Upper (North) GOC and what these environmental implications are in their behavioral
patterns.