Advanced Ignition Modelling for Pre-chamber Combustion in ...

A CHAMBER AND MODELLING INVESTIGATION OF THE POTENTIAL IMPACTS OF SEMI-VOLATILE MATERIAL ON CLOUD DROPLETS
A thesis submitted to The University of Manchester for the degree of
MPhil Atmospheric Science
in the Faculty of Science & Engineering
2016
WILLIAM T. HESSON
SCHOOL OF EARTH AND ENVIRONMENTAL SCIENCES

2
Contents
Title Page Pg. 1
Contents Pg. 2
Abstract Pg. 3
Declaration Pg. 4
Copyright Statement Pg 4.
Acknowledgement Pg. 5
1. Introduction Pg. 6–16
1.1 Overview of Thesis Pg. 6
1.2 Motivation Pg. 6–7
1.3 Literature Review Pg. 7–15
1.3.1 Aerosol Overview Pg. 7
1.3.2 Aerosol Effects Pg. 7–8
1.3.3 Humidity and Droplet Activation Pg. 8–11
1.3.4 Number Concentration and Size Distribution Pg. 11
1.3.5 Aerosol Composition Pg. 11–15
1.3.6 Summary Pg. 15
1.4 Attributing Credit Pg. 15-16
2. A chamber and modelling investigation of the potential impacts of semi-volatile material on
cloud droplets Pg. 17
3. Supplementary Material for “A chamber and modelling investigation of the potential impacts of
semi-volatile material on cloud droplets” Pg. 18
4. Conclusion Pg. 19-20
5. References Pg. 21-27
Word Count
Word Count 20,404

3
Abstract
Clouds play an important role in the Earth’s radiative budget (i.e. the amount of energy lost to
and gained from space by the Earth). The concentration of droplets present in clouds is a critical
factor in determining their albedo so any factor which influences the formation of droplets in
clouds will affect the Earth’s radiative budget. Cloud droplets are formed by some aerosol
particles known as cloud condensation nuclei (CCN) given appropriate ambient conditions.
Secondary organic aerosols (SOAs) are one such component which is abundant in the
atmosphere. Globally, SOAs have a large semi-volatile component (i.e. material which partitions
between the gas and aerosol phases) and have been found in modelling work to co-condense with
water, enhancing their CCN activity. In this thesis, the first chamber based evidence for CCN
activity enhancement of SOA via co-condensation is presented. Experiments have been conducted
in a controlled chamber environment to generate SOA from 1,3,5-trimethylbenzene, limonene, β-
caryophyllene and α-pinene. These aerosols were then transferred to a cloud chamber where
evacuations were conducted on the samples in order to produce clouds. The activation observed
in these clouds has been compared to modelled data (which does not include co-condensation)
and a discrepancy has been observed with SOA samples generated from β-caryophyllene and α-
pinene which suggests enhancement from co-condensation. This conclusion is further supported
by additional modelling tests which rule out the possibility of uncertainties in the volatility bin
distribution or in the hygroscopicity parameter κ being responsible for the discrepancy between
chamber and model data. Agreement can be reached however, by including plausible
concentrations of co-condensing material. These findings are placed within the broader context of
SOA properties and may explain some of the discrepancies observed concerning the value of the
hygroscopicity parameter κ.

4
Declaration
No portion of the work referred to in the thesis has been submitted in support of an
application for another degree or qualification of this or any other university or other
institute of learning.
Copyright Statement
i. The author of this thesis (including any appendices and/or schedules to this thesis) owns
certain copyright or related rights in it (the “Copyright”) and s/he has given The University of
Manchester certain rights to use such Copyright, including for administrative purposes.
ii. Copies of this thesis, either in full or in extracts and whether in hard or electronic copy, may be
made only in accordance with the Copyright, Designs and Patents Act 1988 (as amended) and
regulations issued under it or, where appropriate, in accordance with licensing agreements
which the University has from time to time. This page must form part of any such copies
made.
iii.The ownership of certain Copyright, patents, designs, trade marks and other intellectual
property (the “Intellectual Property”) and any reproductions of copyright works in the
thesis, for example graphs and tables (“Reproductions”), which may be described in this
thesis, may not be owned by the author and may be owned by third parties. Such Intellectual
Property and Reproductions cannot and must not be made available for use without the prior
written permission of the owner(s) of the relevant Intellectual Property and/or
Reproductions.
iv. Further information on the conditions under which disclosure, publication and
commercialisation of this thesis, the Copyright and any Intellectual Property University IP
Policy (see http://documents.manchester.ac.uk/display.aspx?DocID=24420), in any relevant
Thesis restriction declarations deposited in the University Library, The University
Library’s regulations (see http://www.library.manchester.ac.uk/about/regulations/) and in The
University’s policy on Presentation of Theses

5
Acknowledgement
I’d like to thank my supervisors Gordon McFiggans and Paul Connolly for the opportunity to
undertake this project and their support to complete it and for NERC for providing funding for this
project. Thanks are also due to Angela Buchholz particularly for her assistance with those long
days in the laboratory. I’d also like to thank all those who assisted me in learning about and fixing
instrumentation and operation of the chamber facilities, in particular, Rami Alfarra, Mike Flynn,
James Dorsey, Chris Emersic and Lee Paul. Finally, I’d like to thank Dawn Hesson and Pam Bennett
for keeping me sane.

6
1.Introduction
1.1 Overview of Thesis
Secondary Organic Aerosol (SOA) have been shown to act as cloud condensation nuclei (CCN) but
uncertainties remain with respect to their hygroscopicity and thereby their ability to activate into
droplets (Whitehead et al. 2014). In this thesis, we will first discuss the background surrounding
the activation of SOA particles into droplets (Chapter 1). A paper format piece of work is then
presented (Chapter 2 and 3) in which new data is presented from experiments conducted using
the combined Manchester Aerosol Chamber (MAC) and Manchester Ice Cloud Chamber (MICC)
facility to generate SOA and to conduct cloud evacuations in a controlled chamber environment in
order to probe their CCN activity. This will be compared to results from modelling this process.
Finally, in Chapter 4, the thesis will be concluded looking at the significance of this work with
respect to the wider field.
1.2 Motivation
The radiative budget of the Earth plays a key role in determining its surface temperature and
clouds are known to be a phenomenon which affects Earth’s radiative budget (Fung et al. 1984;
Chen et al. 2000; Corti & Peter 2009) with the influence of aerosol on warm liquid water clouds
being the largest source of attributable uncertainty in global radiative forcing (Boucher et al.
2013). Adjustments in cloud properties attributable to atmospheric aerosols result from their
influences on both warm (McFiggans et al. 2006)and cold (Hoose & Möhler 2012) clouds, meaning
that aerosols affect the Earth’s radiative budget (Bauer & Menon 2012). As such they play an
important role in Earth’s climate system and a good understanding of aerosols is necessary in
order to understand climate change which is anticipated to have an impact on human health
(Markandya & Chiabai 2009), wealth generation (Trærup et al. 2011) and food security (Vrieling et
al. 2011). A variety of weather phenomena are impacted by the presence and formation of clouds,
including rainfall which, for instance, can be suppressed or postponed by the presence of high
concentrations of cloud condensation nuclei (CCN) due to the particles competing for a limited
supply of water vapour (Chen et al. 2011); this, in turn, can reduce the water supply downwind of
substantial anthropogenic emission sites (Rosenfeld et al. 2007; Andreae & D Rosenfeld 2008). An
important source of CCN in the atmosphere are secondary organic aerosols which are abundant
with a total mass loading of 115 Tg yr-1 (Hallquist et al. 2009). However, questions remain

7
concerning their hygroscopicity and hence their CCN activity particularly at low supersaturations
due to disagreement between instruments (Whitehead et al. 2014); additionally, SOAs CCN
activity has been predicted to be enhanced by the co-condensation of semi-volatile material and
water vapour during droplet formation (Topping et al. 2013). This thesis will address the question
of whether co-condensation can be observed in a controlled chamber environment and what this
might mean for the observed discrepancies between different measurements of SOA
hygroscopicity.
1.3 Literature Review
1.3.1 Aerosol Overview
An aerosol mass is defined as a suspension of liquid or solid particles in a gas; each particle is an
aerosol particle. In the atmosphere, aerosol particles come from a number of sources, vary in size,
chemical composition and hence hygroscopicity, phase and other properties which affect their
behaviour and radiative forcing.
1.3.2 Aerosol Effects
The impact of aerosol effects on Earth’s energy budget depends both upon the position in the
vertical profile of the atmosphere and the aerosol’s properties (Wang et al. 2009; Haywood &
Boucher 2000). These effects remain the greatest source of uncertainty in the Earth’s radiative
budget with an overall effect of -0.45±0.5 W m-2 (Boucher et al. 2013), the most important being
the direct, semi-direct and indirect effects.
The direct effect is concerned with the scattering and absorption properties of clouds. In general
this has a net cooling effect on the Earth’s surface by scattering incident solar radiation (Haywood
& Boucher 2000), however where strongly absorbing aerosol, such as black carbon (Bond et al.
2013), are present the result can either have a net warming or cooling effect depending upon the
surface albedo beneath (Haywood & Boucher 2000). The overall direct effect has been estimated
at -0.5 W m-2. The semi-direct effect refers to the warming of clouds due to the presence of
absorbing aerosol which causes evaporation of the cloud (Fischer & Grassl 1975; Bauer & Menon
2012); depending on where this occurs this can either have a negative or positive radiative

8
forcing. The net semi-direct effect has been estimated as -0.1 W m-2(Bauer & Menon 2012).
There are several indirect effects. The Twomey effect (Twomey 1977) has a negative radiative
forcing, the presence of aerosol particles causes increased cloud droplet number concentration
thus increasing the optical depth of the cloud making it more reflective and increasing the amount
of incident solar radiation reflected back to space. High concentrations of aerosol mean more
competition for water vapour making it more difficult for rain-size drops to form; this increases
the liquid water content of clouds and this, in turn, increases their reflectivity so more solar
radiation is reflected (Rosenfeld 2000). This suppression of rainfall means that clouds persist for a
longer period of time in the atmosphere, so clouds with a greater concentration of aerosol reflect
solar radiation for longer, providing an additional cooling effect (Albrecht 1989). For the same
reasons, cloud thickness is increased resulting in further cooling (Pincus & Baker 1994). The total
indirect effect has been estimated at -0.7±0.5 W m−2 (Quaas et al. 2009) making it a substantial
source of uncertainty in Earth’s radiative budget.
1.3.3 Humidity and Droplet Activation
Köhler theory describes an idealised aerosol particle response to changes in relative humidity
including its activation into a droplet. Two terms determine the saturation vapour pressure over a
droplet: the Raoult (or solute) term which is associated with the presence of soluble material, and
the Kelvin (or curvature) term associated with the curvature of a droplet (Köhler 1936). Both the
Kelvin and Raoult terms have a dependency upon the size of the particle. The Kelvin term
decreases proportionally to the inverse cube of the diameter of the particle (see Equation 1)
meaning that it is most important at small sizes. The saturation vapour pressure over a curved
surface like that of a particle is greater than the saturation vapour pressure over a flat surface. As
the curvature of a particle reduces with increasing size, the surface tension of water over the
curved surface of the particle tends towards the surface tension over a flat surface and so the
Kelvin term reduces in size. The Raoult term is proportional to the inverse of the diameter of the
particle, as such it also falls as the diameter of the particle increases, however, as the dependency
of the Raoult term is lower by a factor of the square of the particle’s diameter relative to the
Kelvin term, the importance of the Raoult term increases as the diameter of the particle
increases. The Köhler equation can be written as shown in Equation 1 (Seinfeld & Pandis 2006),
where pw is the saturation vapour pressure, Dp refers to aerosol particle diameter, p0 is the
vapour pressure of water over pure water, Mw is the molecular mass of water, σw is the surface

9
tension, R is the universal gas constant, T is the temperature and ρw is the density of water over
the droplet.
30
64)(ln
pw
ws
pw
wwpw
D
Mm
DRT
M
p
Dp
Equation 1(Seinfeld & Pandis 2006)
From Equation 1, a critical size can be calculated for any given particle for a given supersaturation:
as soon as a particle passes this size it will experience runaway growth, turning into a droplet. The
hygroscopicity parameter, κ (Petters & Kreidenweis 2007), is the main approach used to
parameterise water activity, aw, the ability of any type of aerosol to take up water relating it to
water activity using the relationship shown in Equation 2 where Vs is the volume of solute and Vw
is the volume of water. A smaller value of κ indicates that the aerosol particle is less hygroscopic
and therefore will activate at a larger size and at a greater supersaturation and vice versa.
1
𝑎𝑤= 1 + κ
𝑉𝑠
𝑉𝑤 Equation 2(Petters & Kreidenweis 2007)
There are a number of approaches to making measurements of κ including, via measuring water
uptake using a Hygroscopicity Tandem Differential Mobility Analyser (HTDMA) (Switlicki et al.
2008), using an electrodynamic balance (EDB) method or measuring activation by exposing the
aerosol to controlled supersaturated conditions using a Cloud Condensation Nuclei Counter
(CCNc) . The EDB method is a single particle approach in which a particle is electrically charged
and levitated. In modern studies, a double ring electrode design is typically used (Davis et al.
1990; Pope 2010; Pope et al. 2010; Gallimore et al. 2011). An electrostatic DC field and an
electrodynamic AC field are used to create a trap to hold the particle. The strength of the DC field
used to balance the gravitational attraction of the particle to the Earth can be used to calculate its
mass so by exposing the suspended particle to different relative humidities, the growth factor of
the particles can be probed and thus a value of κ derived. This approach is difficult to use when
studying chamber derived SOA particles as only a single particle can be studied at one time, the
chemical composition changes between particles and throughout the ageing of the aerosol mass.

10
This approach will not be further considered in this thesis. HTDMAs measure the growth factor of
aerosol particles by size selecting particles at an initial relative humidity (e.g. a dried sample with
10 % RH) to get a sample of aerosol particles of the same size; these particles are then exposed to
conditions at a different relative humidity (e.g. 90 %) and size-selected again using the second
DMA to determine how many particles from the initially selected size grow by a set amount.
These particles are then counted with a Condensation Particle Counter. By measuring at a range
of sizes and relative humidities, a picture can be developed of the growth factor of these particles.
This can be used to calculate a value of κ. CCNc’s (Roberts & Nenes 2005; Alofs et al. 1995)
instead measure the number of particles activated when particles are exposed to a controlled
supersaturation. In general, continuous flow thermal gradient CCNc’s (Roberts & Nenes 2005) are
used in modern studies. These operate by exposing the aerosol sample to a column of evenly
increasing temperature which draws water vapour and heat from the walls but since water
vapour diffuses faster than thermal energy, a steady supersaturation can be established which
depends upon the thermal gradient and total airflow (Roberts & Nenes 2005). The number of
particles activated for a selected initial size at a given supersaturation can then be used to
determine a value of κ.
There are a number of limitations to Köhler theory. Firstly, it assumes that there is a solute and
that it will all be dissolved which is not the case for all aerosol: hydrophilic aerosol particles can
also be activated as droplets as described using FHH activation theory (Sorjamaa & Laaksonen
2007). Many aerosols are only partially soluble, especially some/many organic aerosols and semi-
volatile aerosols such as some SOA and ammonium nitrate. These can condense onto a particle as
it takes up water, effectively increasing what would have been considered its dry size which can
significantly enhance droplet activation (Topping et al. 2013; Topping & McFiggans 2012). Finally,
there is the problem of deliquescence and efflorescence which are described by modified Köhler
theory (Chen 1994). Aerosol particles grow and shrink depending on their hygroscopicity and the
temperature and relative humidity of the surrounding environment along with their
deliquescence and efflorescence points and the particle’s history. Under subsaturated conditions,
hygroscopic aerosol particles such as salts take up water as relative humidity increases. However,
at a threshold relative humidity below saturation, a phase transition occurs and the particle loses
its crystallinity and swells with water producing a step change in its diameter as a function of RH.
Further increases in relative humidity then see the particle grow further but no further step
change occurs. This threshold is known as the deliquescence point. When the relative humidity of
the particle is decreased below its deliquesence point, however, the particle does not shrink back

11
to its original size. Instead it will remain wetted though it will continue to shrink until a lower
threshold relative humidity, known as the efflorescence point, is reached when a step change in
particle diameter and change of phase state will occur. For instance, ammonium sulphate has an
efflorescence point of approximately 35 % RH and a deliquescence point of approximately 84.2 %
at 298 K (Seinfeld & Pandis 2006).
1.3.4 Number Concentration and Size Distribution
Aerosol particles vary in size between a few nanometres to tens of microns. These sizes are split
between four modes: the nucleation mode which comprises newly formed particles (sizes
typically between 1 and 10 nanometres), the Aitken mode (10 to 100 nanometres) from which
particles are usually lost by coagulation to the accumulation mode (sizes typically between 100
nanometres and 1 micron) which in turn are typically lost to washout, and finally coarse mode
particles (sizes typically greater than 1 micron) which are usually formed by mechanical processes
with sources such as sea spray and wind-blown dust and are generally lost by sedimentation
(Seinfeld & Pandis 2006).
Loss of atmospheric aerosol particles is most efficient for larger and smaller sizes with residence
times longest for accumulation mode aerosol particles (Seinfeld & Pandis 2006). The smallest
particles are generally lost by coagulation which occurs when particles collide and become a
single larger particle. This is dependent upon the mean free path and sticking efficiency of the
particles concerned. The other major form of aerosol growth is condensation whereby material
from the gas phase condenses onto existing particles causing them to grow. This occurs when gas
phase compounds are above their saturation vapour pressure, encouraging this material to enter
the aerosol phase. The distribution of the condensation is proportional to the surface area of the
particles present (Seinfeld & Pandis 2006).
Aitken mode particles tend to dominate the number concentration of aerosol in the atmosphere
except during a nucleation event (Asmi et al. 2011). Accumulation mode particles with their
relative abundance and size tend to provide the largest amount of surface area amongst
atmospheric nuclei meaning that they tend to be the main site for condensation of secondary
aerosol. The mass of aerosol particles in the atmosphere is generally dominated by the coarse
mode due to their large size (Seinfeld & Pandis 2006).

12
1.3.5 Aerosol Composition
There are many different aerosol particles found in the atmosphere including primary and
secondary organic aerosol (Sun & Ariya 2006), sea spray (Grythe et al. 2014), black carbon
(Boucher et al. 2013), mineral dust (Boucher et al. 2013), volcanic ash (Rodríguez et al. 2012) and
sulfate (Langmann 2014), cellular material (Jaenicke 2005), and even pollen (Pope 2010).
As a result of their source, sea spray particles are primarily found in marine and marine-influenced
environments where they make up 50–70 % of aerosol mass (Boucher et al. 2013). In marine
environments, where there are generally few sources of aerosol particles, sea spray particles are
extremely important in terms of the CCN concentrations, scattering etc. and are often found to be
mixed with other aerosol components, such as sulphate, from both natural and anthropogenic
sources (Grythe et al. 2014). The total mass of sea salt aerosol emitted annually is not well known,
however, it has been reported to fall in the range 3000 to 70000 Tg (Grythe et al. 2014). Sea spray
particles occur across a wide size spectrum from approximately 20 nm (Mårtensson et al. 2010) to
the micron scale (Seinfeld & Pandis 2006). Three difference mechanisms produce sea spray
particles: the bursting of film droplets, the jet of water which fills in the gap left by the burst
bubble, and the wind directly ripping water off the surface (Grythe et al. 2014). As such, strong
winds are associated with high concentrations of sea spray aerosol (Kaufman 2005).
Anthropogenic activities, particularly biomass burning and controlled combustion of fossil fuels
such as diesel, are the major source of black carbon in the atmosphere (Ni et al. 2014). Black
carbon is produced by incomplete combustion of fuels. These emissions typically consist of
partially oxidised organics including alkanes, aromatics (Zhang et al. 2011) and poly-aromatic
hydrocarbons (Cheruyiot et al. 2015). Radiative forcing due to black carbon is estimated at +0.4 W
m-2 (Boucher et al. 2013). As a result of its colour, black carbon is a significant absorber of
radiation and modelling work has indicated that when precipitated from the atmosphere it has a
substantial effect on surface conditions, for instance being associated with ice melt in the
Himalayas (Menon et al. 2010). It is also an important source of ice nuclei (DeMott et al. 1999;
Levin et al. 2016).
Anthropogenic activity, such as coal burning, and volcanism are the main sources of sulphate
aerosol in the atmosphere. Radiative forcing due to sulphate aerosol has been estimated to be -
0.4 W m-2 (Boucher et al. 2013). This material is formed by the reaction of sulphur dioxide with
water to form sulfuric acid which may then go on to react with any bases present in the

13
environment such as ammonium to form a sulphate salt.
Radiative forcing due to nitrate aerosol has been estimated at -0.11 W m-2 (Boucher et al. 2013).
These are formed in the atmosphere. NOx is emitted from combustion sites and lightning and can
be oxidised by OH● radicals to form nitric acid which in turn can react with any base materials
present to form salts, most commonly ammonium nitrate which is much more volatile than
ammonium sulphate (Seinfeld & Pandis 2006), and the equilibrium between the aerosol and
gaseous phase can be further shifted to the gaseous phase by the presence of sulphate (Kajino et
al. 2008).
Radiative forcing due to mineral dust has been estimated at -0.1 W m-2 (Boucher et al. 2013).
Mineral dusts are generated as primary particles by the wind. Mineral dusts are another
important source of ice nuclei in the atmosphere (Demott et al. 2015; Koehler et al. 2010).
Radiative forcing due to primary and secondary organic aerosol has been estimated at -0.12 W m-2
(Boucher et al. 2013). Organic components are ubiquitous in atmospheric aerosols (Jimenez et al.
2009) and have been variously found to account for 38–70 % of total sub-micron aerosol mass
(Jimenez et al. 2009; McFiggans et al. 2005). Primary organic aerosol (POA) are emitted as
particles from their source whereas secondary organic aerosol (SOA) are produced in situ in the
atmosphere by the condensation of organic compounds from the gas phase and have been
estimated to comprise 70 % of the organic aerosol mass in the atmosphere with a global sources
estimated at around 115 Tg yr-1 (Hallquist et al. 2009). Primary organic aerosols make a smaller
total contribution to aerosol mass which has been estimated as 55 Tg yr-1 (Trivitayanurak &
Adams 2014). Primary organic aerosol particles generally appear in the accumulation mode
(Hildemann et al. 1991) i.e. the mode that tends to dominate the surface area in the atmosphere
making POA particles ideal sites for the condensation of SOA, creating difficulties in separating
POA and SOA in atmospheric conditions. SOA precursors come from both biogenic and
anthropogenic sources with biogenic material dominating (Cahill et al. 2006). These materials
mostly originate from plants, with components including acetone, methanol, cis-3-hexan-1ol and
terpenes (isoprene, monoterpenes such as α-pinene and limonene, and sesquiterpenes such as β-
caryophyllene) (Hewitt et al. 2011) which are known to produce SOA via ozonolysis and OH●
reactions (Salo et al. 2011; Tritscher et al. 2011). Anthropogenic sources of SOA precursor
material are also significant sources of SOA with estimates of around 10 % of total SOA originating
from urban and industrial sources though this figure is highly uncertain (Spracklen et al. 2011). It
has also been suggested that the presence of anthropogenic material may encourage biogenic

14
aerosol formation (Hoyle et al. 2011).
The oxidation of organic material in the atmosphere, which in general reduces the volatility of
organic material and thereby encourages the formation of aerosol particles, is highly complex
with thousands of compounds generated from any given precursor material. Under daylight
conditions, oxidation of organic material in the atmosphere is dominated by OH● radicals which
are the primary oxidiser in the atmosphere (Lelieveld et al. 2016). OH● is produced by the
photodissociation of ozone by light of wavelengths shorter than 324 nm and by recycling via
radical reaction chains (e.g. the formation of peroxy radicals which reproduce OH●). Recent
modelling work has found that recycling of OH● is the dominant process in the free troposphere
(Lelieveld et al. 2016). An important set of reactions, with respect to the ageing of organic
material in the atmosphere, involve sulphur dioxide which reacts with water to form sulfuric acid
which can react with organic material following dissociation. Organosulfates have been found in
organic aerosol both in situ and in laboratory studies (Hallquist et al. 2009) and are thought to be
produced by the reaction of acidic sulphate, ozone, and terpenes. SO3- for instance, can open CO
bonds by nucleophilic attack; these processes are still poorly understood in terms of their kinetics
and the yields produced (Herrmann et al. 2015). Another significant radical in the atmosphere is
NO3● which is important under night time conditions but not in the daytime as its lifetime is too
short under daylight conditions to allow chemical interactions. At night it provides an important
path for the production of organonitrates which account for approximately 10 % of the organic
material in urban environments (Day et al. 2010). The other major path for the production of
organonitrates is via reactions with NO in daylight chemistry. NO and NO2 are found in highest
concentrations in the atmosphere near anthropogenic sources with fossil fuel combustion the
dominant source (Seinfeld & Pandis 2006), so areas downwind from pollution sites tend to have
the highest concentrations of organonitrates. Further oxidation of organic material occurs in the
aerosol phase (Herrmann et al. 2015) and it has been suggested that SOA particle matter may
even form by oxidation of volatile material in the aqueous phase (Ervens et al. 2011). Aqueous
phase formation of SOA is thought to be a significant source of low volatility SOA (which are
important in the formation of SOA particles), which are more water soluble than those formed in
the gas phase and hence are important for the solute effect with acids, alcohols and glyoxal-like
compounds acting as precursors (Ervens et al. 2011).
SOA particles are known to act as cloud condensation nuclei, however measuring their CCN
activity has proved to be challenging. In addition to their highly complex chemical composition,
SOA particles can exist in an amorphous solid state depending upon their composition and

15
relative humidity which can affect their ability to accommodate water (Virtanen et al. 2010; E.
Saukko et al. 2012; E Saukko et al. 2012). Furthermore, the approaches used to measure their
hygroscopicity have shown inconsistency. When SOA samples are measured with HTDMA and
CCNc the resulting values of κ have proved difficult to reconcile and although progress has been
made in this area, further work is required to get agreement between these methods, particularly
at low supersaturations (Whitehead et al. 2014).
1.3.6 Summary
Aerosols have an impact upon the Earth’s radiative budget via the direct, semi-direct and indirect
effects (Bauer & Menon 2012). These depend on the ambient conditions, the position of the
aerosol within the atmosphere and their properties such as CCN activation ability, size, and ability
to absorb and scatter radiation as a function of wavelength. Secondary organic aerosols pose
particular challenges as their compositions are complex, their phase varies depending upon the
ambient conditions and their hygroscopic properties are not well understood with questions
remaining concerning their ability to activate as droplets at low supersaturations (Whitehead et
al. 2014). Modelling work has suggested that co-condensation of secondary organic aerosol will
have a substantial effect on their ability to act as CCN (Topping et al. 2013) however, evidence for
this is still required either from laboratory or in situ conditions. This thesis will attempt to address
these gaps in knowledge by conducting cloud evacuations of secondary organic aerosol under
chamber conditions and comparing them to modelled results in order to look for evidence of
increased CCN activity as expected by co-condensation and in order that these results might be
compared to other work investigating the ability of secondary organic aerosol to act as CCN.
1.4 Attributing Credit
In the paper presented in Chapter 2, the first author was responsible for planning and leading the
experiments, data analysis of MICC data, conducting the modelling runs and analysing the results,
writing the paper and creating the figures. The contribution of Angela Buchholz was to assist in
the experiments by operating the CCN counter, development of software for data analysis of CCN
counter and DMPS data and conducting the analysis. Paul Connolly was responsible for the
development of ACPIM and developed some of the in-house software to extract data from the

16
MICC instrumentation. Gordon McFiggans assisted in editing the paper and acted in a lead
supervisory role for the project.

17
2.
Title: A chamber and modelling investigation of the potential impacts of semi-volatile material
on cloud droplets
Prepared for publication in Atmospheric Chemistry and Physics Discussions but not submitted.
Page 17

1
A chamber and modelling investigation of the potential
impacts of semi-volatile material on cloud droplets William Hesson1, Angela Buchholz1a, Paul Connolly1, Gordon McFiggans1 1School of Earth and Environmental Sciences, University of Manchester, Manchester, M13 9PL, UK acurrently at: Department of Applied Physics, University of Eastern Finland, Kuopio Campus, P.O. Box 5 1627, 70211, Kuopio, Finland
Correspondence to: William Hesson ([email protected])
Abstract. Under appropriate conditions, droplets form on a subset of atmospheric particles that act as cloud
condensation nuclei (CCN). From previous measurements in the ambient atmosphere, it is difficult to
unambiguously establish the degree to which the activation of CCN into droplets is quantitatively 10
understood. A cloud chamber environment provides greater control over the aerosol sample used and the
conditions it experiences, providing the opportunity to better constrain CCN activation. For the first time,
liquid cloud activation using chamber-derived secondary organic aerosol (SOA) produced in individual
experiments from 1,3,5-trimethylbenzene, limonene, β-caryophyllene or α-pinene as well as a separate
experiment using nebulised ammonium sulfate, have been compared to results from Monte Carlo cloud 15
parcel model simulations across expected parametric uncertainties. The formation and evolution of cloud
droplets during a pseudo-adiabatic evacuation of a cloud chamber was modeled using the Aerosol Cloud
Precipitation Interaction Model (ACPIM) using each set of generated parameters. Cloud formation in the
model and chamber are consistent within anticipated variability for ammonium sulfate aerosol, which have
no semi-volatile material, and are thought to be well understood and represented in ACPIM. However, the 20
model under-predicts the number concentration of cloud droplets generated in an evacuation for certain SOA,
most notably in the -caryophyllene system. The under-prediction is most marked in the first chamber
evacuation of the experiment when the concentration of semi-volatile organic vapor may be expected to be
highest. Semi-volatile material is thought to aid the formation of droplets by condensing onto CCN alongside
water (co-condensation) and thus making the particle larger and reducing the supersaturation required for a 25
droplet to form. The Monte Carlo simulation did not include treatment of semi-volatile material and it is
suggested that this observation is an indication of co-condensation of water and semi-volatile organic
material. Further simulations using ACPIM demonstrated that plausible concentrations of semi-volatile
material were able to bring the measured and modeled droplet number concentrations into agreement and that
this was not plausible by varying the hygroscopicity parameter κ. In the limonene experiment the model 30
over-predicts droplet concentration. This is thought to result from an overestimation of the hygroscopicity of
the CCN input into the model.
1 Introduction
Cloud and aerosol effects remain the single largest uncertainty in Earth’s radiative budget (Boucher et al.,
2013; McFiggans et al., 2006). The radiative forcing caused by clouds is dependent upon the size distribution 35
and number concentration of droplets as they have been shown to be a determining factor in cloud lifetime,
cloud depth, cloud liquid water content and cloud reflectivity which in turn determine the amount of energy
absorbed and reflected by clouds and thus affect the Earth’s radiative budget (Albrecht, 1989; Lohmann and

2
Feichter, 2005; Stevens and Feingold, 2009; Twomey, 1977). Changing the Earth’s radiative budget warms
or cools the Earth’s surface and hence alters the climate; understanding droplet formation is, therefore, a 40
crucial part of understanding the global climate.
In the atmosphere, water droplets form on cloud condensation nuclei (CCN): particles suspended in the
atmosphere capable of activating as water droplets under suitably supersaturated conditions with respect to
water. At atmospherically relevant temperatures, the saturation ratios required for homogeneous nucleation of
water droplets (i.e. without a CCN) are several hundred percent; these conditions do not occur in the 45
atmosphere (Rogers and Yau, 1989) and therefore can be ignored. It is, therefore, necessary to have a good
understanding of the characteristics of all significant cloud condensation nuclei in order to understand droplet
formation.
An aerosol particle will form a water drop if it passes its critical size in a supersaturated environment with
respect to water. The Köhler equation(Köhler, 1936), represented by Eq. (1), describes the equilibrium size of 50
particles in the atmosphere by combining Raoult’s Law and the Kelvin Equation for a droplet.
Supersaturation, 𝑆, is defined as the vapor pressure of water, 𝑒, divided by the saturation vapor pressure, 𝑒𝑠.
This is equal to the water activity, 𝑎𝑤, which is the term dealing with the effects of a solute according to
Raoult’s law, multiplied by the Kelvin term shown where 𝜎𝑤 is the air/water surface tension, 𝑀𝑤 is the
molecular weight of water, 𝑅 is the universal gas constant, 𝑇 is temperature, 𝜌𝑤 is the density of water and 55
𝐷𝑝 is the particle’s diameter.
𝑆 =𝑒
𝑒𝑠= 𝑎𝑤 exp (
4𝜎𝑤𝑀𝑤
𝑅𝑇𝜌𝑤𝐷𝑝) (1)
There is no general analytical solution to the Köhler equation.
The Raoult’s law term, the first of the two terms of the right-hand side of Eq. (1), i.e. the water activity, 𝑎𝑤,
is associated with the reduction in equilibrium vapor pressure over a droplet resulting from the presence of a 60
solute. This effect is proportional to the mixing ratio of the solute in the drop (Rogers and Yau, 1989;
Seinfeld and Pandis, 2006). The Kelvin term, the second term on the right hand side of Eq. (1), i.e. the
exponential term, is associated with the air/water surface tension of the droplet. This is proportional to the
exponent of the inverse of diameter of the droplet; as a droplet shrinks, the curvature of the droplet’s surface
increases so that each molecule of water on the surface experiences a smaller attractive force from its 65
neighbouring water molecules as they are averagely fewer in number, meaning that the energy barrier for a
water molecule to leave the surface of the droplet becomes smaller with decreasing droplet size (Rogers and
Yau, 1989; Seinfeld and Pandis, 2006).
A widely used parameterization for water activity is the κ parameterization where water activity is defined as
shown in Eq. (2): 70
1
𝑎𝑤= 1 + κ
𝑉𝑠
𝑉𝑤 , (2)
where 𝑉𝑠 is the volume of the dry solute and 𝑉𝑤 is the volume of water in the particle (Petters and
Kreidenweis, 2007). A higher value of κ indicates greater hygroscopicity and therefore activation at a smaller
critical size and lower critical supersaturation.
Experimental studies conducted to investigate the hygroscopicity of aerosol particles with respect to the 75
activation of CCN into droplets have concentrated either on measuring their water uptake onto particles at
subsaturated conditions with respect to water using Hygroscopicity Tandem Differential Mobility Analysers

3
(HTDMAs) (Switlicki et al., 2008) or at supersaturated conditions using CCN counters (Nenes et al., 2001;
Roberts and Nenes, 2005) although single particle electrodynamic balance methods are also employed(Davis
et al., 1990; Pope, 2010; Pope et al., 2010). The HTDMA provides data to measure κ for a given aerosol 80
sample by probing the shape of the Köhler curve at subsaturated conditions while data on the maximum of
the Köhler curve is provided by the CCN counter also providing a value for κ through measurements of
activated fraction of particles of known size. However, studies employing both methods have found
significant disagreement between HTDMA-derived and CCN counter-derived κ values, particularly at low
supersaturations in the CCN counter. Although sometimes agreement is found, questions concerning the 85
processes used in CCN measurements place a limit on our understanding of CCN activity (Whitehead et al.,
2014).
Causes of the discrepancy between CCN counter and HTDMA measurements broadly fall into three
categories: problems with the instrumentation, problems with modeling the activation, and unaccounted-for
properties of aerosol particles. Instrumentation problems include: underestimation of particle concentration 90
with the DMPS (Differential Mobility Particle Sizer) prior to measurement with a CCN counter leading to
underestimates of CCN concentration, size selection limitations of DMPSs, and concerns over whether or
not particles reach equilibrium with respect to water between DMAs in an HTDMA (Fors et al., 2011).
Attempts to create models based on Köhler theory have struggled to find agreement with HTDMA data; an
analysis of 5 different modeling methods found that discrepancies of 15% and 6–10% were typical for critical 95
supersaturation and difference in CCN concentrations respectively (Rissler et al., 2010). Finally, there is the
possibility that the properties of the aerosol particles themselves could be the cause of the discrepancy. It has
been suggested that humic-like substances may have surface effects, reducing the surface tension term of the
Köhler equation and thus increasing droplet activation; alternatively, they may inhibit droplet activation by
acting like a surface film, slowing water diffusion and therefore particle growth (Graber and Rudich, 2005). 100
However, studies exploring the possibility of this effect have either found no improvement in agreement
(Jurányi et al., 2010) or that implausible changes to surface tension would be required (Good et al., 2010a).
The degree to which aerosol are internally mixed and the consistency of their size and variability with time
may also be important in making atmospheric CCN behavior predictable (Jurányi et al., 2010). It has been
suggested that another cause of the discrepancy between CCN counter and HTDMA measurements may be 105
semi-volatile material, such as those associated with secondary organic aerosols (SOAs), facilitating
increased apparent hygroscopicity and droplet production via co-condensation (Topping et al., 2013). It is
clear that more work is required in this area to improve our understanding of the cause of the discrepancies
between CCN counter and HTDMA data in order to accurately quantify CCN behavior in clouds (Whitehead
et al., 2014). 110
In various studies, a gap has been found to exist between the CCN counter measurements and the predicted
number of CCN to be activated based upon the conditions to which the aerosol sample was exposed in the
CCN counter. Calculating supersaturation based on the temperature profiles measured, CCN data is 50–
80% of the anticipated value (McFiggans et al., 2006). Usually, this difference between the measured and
predicted concentrations is within the margin of error, but that margin of error is very large when considering 115
applying the values derived to a global model where a difference of 10% in CCN data is very significant
(McFiggans et al., 2006). Studies conducted in locations with a significant organic component to the aerosol

4
have shown particularly poor agreement (Dusek et al., 2003; McFiggans et al., 2006; Roberts et al., 2002)
suggesting that organics may play a role in this discrepancy. It has been suggested that humic-like organic
substances may delay the formation of droplets (Bigg, 1986; Graber and Rudich, 2005). Kinetic effects may 120
also play a role in this discrepancy. The time profile of the supersaturation produced in a CCN counter differs
from clouds as in clouds there is competition for water vapor due to the growth of particles which is not
necessarily matched by increased water availability from quasi-adiabatic evacuation whereas in a CCN
counter supersaturation is held constant throughout a measurement. The residence time inside an instrument
can bias the results; ammonium nitrate has been shown to evaporate with a long residence time in a HTDMA 125
(Gysel et al., 2007) reducing the Raoult term and therefore leading to lower than anticipated growth factors,
while delays in activation potentially caused by slower water uptake as a result of less hydrophilic surface
layers may cause a bias if the residence time is too short for the particle to equilibrate (Bigg, 1986; Graber
and Rudich, 2005). Another issue is that atmospheric measurements with a CCN counter require there to be
no meaningful mixing with other air masses or loss of water through precipitative scavenging, making 130
unbiased measurements of cloud droplet concentration difficult to obtain (McFiggans et al., 2006).
One approach to studying the activation of aerosol particles into droplets has been inverse modeling to find
parameter values which minimise the discrepancy between modeled and simulated atmospheric data from a
range of environments (Partridge et al., 2011, 2012) however this falls short of using real atmospheric data
(Partridge et al., 2012) and hence it is difficult to suggest that it can be truly representative of in situ droplet 135
activation in the presence of semi-volatile material. Several studies have attempted to compare experimental
results to modeling data in order to predict behavior with varying degrees of detailed microphysical
calculations (Fountoukis and Nenes, 2005; Fountoukis et al., 2007; Hsieh et al., 2009; Lance et al., 2009;
Nenes and Seinfeld, 2003). A significant approach is based upon the work of Nenes & Seinfeld (Fountoukis
and Nenes, 2005; Fountoukis et al., 2007; Nenes and Seinfeld, 2003). Nenes & Seinfeld’s approach (Nenes 140
and Seinfeld, 2003) involves using the aerosol size distribution for each aerosol chemical composition
considered to calculate a “CCN spectrum” i.e. the number of aerosol particles which will be activated based
on the maximum supersaturation achieved for a given updraft velocity or cooling rate. The aerosol
population is then split between particles which experience more or less growth between the time they reach
critical saturation and the maximum supersaturation the droplet experiences than their diameter at their point 145
of critical saturation. This allows treatment of the particles appropriate to their growth around activation and
identifies particles which have critical diameters closest to the critical size for which kinetic effects may be
important in determining activation. This approach was later extended in order to use lognormal aerosol size
distributions (Fountoukis and Nenes, 2005), inclusion of a size dependent mass transfer coefficient
(Fountoukis and Nenes, 2005) and modifications of this to correct for the presence of large CCN (Barahona 150
et al., 2010; Morales Betancourt and Nenes, 2014) as well as constraining the parameterization by comparing
the output to data from in situ cloud studies (Fountoukis et al., 2007; Hsieh et al., 2009). Accurately
describing the effect of organic material on CCN activation and sensitivity issues relating to particles from
different size modes remain challenging for such parameterizations and a lack of comparison to cloud data
from a controlled laboratory environment may have introduced confounding factors into comparisons with 155
atmospheric data.

5
Discrepancies remain between CCN counter measurements and theoretical predictions and between HTDMA
and CCN counter data. Neither the data from CCN counter and HTDMA studies nor the theoretical work
conducted on CCN activation provides a comprehensive understanding of droplet activation, particularly in
the presence of semi-volatile material therefore there is a real gap in our understanding of the CCN activity. 160
In situ studies of droplet activation are difficult to conduct as activation is difficult to monitor: in cloud CCN
have activated into droplets, outside cloud they are aerosol. One possibility to study the formation of droplets
is to artificially generate aerosol and in particular aerosol with semi-volatile material like SOA and conduct
experiments that simulate cloud formation. There is little information from controlled cloud evacuation
experiments looking at the CCN activity of SOAs. Such conditions provide the opportunity to test whether 165
co-condensation could be observed on CCN. In this study we present the first cloud chamber evacuations on
chamber-generated SOA and compare the experimental data to model results, not including a co-
condensation treatment, but varied across all parametric and experimental uncertainties, to test the degree of
agreement between experimental and modeled data and to look for evidence of co-condensation in a chamber
environment. The parameters varied in this investigation were the number concentration of aerosol particles, 170
Np, the size distribution width parameter, σ, the modal size, Dm, initial temperature, Ti, and the hygroscopicity
parameter, κ. Under-prediction of CCN activation by the model could be indicative of co-condensation as
this process is not being modeled. We then use a representation of semi-volatile co-condensation within the
model to demonstrate that it is able to explain the observed droplet formation in the chamber.
This study aims to test our understanding of CCN activation of SOA and whether co-condensation is required 175
for chamber evacuations on SOA samples and model data to be consistent or whether agreement can be
found by only considering the variability of parameters from experimental data. Experimental data from SOA
evacuations i.e. activation data from the MICC on various SOA samples and additionally on a well
understood aerosol system (ammonium sulfate) will be compared to the results of Monte Carlo simulations of
each evacuation using the chamber version of ACPIM (Aerosol Cloud Precipitation Interaction Model) 180
without the inclusion of semi-volatile material. It is then anticipated that any discrepancy between the results
of the Monte Carlo simulation and the number concentration data from the chamber evacuations will be due
to the presence of semi-volatile materials. The inclusion of the ammonium sulfate system allows comparison
between SOA systems and a system where semi-volatiles are not relevant. Additionally, a series of tests
using the model and including semi-volatiles will be conducted varying the volatility distribution and total 185
concentration of the semi-volatile organic material to determine their effect upon droplet activation. A further
series of tests using the model will be shown in which the value of the hygroscopicity parameter κ (Petters
and Kreidenweis, 2007) will be varied outside the range of the Monte Carlo simulation in order to determine
whether changing the hygroscopicity of the particles can explain any discrepancy between the Monte Carlo
simulation results and the number concentration data from the chamber evacuations. 190
2 Methods
Material from the photo-oxidation of precursors of secondary organic aerosol were created in the Manchester
Aerosol Chamber (MAC) facility or the MAC was used as a holding container for nebulised ammonium
sulfate aerosol. Their properties including size, number concentration, hygroscopicity and chemical
composition were measured, the instrumentation employed is shown in Table 1. These particles were 195

6
transferred from the MAC to the Manchester Ice Cloud Chamber (MICC). Cloud formation was induced in a
series of quasi-adiabatic evacuations at an initial temperature of ~286 K from approximately atmospheric
pressure to approximately 700 mbars. Following each evacuation, the MICC was refilled to approximately
atmospheric pressure using clean air meaning that each evacuation took place at successively lower
concentrations of aerosol particles and semi-volatile material. A schematic diagram of the combined MAC 200
and MICC facility is shown in Fig. 1.
2.1 Aerosol chamber and instrumentation
2.1.1 The aerosol chamber and its operation
The Manchester Aerosol Chamber has a maximum volume of 18m3, consisting of two Teflon sheets at the
top and bottom and two Teflon tubes, these are sealed between three aluminum sections effectively creating a 205
Teflon bag. The central section of the bag’s frame remains stationary and is the location for ports into and out
of the chamber for the purposes of cleaning, introduction of gases to set experimental conditions (e.g. salt
aerosol, Volatile Organic Compounds, ozone, water vapor and NOx), sampling aerosol from the chamber by
instruments and transferring aerosol to the Manchester Ice Cloud Chamber (MICC).
The Teflon bag can be inflated and deflated using a 3-phase blower (See Sect. S1.1.1 for further 210
information). Volatile Organic Compounds (VOCs) are added to the Teflon bag as precursors to the
formation of SOA; in these experiments -pinene, -caryophyllene, 1,3,5 trimethylbenzene and limonene
were used, each in a separate experiment (for more details see Sect. S1.1.2). NO2 is introduced into the
chamber from a compressed gas cylinder (see Sect. S1.1.3). Ozone was also required for the photo-oxidation
experiments and was introduced to the chamber from the ozonizer (see Sect. S1.1.4). For the ammonium 215
sulfate experiment, seed aerosol particles were nebulised into the chamber (see Sect. S1.1.5).
The aerosol chamber has seven rows of 16 halogen bulbs and a 6kW Xenon arc lamp. Photochemical
nucleation and growth experiments generally use three rows of 16 halogen lamps and the arc lamp to
approximate to tropospheric illumination. As it has been found to be infeasible to produce SOA in the MAC
using 1,3,5-trimethylbenzene as a precursor under the usual UV conditions used, the UV filter for the arc 220
lamp was removed for this experiment. This substantially increases the intensity of UV radiation of shorter
wavelengths than ~350 nm above the tropospheric approximation used in the other experiments. In all the
photochemical oxidation experiments, as the aging period was relatively brief (between 1.5 and 2.5 hours –
see Table 2) and the method of production was nucleation with high mixing ratios of precursor material, the
concentration of particles produced was often much higher than required for cloud chamber evacuations, 225
necessitating dilution of the aerosol prior to transferring it so that the number concentration of aerosol
particles in the MICC for the first cloud chamber evacuation was less than 12000/cc. After production and
aging of aerosol in MAC and preparation of the MICC (see Sect. 2.2.1) the aerosol sample was transferred to
the MICC (see Sect. 2.4).
Ongoing sampling with the instrumentation employed in the SOA experiments provides size distribution and 230
concentration information (see Table 1).
A series of inflation and deflation cycles of the chamber bag following experiments were used to remove
aerosol material followed by leaving the bag with a mixing ratio of 1-2 ppm of ozone overnight. At least five
cycles of inflating and deflating the MAC’s Teflon bag were used to remove impurities. 1,3,5-

7
trimethylbenzene is known to have low reactivity to ozone and so extra cleaning was completed by exposing 235
the bag to the unfiltered arc lamp source with mixing ratios of 150-400 ppm of ozone for 30-60 minutes
following backgrounds and experiments involving 1,3,5-trimethylbenzene.
Further details of general MAC operation and the facility can be found in the supplementary material,
another publication (Alfarra et al., 2012) and references therein.
2.1.2 Aerosol chamber instrumentation 240
A variety of instrumentation is employed during the generation of aerosol particles in the chamber to monitor
the conditions in the chamber bag and the aerosol mass being produced (see Table 1). Properties monitored
include humidity, temperature, ozone mixing ratio, NOx mixing ratio, aerosol particle concentration, size,
composition, and ability to act as CCN.
Humidity and temperature in the chamber bag were monitored by an EdgeTech DewMaster dew point 245
hygrometer with the sensor measuring near the chamber wall and an in-house Sensirion sensor measuring
conditions in the center of the chamber. Ozone mixing ratio was monitored by sampling with an ozone
analyzer while NOx, NO, and NO2 concentrations were monitored by an NOx analyzer, these two instruments
shared a sample line, the inlet of this line was positioned in the center of the chamber.
A TSI 3776 butanol CPC, located in the laboratory directly above the chamber, was also used to monitor 250
aerosol particle concentration in the aerosol chamber. CPCs work by exposing the aerosol sample they are
measuring to supersaturated conditions with respect to either butanol or water in order to grow any particles
present, these particles are then counted using an optical scattering method.
A DMPS (sizing particles between approximately 30–450 nm) was used to measure the number and size
distribution of the particles during the growth and aging of the SOA particles in MAC and to monitor the 255
number concentration and size distribution of ammonium sulfate particles in MAC. The DMPS sizes
particles using a DMA (Differential Mobility Analyser) which sizes according to electrical mobility size by
ionizing the particles being sampled and exposing them to a potential difference between two cylindrical
plates to accelerate the charged particles towards the central cylinder. A small exit slit in the central cylinder
allows size-selected particles to be extracted. The size of these particles depends upon the potential difference 260
applied across the two cylinders. The particles can then be counted using a CPC, in this case, a 3786 TSI
Water CPC was employed. In the Differential Mobility Particle Size, the potential difference is changed in
discrete steps providing sizing information across a range of sizes at a time resolution of ~10 minutes.
A Vienna style DMA (Williams et al., 2007; Winklmayr et al., 1991) was used to size particles which were
then measured by Condensation Particle Counter (CPC) which creates a large supersaturation meant to 265
activate all particles into drops to be counted – combining with the DMA to act as a DMPS and a continuous
flow Cloud Condensation Nuclei Counter (CCNc) (Good et al., 2010b; Lance et al., 2006; Roberts and
Nenes, 2005) which exposes aerosol to a controlled supersaturation to measure their activity as cloud
condensation nuclei (CCN). This experimental setup and calibration procedure have been described in the
literature (Good et al., 2010a) and further information on the calibration can be found in the supplementary 270
material (see Sect. S1.2.1) The DMA operated in the size range of approximately 20–450 nm with a scan
time of approximately 7.5 minutes run at 10 minute intervals. After the differential mobility analyzer (similar
to the DMA used in the DMPS described above), the flow was diluted and split between a butanol CPC and

8
either one or two CCN counters depending upon the experiment. The flow was diluted after the DMA and the
experimental set up was such that dilution was held constant in all experiments. After the DMPS scan was 275
completed, the supersaturation in the CCN counter was set to a new value. The 2.5 minute interval between
DMPS scans enabled the CCN counter to stabilize at its new supersaturation. By comparing the number of
particles above 2 microns after being exposed to supersaturated conditions detected by the CCN counter to
the total count provided by the CPC running parallel to it, the activated fraction of aerosol for that size and
supersaturation is obtained. 280
The raw data from both counters was inverted to correct for charging efficiency and multiple charged
particles. This yielded size spectra of all particles (from the CPC) and those of particles activated under a
controlled supersaturation (from the CCNc). The ratio of these spectra is the activated fraction as a function
of the dry particle size which was fitted to a sigmoidal function. The turning point (i.e. the point at which
there is 50% activation) provides the activation size (D50) and the set supersaturation is the critical 285
supersaturation (SScrit). The fitting error for the turning point of the sigmoidal function was used as the
uncertainty of the D50 value. A look-up table was created to determine the hygroscopicity parameter κ using
Eq. 6 from Petters and Kreidenweis work (Petters and Kreidenweis, 2007) for each SScrit and D50 pair. In the
same way, the minimum and maximum values for κ, κmin, and κmax were derived from the corresponding
SScrit/D50max and SScrit/D50min pairs respectively. This was used as uncertainty in κ as a direct propagation of 290
uncertainties is not possible.
An Aerodyne High Resolution Aerosol Mass Spectrometer (AMS) (Canagaratna et al., 2007; Decarlo et al.,
2006) was employed in these experiments in order to gain information regarding the chemical composition of
the SOA material. The fraction of material with m/z = 44 (indicative of the CO2+ ion) is known to be a proxy
for the degree of oxygenation of material in organic aerosol particles thus AMS data can be used as a proxy 295
to measure the degree of oxygenation of the secondary organic material which is thought to increase their
hygroscopicity and therefore their CCN activity (Jimenez et al., 2009). Data was analyzed using the in-house
software as found in previous studies (Alfarra et al., 2012).
2.2 Cloud chamber and instrumentation
2.2.1 Cloud chamber and basic instrumentation 300
The Manchester Ice Cloud Chamber (MICC) is a 10m tall, approximately cylindrical stainless steel chamber
with a diameter of 1m. Ports are positioned throughout the chamber allowing access for measurements to be
made. The ports at the base of the chamber were used for the pressure, cloud and aerosol probes in these
experiments (see Fig. 1). Two Varian rotary vacuum pumps positioned at the top of the MICC allow the
pressure in the chamber to be reduced by removing material from the chamber; this can be refilled with clean 305
air using the MAC blower system (see Sect. 2.2.2).
Pressure is measured using an LEX-1 piezoresistive manometer located at one of the lower ports of the
chamber. Temperature is monitored using eight K-type thermocouples located at different points along the
height of the chamber, a temperature gradient across the chamber of ~1.5 K (coldest at the bottom, warmest
at the top) is generally observed making it necessary to measure temperature throughout the chamber’s height 310
in order to establish conditions throughout the chamber. Both pressure and temperature measurements were
recorded throughout each experimental evacuation and refill (see Sect. 2.2.2–2.2.4).

9
A CR4 Dew Point Hygrometer was used to measure the relative humidity of the chamber. However, as this
instrument is sensitive to pressure changes it was only employed between evacuations when the chamber was
at approximately atmospheric pressure. Further details can be found in the supplementary material (see Sect. 315
S1.2.2).
2.2.2 Cloud chamber preparation
The MICC was prepared for cloud evacuations by sealing all the ports and reducing the pressure of the
chamber to 200 mbars using Varian rotary vacuum pumps before refilling it to atmospheric pressure with
clean air from the MAC’s blower system via the connecting stainless steel tube approximately 20m in length 320
which leads from the inflation/deflation line in the MAC system to a port near the top of the cloud chamber.
This process was repeated three times, each time diluting the initial concentration of particles in the chamber
and thus reducing the background particle count which was recorded after the MICC was refilled using a
CPC (see Sect. 2.2.5 and Table 3).
2.2.3 Transfer of aerosol from the aerosol chamber to the cloud chamber 325
Once the aerosol sample had been generated in the MAC and the MICC had been prepared, the MICC
underwent a further evacuation to 200 mbars with measurements taken by the WELAS (see Sect. 2.2.6 and
Table 3) between atmospheric pressure and 700 mbars at which point the WELAS was isolated from the
chamber (this was taken as a background measurement). Once the pressure reached 200 mbars, the pumps
were isolated from the chamber then the valves in the MAC chamber were configured so as to expose the 330
MAC to the MICC and a part of the aerosol mass inside the MAC was drawn through the connecting
stainless steel tube into the MICC until the MAC had shrunk sufficiently for the MICC to have returned to
atmospheric pressure.
2.2.4 Cloud generation in MICC
In these experiments, partial activation of the aerosol particles into cloud droplets was required in order to 335
gain information regarding their CCN activation properties; as such it was necessary to have some control
over the rate of reduction in pressure during evacuations. This was achieved using either one or two Varian
rotary vacuum pumps and through the use of critical orifices of varying diameter (4 mm, 5.7 mm and 7 mm)
installed in the line between the chamber and the vacuum pump. During fitting and removal of these critical
orifices, the blower system was used to create a small overpressure inside the MICC to prevent 340
contamination of the aerosol sample with lab air.
Upon reaching atmospheric pressure, measurements were taken with the chilled mirror hygrometer, CPC, and
SMPS (see Sect. 2.2.5 and Table 3) to measure the MICC’s dew point and the number and size of the aerosol
particles. Once the pump orifices had been set, the MAC and MICC were isolated from one another and the
aerosol sample in MICC underwent a quasi-adiabatic pressure and the growth of droplets into a cloud was 345
observed with the WELAS (see Sect. 2.2.6 and Table 3) to approximately 700 mbars and then refilled to
atmospheric pressure with clean air from the MAC lab blower system. In the case of the ammonium sulfate
experiment, air was drawn from the MAC instead of the blower system, allowing control of the total

10
concentration of ammonium sulfate aerosol. MICC’s temperature and pressure were measured throughout
these experiments using the probes mentioned in Sect. 2.2.1. 350
2.2.5 Aerosol particles size and number
The number concentration and size distribution of particles in the MICC were measured at atmospheric
pressure using a TSI 3010 condensation particle counter (CPC), similar in mode of operation to the butanol
CPC used in the MAC (see Sect. 2.1.2). The size distribution was measured with a TSI Scanning Mobility
Particle Sizer (SMPS). This employs a DMA in a similar way to that used for a DMPS (see Sect. 2.1.2), 355
however, in an SMPS the voltage is not held constant to measure a single size before undergoing a step
change to measure the next size, instead the voltage is continuously varied during a scan from the smallest to
the largest size. This improves the time resolution of the data, requiring approximately 3 minutes to complete
a scan. In general, two scans were completed between each cloud evacuation. The CPC and SMPS used can
only operate near atmospheric pressure so measurements of aerosol size and number were only made after 360
the MICC had been refilled and thus was at approximately atmospheric pressure. To further facilitate this, the
blower system’s clean air supply remained on during these measurements to ensure that sampling from the
MICC did not reduce the pressure.
Concentration data measured using the CPC was taken to be representative of the concentration of aerosol
particles throughout the chamber. SMPS measurements underwent diffusion and multi-charge corrections 365
using the Aerosol Instrument Management, TSI software and were used to measure total concentration and
size distribution.
2.2.6 Cloud droplets size and number
The WELAS (WhitE Light Aerosol Spectrometer) measures the size distribution and number concentration
of droplets present. Details on the WELAS can be found in the literature (see Table 3). The WELAS uses a 370
forward scattering white light technique to measure particles with diameters between 0.8 and 84 µm; its
precision is determined by Poisson counting statistics that depend upon the concentration being measured.
2.2.7 Sampling and measurement strategy and techniques
The WELAS sampled for 1 second followed by a 5 second gap in measurements. This was due to the
limitations of the software being used to record the WELAS data. The WELAS recorded throughout each 375
experimental evacuation as did the pressure and temperature probes. As SMPS, CPC and the hygrometer
were pressure sensitive, they were only used at approximately atmospheric pressure, i.e. when the chamber
had been refilled following an evacuation either from the MAC’s Teflon bag (in the case of the initial
transfer) or its blower system (in the case of subsequent evacuations).
2.3 Model 380
The Aerosol Cloud Precipitation Interaction Model, ACPIM, (Connolly, 2009; Connolly et al., 2012;
Dearden, 2009; Dearden et al., 2011; Topping et al., 2013) was employed to create simulations of the
conditions in the cloud chamber. These can then be compared to the results from the cloud chamber to test

11
whether or not the model and therefore our theoretical understanding of cloud formation on SOA agrees with
chamber data. 385
2.3.1 Model structure
ACPIM can model the formation, growth and dissipation of cloud from aerosol by solving a series of coupled
ordinary differential equations solving for conservation of water vapor mass, conservation of mass of semi-
volatile organic material (when the presence of semi-volatile organic material was being modeled), the
hydrostatic equation, conservation of energy in the air parcel, change of mass in each size bin, and rate of 390
change of parcel “height” (Topping et al., 2013) – in the case of a chamber study this physically refers to the
effective updraft velocity caused by the reduction in pressure during an evacuation. These equations are
solved for each time step with outputs every 10 seconds enabling a description of the cloud’s life to be
created.
In cases where semi-volatile organic material was modeled, as the size of the particles is of a similar 395
magnitude to the mean free path of the organics, diffusivity was treated in accordance with transition regime
condensation theory.
2.3.2 Model methods, configuration, and inputs
ACPIM was run using a full moving bin method with 60 size sections. This is the least numerically diffusive
but is unable to simulate collision-coalescence effects, though these are negligible in the MICC. In model 400
simulations considering organic material, 10 volatility bins were used. SMPS data was fitted to a lognormal
distribution. This enabled calculations of parameters pertaining to the distribution i.e. the distribution width
parameter, total concentration and modal size for use in ACPIM to be obtained. These were assigned random
values within the variability limits of the measurement. κ was likewise varied within the variability limits
(see Table 1) of the value obtained from CCNc data except for experiments where the aerosol particles were 405
ammonium sulfate which has a well-known value for κ. Initial temperature was varied between a maximum
of the warmest temperature recorded by any of the temperature probes at the time of the beginning of the
evacuation plus 1σ of the temperature probe measurement to a minimum of the coldest temperature recorded
by any of the temperature probes at the time of the beginning of the evacuation minus 1σ of the temperature
probe measurement of the range of temperatures measured at the start of the evacuation by the MICC’s eight 410
temperature sensors plus one error bar in the temperature probe measurement in both the cooler and warmer
end of the variability range. The pressure profile used in the model was fitted to the temperature profile of the
chamber experiment fitted to an exponential decay curve. The measured value was used for the initial
pressure; as the range is very small, this was not thought to have any impact upon the cloud. Initial RH was
calculated based on the assumption that it passes 100 % during the time interval at which the WELAS begins 415
to observe droplets and that water vapor is conserved until this point. In this case, RH is a function of
temperature and hence the initial RH can be calculated from the initial temperature and the temperature at the
point of first droplet activation. The range of variables used for the Monte Carlo simulation is shown in Table
4.

12
2.3.3 Model simulations 420
Base case simulations were generated by conducting model runs using the midpoints of the range of values
for all the parameters being varied (i.e. simulations using the expectation value for each parameter) for each
experimental evacuation. A Monte Carlo simulation of each experimental evacuation was conducted. For
each experimental evacuation 5000 model runs were conducted across the parameter space (see Table 4).
Further tests were conducted based on the results from the Monte Carlo simulation: a series of tests were 425
conducted varying the value of the κ parameter outside the expected variability limits and a series of model
simulations with the inclusion of semi-volatile components were conducted. In order to explore the potential
impact of the co-condensation of semi-volatile material on activating droplets, it is necessary to define the
volatility distribution of components. The distribution of oxidation products of the precursors injected into
MAC at the point of transfer to MICC is highly uncertain. A coupled model of photochemical oxidation and 430
microphysics of the SOA formation including treatment of the partitioning to the Teflon walls would be
necessary to determine the mixing ratios of all partitioning species. The uncertainties in such processes are
too large to make a prediction of the volatility distribution transferred to MICC. Instead, an uncertainty
analysis has been conducted, initially using a volatility distribution shape following that determined in the
field measurements in Mexico City of Cappa & Jimenez (Cappa and Jimenez, 2010) but including four other 435
distributions. For each distribution shape the total concentration of semi-volatile material was varied between
1.885×10⁻¹⁰ and 1.885×10⁻⁷ g m-3; altering the total concentration found in Cappa & Jimenez’s work by
orders of magnitude. The molecular weight used as an estimate in all model simulations for SOA was 132.14
g mol-1; leading to a concentration of between 0.03424 pptv and 34.24 pptv. These simulations were then
repeated using different volatility bin distributions to test the sensitivity of droplet activation to volatility. 440
2.4 Data analysis
Particles measured by the WELAS were assumed to have been activated as CCN. Over the period used as a
measurement of activation, the WELAS distributions are closed distributions, measuring 0 counts in the
lowest size bins. Droplet number concentration data obtained using the WELAS was corrected for
temperature and pressure to conditions at standard ambient temperature and pressure. Activation measured 445
was determined by finding the initial peak in the data set, this is taken as the point before the first reduction
in the concentration after the onset of cloud during an evacuation, and the nine subsequent points; meaning
that the average is based on sampling 10 times for 1 second over a period of 1 minute. Simulated number
concentrations from ACPIM were very stable after cloud activation until dissipation, suggesting that it should
be possible to average droplet number concentration without having a substantial impact on the ratio of 450
chamber number concentration to model number concentration obtained. The modeled maximum droplet
number concentration was taken as the peak concentration from the model (based on data with a 10 second
time resolution). As number concentration was very stable in the model this reflects the droplet number
concentration through much of the lifetime of the cloud.
Ratios of number concentration obtained from the WELAS, corrected to standard ambient temperature and 455
pressure, to model outputs for the base case simulations (see Table 4) and the range of model outputs from
Monte Carlo simulation were calculated. Ratios were also calculated between corrected WELAS data and the
model simulations conducted using the base case but with additional variation in the κ parameter in order to

13
consider the sensitivity of the number concentration to κ and the change in κ required to get agreement
between the corrected WELAS number concentration data and the total droplet concentration from the model 460
simulation. Likewise, model simulations were conducted using the base case values with a semi-volatile
component included to investigate the quantity of semi-volatile material necessary to get agreement between
the corrected WELAS number concentration data and number concentration from modeled data. This was
calculated as a ratio.
3 Results 465
3.1 MAC data
Secondary organic aerosol, including particles, were produced by photo-oxidation in the MAC from α-
pinene, β-caryophyllene, limonene and 1,3,5-trimethylbenzene and ammonium sulfate particles were
nebulised into the MAC. Hygroscopicity of the CCN is treated in the model using the single parameter κ
(Petters and Kreidenweis, 2007). Data on the hygroscopicity of the SOA particles was collected using the 470
CCN counter. Figure 2 shows the size diameter and the κ value calculated from this, at which half of the
particles activated. The values used in the ACPIM simulations for the hygroscopicity variable κ were taken
as an interpolation between the data point before and the data point after the start of the transfer of aerosol
between the chambers.
3.2 MICC data 475
The material generated was successfully transferred to the MICC. After transfer, evacuations were conducted
on the aerosol sample, an example is shown in Fig. 3. Data was collected regarding the temperature, pressure
and droplet number concentration throughout the evacuation. The total number concentration shown in Fig.
3(c) is from measurements made by the WELAS corrected for temperature and pressure to standard ambient
temperature and pressure. This data has been compared to model outputs in order to test our understanding of 480
cloud activation on SOA (see Fig. 7–10). Two evacuations were conducted on the 07/11/2013 α-pinene
precursor SOA after which the experiment was curtailed by contamination of the sample. Three evacuations
were conducted on the limonene precursor SOA and 14/11/2013 α-pinene precursor SOA. Four evacuations
were conducted on the 1,3,5-trimethylbenzene precursor SOA and β-caryophyllene precursor SOA. Six
evacuations were conducted on the ammonium sulfate sample, however, in three of these evacuations, the 485
first, third and fourth, the WELAS recording failed and so these results are not presented here.
3.3 Model inputs
In addition to requiring information regarding the hygroscopicity of aerosol particles (as described in Sect.
3.1), it is necessary to describe the temperature, pressure and aerosol population’s size distribution and
number concentration inside the chamber. An SMPS was employed in the MICC in providing data on the 490
size distribution of the aerosol particles as shown in Fig. 4. Temperature and pressure data were recorded
during each cloud evacuation (e.g. see Fig. 3), fits to the temperature are shown in Fig. 5 and were used to fit
the pressure data. A full table of the model inputs is shown in the methods section (see Table 4) and a
comparison of κ value ranges (the single parameter used as a measure of hygroscopicity and therefore the key

14
activation parameter) used in this study with values found in the literature can be found in the supplementary 495
material (see Table S1).
The SMPS distributions shown (Fig. 4) differ between cloud evacuations using the same SOA sample; a
reduction in the concentration of aerosol particles is observed as the initial sample is diluted by the air from
the MAC filtration system (e.g. the 1,3,5-trimethylbenzene sample – see Fig. 4 (i)–(l)). No significant
differences are observed in the size distribution between cloud evacuations on the same sample, implying that 500
material which partitions to the aerosol phase during expansions, both water and organic matter, evaporates.
Differences in size distribution can also be observed between the different samples. The ammonium sulfate
sample (Fig. 4 (f)–(h)) was prepared by nebulising aerosol particles into the MAC, this resulted in a broader,
less smooth aerosol size distribution than for the SOA particles which were generated by photochemical
nucleation. In the example of a photonucleation experiment, in addition to loss of particles by coagulation 505
and wall loss, the particles generated grow continuously as precursor compounds are oxidised into less
volatile ones with the amount of material condensing related to the volume of the existing particles, in the
case of nebulised material however the smoothing effect of condensing material is absent which leads to a
more uneven distribution as shown in Fig. 4(f) which shows the distribution after 1 cloud expansion has been
performed on the ammonium sulfate sample. Fig. (g)-(h) show the ammonium sulfate sample after 4 and 5 510
evacuations have been performed on the sample including one to 200 mbar in order to reduce the
concentration of the sample. These measurements show a less well-defined distribution of material. One
contributing factor to this is likely to be the reduction in concentration (approximately 1 order of magnitude)
between 4(f) and 4(g)-(h). At lower concentrations, the total number of aerosol particles sampled is reduced
and so sampling errors are increased. Other differences in the sample may be due to cloud processing and 515
further coagulation of particles (4(g) and 4(h) were recorded more than 2 hours after 4(f)). The total
concentration of aerosol particles present and their size varied considerably between samples. Preliminary
attempts to photonucleate particles using 1,3,5-trimethylbenzene precursor were unsuccessful under the usual
conditions of illumination employed in the MAC so the UV filter for the arc lamp was removed in order to
expose the precursor material to greater amounts of short wavelength UV in order to generate aerosol 520
particles. Nevertheless, this sample produced less material in the aerosol phase. The modal size of particles
generated was smaller in the 1,3,5-trimethylbenzene experiment (~75 nm) than in other photonucleation
experiments except for the β-caryophyllene experiment (which produced a higher concentration of particles)
and the number concentration generated in the MAC was also lower than that observed in other experiments.
The α-pinene experiment on 14/11/13 (Fig. 4 (i)–(l)) has a much larger modal size than observed in the other 525
photonucleation experiments. In this experiment, the number of particles produced in the nucleation event
was much lower than observed in the α-pinene experiment on 07/11/13 (Fig. 4 (a)–(b)). The reason for this
remains unclear.
Ensuring good agreement between the temperature profile observed during cloud expansions and those
modeled is necessary in order to accurately calculate the RH and hence the activation in the MICC. In all 530
cases, a good match was achieved between the measured average temperature in the MICC and the
temperature in the model (see Fig. 5). It should be noted that this fit is to the average temperature in the
MICC. A temperature gradient was present across the MICC with the top of the chamber approximately 1.5
K warmer than the bottom. In all cases, experimental data is only shown for the period over which the

15
evacuation took place. The pressure fits shown in Fig. 5 are based on a quasi-adiabatic expansion as 535
calculated in the model. The good quality fit achieved indicates that temperature and pressure inputs into the
model are a good match for the chamber experiment.
3.4 Comparing model and experimental data
Data from the chamber experiments was compared to a variety of model simulations. The base case model
simulation (i.e. model simulation using the expectation value for all variables) for each evacuation, shown 540
alongside the total concentration from the WELAS (Fig. 6), was compared to an averaged period of 60
seconds of number concentration data from the WELAS starting from the peak concentration (Fig. 7) as
discussed in Sect. 2.6. Results from a Monte Carlo simulation using random values in the intervals indicated
for the variables being altered (see Table 4) were also compared to the average WELAS number
concentration (Fig. 8). In an effort to explore the changes required to get agreement between model and 545
experimental data, the effect of altering the value of κ (Fig. 9) and of the inclusion of semi-volatiles (Fig. 10)
to the base case scenario were investigated.
The droplet number concentrations calculated by the model were steady after the onset of cloud up until the
cloud started to evaporate whereas the WELAS measurements from the MICC indicate that after an initial
peak, the droplet concentration decreases throughout the cloud’s lifetime suggesting that loss of water vapor 550
to the MICC’s walls is not well captured by ACPIM. Due to the large amount of variability between data
points obtained by the WELAS (see Fig. 6), an average was taken of 10 measurements starting from the
initial peak concentration (i.e. the measurement directly before the first reduction in droplet number
concentration was observed in the WELAS). These averages were taken as the peak concentration observed
by the WELAS and were used in the ratios of WELAS and model data (see Fig. 7–10). 555
The ratios between the WELAS peak number concentration and the peak number concentrations from the
base case ACPIM results (see Fig. 7) are always in agreement with and broadly near the center of the range
of ratios from the Monte Carlo simulation (see Fig. 8). The results from the Monte Carlo simulation show
agreement between the model and the WELAS (assuming ±10 % variability in the peak WELAS
concentration) for all experiments except in the cases of the first evacuation with the α-pinene (7/11/13) and 560
all three β-caryophyllene evacuations where the model under-predicts the droplet concentration and the
second limonene evacuation where the model over-predicts the droplet concentration. The four expansions
where the model under-predicts the droplet number concentration also show the greatest underestimation by
the model when using the base case simulations but varying κ (see Fig. 9) up to 250 % of κ’s value calculated
from measurements using the CCN counter and not reaching agreement between model and WELAS results 565
at any value of κ in some cases. The limonene experiment shows the greatest overestimation by the model in
the case of the κ varying simulations with a κ of approximately 55 % the original value required for
agreement in the most extreme case.
Results from simulations using varying quantities of semi-volatile organic material proportioned into
volatility bins according to the findings of Cappa and Jimenez (Cappa and Jimenez, 2010) show a large range 570
of WELAS/Model droplet number concentration ratios encompassing agreement between model and
WELAS for the evacuations where the model under-predicts the number concentration in the base case and
Monte Carlo simulations (see Fig. 10). But simulations using the range of volatility bin distributions (see Fig.

16
11) produce very similar results (see supplementary material – Fig. S1–S4). The evacuations using the two
different α-pinene experiments, show very different responses to the addition of semi-volatile material: both 575
evacuations conducted with the α-pinene sample from 07/11/13 show substantial changes in number
concentration with the addition of semi-volatile material, however, the difference is much smaller for the
evacuations conducted with the α-pinene from 14/11/13 (see Fig. 10).
4 Discussion
As the WELAS measures aerosol particles, this raises the concern of whether or not the particles measured 580
by the WELAS are in fact activated droplets or merely swollen aerosol. However, for aerosol particles of the
sizes being considered here, the lower bound of the size detection limit for the WELAS is thought to be
above the critical size for the particles and hence they can be considered droplets. The distribution of material
in the WELAS is a closed distribution indicating that we are well capturing the activated droplet mode.
No substantial differences were observed between the volatility bin distributions used in this study (see Fig. 585
10 and Fig. S1–S4) with the number concentrations obtained from the model almost solely dependent upon
the total semi-volatile concentration rather than the volatility bin denoted by differing values of log10C* from
-6 to 3 (i.e. a ratio of vapor: aerosol under dry conditions of between 1:100000 and 1000:1). This suggests
that as relative humidity is increased, the amount of semi-volatile material in the condensed phase also
increases such that by the time the aerosol particle enters a supersaturated regime with respect to water, the 590
semi-volatile material, whatever its initial volatility, is dominated by the condensed phase meaning that the
increase in size of the distribution of aerosol particles is dependent upon the amount of semi-volatile material
and not its degree of semi-volatility. From this it can be surmised that the exact volatility distribution is not
critical to determining activation and therefore the use of the Cappa and Jimenez (Cappa and Jimenez, 2010)
distribution is a sufficient approximation for the purposes of this study. In itself insensitivity to volatility 595
distribution is an important finding supporting the work of Topping et al. (Topping et al., 2013) which
modeled the growth of aerosol particles as material condensed onto them, the proportion of semi-volatile
material in the condensed aerosol phase increases with increasing RH and decreases as volatility, expressed
as logC*, increases. Even for material modeled as logC*=3 (i.e. the most volatile material included), the
condensed phase dominates the partition between the aerosol and gas phases at RH=99.999 %. As in these 600
experiments droplets are activated, the RH must exceed 100 % inside the chamber. The droplets are therefore
subjected to higher relative humidity than in this previous work where the condensed phase dominated, it is
reasonable to expect therefore that the partition between the condensed aerosol and vapor phase would be
dominated by the condensed aerosol phase in all evacuations.
In most cases, the range of values for the ratio between number concentration in MICC measured by the 605
WELAS and the modeled data is in agreement (see Fig. 8). The ammonium sulfate system has been
extensively studied, the value of κ for ammonium sulfate is well known and it is not anticipated that there
would be any semi-volatile material present in this sample. The evacuations completed with the ammonium
sulfate aerosol sample show consistency in number concentration between WELAS data, with an estimated
uncertainty of ±10 %, and model data, indicating that the model is capturing non-semi-volatile behavior well. 610
It should be noted that ammonium sulfate particles, unlike the other aerosol particles used in these
experiments were not photo-nucleated but nebulised. One effect of this is that the size distribution was much

17
less similar to a lognormal distribution than the photo-nucleated populations. This means that the fits to the
ammonium sulfate experiment were not as close as in other experiments and therefore were less well treated
by the model. This may have introduced an extra degree of error in the result from the model for each 615
evacuation with this sample. However, this is not required to explain the observations.
The largest discrepancy between the model and chamber data is the first evacuation of the β-caryophyllene
experiment where the model under-predicts the droplet number concentration observed by the WELAS in the
chamber. In the subsequent evacuations with this aerosol sample, the range of the chamber/ model number
concentrations draws closer to agreement (Fig. 10) but in no evacuation are the results from the β-620
caryophyllene MICC experiment consistent with the model results. This discrepancy between experimental
evacuations and model results could be explained by the presence of semi-volatile material. As the
concentration of semi-volatile material will be highest in the first evacuation, because it has not been diluted
by evacuations and refills and the least amount of semi-volatile material has been lost to the chamber walls,
the impact of the semi-volatile material will be greatest in the first evacuation and reduced in each 625
subsequent evacuation. Semi-volatile material is not included in the Monte Carlo simulation so the
discrepancy between the Monte Carlo simulation and the WELAS data in the β-caryophyllene experiment is
explicable as an effect of the presence of semi-volatiles. Figure 10 shows base case simulations with the
inclusion of varying amounts of semi-volatile material for various volatility distributions (as shown in Fig.
11). In the β-caryophyllene experiment, consistency between the model and WELAS number concentration 630
data is achieved with between 1.885×10⁻⁸ g m-3 and 1.885×10⁻⁹ g m-3 for the first evacuation and 1.885×10⁻⁹ g
m-3 and 1.885×10⁻¹⁰ g m-3 for the subsequent two evacuations.
Another possible explanation for the discrepancy observed in the β-caryophyllene experiment was that the
values assigned to κ for the Monte Carlo simulation were incorrect as measurements of κ have been shown to
differ between instruments and our understanding of the formation of droplets in clouds is incomplete 635
(Whitehead et al., 2014). A set of base case simulations but using different values for κ were compared to
the concentrations measured by the WELAS (Fig. 9). However, these show that a substantial difference in the
value of κ would be required (560%, 400% and 270% of the measurement value for the first, second and
third β-caryophyllene evacuation respectively) in order to achieve the change in activation required for the
model to match the WELAS data, assuming an error of 10 % in WELAS number concentration. 640
The model and WELAS droplet concentration ratios from evacuations conducted on the sample from the 7 th
November on the α-pinene sample appear to show a similar pattern to the β-caryophyllene experiment
although only for the first cloud evacuation is the range of ratios between the WELAS measured chamber
number concentration and the model number concentrations from the Monte Carlo simulation is inconsistent.
This effect again could be explained by the presence of semi-volatile material. The α-pinene experiment on 645
the 14th November exhibits different behavior with the range of chamber data/model suggesting a consistency
(Fig. 7 and 8). The difference between these two values is thought to be due to the difference in modal
diameter of the aerosol particles (~90 nm on the 7th November and ~140 nm on the 13th of November). At
larger sizes, it is thought that co-condensation would have a smaller impact on droplet activation as fewer
particles will cross the critical size threshold for activation when the semi-volatile organic material 650
condenses: both because more particles will already be past the critical size threshold and because the size
difference induced by the condensation of a similar quantity of semi-volatile material will have a smaller

18
effect on the radius of the aerosol particles as volume is proportional the cube of the radius. The idea of a
reduced semi-volatile effect at larger sizes is supported by the base case simulations with the addition of
varying quantities of semi-volatile material (Fig. 10) where it is clear that the increase in the number of 655
particles activated due to the presence of semi-volatile material is much smaller for the α-pinene experiment
on the 14th than on the 7th. This size dependency can also be observed in the 1,3,5-trimethylbenzene
experiment where semi-volatile material has little impact on activation and the range of values from the
Monte Carlo simulation are broadly consistent with the WELAS data from the MICC.
In the limonene experiment, activation in the chamber evacuations is lower than in the model (Fig. 7 and 8). 660
An explanation for this finding could be that there is a systematic overestimation of κ from the CCN counter
measurements as a result of the reduced particle concentration following the DMA sizing stage meaning that
more semi-volatile material and fewer particles are present in the CCN counter leading to an instrument
artefact whereby the particles being measured have artificially increased sizes when entering the CCN
counter and hence are nearer their critical size and therefore more easily activated into droplets. In the case of 665
the limonene experiment, this explanation would require a significant change to the value of κ (to between 55
% and 90 % of the original value assuming a WELAS number concentration uncertainty of 10 %, see Fig. 9)
but a much smaller difference than that required to explain the observations made in the β-caryophyllene
experiment (560 % in the case of the first β-caryophyllene evacuation). This systematic over-estimation of κ
could be occurring in all SOA experiments in this study in which case co-condensation may be balancing this 670
effect in some experiments (e.g. 1,3,5-trimethylbenzene). Another possibility is that it may be the case that
limonene-derived semi-volatiles are less hydrophilic than expected because this material is volatilized when
the chamber is refilled.
In the 1,3,5-trimethylbenzene experiment, we see that there is agreement in all cases between the range of
number concentrations Monte Carlo simulation which does not include semi-volatile material. The 675
competing factors which can be used to explain the number concentration discrepancies observed in the
limonene and β-caryophyllene may also be occurring in evacuations conducted with the 1,3,5-
trimethylbenzene sample in such a way that the results show agreement.
The strength of the conclusions from this study could have been enhanced by the use of additional cloud
droplet measuring instrumentation, the WELAS primarily being intended for the measurement of aerosol. It 680
had been intended that a Cloud Droplet Probe, DMT (Crosier et al., 2011; Rosenfeld et al., 2008) should have
been included in this study, however, as a result of a mass flow control configuration problem during these
experiments, CDP concentrations are thought to be potentially quantitatively erroneous for all experiments so
only WELAS data has been used. The inclusion of this or other droplet measuring instrumentation should be
pursued in future chamber activation on SOA. Additionally, ACPIM should have been run in a manner which 685
produces size data rather than showing the bin sizes from these experiments and providing an activated
droplet number as this would further confirm that the WELAS and model were measuring the activated
droplets.
5. Conclusion
Transfers of SOA (derived from α-pinene, β-caryophyllene, limonene and 1,3,5-trimethylbenzene) and 690
ammonium sulfate photo-oxidised and nebulised into the MAC respectively, to the MICC were conducted

19
and a series of evacuations to generate clouds were conducted on each sample. These cloud evacuations were
modeled using ACPIM. A Monte Carlo simulation of each evacuation was conducted and additional
simulations using the expectation values for each of the variables, simulations using the expectation values of
the variables but varying the hygroscopicity parameter κ outside the expected range and simulations using the 695
expectation values for the variables but introducing semi-volatile material with various distributions and
varying the total concentration of semi-volatile material between 1.885×10⁻⁷ g m-3 and 1.885×10⁻¹⁰ g m-3
(equating to between 34.24 pptv and 0.0342 pptv). The ammonium sulfate evacuation chamber number
concentration data and number concentrations from the Monte Carlo simulation were consistent. In the
evacuations using β-caryophyllene derived SOA showed the Monte Carlo simulation under-predicted the 700
droplet number concentration measured in the chamber. The first evacuation on the sample had the greatest
under-prediction which reduced with each subsequent evacuation. Varying the value of κ was only able to
render the chamber droplet concentration measurements and model droplet concentrations consistent by
changing the value of κ by a factor of 2.7 to 5.6. This is thought to be unrealistic. However, concentrations of
semi-volatile material between 1.885×10⁻⁸ g m-3 and 1.885×10⁻¹⁰ g m-3 were able to produce agreement, 705
suggesting that co-condensation of semi-volatile material is being observed. A similar pattern to the β-
caryophyllene experiment, but less pronounced, was observed in the α-pinene experiment conducted on
07/11/13. This is not observed in the α-pinene experiment conducted on 14/11/13. The difference between
these is thought to be due to the insensitivity of the droplet activation of large aerosol particles to the
presence of semi-volatile material. The Monte Carlo simulation overestimates the total number concentration 710
for the limonene experiment, this is thought to be due to problems in measuring κ and requires smaller
changes to the value of κ in order for the model and chamber measured number concentrations to achieve
agreement. This work indicates that co-condensation is occurring under controlled chamber conditions, the
first time such an observation has been made and demonstrating the potential importance of co-condensation
to understanding and modeling cloud activation. 715
Author contribution
William Hesson was responsible for planning and leading the experiments completed, data analysis of MICC
data, conducting the modeling runs and analyzing the results, completing the manuscript and creating the
figures. The contribution of Angela Buchholz was to assist in the experiments by operating the CCN counter,
development of software for data analysis of CCN counter and DMPS data and conducting the analysis. Paul 720
Connolly was responsible for the development of ACPIM and developed some of the in-house software to
extract data from the MICC instrumentation. Gordon McFiggans assisted in editing the paper and acted in a
lead supervisory role for the project.
Competing interests 725
The authors declare that they have no conflict of interest.

20
Acknowledgements
This research was funded by NERC as part of the ACID-PRUF project.
References
Albrecht, B. A.: Aerosols, Cloud Microphysics and Fractional Cloudiness, Science (80-. )., 245(4923), 1227–730
1230, 1989.
Alfarra, M. R., Hamilton, J. F., Wyche, K. P., Good, N., Ward, M. W., Carr, T., Barley, M. H., Monks, P. S.,
Jenkin, M. E., Lewis, a. C. and McFiggans, G. B.: The effect of photochemical ageing and initial precursor
concentration on the composition and hygroscopic properties of β-caryophyllene secondary organic aerosol,
Atmos. Chem. Phys., 12(14), 6417–6436, doi:10.5194/acp-12-6417-2012, 2012. 735
Alofs, D. J., Lutrus, C. K., Hagen, D. E., Sem, G. J. and Blesener, J. L.: Intercomparison Between
Commercial Condensation Nucleus Counters and an Alternating Temperature Gradient Cloud Chamber,
Aerosol Sci. Technol., 23(2), 239–249, doi:10.1080/02786829508965307, 1995.
Barahona, D., West, R. E. L., Stier, P., Romakkaniemi, S., Kokkola, H. and Nenes, A.: Comprehensively
accounting for the effect of giant CCN in cloud activation parameterizations, Atmos. Chem. Phys., 10(5), 740
2467–2473, doi:10.5194/acp-10-2467-2010, 2010.
Benz, S., Megahed, K., Möhler, O., Saathoff, H., Wagner, R. and Schurath, U.: T-dependent rate
measurements of homogeneous ice nucleation in cloud droplets using a large atmospheric simulation
chamber, J. Photochem. Photobiol. A Chem., 176(1-3), 208–217, doi:10.1016/j.jphotochem.2005.08.026,
2005. 745
Bigg, E. K.: Discrepancy between observation and prediction of concentrations of cloud condensation nuclei,
Atmos. Res., 20(1), 81–86, doi:10.1016/0169-8095(86)90010-4, 1986.
Boucher, O., Randall, D., Artaxo, P., Bretherton, C., Feingold, G., Forster, P., Kerminen, V.-M., Kondo, Y.,
Liao, H., Lohmann, U., Rasch, P., Satheesh, S. K., Sherwood, S., Stevens, B. and Zhang, X. Y.: 2013: Clouds
and Aerosols. In: Climate Change 2013: The Physical Science Basis. Contribution of Working Group I to the 750
Fifth Assessment Report of the Intergovernmental Panel on Climate Change, 2013.
Canagaratna, M. R., Jayne, J. T., Jimenez, J. L., Allan, J. D., Alfarra, M. R., Zhang, Q., Onasch, T. B.,
Drewnick, F., Coe, H., Middlebrook, A., Delia, A., Williams, L. R., Trimborn, A. M., Northway, M. J.,
Decarlo, P. F., Kolb, C. E., Davidovits, P. and Worsnop, D. R.: CHEMICAL AND MICROPHYSICAL
CHARACTERIZATION OF AMBIENT AEROSOLS WITH THE AERODYNE AEROSOL MASS 755
SPECTROMETER, , 185–222, doi:10.1002/mas, 2007.
Cappa, C. D. and Jimenez, J. L.: Quantitative estimates of the volatility of ambient organic aerosol, Atmos.
Chem. Phys., 10(12), 5409–5424, doi:10.5194/acp-10-5409-2010, 2010.
Connolly, P. J.: Studies of heterogeneous freezing by three different desert dust samples, Atmos. Chem.
Phys., 9(9), 2805–2824, 2009. 760
Connolly, P. J., Emersic, C. and Field, P. R.: A laboratory investigation into the aggregation efficiency of
small ice crystals, Atmos. Chem. Phys., 2055–2076, doi:10.5194/acp-12-2055-2012, 2012.
Crosier, J., Bower, K. N., Choularton, T. W., Westbrook, C. D., Connolly, P. J., Cui, Z. Q., Crawford, I. P.,
Capes, G. L., Coe, H., Dorsey, J. R., Williams, P. I., Illingworth, a. J., Gallagher, M. W. and Blyth, a. M.:

21
Observations of ice multiplication in a weakly convective cell embedded in supercooled mid-level stratus, 765
Atmos. Chem. Phys., 11(1), 257–273, doi:10.5194/acp-11-257-2011, 2011.
Davis, E. J., Buehler, M. F. and Ward, T. L.: The double-ring electrodynamic balance for microparticle
characterization, Rev. Sci. Instrum., 61(4), 1281–1288, doi:10.1063/1.1141227, 1990.
Dearden, C.: Investigating the simulation of cloud microphysical processes in numerical models using a one-
dimensional dynamical framework, Atmos. Sci. Lett., 10(3), 207–214, doi:10.1002/asl.239, 2009. 770
Dearden, C., Connolly, P. J., Choularton, T. W. and Field, P. R.: Evaluating the effects of microphysical
complexity in idealised simulations of trade wind cumulus using the Factorial Method, Atmos. Chem. Phys.,
11(6), 2729–2746, doi:10.5194/acp-11-2729-2011, 2011.
Decarlo, P. F., Kimmel, J. R., Trimborn, A., Northway, M. J., Jayne, J. T., Aiken, A. C., Gonin, M., Fuhrer,
K., Horvath, T., Docherty, K. S., Worsnop, D. R. and Jimenez, J. L.: Field-Deployable, High-Resolution, 775
Time-of-Flight Aerosol Mass Spectrometer, Anal. Chem., 78(24), 8281–8289,
doi:8410.1029/2001JD001213.Analytical, 2006.
Dusek, U., Covert, D. S., Wiedensohler, A., Neusüss, C., Weise, D. and Cantrell, W.: Cloud condensation
nuclei spectra derived from size distributions and hygroscopic properties of the aerosol in coastal south-west
Portugal during ACE-2, Tellus, Ser. B Chem. Phys. Meteorol., 55(1), 35–53, doi:10.1034/j.1600-780
0889.2003.00041.x, 2003.
Fors, E. O., Swietlicki, E., Svenningsson, B., Kristensson, a., Frank, G. P. and Sporre, M.: Hygroscopic
properties of the ambient aerosol in southern Sweden-a two year study, Atmos. Chem. Phys., 11(16), 8343–
8361, doi:10.5194/acp-11-8343-2011, 2011.
Fountoukis, C. and Nenes, A.: Continued development of a cloud droplet formation parameterization for 785
global climate models, J. Geophys. Res. D Atmos., 110(11), 1–10, doi:10.1029/2004JD005591, 2005.
Fountoukis, C., Nenes, A., Meskhidze, N., Bahreini, R., Conant, W. C., Jonsson, H., Murphy, S., Sorooshian,
A., Varutbangkul, V., Brechtel, F., Flagan, R. C. and Seinfeld, J. H.: Aerosol-cloud drop concentration
closure for clouds sampled during the International Consortium for Atmospheric Research on Transport and
Transformation 2004 campaign, J. Geophys. Res. Atmos., 112(10), doi:10.1029/2006JD007272, 2007. 790
Good, N., Topping, D. O., Allan, J. D., Flynn, M., Fuentes, E., Irwin, M., Williams, P. I. and Coe, H.:
Consistency between parameterizations of aerosol hygroscopicity and CCN activity during the RHaMBLe
discovery cruise, Atmos. Chem. Phys., 10, 3189–3203, 2010a.
Good, N., Topping, D. O., Duplissy, J., Gysel, M., Meyer, N. K., Metzger, a., Turner, S. F., Baltensperger,
U., Ristovski, Z., Weingartner, E., Coe, H. and McFiggans, G.: Widening the gap between measurement and 795
modeling of secondary organic aerosol properties?, Atmos. Chem. Phys., 10, 2577–2593, doi:10.5194/acp-
10-2577-2010, 2010b.
Graber, E. R. and Rudich, Y.: Atmospheric HULIS: how humic-like are they? A comprehensive and critical
review, Atmos. Chem. Phys. Discuss., 5(5), 9801–9860, doi:10.5194/acpd-5-9801-2005, 2005.
Gysel, M., Crosier, J., Topping, D. O., Whitehead, J. D., Bower, K. N., Cubison, M. J., Williams, P. I., 800
Flynn, M. J., McFiggans, G. B. and Coe, H.: Closure study between chemical composition and hygroscopic
growth of aerosol particles during TORCH2, Atmos. Chem. Phys., 7(24), 6131–6144, doi:10.5194/acp-7-
6131-2007, 2007.
Hsieh, W. C., Nenes, A., Flagan, R. C., Seinfeld, J. H., Buzorius, G. and Jonsson, H.: Parameterization of

22
cloud droplet size distributions: Comparison with parcel models and observations, J. Geophys. Res. Atmos., 805
114(11), 1–11, doi:10.1029/2008JD011387, 2009.
Jimenez, J. L., Canagaratna, M. R., Donahue, N. M., Prevot, a S. H., Zhang, Q., Kroll, J. H., DeCarlo, P. F.,
Allan, J. D., Coe, H., Ng, N. L., Aiken, a C., Docherty, K. S., Ulbrich, I. M., Grieshop, a P., Robinson, a L.,
Duplissy, J., Smith, J. D., Wilson, K. R., Lanz, V. a, Hueglin, C., Sun, Y. L., Tian, J., Laaksonen, a,
Raatikainen, T., Rautiainen, J., Vaattovaara, P., Ehn, M., Kulmala, M., Tomlinson, J. M., Collins, D. R., 810
Cubison, M. J., Dunlea, E. J., Huffman, J. a, Onasch, T. B., Alfarra, M. R., Williams, P. I., Bower, K.,
Kondo, Y., Schneider, J., Drewnick, F., Borrmann, S., Weimer, S., Demerjian, K., Salcedo, D., Cottrell, L.,
Griffin, R., Takami, a, Miyoshi, T., Hatakeyama, S., Shimono, a, Sun, J. Y., Zhang, Y. M., Dzepina, K.,
Kimmel, J. R., Sueper, D., Jayne, J. T., Herndon, S. C., Trimborn, a M., Williams, L. R., Wood, E. C.,
Middlebrook, a M., Kolb, C. E., Baltensperger, U. and Worsnop, D. R.: Evolution of organic aerosols in the 815
atmosphere., Science, 326(5959), 1525–9, doi:10.1126/science.1180353, 2009.
Jurányi, Z., Gysel, M., Weingartner, E., DeCarlo, P. F., Kammermann, L. and Baltensperger, U.: Measured
and modeled cloud condensation nuclei number concentration at the high alpine site Jungfraujoch, Atmos.
Chem. Phys., 10(16), 7891–7906, doi:10.5194/acp-10-7891-2010, 2010.
Köhler, H.: THE NUCLEUS IN AND THE GROWTH OF HYDROSCOPIC DROPLETS, Faraday Discuss., 820
(1152), 1152–1161, 1936.
Lance, S., Nenes, a., Medina, J. and Smith, J. N.: Mapping the Operation of the DMT Continuous Flow
CCN Counter, Aerosol Sci. Technol., 40(4), 242–254, doi:10.1080/02786820500543290, 2006.
Lance, S., Nenes, A., Mazzoleni, C., Dubey, M. K., Gates, H., Varutbangkul, V., Rissman, T. a., Murphy, S.
M., Sorooshian, A., Flagan, R. C., Seinfeld, J. H., Feingold, G. and Jonsson, H. H.: Cloud condensation 825
nuclei activity, closure, and droplet growth kinetics of Houston aerosol during the Gulf of Mexico
Atmospheric Composition and Climate Study (GoMACCS), J. Geophys. Res., 114, 1–21,
doi:10.1029/2008JD011699, 2009.
Liu, P. S. K. and Deshler, T.: Causes of Concentration Differences Between a Scanning Mobility Particle
Sizer and a Condensation Particle Counter, Aerosol Sci. Technol., 37(11), 916–923, 830
doi:10.1080/02786820300931, 2003.
Lohmann, U. and Feichter, J.: Global indirect aerosol effects: a review, Atmos. Chem. Phys., 5(3), 715–737,
doi:10.5194/acpd-4-7561-2004, 2005.
McFiggans, G., Artaxo, P., Baltensperger, U., Coe, H., Facchini, M. C., Feingold, G., Fuzzi, S., Gysel, M.,
Fisica, D., Paulo, U. D. S., Matao, R., Travessa, R. and Paulo, C. E. P. S.: The effect of physical and 835
chemical aerosol properties on warm cloud droplet activation, Atmos. Chem. Phys., 6(6), 2593–2649, 2006.
Möhler, O., Benz, S., Saathoff, H., Schnaiter, M., Wagner, R., Schneider, J., Walter, S., Ebert, V. and
Wagner, S.: The effect of organic coating on the heterogeneous ice nucleation efficiency of mineral dust
aerosols, Environ. Res. Lett., 3(2), 025007, doi:10.1088/1748-9326/3/2/025007, 2008.
Morales Betancourt, R. and Nenes, A.: Droplet activation parameterization: The population-splitting concept 840
revisited, Geosci. Model Dev., 7(5), 2345–2357, doi:10.5194/gmd-7-2345-2014, 2014.
Nenes, A. and Seinfeld, J. H.: Parameterization of cloud droplet formation in global climate models, J.
Geophys. Res., 108(D14), 4415, doi:10.1029/2002JD002911, 2003.
Nenes, A., Chuang, P. Y., Flagan, R. C. and Seinfeld, J. H.: A theoretical analysis of cloud condensation

23
nucleus (CCN) instruments, J. Geophys. Res., 106(D4), 3449–3474, doi:10.1029/2000JD900614, 2001. 845
Partridge, D. G., Vrugt, J. A., Tunved, P., Ekman, A. M. L., Gorea, D. and Sorooshian, A.: Inverse modeling
of cloud-aerosol interactions – Part 1: Detailed response surface analysis, Atmos. Chem. Phys., 11(2), 4749–
4806, doi:10.5194/acpd-11-4749-2011, 2011.
Partridge, D. G., Vrugt, J. A., Tunved, P., Ekman, A. M. L., Struthers, H. and Sorooshian, A.: Inverse
modeling of cloud-aerosol interactions – Part 2: Sensitivity tests on liquid phase clouds using a Markov chain 850
Monte Carlo based simulation approach, Atmos. Chem. Phys., 12(6), 2823–2847, doi:10.5194/acp-12-2823-
2012, 2012.
Petters, M. D. and Kreidenweis, S. M.: A single parameter representation of hygroscopic growth and cloud
condensation nucleus activity, Atmos. Chem. Phys., 7(8), 1961–1971, doi:10.5194/acp-7-1961-2007, 2007.
Pope, F. D.: Pollen Grains are Efficient Cloud Condensation Nuclei, Environ. Res. Lett., 5(4), 2010. 855
Pope, F. D., Dennis-smither, B. J., Griffiths, P. T., Clegg, S. L. and Cox, R. A.: Mixtures with Sodium
Chloride . I . Hygroscopic Growth, Growth Factors, 5335–5341, doi:10.1021/jp100059k, 2010.
Quant, F. R., Flagan, R. C. and Horton, K. D.: Implementation of a Scanning Mobility Particle Sizer, J.
Aerosol Sci., 24, 83–84, 1993.
Rissler, J., Svenningsson, B., Fors, E. O., Bilde, M. and Swietlicki, E.: An evaluation and comparison of 860
cloud condensation nucleus activity models: Predicting particle critical saturation from growth at
subsaturation, J. Geophys. Res., 115(D22), D22208, doi:10.1029/2010JD014391, 2010.
Roberts, G. C. and Nenes, A.: A Continuous-Flow Streamwise Thermal-Gradient CCN Chamber for
Atmospheric Measurements, Aerosol Sci. Technol., 39(3), 206–221, doi:10.1080/027868290913988, 2005.
Roberts, G. C., Artaxo, P., Zhou, J., Swietlicki, E. and Andreae, M. O.: Sensitivity of CCN spectra on 865
chemical and physical properties of aerosol: A case study from the Amazon Basin, J. Geophys. Res. D
Atmos., 107(20), 1–18, doi:10.1029/2001JD000583, 2002.
Rogers, R. R. and Yau, M. K.: A Short Course in Cloud Physics, Third Edit., Pergamon Press, Toronto.,
1989.
Rosenfeld, D., Woodley, W. L., Axisa, D., Freud, E., Hudson, J. G. and Givati, A.: Aircraft measurements of 870
the impacts of pollution aerosols on clouds and precipitation over the Sierra Nevada, J. Geophys. Res.,
113(D15), D15203, doi:10.1029/2007JD009544, 2008.
Seinfeld, J. H. and Pandis, S. N.: Atmoshperic Chemistry and Physics: From Air Pollution to Climate
Change, 2nd ed., John Wiley & Sons, Hoboken, NJ, USA., 2006.
Shi, Q., Han, H., Kerrigan, S. W. and Johnson, E. M.: Characterization of Two New Butanol - based 875
Condensation Particle Counters ( TSI Model 3776 UCPC and 3775 CPC ), Am. Assoc. Aerosol Res. Conf.
Poster, 24(1), 1, 2005.
Stevens, B. and Feingold, G.: Untangling aerosol effects on clouds and precipitation in a buffered system.,
Nature, 461(7264), 607–613, doi:10.1038/nature08281, 2009.
Switlicki, E., Hansson, H.-C., Hameri, K., Svenningsson, B., Massling, A., McFiggans, G., McMurry, P. H., 880
Petäjä, T., TUNVED, P., GYSEL, M., TOPPING, D., WEINGARTNER, E., BALTENSPERGER, U.,
RISSLER, J., WIEDENSOHLER, A. and KULMALA, M.: Hygroscopic properties of submicrometer
atmospheric aerosol particles measured with H-TDMA instruments in various environments—a review,
Tellus B, 0(0), 080414161623888–???, doi:10.1111/j.1600-0889.2008.00350.x, 2008.

24
Topping, D., Connolly, P. and McFiggans, G.: Cloud droplet number enhanced by co-condensation of 885
organic vapors, Nat. Geosci., 6(6), 443–446, doi:10.1038/ngeo1809, 2013.
Twomey, S.: The Influence of Pollution on the Short wave Albedo of Clouds, J. Atmos. Sci., 34, 1149–52,
1977.
Whitehead, J. D., Irwin, M., Allan, J. D., Good, N. and McFiggans, G.: A meta-analysis of particle water
uptake reconciliation studies, Atmos. Chem. Phys., 14(21), 11833–11841, doi:10.5194/acp-14-11833-2014, 890
2014.
Williams, P. I., McFiggans, G. and Gallagher, M. W.: Latitudinal aerosol size distribution variation in the
Eastern Atlantic Ocean measured aboard the FS-Polarstern, Atmos. Chem. Phys., 7(10), 2563–2573,
doi:10.5194/acp-7-2563-2007, 2007.
Winklmayr, W., Reischl, G. P., Lindner, A. O. and Berner, A.: A new electromobility spectrometer for the 895
measurement of aerosol size distributions in the size range from 1 to 1000 nm, J. Aerosol Sci., 22(3), 289–
296, doi:10.1016/S0021-8502(05)80007-2, 1991.
900

25
Table 1: Instrumentation used for measurements in the aerosol chamber. The DMPS used in these experiments
(Alfarra et al., 2012; Williams, McFiggans, & Gallagher, 2007) follows general principles for a differential
mobility particle sizer (Kready, Quant, & Sem, 1983), employing a differential mobility analyser (Brechtel
Manufacturing) and a 3786 water CPC (TSI) and uses sheath air at relative humidities (RHs) similar to that of the
MAC. 905
Target
measurement
Instrument Technique Uncertainty Reference
Aerosol mass and
composition
High Resolution
Aerosol Mass
Spectrometer
(AMS), Aerodyne
Mass Spectrometry ±20–25% (Mass) (Canagaratna et al.,
2007; Decarlo et
al., 2006)
Particle number
concentration and
size distribution
(mass inferred)
Differential
Mobility Particle
Sizer (DMPS),
University of
Manchester
(further description
in the caption)
Electrical Mobility
Sizing, optical
counting
±10% (Number
concentration) –
CPC error
5–10% (diameter
sizing)
(see caption)
Particle number
concentration
3776 Butanol
Condensation
Particle Counter
(BCPC), TSI
Optical counting ±10% (Shi et al., 2005)
CCN Droplet
Activity
Aerosol particle
sizing using an in-
house DMPS,
droplet activity
measured with
Cloud
Condensation
Nuclei Counter
(CCNc), Droplet
Measurement
Technologies
Initial sizing using
electrical mobility
sizing,
supersaturation
induced by
continuous flow
thermal gradient,
optical counting of
particles
Calculated based
on uncertainty in
the sigmoidal fit to
the values of the
diameter at which
50% of particles
activate (D50). See
section 2.1.2 for
further details.
For CCN counter:
(Alofs et al., 1995;
Lance et al., 2006;
Roberts and Nenes,
2005)
For DMPS:(Alfarra
et al., 2012;
Williams et al.,
2007)

26
Table 2: Experimental conditions in MAC for photochemical secondary organic aerosol experiments. Precursor,
ozone and NOx mixing ratios shown are for the initial conditions when starting exposure to light. The
NOx/precursor ratio was held approximately constant. The ozone mixing ratio for the β-caryophyllene experiment 910 is difficult to measure as β-caryophyllene reacts more quickly with ozone than the ozone concentration can
equilibrate throughout the MAC, the same procedure was used as in the α-pinene and 1,3,5-trimethylbenzene
experiments so approximately the same mixing ratio will have been introduced.
SOA precursor Precursor
mixing ratio
Ozone mixing
ratio
NOx mixing
ratio
Light
exposure time
UV filter in
use
1,3,5-
trimethylbenzene
1000 ppb 55.4 ppb 20.9 ppb 2 h 26 min No
α-pinene
(07/11/2013)
250 ppb 44.2 ppb 84.9 ppb 1 h 55 min Yes
α-pinene
(14/11/2013)
250 ppb 32.4 ppb 78.8 ppb 1 h 31 min Yes
β-caryophyllene 39 ppb See caption 81.2 ppb 1 h 26 min Yes
Limonene 80 ppb 14.6 ppb 75.3 ppb 1 h 40 min Yes
915

27
Table 3: Instrumentation used at the Manchester Ice Cloud Chamber.
Target
measurement
Instrument Technique Uncertainty Reference
Particle number
and size
distribution (mass
inferred)
SMPS – 3080/1 TSI
Electrical Classifier
with (low flow
mode) 3776 Butanol
CPC, TSI
Electrical mobility
sizing, optical
counting
±20 % (number
conc.)
±3.5 % (diameter)
(Liu and Deshler,
2003; Quant et
al., 1993)
Particle number
in MICC
3010 Butanol
Condensation
Particle Counter
(BCPC), TSI
Optical counting ±12 %
Water droplets
(number and size
White Light Aerosol
Spectrometer
(WELAS), Palas
Xenon lamp
scattered 90° ± 12°
flux measurement
±10 % (Benz et al., 2005;
Möhler et al.,
2008)
Dew point CR-4 Hygrometer,
Buck Research
Instruments
Chilled mirror
hygrometer
±0.1K
Temperature Type K
Thermocouples and
TC-08 control box,
PicoTechnologies
Thermocouples ±0.5K
Pressure LEX-1 Manometer,
Keller
Piezoresistive strain
gauge
±0.05 %

28
Table 4: Variability limits for the Monte Carlo simulation of evacuations in the MICC: Dm shows the modal
diameter in nm, lnσ refers to the natural logarithm of the distribution width parameter σ, N refers to the number 920 concentration of aerosol particles per cm3, Ti to the initial temperature in K, and initial values for relative
humidity (Ti).
Experimental
Evacuation
Dm Lnσ N κ Ti RHi
α-pinene 07/11/13
evacuation 1
87.561784-
93.913416
0.211476745-
0.233503255
9094.4-
13641.6
0.07825-
0.84063
286.81-
288.31
0.9928
α-pinene 07/11/13
evacuation 2
87.6863655-
94.0470345
0.21129615-
0.23330385
5912.69872-
8869.04808
0.07825-
0.84063
286.63-
288.03
1.0000
Limonene
evacuation 1
84.453326-
90.579474
0.19660142-
0.21707858
8607.80384-
12911.70576
0.077417-
0.087833
286.39-
287.9
0.9569
Limonene
evacuation 2
83.1356185-
89.1661815
0.196705975-
0.217194025
6129.1856-
9193.7784
0.077417-
0.087833
286.31-
287.72
0.9485
Limonene
evacuation 3
81.8853645-
87.8252355
0.19135466-
0.21128534
3853.67256-
5780.50884
0.077417-
0.087833
286.49-
287.68
0.9616
Ammonium
sulfate seed
evacuation 2
38.4545745-
41.2440255
0.48148528-
0.53163472
9510.97696-
14266.46544
0.61 286.4-
287.98
0.9756
Ammonium
sulfate seed
evacuation 3
39.2524365-
42.0997635
0.55469279-
0.61246721
1360.61944-
2040.92916
0.61 286.42-
288
0.9809
Ammonium
sulfate seed
evacuation 5
37.364993-
40.075407
0.625077315-
0.690182685
1434.3928-
2151.5892
0.61 286.55-
288
0.9922
1,3,5 –
trimethylbenzene
evacuation 1
72.746332-
78.023268
0.14909543-
0.16462457
4308.04184-
6462.06276
0.08788-
0.095507
286.02-
287.61
0.9836
1,3,5 –
trimethylbenzene
evacuation 2
72.808092-
78.089508
0.15095841-
0.16668159
3130.19936-
4695.29904
0.08788-
0.095507
286.13-
287.6
0.9684
1,3,5 –
trimethylbenzene
evacuation 3
73.3817845-
78.7048155
0.142850645-
0.157729355
1926.27048-
2889.40572
0.08788-
0.095507
286.31-
287.98
0.9656
1,3,5 –
trimethylbenzene
evacuation 4
74.23552-
79.62048
0.147298985-
0.162641015
1453.61088-
2180.41632
0.08788-
0.095507
286.24-
287.78
0.9726
α-pinene 14/11/13
evacuation 1
139.2248925-
149.3241075
0.20295076-
0.22408924
3838.36616-
5757.54924
0.074308-
0.091018
286.61-
288.14
0.9970
α-pinene 14/11/13
evacuation 2
137.002208-
146.940192
0.19051822-
0.21036178
2468.25256-
3702.37884
0.074308-
0.091018
286.68-
288.14
0.9949
α-pinene 14/11/13
evacuation 3
133.6307875-
143.3242125
0.197105185-
0.217634815
1308.23016-
1962.34524
0.074308-
0.091018
286.64-
287.94
0.9926
α-pinene 14/11/13
evacuation 4
129.447802-
138.837798
0.21401458-
0.23630542
766.94824-
1150.42236
0.074308-
0.091018
286.18-
288.11
0.9782
β-caryophyllene
evacuation 1
74.688684-
80.106516
0.25659698-
0.28332302
4994.6292-
7491.9438
0.041553-
0.045073
286.82-
288.15
0.9944
β-caryophyllene
evacuation 2
74.0526525-
79.4243475
0.261282945-
0.288497055
3354.65928-
5031.98892
0.041553-
0.045073
286.62-
288.13
0.9759

29
β-caryophyllene
evacuation 3
73.402339-
78.726861
0.25703421-
0.28380579
2064.48072-
3096.72108
0.041553-
0.045073
286.26-
288.05
0.9836

30
925
Figure 1: Schematic diagram of the combined MAC/MICC facility. The blower and air filtration system can be
used to inflate and deflate the MAC and to transfer filtered air to the MICC. A seed “drum” can be used to
introduce nebulised aerosol into the MAC but in these experiments, ammonium sulfate was nebulized directly into
the chamber. Ports for sampling from the chambers, a line for introducing NO2, and the ozonizer and humidifier 930 for introducing ozone and water vapor are shown.

31
Figure 2: D50 (the diameter for which 50% of the particles activate) and κ values are shown for all experiments.
Variability bars are shown only for the α-pinene experiment conducted on the 7th Nov. 2013 in order to retain 935 clarity. The labeled vertical black lines indicate the time at which photochemical nucleation was stopped for
transfer.
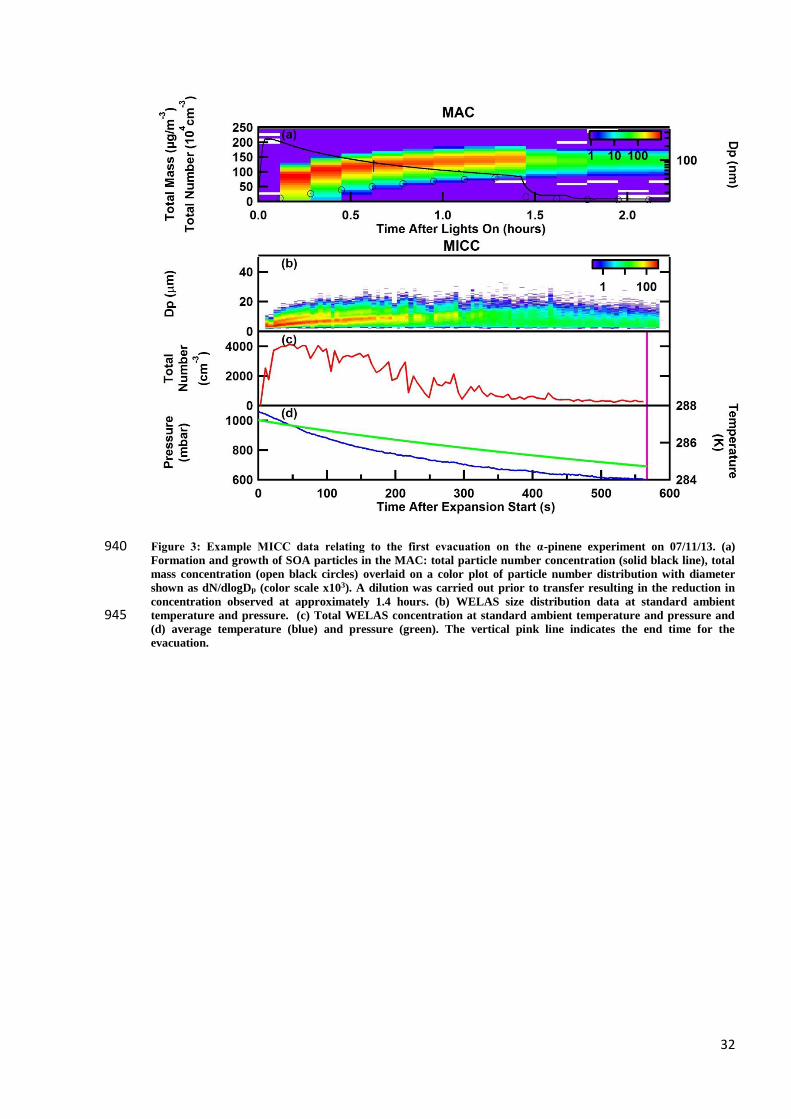
32
Figure 3: Example MICC data relating to the first evacuation on the α-pinene experiment on 07/11/13. (a) 940 Formation and growth of SOA particles in the MAC: total particle number concentration (solid black line), total
mass concentration (open black circles) overlaid on a color plot of particle number distribution with diameter
shown as dN/dlogDp (color scale x103). A dilution was carried out prior to transfer resulting in the reduction in
concentration observed at approximately 1.4 hours. (b) WELAS size distribution data at standard ambient
temperature and pressure. (c) Total WELAS concentration at standard ambient temperature and pressure and 945 (d) average temperature (blue) and pressure (green). The vertical pink line indicates the end time for the
evacuation.

33
Figure 4: Fitting of SMPS data to a lognormal function. Aerosol size distributions measured by the SMPS in the 950 MICC (black) fitted to a lognormal function (red) as inputted into ACPIM for each experimental evacuation are
shown. Data is shown for α-pinene (07/11/13) evacuation 1–2 (a)–(b), limonene evacuation 1–3 (c)–(e), ammonium
sulfate evacuation 2, 4 and 6 (f)–(h), 1,3,5-trimethylbenzene evacuation 1–4 (i)–(l), α-pinene (14/11/13) evacuation
1 (m)–(p), β-caryophyllene evacuation 1–3 (q)–(s). The other evacuations from the ammonium sulfate experiments
have been excluded from this study because of data collection problems. The ammonium sulfate seed distributions 955 are much broader (i.e. have a much larger value for σ) than the SOA samples.

34
Figure 5: Temperature and pressure fits for input into the model (temperature is shown in orange and pressure in
green) to MICC data (temperature shown in red and pressure in blue). An exponential decay function was fitted
to the temperature data from the MICC, this was then used to calculate the initial RH in the model using the 960 initial temperature and the temperature at the time of initial cloud formation and the cloud onset time. The
pressure was fitted based on the initial pressure and the reduction in temperature during the cloud evacuation.
Good agreement was achieved in all cases between modeled and actual temperature and pressure. The difference
is most pronounced in evacuations (m), (n), (o) and (p). Data is shown for α-pinene (07/11/13) evacuation 1–2 (a)–
(b), limonene evacuation 1–3 (c)–(e), ammonium sulfate evacuation 2,4 and 6 (f)–(h), 1,3,5-trimethylbenzene 965 evacuation 1–4 (i)–(l), α-pinene (14/11/13) evacuation 1–4 (m)–(p), β-caryophyllene evacuation 1–3 (q)–(s).

35
Figure 6: Comparison of base case simulations (i.e. simulations using the expectation values for all variables)
results from ACPIM (blue) with WELAS data corrected to standard ambient temperature and pressure (red). 970 The RH used for the ACPIM simulations was set such that for the base case in all the fields varied, the onset of
droplets is found to be at the same for the chamber experiment and ACPIM simulation to the nearest output time
from ACPIM (i.e. 10 second interval). The model output gives an extended maximum of number concentration,
this is taken as the activation from the model. WELAS data is much more variable and therefore is averaged over
10 data points (see Sect. 2). Data is shown for α-pinene (07/11/13) evacuation 1–2 (a)–(b), limonene evacuation 1–3 975 (c)–(e), ammonium sulfate evacuation 2,4 and 6 (f)–(h), 1,3,5-trimethylbenzene evacuation 1–4 (i)–(l), α-pinene
(14/11/13) evacuation 1–4 (m)–(p), β-caryophyllene evacuation 1–3 (q)–(s).

36
Figure 7: Ratio of WELAS concentration at standard ambient temperature and pressure to model concentration 980 for base case simulations (i.e. simulations using the expectation value for all variable inputs). The base cases from
the α-pinene experiment on 07/11/13 and β-caryophyllene show substantial underestimation of the number
concentration of aerosol by the model in comparison to the WELAS data while the second limonene evacuation
shows the number concentration predicted by the model to be much higher than that from the WELAS data. The
variability bars shown relate to an assumed ±10 % uncertainty in the WELAS total number concentration. 985

37
Figure 8: Colour plot of the number of Monte Carlo simulation tests as a function of WELAS (at standard
ambient temperature and pressure) /model number concentration. The first evacuation on the α-pinene 07/11/13
and all three β-caryophyllene evacuations show the model underestimating the total number concentration 990 compared to the WELAS data. The second limonene evacuation shows the model overestimating the total number
concentration compared to the WELAS data. The dark gray lines indicate the maximum and minimum value of
the WELAS/model number concentration ratio from the Monte Carlo distribution with an additional variability
of ±10 % to account for uncertainty in the WELAS measurements.
995

38
Figure 9: Model/WELAS (at standard ambient temperature and pressure) number concentration ratio is shown
for evacuations using the base case variables except for the hygroscopicity variable κ. The red line indicates a ratio
of 1. For some evacuations, no value of κ is sufficient to get a ratio less than 1. Each line is labeled with the
experiment and the evacuation number, P. refers to α-pinene with the two experiments with α-pinene 1000 differentiated by the date (either 7th or 14th), Lim refers to limonene, A.S. refers to ammonium sulfate, TMB to
1,3,5-trimethylbenzene and Caryo. to β-caryophyllene.

39
Figure 10: Ratio of maximum concentration in the model using the base case simulation values for all variables to 1005 the WELAS concentration observed for all evacuations with varying amounts of semi-volatile material. For each
chamber evacuation five bars are shown, from left to right these are with a total semi-volatile concentration of
1.885×10⁻⁷ g m-3 (purple), 1.885×10⁻⁸ g m-3 (blue) 1.885×10⁻⁹ g m-3 (green), 1.885×10⁻¹⁰ g m-3 (orange) and no semi-
volatiles (red). Each set of five bars is labeled with the experiment and the evacuation number. A range of
volatility distributions (see Fig. 11) were used to investigate the effect on activation. Here we show the results for 1010 the distribution employed by Cappa and Jimenez (Cappa and Jimenez, 2010). The results from other distributions
can be found in the supplementary material (see Fig. S1–S4). The error bars shown assume a ±10 % error in the
WELAS concentration.
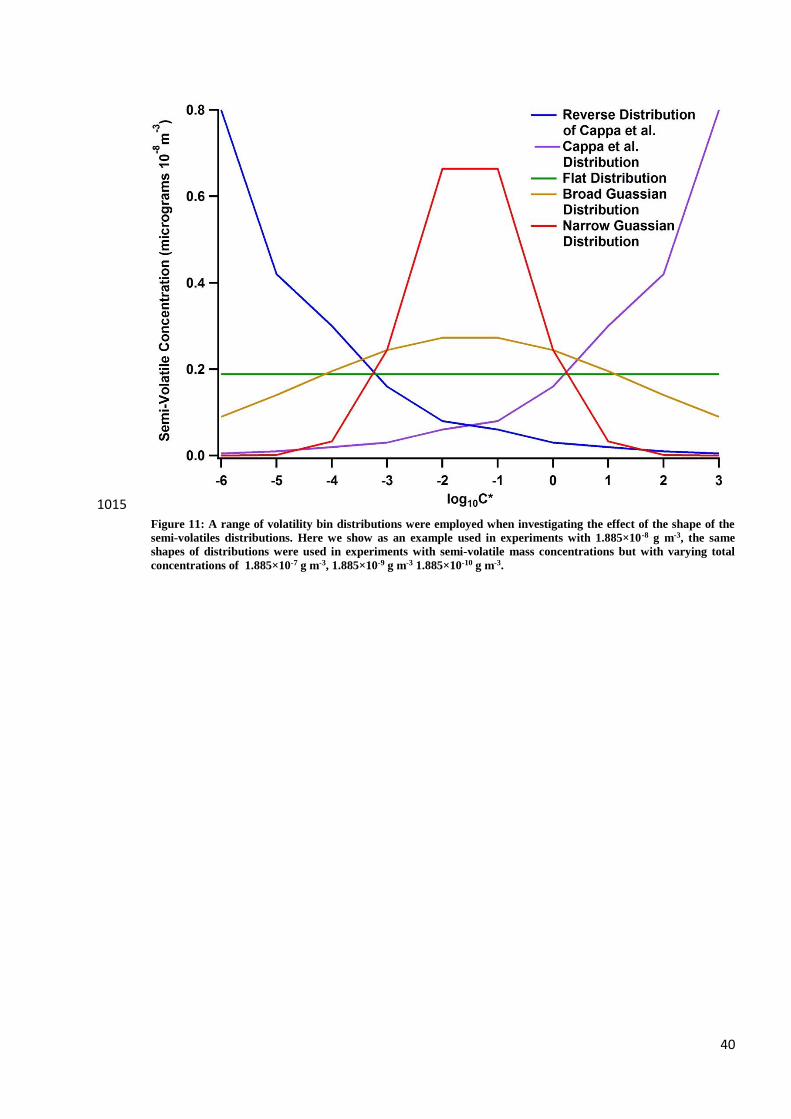
40
1015
Figure 11: A range of volatility bin distributions were employed when investigating the effect of the shape of the
semi-volatiles distributions. Here we show as an example used in experiments with 1.885×10⁻⁸ g m-3, the same
shapes of distributions were used in experiments with semi-volatile mass concentrations but with varying total
concentrations of 1.885×10⁻⁷ g m-3, 1.885×10⁻⁹ g m-3 1.885×10⁻¹⁰ g m-3.

18
3.
Title: Supplementary Material for “A chamber and modelling investigation of the potential
impacts of semi-volatile material on cloud droplets”
Prepared for publication in Atmospheric Chemistry and Physics Discussions but not submitted.
Page 18
1
Supplementary material
S1 Supplementary methods
In this section, detailed descriptions of procedures will be supplied as referred to in the main text.
S1.1 MAC 5
S1.1.1 Chamber bag
When inflating the Teflon bag in the MAC, air is extracted from the laboratory through a drier and a series of
three filters (purafil/charcoal, pure charcoal and then a HEPA filter) in order to remove particles and
chemically significant trace gases. This air may then be passed through a humidifier and/or ozone generator
or blown into the chamber bag directly. By changing the position of the valves, the chamber can be deflated 10
as the blower draws gas from the chamber to an exhaust line, this can also be done via the ozonizer and
humidifier if required. A series of inflations and deflations (at least five) are completed as part of the pre-
experimental procedure. During this period, the humidity can be controlled by drying the laboratory air using
the drier at the inlet for lab air to reduce the humidity of the air entering the Teflon bag and by warming the
double deionised water inside the humidifier and diverting the gas flow into the chamber to go via the 15
humidifier in order to increase the humidity inside the Teflon bag. This allowed the humidity to be regulated
such that it was in the 45–60 % RH range for all photo-oxidation experiments.
S1.1.2 VOCs
VOCs were introduced to the MAC bag as follows. A glass bulb with a gas line attached at either end to a
nitrogen gas supply and to the inflation/deflation gas line for the Teflon bag is attached to the MAC. During 20
the pre-experimental procedure for all photochemical oxidation experiments, the bulb is heated with electric
tape for ~5 minutes, then as the Teflon bag changes from inflating to deflating during the pre-experimental
procedure, nitrogen gas is run through the bulb into the inflation/deflation gas line. As it is deflating, the
nitrogen and any impurities from the glass bulb are flushed to the exhaust (i.e. away from the chamber).
During the deflation prior to the final inflation of the bag before the beginning of photochemical oxidation 25
experiments, the bulb is reheated. Once the final inflation of the bag has begun, the VOC material for the
experiment is injected through a cork into the heated glass bulb where it is vaporised and carried by nitrogen
gas flowed through the bulb to the inflation/deflation gas line whereupon, as the bag is being inflated, it is
carried into the Teflon bag.
S1.1.3 NO2 30
NO2 is introduced to the MAC as follows. The volume inside a gas line between the gas cylinder and a mass
flow controller is exposed to the compressed gas, the mass flow controller is then set to allow the gas to flow
to an exhaust line at a rate of 10 cm3 min-1 for 30 seconds in order to fill the volume between the mass flow
controller and the cylinder with NO2. Nitrogen gas is then flowed through the volume after the mass flow

2
controller to ensure that any NO2 present has gone into the exhaust. During the final inflation of the bag
before a photochemical experiment, the gas line between the mass flow controller and the exhaust is switched
using a three-way valve to a gas line leading into the Teflon bag. A controlled quantity of NO2 gas is then
flowed through the mass flow controller and flushed into the chamber using nitrogen gas. This may be
repeated if further NO2 is required. 5
S1.1.4 Ozone
Ozone was introduced into the MAC for photo-oxidation experiments. At the beginning of one of the pre-
experimental inflations of the bag, the ozonizer was switched on to start producing ozone, during the
subsequent deflation of the bag, the ozone produced was vented to exhaust. This was done in order to remove
contaminants from the ozonizer. Just prior to the completion of the final inflation of the bag, the inflation is 10
paused in order to turn on the ozonizer to generate ozone which is then flushed into the chamber. Having the
ozonizer on for 2 minutes before flushing the ozone generated into the chamber for 20 seconds generates
~30ppb ozone and this was the ozone level used at the start of the photochemistry experiments. After the
ozone has entered the chamber it is crucial to illuminate the chamber quickly in order to avoid ozonolysis
under dark conditions having too much impact on the formation and composition of the SOA generated 15
particularly when using VOCs which react quickly with ozone such as -caryophyllene.
S1.1.5 Ammonium sulfate experiment
For the ammonium sulfate experiment, ammonium sulfate aerosol particles were introduced into the chamber
by flowing compressed air filtered with HEPA and charcoal filters through a nebulizer filled with ammonium
sulfate solution as the bag was inflated to approximately half of its maximum volume. The inflation of the 20
bag was then paused to encourage coagulation of the aerosol particles to increase their size and decrease the
number concentration. Further injections of ammonium sulfate aerosol using the method described above
were used to further increase the number concentration. The number concentration can be changed by
partially deflating and re-inflating the chamber bag to reduce concentration and via nebulising further
ammonium sulfate aerosol. 25
S1.2 Instrumentation
S1.2.1 DMA calibration
Polystyrene latex spheres of known size were used to calibrate the particle sizing of the DMA. Ammonium
sulfate particles were used to calibrate the supersaturation used in the CCN counter. The measured D50 and
SScrit pairs for ammonium sulfate were compared to the theoretical values calculated with Aerosol Diameter 30
Dependent Equilibrium Model (Topping et al., 2005) yielding a correction factor for each set supersaturation.
This correction showed that the CCN counter was measuring droplet activation with supersaturations
between 0.04% and 1.3% (i.e. RH between 100.04% to 101.3%) during these experiments. Data shown in
this study is from the CCN counter which operated in all experiments.

3
S1.2.2 Hygrometer
The Dew Point Hygrometer uses the chilled mirror method to find the dew point; changing the temperature
of a mirror and detecting the presence of droplets on the mirror by alterations in its optical properties when
droplets are present. It warms the mirror when drops are present and cools it when they are not. As droplet
formation/evaporation and detection is not instantaneous, the hygrometer tends to take some time (generally 5
4–8 minutes) to reach balance and only provides data when the balance has settled.
S2 Supplementary results
Additional results as pointed to in the main text are shown here.
S2.1 Hygroscopicity parameter κ
This work rests upon accurate calculation of the value of the hygroscopicity parameter κ from the 10
experiments conducted in order to model the concentration of droplets that would be anticipated with and
without the possibility of co-condensation. As such a comparison between the values used in this study and
those found in other work is included here (see Table S1) as this is the key parameter in determining
activation. It should be noted that ammonium sulfate is used as the standard for calibration of the CCN
counter employed in this study. 15
S2.2 Semi-volatile distributions
A variety of semi-volatile distributions were used to test the effect this distribution had on the number
concentrations activated (see Fig. 11). In all cases, the results were very similar indicating that the volatility
distribution does not play an important role in determining activation in these experiments. This is thought to
be due to virtually all semi-volatile material entering the condensed aerosol phase when exposed to 20
supersaturated conditions. Here we show the WELAS/Model concentration ratios for the reverse of the
Cappa & Jimenez distribution (Fig. S1), the narrow Gaussian distribution (Fig. S2), the broad Gaussian
distribution (Fig. S3), and a flat distribution (Fig. S4). The results from the Cappa & Jimenez distribution is
shown in the main text (see Fig. 10).
25

4
Table S1: Values for the hygroscopicity parameter κ. It should be noted that the aerosol generated in
different experiments are generated under different conditions: varying concentrations of precursor
VOCs, NOx and ozone, different experimental time and different illumination conditions. The work of
Alfarra et al. employs the same chamber facility and therefore illumination conditions were very
similar. 5
SOA precursor κ range used in
Monte Carlo
simulation
Literature κ
values
Sources for
literature κ
values
1,3,5-
trimethylbenzene
0.08788-
0.095507
0.035-0.065 (Massoli et al.,
2010)
α-pinene
(07/11/2013)
0.07825-
0.84063
0.042-0.121 (Alfarra et al.,
2013)
α-pinene
(14/11/2013)
0.074308-
0.091018
0.042-0.121 (Alfarra et al.,
2013)
β-caryophyllene 0.041553-
0.045073
0.009-0.011 (Alfarra et al.,
2013)
Limonene 0.077417-
0.087833
0.077 (Alfarra et al.,
2013)
Ammonium
Sulfate
0.61 0.6-0.67 (Andreae and
Rosenfeld,
2008; Petters
and
Kreidenweis,
2007)

5
Figure S1: Ratio of maximum concentration in the model chamber activation for all expansions with varying
amounts of semi-volatile material with the reverse of Cappa & Jimenez distribution (see Figure 11). For each
experiment five bars are shown, from left to right these are with semi-volatile concentration 1.885×10⁻⁷ g m-3
(purple), 1.885×10⁻⁸ g m-3 (blue), 1.885×10⁻⁹ g m-3 (green), 1.885×10⁻¹⁰ gm-3 (orange), and no semi-volatiles (red). 5 Each set of five bars is labeled with the experiment and the evacuation number.

6
Figure S2: Ratio of maximum concentration in the model chamber activation for all expansions with varying
amounts of semi-volatile material with the narrow Gaussian distribution (see Figure 11). For each experiment five
bars are shown, from left to right these are with semi-volatile concentration 1.885×10⁻⁷ g m-3 (purple), 1.885×10⁻⁸ g
m-3 (blue), 1.885×10⁻⁹ g m-3 (green), 1.885×10⁻¹⁰ gm-3 (orange), and no semi-volatiles (red). Each set of five bars is 5 labeled with the experiment and the evacuation number.

7
Figure S3: Ratio of maximum concentration in the model chamber activation for all expansions with varying
amounts of semi-volatile material with the broad Gaussian distribution (see Figure 11). For each experiment five
bars are shown, from left to right these are with semi-volatile concentration 1.885×10⁻⁷ g m-3 (purple), 1.885×10⁻⁸ g
m-3 (blue), 1.885×10⁻⁹ g m-3 (green), 1.885×10⁻¹⁰ gm-3 (orange), and no semi-volatiles (red). Each set of five bars is 5 labeled with the experiment and the evacuation number.

8
Figure S4: Ratio of maximum concentration in the model chamber activation for all expansions with varying
amounts of semi-volatile material with the flat distribution (see Figure 11). For each experiment five bars are
shown, from left to right these are with semi-volatile concentration 1.885×10⁻⁷ g m-3 (purple), 1.885×10⁻⁸ g m-3
(blue), 1.885×10⁻⁹ g m-3 (green), 1.885×10⁻¹⁰ gm-3 (orange), and no semi-volatiles (red). Each set of five bars is 5 labeled with the experiment and the evacuation number.
References
Alfarra, M. R., Good, N., Wyche, K. P., Hamilton, J. F., Monks, P. S., Lewis, a. C. and McFiggans, G.:
Water uptake is independent of the inferred composition of secondary aerosols derived from multiple 10
biogenic VOCs, Atmos. Chem. Phys., 13(23), 11769–11789, doi:10.5194/acp-13-11769-2013, 2013.
Andreae, M. O. and Rosenfeld, D.: Earth-Science Reviews Aerosol – cloud – precipitation interactions . Part
1 . The nature and sources of cloud-active aerosols, Earth-Science Rev., 89, 13–41,
doi:10.1016/j.earscirev.2008.03.001, 2008.
Massoli, P., Lambe, A. T., Ahern, A. T., Williams, L. R., Ehn, M., Mikkilä, J., Canagaratna, M. R., Brune, 15
W. H., Onasch, T. B., Jayne, J. T., Petäjä, T., Kulmala, M., Laaksonen, A., Kolb, C. E., Davidovits, P. and
Worsnop, D. R.: Relationship between aerosol oxidation level and hygroscopic properties of laboratory
generated secondary organic aerosol (SOA) particles, Geophys. Res. Lett., 37(24), 1–5,
doi:10.1029/2010GL045258, 2010.
Petters, M. D. and Kreidenweis, S. M.: A single parameter representation of hygroscopic growth and cloud 20
condensation nucleus activity, Atmos. Chem. Phys., 7(8), 1961–1971, doi:10.5194/acp-7-1961-2007, 2007.
Topping, D. O., McFiggans, G. B. and Coe, H.: A curved multi-component aerosol hygroscopicity model
framework: Part 2 - Including organics, Atmos. Chem. Phys., 5(5), 1223–1242, doi:10.5194/acpd-4-8677-
2004, 2005.
25

19
4. Conclusion
In this study we probed the properties of secondary organic aerosol (SOA) with respect to the
aerosol particles’ ability to act as cloud condensation nuclei (CCN); in particular, evidence was
sought regarding whether or not co-condensation increases the concentration of droplets formed
in a cloud with SOA particles acting as CCN. The experiments were conducted under controlled
chamber conditions and an ammonium sulphate experiment was carried out as a reference case.
SOA were generated from α-pinene, β-caryophyllene, 1,3,5-trimethylbenzene and limonene in the
Manchester Aerosol Chamber (MAC) and transferred to the Manchester Ice Cloud Chamber
(MICC) where a series of evacuations were conducted to generate clouds.
Co-condensation of water and semi-volatile material has been demonstrated to occur in a
chamber environment using SOA. In particular, co-condensation is required to explain the droplet
activation observed during chamber evacuations for SOA derived from β-caryophyllene and α-
pinene. The impact of co-condensation upon droplet activation during an expansion appears to
depend upon the size of the aerosol particles. The same quantity of organic material condensing
onto smaller particles results in a greater increase in their diameter proportionally compared to
larger particles as particle volume increases proportionally to the cube of the diameter, however,
the ability to nucleate is related to particle diameter rather than volume (recall the Köhler
equation — Eq 1. Of Chapter 2). It should also be noted that co-condensation may be occurring
in all the SOA experiments because of the potential for overestimation of the hygroscopicity
parameter κ, as is required to explain the observation in the limonene experiment that the
number of droplets activated is significantly lower than predicted by ACPIM. Additionally, the
presence of co-condensation may not be observable in experiments with larger aerosol particle
size distributions as the increase in particle diameters will not be significant in determining the
activated fraction. This can be most clearly be demonstrated by considering the two α-pinene
experiments where a significant increase in activation occurs in the experiment with a modal
particle size of 90 nm but not in the experiment with a modal particle size 140 nm.
In the wider context of our efforts to understand cloud droplet activation, these results support
the work of Topping et al. (Topping et al. 2013), providing experimental data from a controlled
environment which demonstrates the occurrence of co-condensation with SOA. This is anticipated
to be responsible for negative radiative forcing in the atmosphere by increasing the number
concentration of droplets present in clouds. Forcing due to this effect will depend upon the
amount of condensable organic material present, the size distribution of the aerosol particles, the

20
surface albedo and the intensity of solar radiation (which is dependent upon latitude and season).
However, this work points to a requirement to include co-condensation of semi-volatile material
into cloud models on all scales up to and including global circulation models wherever
condensable organic vapour is present. This provides a reason to expand upon the work of
Connolly et al. (Connolly et al. 2014) by creating a multi-mode scheme for parameterising co-
condensation of organic vapours for use in models beyond the parcel scale used in this thesis.
Such a scheme could use the results presented here as a controlled data set by which to judge a
model’s ability to replicate co-condensation of organic vapour. The results from this work also
suggest that at relative humidities relevant to cloud formation, the volatility of the organic vapour
present does not affect the activated fraction of SOA particles as material of all relevant
volatilities partitions heavily towards the condensed phase, which may make including a co-
condensation scheme less computationally expensive.1
This work may also have some explicative power concerning the discrepancies between HTDMA
and CCN counter measurements of the hygroscopicity parameter κ of organic aerosol samples. In
this work measurements from a CCN counter were used to calculate the value of κ. However,
these values did not correspond to the effective κ observed in some of the experiments due to
the co-condensation of material from the gas phase. This introduces a potential bias into
measurements made with a CCN counter and HTDMA as there is substantial potential to lose
condensable vapour from the sample. The exact nature of these discrepancies would likely
depend upon instrument set-up and the aerosol sample. It has been noted in a meta-analysis of
closure studies (i.e. studies attempting to explain the difference between HTDMA and CCN
counter data) that the discrepancies between CCN and HTDMA data are particularly noticeable at
low supersaturations (Whitehead et al. 2014) and that this is thought to be due to a relatively
large uncertainty in the size of the particles. Co-condensation causes particles to grow and is
shown in this study to have the largest impact on smaller particles by introducing the greatest
change in size. While co-condensation may not be able to explain all discrepancies between CCN
counter and HTDMA measurements, it may go some way to explaining the discrepancies
observed.

21
5. References
Albrecht, B.A., 1989. Aerosols, Cloud Microphysics and Fractional Cloudiness. Science, 245(4923),
pp.1227–1230.
Alofs, D.J. et al., 1995. Intercomparison Between Commercial Condensation Nucleus Counters and
an Alternating Temperature Gradient Cloud Chamber. Aerosol Science and Technology,
23(2), pp.239–249. Available at:
http://www.tandfonline.com/doi/abs/10.1080/02786829508965307 [Accessed May 1,
2014].
Andreae, M.O. & Rosenfeld, D., 2008. Earth-Science Reviews Aerosol – cloud – precipitation
interactions . Part 1 . The nature and sources of cloud-active aerosols. Earth-Science
Reviews, 89, pp.13–41.
Asmi, A. et al., 2011. Number size distributions and seasonality of submicron particles in Europe
2008–2009. Atmospheric Chemistry and Physics, 11(11), pp.5505–5538. Available at:
http://www.atmos-chem-phys.net/11/5505/2011/ [Accessed May 2, 2014].
Bauer, S.E. & Menon, S., 2012. Aerosol direct, indirect, semidirect, and surface albedo effects
from sector contributions based on the IPCC AR5 emissions for preindustrial and present-day
conditions. Journal of Geophysical Research, 117(D1), pp.1–15. Available at:
http://www.agu.org/pubs/crossref/2012/2011JD016816.shtml [Accessed July 24, 2012].
Bond, T.C. et al., 2013. Bounding the role of black carbon in the climate system: A scientific
assessment. Journal of Geophysical Research Atmospheres, 118(11), pp.5380–5552.
Boucher, O. et al., 2013. 2013: Clouds and Aerosols. In: Climate Change 2013: The Physical Science
Basis. Contribution of Working Group I to the Fifth Assessment Report of the
Intergovernmental Panel on Climate Change.
Cahill, T.M. et al., 2006. Secondary organic aerosols formed from oxidation of biogenic volatile
organic compounds in the Sierra Nevada Mountains of California. Journal of Geophysical
Research, 111(D16), pp.1–14. Available at:
http://www.agu.org/pubs/crossref/2006/2006JD007178.shtml [Accessed July 19, 2012].
Chen, J.-P., 1994. Theory of Deliquescence and Modified Kohler curves. Journal of the
Atmospheric Sciences, 51(23), pp.3505–3516.
Chen, Q. et al., 2011. The effect of aerosol layers on convective cloud microphysics and

22
precipitation. Atmospheric Research, 101(1-2), pp.327–340. Available at:
http://linkinghub.elsevier.com/retrieve/pii/S016980951100072X [Accessed January 16,
2012].
Chen, T., Rossow, W.B. & Zhang, Y., 2000. Radiative effects of cloud-type variations. Journal of
Climate, 13(1), pp.264–286.
Cheruyiot, N.K. et al., 2015. An overview: Polycyclic aromatic hydrocarbon emissions from the
stationary and mobile sources and in the ambient air. Aerosol and Air Quality Research,
15(7), pp.2730–2762.
Connolly, P.J. et al., 2014. A parameterisation for the activation of cloud drops including the
effects of semi-volatile organics. Atmospheric Chemistry and Physics, 14(5), pp.2289–2302.
Available at: http://www.atmos-chem-phys.net/14/2289/2014/ [Accessed March 5, 2014].
Corti, T. & Peter, T., 2009. A simple model for cloud radiative forcing. Atmospheric Chemistry and
Physics, pp.5751–5758.
Davis, E.J., Buehler, M.F. & Ward, T.L., 1990. The double-ring electrodynamic balance for
microparticle characterization. Review of Scientific Instruments, 61(4), pp.1281–1288.
Day, D.A. et al., 2010. Organonitrate group concentrations in submicron particles with high nitrate
and organic fractions in coastal southern California. Atmospheric Environment, 44(16),
pp.1970–1979. Available at: http://dx.doi.org/10.1016/j.atmosenv.2010.02.045.
DeMott, P.J. et al., 1999. Ice formation by black carbon particles. Geophysical research letters,
26(16), pp.2429–2432. Available at:
http://onlinelibrary.wiley.com/doi/10.1029/1999GL900580/full\npapers2://publication/doi/
10.1029/1999GL900580.
Demott, P.J. et al., 2015. Integrating laboratory and field data to quantify the immersion freezing
ice nucleation activity of mineral dust particles. Atmospheric Chemistry and Physics, 15(1),
pp.393–409.
Ervens, B., Turpin, B.J. & Weber, R.J., 2011. Secondary organic aerosol formation in cloud droplets
and aqueous particles ( aqSOA ): a review of laboratory , field and model studies.
Atmospheric Chemistry and Physics, 11, pp.11069–11102.
Fischer, K. & Grassl, H., 1975. Absorption by airborne and deposited particles in the 8-13
micrometer range. Tellus, 27(5), pp.522–528.

23
Fung, I.Y., Harrison, D.E. & Lacis, A. a., 1984. On the variability of the net longwave radiation at the
ocean surface. Reviews of Geophysics, 22(2), p.177.
Gallimore, P.J. et al., 2011. Importance of relative humidity in the oxidative ageing of organic
aerosols: Case study of the ozonolysis of maleic acid aerosol. Atmospheric Chemistry and
Physics, 11(23), pp.12181–12195.
Grythe, H. et al., 2014. A review of sea-spray aerosol source functions using a large global set of
sea salt aerosol concentration measurements. Atmospheric Chemistry and Physics, 14(3),
pp.1277–1297.
Hallquist, M. et al., 2009. The formation, properties and impact of secondary organic aerosol :
current and emerging issues. Atmospheric Chemistry and Physics, (November 2008),
pp.5155–5236.
Haywood, J. & Boucher, O., 2000. Estimates of the direct and indirect radiative forcing due to
tropospheric aerosols: A review. , (1999), pp.513–543.
Herrmann, H. et al., 2015. Tropospheric Aqueous-Phase Chemistry: Kinetics, Mechanisms, and Its
Coupling to a Changing Gas Phase. Chemical Reviews, 115(10), pp.4259–4334.
Hewitt, C.N. et al., 2011. Quantification of VOC emission rates from the biosphere. TrAC Trends in
Analytical Chemistry, 30(7), pp.937–944. Available at:
http://linkinghub.elsevier.com/retrieve/pii/S0165993611001221 [Accessed July 18, 2012].
Hildemann, L.M. et al., 1991. Aerosol Science and Technology Submicrometer Aerosol Mass
Distributions of Emissions from Boilers , Fireplaces , Automobiles , Diesel Trucks , and Meat-
Cooking Operations. Aerosol Science and Technology, 14(1), pp.37–41.
Hoose, C. & Möhler, O., 2012. Heterogeneous ice nucleation on atmospheric aerosols: a review of
results from laboratory experiments, Available at: http://www.atmos-chem-
phys.net/12/9817/2012/ [Accessed January 29, 2013].
Hoyle, C.R. et al., 2011. A review of the anthropogenic influence on biogenic secondary organic
aerosol. Atmospheric Chemistry and Physics, 11(1), pp.321–343.
Jaenicke, R., 2005. Abundance of Cellular Material and Proteins in the Atmosphere. Science,
308(5718), p.73.
Jimenez, J.L. et al., 2009. Evolution of organic aerosols in the atmosphere. Science (New York,

24
N.Y.), 326(5959), pp.1525–9. Available at: http://www.ncbi.nlm.nih.gov/pubmed/20007897.
Kajino, M., Ueda, H. & Nakayama, S., 2008. Secondary acidification: changes in gas-aerosol
partitioning of semivolatile nitric acid and enhancement of its deposition due to increased
emission and concentration of SOx. Geophysical Research Letters, 113(3).
Kaufman, Y.J., 2005. Aerosol anthropogenic component estimated from satellite data.
Geophysical Research Letters, 32(17), pp.3–6. Available at:
http://www.agu.org/pubs/crossref/2005/2005GL023125.shtml [Accessed July 20, 2012].
Koehler, K. a. et al., 2010. Laboratory investigations of the impact of mineral dust aerosol on cold
cloud formation. Atmospheric Chemistry and Physics, 10(23), pp.11955–11968. Available at:
http://www.atmos-chem-phys.net/10/11955/2010/ [Accessed January 8, 2012].
Köhler, H., 1936. THE NUCLEUS IN AND THE GROWTH OF HYDROSCOPIC DROPLETS. Faraday
Discussions, (1152), pp.1152–1161.
Langmann, B., 2014. On the role of climate forcing by volcanic sulphate and volcanic ash.
Advances in Meteorology, 2014.
Lelieveld, J. et al., 2016. Global tropospheric hydroxyl distribution, budget and reactivity.
Atmospheric Chemistry and Physics Discussions, 1(March), pp.1–25. Available at:
http://www.atmos-chem-phys-discuss.net/acp-2016-160/.
Levin, E.J.T. et al., 2016. Ice-nucleating particle emissions from biomass combustion and the
potential importance of soot aerosol. Journal of Geophysical Research: Atmospheres,
121(10), pp.5888–5903.
Markandya, A. & Chiabai, A., 2009. Valuing climate change impacts on human health: empirical
evidence from the literature. International journal of environmental research and public
health, 6(2), pp.759–86. Available at:
http://www.pubmedcentral.nih.gov/articlerender.fcgi?artid=2672348&tool=pmcentrez&ren
dertype=abstract [Accessed December 12, 2011].
Mårtensson, E.M. et al., 2010. The role of sea-salt emissions in controlling the marine Aitken and
accumulation mode aerosol: a model study. Chemical and Physical Meterology, 62(4),
pp.259–279.
McFiggans, G. et al., 2005. Simplification of the representation of the organic component of
atmospheric particulates. Faraday Discussions, 130, p.341. Available at:

25
http://xlink.rsc.org/?DOI=b419435g [Accessed August 29, 2013].
McFiggans, G. et al., 2006. The effect of physical and chemical aerosol properties on warm cloud
droplet activation. Atmospheric Chemistry and Physics, 6(6), pp.2593–2649.
Menon, S. et al., 2010. Black carbon aerosols and the third polar ice cap. Atmospheric Chemistry
and Physics, 10(10), pp.4559–4571. Available at: http://www.atmos-chem-
phys.net/10/4559/2010/ [Accessed July 23, 2012].
Ni, M. et al., 2014. A review on black carbon emissions, worldwide and in China. Chemosphere,
107, pp.83–93. Available at: http://dx.doi.org/10.1016/j.chemosphere.2014.02.052.
Petters, M.D. & Kreidenweis, S.M., 2007. A single parameter representation of hygroscopic
growth and cloud condensation nucleus activity. Atmospheric Chemistry and Physics, 7(8),
pp.1961–1971. Available at: http://www.atmos-chem-phys.net/7/1961/2007/.
Pincus, R. & Baker, M.B., 1994. Effect of precipitation on the albedo susceptibility of clouds in the
marine boundary layer. Nature, 372(6503), pp.250–252.
Pope, F.D. et al., 2010. Mixtures with Sodium Chloride . I . Hygroscopic Growth. Growth Factors,
pp.5335–5341.
Pope, F.D., 2010. Pollen Grains are Efficient Cloud Condensation Nuclei. Environmental Research
Letters, 5(4).
Quaas, J. et al., 2009. Aerosol indirect effects – general circulation model intercomparison and
evaluation with satellite data. Atmospheric Chemistry and Physics Discussions, 9(3),
pp.12731–12779. Available at: http://www.atmos-chem-phys-discuss.net/9/12731/2009/.
Roberts, G.C. & Nenes, A., 2005. A Continuous-Flow Streamwise Thermal-Gradient CCN Chamber
for Atmospheric Measurements. Aerosol Science and Technology, 39(3), pp.206–221.
Available at: http://www.tandfonline.com/doi/abs/10.1080/027868290913988.
Rodríguez, S., Alastuey, A. & Querol, X., 2012. A review of methods for long term in situ
characterization of aerosol dust. Aeolian Research, 6, pp.55–74.
Rosenfeld, D. et al., 2007. Inverse relations between amounts of air pollution and orographic
precipitation. Science (New York, N.Y.), 315(5817), pp.1396–8. Available at:
http://www.ncbi.nlm.nih.gov/pubmed/17347436 [Accessed March 18, 2012].
Rosenfeld, D., 2000. Suppression of Rain and Snow by Urban and Industrial Air Pollution. Science,

26
287(5459), pp.1793–1796.
Salo, K. et al., 2011. Volatility of secondary organic aerosol during OH radical induced ageing.
Atmospheric Chemistry and Physics, pp.11055–11067.
Saukko, E. et al., 2012. Humidity-dependent phase state of SOA particles from biogenic and
anthropogenic precursors. Atmospheric Chemistry and Physics, 12(16), pp.7517–7529.
Available at: http://www.atmos-chem-phys.net/12/7517/2012/ [Accessed August 30, 2013].
Saukko, E., Kuuluvainen, H. & Virtanen, A., 2012. A Method to resolve the phase state of aerosol
particles. Atmospheric Measurement Techniques, pp.259–265.
Seinfeld, J.H. & Pandis, S.N., 2006. Atmospheric Chemistry and Physics: From Air Pollution to
Climate Change 2nd ed., Hoboken, NJ, USA: John Wiley & Sons.
Sorjamaa, R. & Laaksonen, a., 2007. The effect of H2O adsorption on cloud drop activation of
insoluble particles: a theoretical framework. Atmospheric Chemistry and Physics, 7(24),
pp.6175–6180. Available at: http://www.atmos-chem-phys.net/7/6175/2007/.
Spracklen, D. V. et al., 2011. Aerosol mass spectrometer constraint on the global secondary
organic aerosol budget. Atmospheric Chemistry and Physics, 11(23), pp.12109–12136.
Available at: http://www.atmos-chem-phys.net/11/12109/2011/ [Accessed May 12, 2012].
Sun, J. & Ariya, P., 2006. Atmospheric organic and bio-aerosols as cloud condensation nuclei
(CCN): A review. Atmospheric Environment, 40(5), pp.795–820. Available at:
http://linkinghub.elsevier.com/retrieve/pii/S135223100500498X.
Switlicki, E. et al., 2008. Hygroscopic properties of submicrometer atmospheric aerosol particles
measured with H-TDMA instruments in various environments—a review. Tellus B, 0(0),
p.080414161623888–??? Available at:
http://www.tellusb.net/index.php/tellusb/article/view/16936.
Topping, D., Connolly, P. & McFiggans, G., 2013. Cloud droplet number enhanced by co-
condensation of organic vapours. Nature Geoscience, 6(6), pp.443–446. Available at:
http://www.nature.com/doifinder/10.1038/ngeo1809 [Accessed August 23, 2013].
Topping, D.O. & McFiggans, G., 2012. Tight coupling of particle size, number and composition in
atmospheric cloud droplet activation. Atmospheric Chemistry and Physics, 12(7), pp.3253–
3260.

27
Trærup, S.L.M., Ortiz, R. a. & Markandya, A., 2011. The Costs of Climate Change: A Study of
Cholera in Tanzania. International Journal of Environmental Research and Public Health,
8(12), pp.4386–4405. Available at: http://www.mdpi.com//1660-4601/8/12/4386/
[Accessed January 16, 2012].
Tritscher, T. et al., 2011. Volatility and hygroscopicity of aging secondary organic aerosol in a smog
chamber. Atmospheric Chemistry and Physics, 11, pp.11477–11496.
Trivitayanurak, W. & Adams, P.J., 2014. Does the POA-SOA split matter for global CCN formation?
Atmospheric Chemistry and Physics, 14(2), pp.995–1010.
Twomey, S., 1977. The Influence of Pollution on the Short wave Albedo of Clouds. Journal of the
Atmospheric Sciences, 34, pp.1149–52.
Virtanen, A. et al., 2010. An amorphous solid state of biogenic secondary organic aerosol particles.
Nature, 467(7317), pp.824–7. Available at: http://www.ncbi.nlm.nih.gov/pubmed/20944744
[Accessed August 1, 2011].
Vrieling, A., Beurs, K.M. & Brown, M.E., 2011. Variability of African farming systems from
phenological analysis of NDVI time series. Climatic Change, pp.455–477. Available at:
http://www.springerlink.com/index/10.1007/s10584-011-0049-1 [Accessed October 24,
2011].
Wang, P. et al., 2009. Clear-sky shortwave radiative closure for the Cabauw Baseline Surface
Radiation Network site, Netherlands. Journal of Geophysical Research Atmospheres, 114(14),
pp.1–10.
Whitehead, J.D. et al., 2014. A meta-analysis of particle water uptake reconciliation studies.
Atmospheric Chemistry and Physics, 14(21), pp.11833–11841. Available at:
http://www.atmos-chem-phys.net/14/11833/2014/.
Zhang, Q. et al., 2011. Understanding atmospheric organic aerosols via factor analysis of aerosol
mass spectrometry: a review. Analytical and bioanalytical chemistry, 401(10), pp.3045–67.
Available at:
http://www.pubmedcentral.nih.gov/articlerender.fcgi?artid=3217143&tool=pmcentrez&ren
dertype=abstract [Accessed July 28, 2012].