A Case Study Approach to Understanding Regional Resilienceiurd.berkeley.edu/wp/2007-08.pdf · A...
45
UNIVERSITY OF CALIFORNIA MACARTHUR FOUNDATION RESEARCH NETWORK ON BUILDING RESILIENT REGIONS A Case Study Approach to Understanding Regional Resilience Kathryn A. Foster November 2006 Working Paper 2007-08
-
Upload
vuongkhuong -
Category
Documents
-
view
217 -
download
0
Transcript of A Case Study Approach to Understanding Regional Resilienceiurd.berkeley.edu/wp/2007-08.pdf · A...
UNIVERSITY OF CALIFORNIA
MACARTHUR FOUNDATIONRESEARCH NETWORK ONBUILDING RESILIENT REGIONS
A Case Study Approachto UnderstandingRegional Resilience
Kathryn A. Foster
November 2006
Working Paper 2007-08

Working Paper – not for attribution, distribution or quotation without permission from the author
A Case Study Approach to Understanding Regional Resilience
Kathryn A. Foster, Ph. D. University at Buffalo Regional Institute
The State University of New York Beck Hall
Buffalo, NY 14214-8010 716-829-3777
Working Paper prepared for the Building Resilient Regions Network
and presented at the Annual Conference of the Association of Collegiate Schools of Planning,
Fort Worth, Texas November 9-12, 2006
2
To begin, three vignettes in resilience.
Vignette 1. MM is a university professor emerita, a Hungarian Jew born in 1921 and
raised in a place and time when habitual anti-Semitism would turn virulent. When MM is 14,
in 1935, Hungary passes its First Jewish Law limiting the share of Jewish employment in
most businesses and professions to no more than 20 percent. In 1938, when MM is 17 and
in anticipation of the Second Jewish Law, which will more severely restrict Jewish
employment, MM’s parents determine that MM should emigrate from Hungary.
They provide this advice and directive: MM must master skills that provide a
livelihood independent of her native language or level of education. Though a talented
student, MM heeds her parents. She ends her formal education and trains instead to dress
hair, apply makeup, cleanse skin and manicure nails, thus equipping herself with the capacity
to survive anywhere. And she does survive, escaping Hungary and making her way first to
Palestine and eventually to London after the war. She will never again see her family: MM’s
mother, father and younger sister will die in concentration camps, three of the 550,000
Hungarian Jews killed in the Holocaust.
At 85, MM remains emotionally, mentally and, although slowed by age, physically
capable. Throughout life, she has drawn upon these strengths to withstand and recover
from trauma, indeed to survive situations and stresses that felled many others. She attributes
her resilience to talent—she will later use her creative skills as an artist—generous friends
and a healthy constitution.
Vignette 2. Hanging on the living room wall of LC, a 35-year old elected official in
Buffalo, New York, is a poster of “Rocky” atop the steps of the Philadelphia Art Museum,
his arms raised in triumph and the familiar tag line, “his whole life was a million to one
shot.” It’s a fitting wall piece for LC, not simply because he’s a film expert, but because he
3
has defied odds since birth. Born with thalassemia, an inherited and incurable type of
anemia, LC was given a life expectancy of 10 to 13 years. At 3 months, he began a lifetime
of biweekly trips to the hospital for blood transfusions. Active, upbeat, private and wired to
take things in stride, LC long outlasts the doctor’s predictions. He treats chronic illness as
second nature and trivial to his identity; many people, even close friends, are not aware of his
condition.
Despite conscientious care and an optimistic outlook, however, LC, at age 22 in the
spring of his senior year at college, experiences acute heart and liver failure. He and his
parents are told that his only chance to survive is a double organ transplant. LC later says
that the ensuing eighteen months of waiting and enduring—for permission from insurance
companies to pay for a rare and risky operation, for heart and liver organs that match, for
the uncertainty and fatigue of a debilitating body—was the worst part of subsequent years of
operations, procedures, side effects and recovery. Now with a master’s degree and more
than ten years after the double transplant, LC attributes his beat-the-odds resilience to three
things: a positive and circumspect attitude; devout following of doctors’ orders; and, perhaps
perversely, drugs that weaken his immune system so it cannot reject the transplanted organs.
Vignette 3. On July 20, 1984, accomplished marathoner Jim Fixx, author of the
still-in-print and best-selling book, The Complete Book of Running, dropped dead of a massive
heart attack while running along back roads in Vermont. He was 52. By all outward
appearance, Fixx was in impressive physical shape: although sedentary much of his life, at
age 35 he had famously quit smoking, started jogging, dropped fifty pounds and built the
4
stamina and leg muscles from which he would become well known and well off. He had run
20 marathons and at the time of his death was logging 60 miles a week.1
In the aftermath of his surprising death, several medical issues came to light. One
was that his father had died of a massive heart attack at age 43, suggesting a genetic
predisposition to heart disease. Another was that Fixx was aware, but chose not to treat,
warning signs of heart disease that included cholesterol levels above 250. The autopsy,
which found three main arteries blocked at levels of 95%, 85% and 50% confirmed that his
heart disease was advanced, even if those signs were not evident to Fixx during daily
workouts. A third explanation offered years later was that high levels of exercise—levels
characteristic of Fixx’s daily workouts—might actually do a body harm by generating free
oxygen radicals, molecules associated with a range of heart and other diseases.
In the end, no one could be sure. Did Fixx’s running actually extend his life beyond
genetic expectations? Might Fixx’s running, by building his strength and physical capacity,
perhaps have lured him into a false sense of health and well-being, prompting him to neglect
troubling warning signs? Or was running and its biochemical byproducts the cause, rather
than the antidote, of his untimely death?
If resilience is, as the American Psychological Association puts it, “the process of
adapting well in the face of adversity, trauma, tragedy, threats or even significant sources of
stress,”2 then these vignettes display key attributes and elements of the concept. Evident in
these stories are commonly cited factors of individual resilience, including the capacity to
1 Ted Kreiter. Nov.-Dec. 1994. Book Review of Antioxidant Revolution by Dr. Kenneth H. Cooper. Saturday Evening Post, accessed online at http://findarticles.com/p/articles/mi_m1189/is_n6_v266/ai_15879293. 2 American Psychological Association. N.D. “The Road to Resilience,” p. 1. Accessed online September 14, 2006 at http://www.helping.apa.org/.

5
anticipate change, skills at developing plans and solving problems, a positive view of life,
activities that build a strong body and mind, and caring and supportive relationships.
At the same time, the vignettes reveal fundamental challenges in understanding and
applying the complex concept of resilience. On what basis can we say MM, LC and Fixx are
resilient when one had physical advantages, another ranks low on most measures of health
and the third did not survive past 52? Could we evaluate these and other cases to determine
that one person is more resilient than another? If so, on what absolute or relative scale and
using what measures might we gauge resilience, given obvious differences in time,
circumstances, and personal endowments? More fundamentally, if a person’s vital signs—
say of strength or stamina—are absolutely or relatively low, then regardless of behaviors
would the person by definition lack resilience? In contrast, might a person who survives
despite behaviors and actions be a prima facie case of resilience simply by the fact of survival?
The purpose of this paper is to explore how such questions and concepts of
resilience may apply in the complex setting of a metropolitan region, that is, to understand
what we’ll call “regional resilience.” How might regions, like individuals, adapt to adversity
and stress? What factors account for a region’s resilience and how can we measure them?
As with individuals, given clear differences in challenges, assets and cultures, is it possible to
compare places on the basis of their regional resilience? Can regions intervene to increase
their resilience and, if so, why might a region fail to intervene well or at all?
Other papers in this roundtable tackle these questions through aggregate analysis and
modeling. The current effort seeks insights by proposing a framework for case study
analysis of regional resilience. It begins with a review of literature on resilience drawing
from fields as varied as psychology, management and disaster studies and distilling common
themes that cut across these studies. It then offers a generic framework for assessing
6
regional resilience through case study analysis. To test the framework I use the case of
economic stress in the Buffalo-Niagara Falls Metropolitan Area, a two-county region that
has suffered prolonged economic decline for half a century. I conclude the paper with a
summary of insights on case study approaches to regional resilience and a modest proposal
for planners and regional leaders to more effectively assess and build regional resilience.
I. Understanding Resilience
The literature from several disciplines, notably psychology, ecology, engineering and
planning, management and anthropology, illuminates concepts of and approaches to
resilience.
As the vignettes suggest, studies of individual resilience have long been of interest to
psychologists seeking to understand coping mechanisms and particularly why some people
fare better than others in dealing with difficult circumstances and major life events.3 While
the faculties of an individual differ in important ways from those of a multi-faceted region,
two concepts from psychology are most salient. First is the finding that resilience is an
ordinary rather than extraordinary way of being.4 Although they will choose different means,
such as exercise, prayer, work or writing in a journal, people suffering trauma generally have
the capacity and inclination to bounce back over time. Being resilient is normal.
The second finding from the psychology literature is that resilience is not simply an
inherent personal trait—although one can exhibit resilience—but also a set of capacities,
behaviors and external resources one can develop and draw upon to deal with difficult
3 Linda R. Winfield. 1994. “Developing Resilience in Urban Youth.” Chicago, Ill.: North Central Regional Educational Laboratory, p. 1. 4 American Psychological Association, “Road to Resilience,” p. 1.

7
challenges.5 As such, resilience can be acquired and fostered both through internal steps,
such as strengthening one’s friendship networks and taking physical and mental care of
oneself, and through external interventions, such as supportive and protective social
structures like good schools, health clinics and social services networks. Resilience thus
manifests as both end-state competency and the process of coping with challenges.
Ecological scientists likewise formulate resilience as a characteristic and process, in
their case to understand natural phenomena, such as how forests regenerate after a fire or
how lakes recover from pollutants. Ecologists’ use of resilience is quite different from that
of psychologists, however. They define resilience as a measure of vulnerability to surprise
and shocks, rather than as a response to such stresses. 6 In this scheme, high resilience is
associated with low vulnerability, a condition that is greatest when a system is in a high state
of reorganization, growth and innovation, such as the period of regeneration following a
forest fire. At such times, the system is most responsive to and interactive with external
forces, making surprises unlikely. In contrast, when a system settles down or levels off after
a period of growth, it tends to become more rigid, conservative and internally focused,
leaving it more vulnerable to an external shock or stress. As ecologists describe it, the
system is now an “accident waiting to happen,” especially susceptible to a triggering action
such as a lit match in a dry forest.
Of relevance to regional resilience is the recognition by ecologists that human or
organizational agency makes the patterns of adaptive cycles tendencies rather than
5 Winfield, “Developing Resilience,” pp. 2-3; see also American Psychological Association. 2003. “Resilience in a Time of War.” Washington, D.C.: American Psychological Association; and “Project Resilience” materials accessed September 14, 2006 online at http://www.projectresilience.com. 6 C.S. Holling and Lance H. Gunderson. 2002. “Resilience and Adaptive Cycles.” In Panarchy: Understanding Transformations in Human and Natural Systems, edited by Lance H. Gunderson and C.S. Holling. Washington, D.C.: Island Press, pp. 27-33.

8
inevitabilities.7 Conscious choices may shape the duration and nature of regional adaptation.
Ecologists specifically cite three features that distinguish human systems from natural
systems: 1) foresight and intentionality; 2) communication; and 3) technology.8 Foresight
and intentionality enable a region to make, debate and respond to forecasts and warning
signs, thereby reducing the potential for surprise and increasing resilience. Communication
permits a region to document and learn from experience, to ask for help from external
relations, and to motivate popular action against unwise choices by system leaders. Use of
technology and innovation in regional systems such as transportation, economic
development and health care enable regions to better control the social and economic
environment and establish new competencies for resilience.
System capacities and human behaviors likewise garner interest from engineers and
planners who posit resilience as a cornerstone of disaster response.9 As the much-studied
case of Hurricane Katrina suggests,10 regions with low resilience cope poorly with system
disturbance, faltering in the face of environmental, political and economic blows. Regions
7 See “Resilience and Adaptive Cycles, pp. 44. 8 C.S. Holling, Lance H. Gunderson, and Garry D. Peterson. 2002. “Sustainability and Panarchies.” In Panarchy: Understanding Transformations in Human and Natural Systems, edited by Lance H. Gunderson and C.S. Holling. Washington, D.C.: Island Press, pp. 99-101. 9 See, for example, P. R. Berke and T. J. Campanella. 2006. “Planning for Postdisaster Resiliency.” The Annals of the American Academy of Political and Social Science 604(1): 192 – 207; Louise K. Comfort, ed. 1988. Managing Disaster: Strategies and Policy Perspectives. Durham, NC: Duke University Press; Timothy Beatley, Philip R. Berke, Raymond Burby, Robert E. Deyle, Steven P. French, David R. Godschalk, Edward J. Kaiser, Jack D. Kartez, Peter J. May, Robert Olshansky, Robert G. Paterson, and Rutherford H. Platt. 1999. “Unleashing the Power of Planning to Create Disaster-Resistant Communities.” Journal of the American Planning Association, Vol. 65; and Lawrence J. Vale and Thomas J. Campanella. 2005. The Resilient City: How Modern Cities Recover from Disaster. Oxford: Oxford University Press. 10 See for example, Amy Liu. 2006. “Building a Better New Orleans: A Review of and Plan for Progress One Year after Hurricane Katrina.” Washington, D.C.: The Brookings Institution; Eugenie L. Birch and Susan M. Wachter, eds. 2006. Rebuilding Urban Places After Disaster: Lessons from Hurricane Katrina. Philadelphia, PA: University of Pennsylvania Press; and Thomas Campanella. 2006. “Urban Resilience and the Recovery of New Orleans.” Journal of the American Planning Association 72(2): 141-146.
9
with high resilience more readily absorb such disturbance, either because they better
anticipate and prepare for impending crises or because they are better endowed or
structured—with such assets as sound infrastructure, ample human capital, effective
communications systems and strong external relations—to react effectively to a crisis.
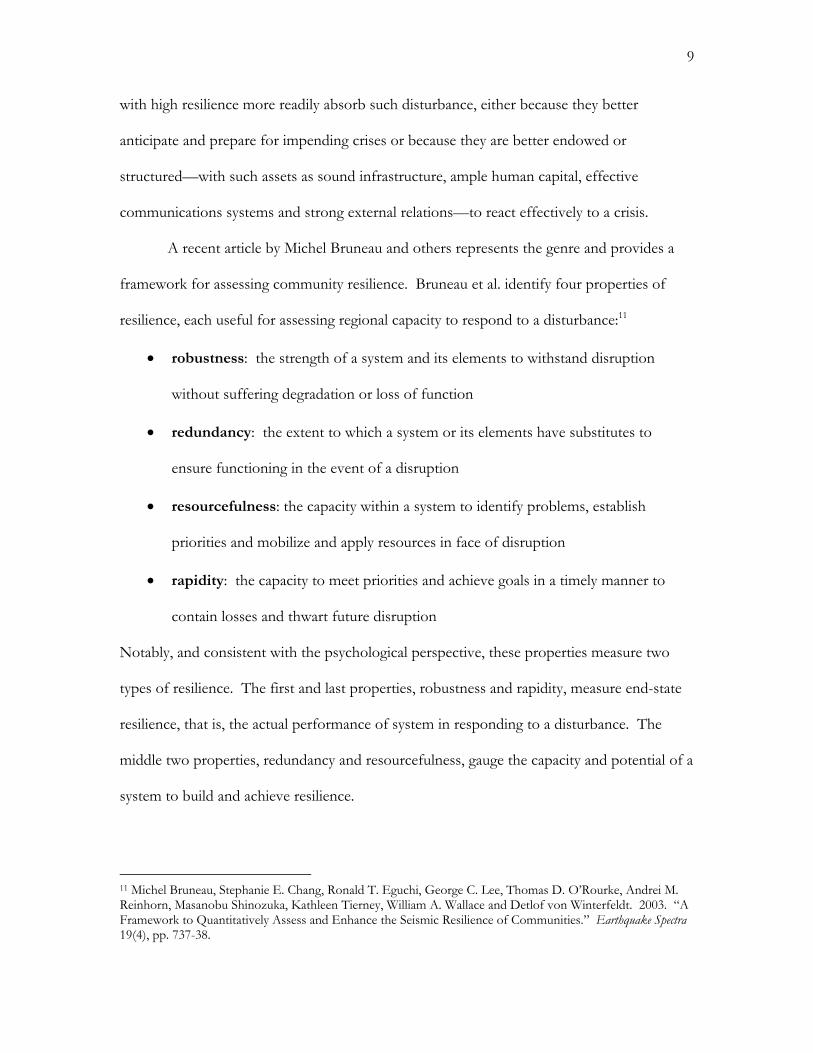
A recent article by Michel Bruneau and others represents the genre and provides a
framework for assessing community resilience. Bruneau et al. identify four properties of
resilience, each useful for assessing regional capacity to respond to a disturbance:11
• robustness: the strength of a system and its elements to withstand disruption
without suffering degradation or loss of function
• redundancy: the extent to which a system or its elements have substitutes to
ensure functioning in the event of a disruption
• resourcefulness: the capacity within a system to identify problems, establish
priorities and mobilize and apply resources in face of disruption
• rapidity: the capacity to meet priorities and achieve goals in a timely manner to
contain losses and thwart future disruption
Notably, and consistent with the psychological perspective, these properties measure two
types of resilience. The first and last properties, robustness and rapidity, measure end-state
resilience, that is, the actual performance of system in responding to a disturbance. The
middle two properties, redundancy and resourcefulness, gauge the capacity and potential of a
system to build and achieve resilience.
11 Michel Bruneau, Stephanie E. Chang, Ronald T. Eguchi, George C. Lee, Thomas D. O’Rourke, Andrei M. Reinhorn, Masanobu Shinozuka, Kathleen Tierney, William A. Wallace and Detlof von Winterfeldt. 2003. “A Framework to Quantitatively Assess and Enhance the Seismic Resilience of Communities.” Earthquake Spectra 19(4), pp. 737-38.
10
Extending their model, Bruneau et al. conceptualize resilience as encompassing four
interrelated dimensions: technical (physical systems, infrastructure), organizational
(governance, service delivery), economic (fiscal, market) and social (community, individual).
The performance of each dimension in the face of disaster—that is, its robustness,
redundancy, resourcefulness and rapidity of response—invites precise gauges, such as the
percentage of disaster assistance centers set up within one day of the disaster (a rapidity
measure of the social dimension) or the presence of backup power supplies for key
businesses (a redundancy measure of the economic dimension). The result is a framework
for assessing overall and specific resilience of a community in the face of a major
disturbance.
Principles useful for assessing community resilience are likewise useful in the field of
management for understanding why some enterprises perform better than others in the face
of business disruptions. As firms have gravitated toward “just-in-time” delivery systems and
increased their dependence on global supply chains, however, the risk assessment and
preparation facets of resilience have assumed special importance. In his recent book, Yossi
Sheffi mines stories of natural disasters (Toyota supply chains disrupted by fires, Unilever
plants shut down by a hurricane, Dell and Apple chip manufacturing impeded by an
earthquake) and non-natural disasters (U.S. Pacific ports shut down by strategically timed
labor strikes at the holidays, McDonald’s suffering as a target of anti-American protests and
terrorism) to distill the factors that make one business more resilient than another.12 Sheffi
emphasizes first the importance of assessing the probability of and potential damage from
specific company risks and vulnerabilities. He then identifies redundancy and flexibility as
12 Yossi Sheffi. 2005. The Resilient Enterprise: Overcoming Vulnerability for Competitive Advantage. Cambridge, Mass.: MIT Press.

11
the two key factors for enterprise resilience, enabling a firm to best mitigate and bounce
back from a disruption. Companies achieve redundancy through strategically positioned
back-up systems (technology, parts, labor, suppliers), standardized parts and processes, and
deep collaborative relations with each link in a supply chain. They achieve flexibility through
decentralized and cross-trained leadership and decision-making systems, effective
communications systems to distribute useful knowledge, and adaptable parts and contracts
able to change on short notice.
Despite safeguards and good intentions, however, some social systems perform
better than others at assessing situations, preparing for the future, stewarding community
assets and thriving economically, environmentally and politically. The literature of
anthropology focuses on why. From his recent analysis of societal and environmental
collapse in ancient and modern settings as varied as Easter Island, Mayan civilization,
Rwanda and Montana, Jared Diamond distills five factors often or always present in
situations of social failure.13 The first four, which vary across the cases in their significance
and may be uncontrollable or inadvertent, are environmental damage, climate change, hostile
neighbors and friendly trade partners. The fifth factor, which always proved significant to
the collapse, is society’s response to its environmental problems. In his analysis, resilience
depends not only on properties of the environment—the fragility of an ecosystem or
external trends, for example—but also on properties of people, such as prudence, the nature
of external relations and habits of conservation.14
This scan of the literature yields several conclusions about attributes of resilience.
First, resilience comes in two different though connected types, namely resilience as
preparation and resilience as performance. Second, resilience applies not only to a system as 13 Jared Diamond. 2005. Collapse: How Societies Choose to Fail or Succeed. New York: Viking Penguin. 14 Diamond, Collapse, pp. 11-15.
12
a whole, but to system elements, such as infrastructure, information, the physical
environment, civic organizations, governance and economic systems. Third, a system that is
resilient on one element may not necessarily be resilient on another. And fourth, resilience
can be developed.
II. A Framework for Assessing Regional Resilience
The challenge of assessing resilience is exemplified by a case study of South Central
Los Angeles ten years after the 1992 civil unrest there sparked by the acquittal of white
police officers accused of beating black motorist Rodney King.15 The case found that, “ten
years after the civil unrest, both statistical indicators and anecdotal reports suggested that the
ravaged parts of the city were still doing poorly.”16 The vast majority of damaged buildings
remained unfixed, commercial redevelopment, housing construction, new investment and
job creation were scant, and metropolitan poverty remained highly concentrated in South
Central L.A. Nonetheless, the author concluded, “these statistics do not mean that L.A. was
not a resilient city.” Rather, the case argues, the rebuilding project was simply larger and
more complex than expected and the nature of community resilience does not show up in
readily measured gauges. “But if by resilience we mean confidence, energy, and sheer
chutzpah, then Los Angeles clearly showed considerable resilience in the decade after 1992.”17
At first glance, it seems misguided to label a place resilient for its confidence, energy
and chutzpah when it otherwise shows dismal economic and social performance. Resilience
could become nearly tautological: if a place has merely survived a stress or shock, no matter 15 William A. Fulton. 2005. “After the Unrest: Ten Years of Rebuilding Los Angeles Following the Trauma of 1992.” In The Resilient City: How Modern Cities Recover from Disaster, edited by Lawrence J. Vale and Thomas J. Campanella, pp. 299-312. New York: Oxford University Press. 16 Fulton, “After the Unrest,” p. 306. 17 Fulton, “After the Unrest,” p. 306.
13
how dismally it must be resilient ipso facto. That said, confidence, energy and chutzpah
legitimately imply a certain kind of resilience and represent an important facet of the
complex concept. A challenge of measuring resilience will be incorporating non-
performance-based aspects of resilience into the framework.
A second methodological challenge is the different nature of disturbances that
emerge as regional blows with immediate powerful impact versus those that manifest as
chronic “slow burn” trends. These chronic disturbances comprise individually small but
cumulatively significant clusters of episodes that amount collectively to prolonged
conditions, such as economic decline, demographic shifts or gradual environmental change.
One consideration for case study work is exploring how marshalling and sustaining resilience
under slow-paced traumatic stress may differ from resilience in the face of rapid catastrophic
trauma.
One selling point of case study analysis is its latitude for nuanced assessment of
complex concepts like resilience. Such latitude permits distinct gauges for different aspects
of a multi-faceted concept. For example, assessment might determine that those who study
diligently, seek out help, come to class prepared and participate fully are “good students,”
even if they do poorly on exams. In a similar vein, vignette 2 demonstrate’s LC’s resilience,
even when quantified measures of his health show weak performance relative to those of the
general public.
In the case study framework that follows, I take advantage of the latitude of case
study analysis to propose questions and assessment measures of resilience unavailable to
aggregate quantitative analysis due to lack of systematically collected and available data. The
framework applies to disturbances of either the shock or slow burn type, and can assess

14
resilience either in regions overall or instead to particular regional dimensions, such as social,
environmental, or economic sub-systems.
III. A Framework for Assessing Regional Resilience
From the literature review and summary, I define regional resilience as the ability of
a region to anticipate, prepare for, respond to and recover from a disturbance. Figure
1 outlines a framework reflecting this definition.
The framework posits two types of resilience, preparation resilience, comprised of
two stages of regional assessment and readiness, and performance resilience, comprised of
two stages of event response and recovery. While the framework suggests for convenience a
starting point at the assessment stage, as a practical matter the stages of resilience
2. Readiness
1. Assessment
4. Recovery
3. Response
Preparation Resilience
Performance Resilience
Figure 1. Framework for Assessing Regional Resilience

15
preparation and performance are continual and overlapping for different regional
dimensions (such as physical infrastructure, social systems and governance, with assessment
and readiness focused on one dimension potentially coinciding with activities of response
and recovery on others.
A key facet of the framework is recognizing that a region could perform poorly or
well at each stage. For example, a region might get high marks for preparation resilience,
carefully coordinating information gathering, appropriately assessing and communicating
vulnerabilities and strengths, mobilizing and empowering actors and organizations to address
system gaps or weaknesses, and training and drilling to address potential stresses and crises.
Despite that preparation, the region may get low marks in performance resilience,
responding relatively poorly and failing to recover from an event or condition. Such an
outcome may occur if a region is overwhelmed by factors beyond its control or if its
capacities are simply weak. In contrast, a region might have weak performance resilience,
failing to assess conditions and consciously plug gaps, yet still exhibit high performance
resilience relative to other places faced with similar circumstances.

16
Figure 2 simplifies the possibility set faced by regions into two phases of preparation
and resilience.
Only with conscious preparation (assessment and readiness) and performance
(response and recovery) are regions judged to achieve an ideal, intentional resilience. Each
of the other cells in the matrix suggests a form of resilience that falls short of intentional
resilience. Regions that respond and recover well, but do so despite lack of assessment and
preparation have achieved what I’ll label ephemeral resilience. They are lucky this time
and perhaps will be next time due to strong endowments or good fortune, but cannot expect
to sustain that luck without deliberate regional attention to assessment and readiness
preparation. In contrast, regions that deliberately assess vulnerabilities and strengths and
succeed in readying themselves for high-consequence risks, but nonetheless fall shy in
performing in the face of a disturbance exhibit what I’ll label ineffectual resilience. These
regions did all they could to prepare for shocks and disturbance, but were ineffective in
Weak Strong
Wea
kSt
rong
PerformanceResilience
Preparation Resilience
Neglectful Resilience
Intentional Resilience
Ephemeral Resilience
Ineffectual Resilience
Fig. 2. Regional Resilience Matrix
17
responding to and recovering from traumas when they came. Finally, regions that fail to
prepare and subsequently perform poorly in the face of challenges display neglectful
resilience. Their inattention to or poor performance at assessment and readiness
contributed to predictably poor outcomes.
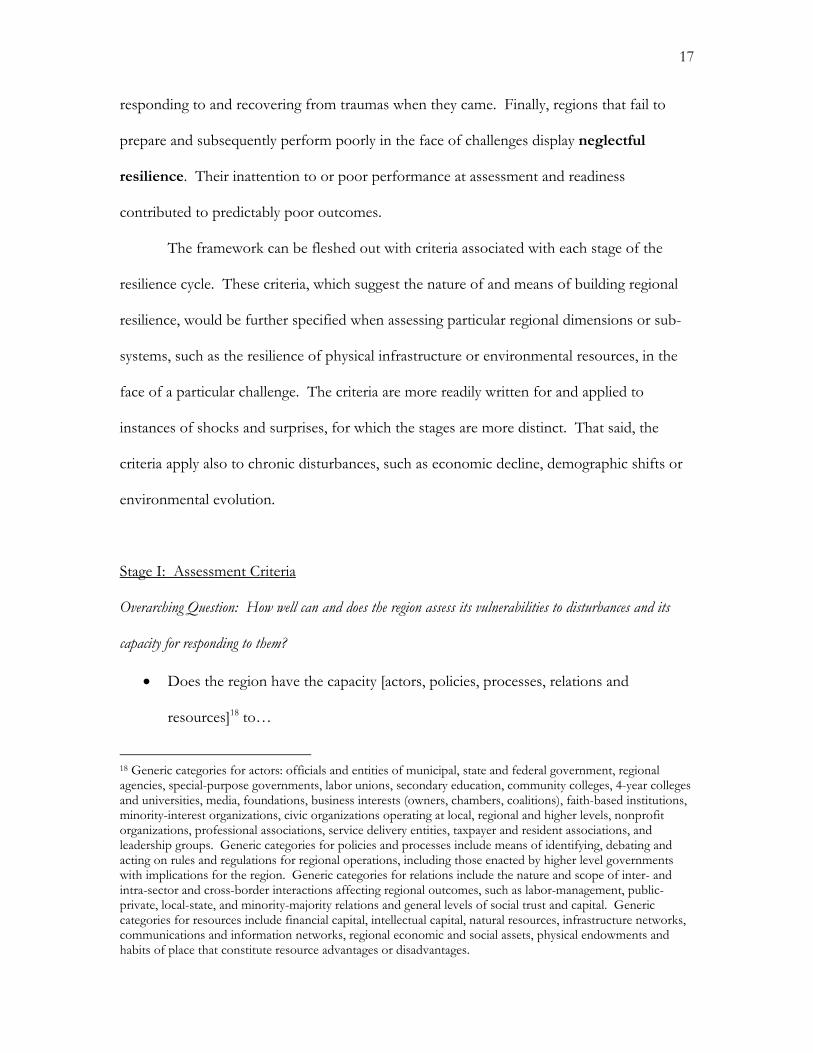
The framework can be fleshed out with criteria associated with each stage of the
resilience cycle. These criteria, which suggest the nature of and means of building regional
resilience, would be further specified when assessing particular regional dimensions or sub-
systems, such as the resilience of physical infrastructure or environmental resources, in the
face of a particular challenge. The criteria are more readily written for and applied to
instances of shocks and surprises, for which the stages are more distinct. That said, the
criteria apply also to chronic disturbances, such as economic decline, demographic shifts or
environmental evolution.
Stage I: Assessment Criteria
Overarching Question: How well can and does the region assess its vulnerabilities to disturbances and its
capacity for responding to them?
• Does the region have the capacity [actors, policies, processes, relations and
resources]18 to…
18 Generic categories for actors: officials and entities of municipal, state and federal government, regional agencies, special-purpose governments, labor unions, secondary education, community colleges, 4-year colleges and universities, media, foundations, business interests (owners, chambers, coalitions), faith-based institutions, minority-interest organizations, civic organizations operating at local, regional and higher levels, nonprofit organizations, professional associations, service delivery entities, taxpayer and resident associations, and leadership groups. Generic categories for policies and processes include means of identifying, debating and acting on rules and regulations for regional operations, including those enacted by higher level governments with implications for the region. Generic categories for relations include the nature and scope of inter- and intra-sector and cross-border interactions affecting regional outcomes, such as labor-management, public-private, local-state, and minority-majority relations and general levels of social trust and capital. Generic categories for resources include financial capital, intellectual capital, natural resources, infrastructure networks, communications and information networks, regional economic and social assets, physical endowments and habits of place that constitute resource advantages or disadvantages.
18
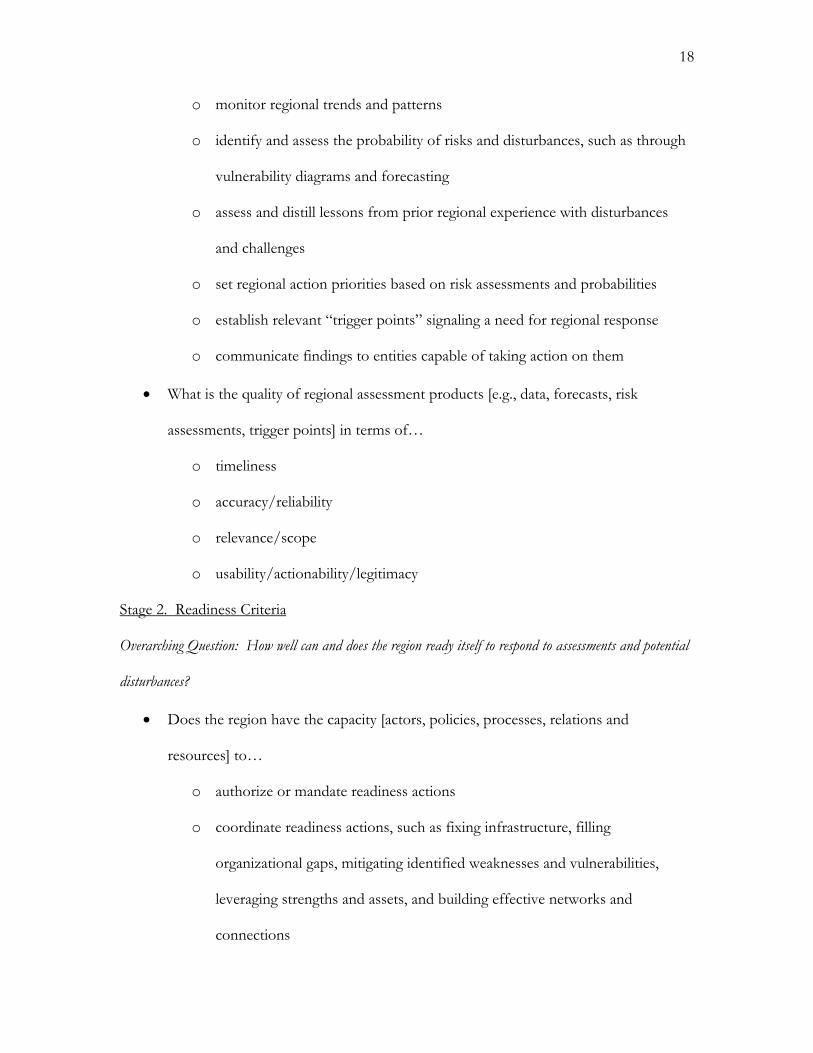
o monitor regional trends and patterns
o identify and assess the probability of risks and disturbances, such as through
vulnerability diagrams and forecasting
o assess and distill lessons from prior regional experience with disturbances
and challenges
o set regional action priorities based on risk assessments and probabilities
o establish relevant “trigger points” signaling a need for regional response
o communicate findings to entities capable of taking action on them
• What is the quality of regional assessment products [e.g., data, forecasts, risk
assessments, trigger points] in terms of…
o timeliness
o accuracy/reliability
o relevance/scope
o usability/actionability/legitimacy
Stage 2. Readiness Criteria
Overarching Question: How well can and does the region ready itself to respond to assessments and potential
disturbances?
• Does the region have the capacity [actors, policies, processes, relations and
resources] to…
o authorize or mandate readiness actions
o coordinate readiness actions, such as fixing infrastructure, filling
organizational gaps, mitigating identified weaknesses and vulnerabilities,
leveraging strengths and assets, and building effective networks and
connections

19
o implement readiness actions
• What is the quality of regional readiness in terms of….
o redundancy built into system
o flexibility built into system
o inter-actor and inter-policy relations and connections
o effectiveness of readiness drills and other forms of practice
o actual level of readiness of infrastructure, resources, policies, assets to
respond to disturbance
o leadership and training levels to respond to disturbance
Stage 3. Response Criteria
Overarching Question: How effectively, in absolute and relative terms, does the region respond to actual
disturbances?
• How well does the region respond in terms of …
o reacting at appropriate level to disturbance (e.g., not under- or overreacting)
o containing and minimizing physical, economic and social damage and other
negative outcomes resulting from disturbance
o sustaining viable, cost-effective levels of service delivery
o leveraging and using effectively networks of internal and external relations
o demonstrating effective leadership in authorizing, coordinating,
communicating and taking action to respond to disturbance
o performing capably relative to other places that have faced similar
disturbances
o framing the nature and response to the disturbance in media and other
communications outlets
20
Stage 4. Recovery Criteria
Overarching Question: How effectively, in absolute and relative terms, does the region recover from the
disturbance and learn from its lessons and insights?
• How well does the region recover from disturbance in terms of …
o repairing systems damaged in the disturbance
o the rapidity of return to expected levels of regional functioning
o the quality of back-up systems needed to bridge recovery period
• How effectively does the region learn from and adapt to the experience in terms
of…
o distilling lessons and insights to improve systems for next disturbance
o framing the discussion to usefully learn from the experience of regional
assessment, readiness, response and recovery
o taking action to adapt, repair or change regional systems [e.g., actors, policies,
processes, relations, resources] to build resilience for new disturbance
IV. Testing the Framework: Resilience in the Face of Economic Decline in Buffalo-
Niagara Falls Metropolitan Area, 1970-2000
To test the four-part framework I’ll use the case of a chronic disturbance, namely
prolonged economic decline in the Buffalo-Niagara Falls Metropolitan Area from 1970 to
the present. This era of decline followed more than a century of economic vitality, one
shaping the region’s identity, infrastructure, and institutions. Challenges to regional
economic potency had been evident from at least the mid 20th century, however,19so the case
19 A number of observers peg downturns from much earlier in the century. John Henry Schlegel in an unpublished 2005 paper, “Like Crabs in a Barrel: Economy, History and Redevelopment in Buffalo,” puts the turning point at 1916 when “America’s railroad system […] registered the first decrease in active trackage since

21
provides an opportunity to assess not only regional performance, but also the region’s
effectiveness in anticipating and readying itself for difficult economic times.
As noted, chronic disturbances are less readily divided into four distinct resilience
stages since a region is simultaneously assessing, readying, responding and recovering from
aspects of the chronic condition. Rather than start with the assessment stage of the
resilience cycle, then, I begin at the third stage of response to establish the degree of
economic decline in absolute and relative terms. I then examine how well the region
recovered from two decades of decline before considering how it anticipated and readied
itself for hard times. While the case demonstrates the higher degree of difficulty in applying
the framework to chronic conditions rather than discrete shocks, it also shows the
framework’s ability to reveal sources of resilience failure as well as the type of resilience---
intentional, ineffectual, ephemeral or neglectful---best characterizing a region.
1830” (p.5). Mark Goldman in High Hopes: The Rise and Decline of Buffalo, New York (State University of New York Press, points to the acquisition of local steel, grain, automobile, banking, newspaper and other industrial enterprises by corporations outside the region during the 1920s as the region’s “seeds of decay.” There is ample evidence that regional leaders through the 1930s and 1940s understood the potential economic blow of the proposed St. Lawrence Seaway, which would bypass Buffalo and greatly erode its longstanding economic significance as a break of bulk point for Great Lakes shipping. Despite their concerted multi-decade efforts in Washington D.C. and beyond to block the project, however, regional leaders eventually lost to stronger U.S. and Canadian interests. The St. Lawrence Seaway opened in 1959 bringing the anticipated steep declines in regional shipping activity. For more, see Kathryn A. Foster. 1996. “Planning Without Plans: Evolution of Regional Planning on the Niagara Frontier. Intersight 5: 13-16. For present purposes, it’s sufficient to focus on the recent decades and acknowledge simply that there were visible cracks in the economic picture window to challenge the assessment faculties of regional leaders.
22
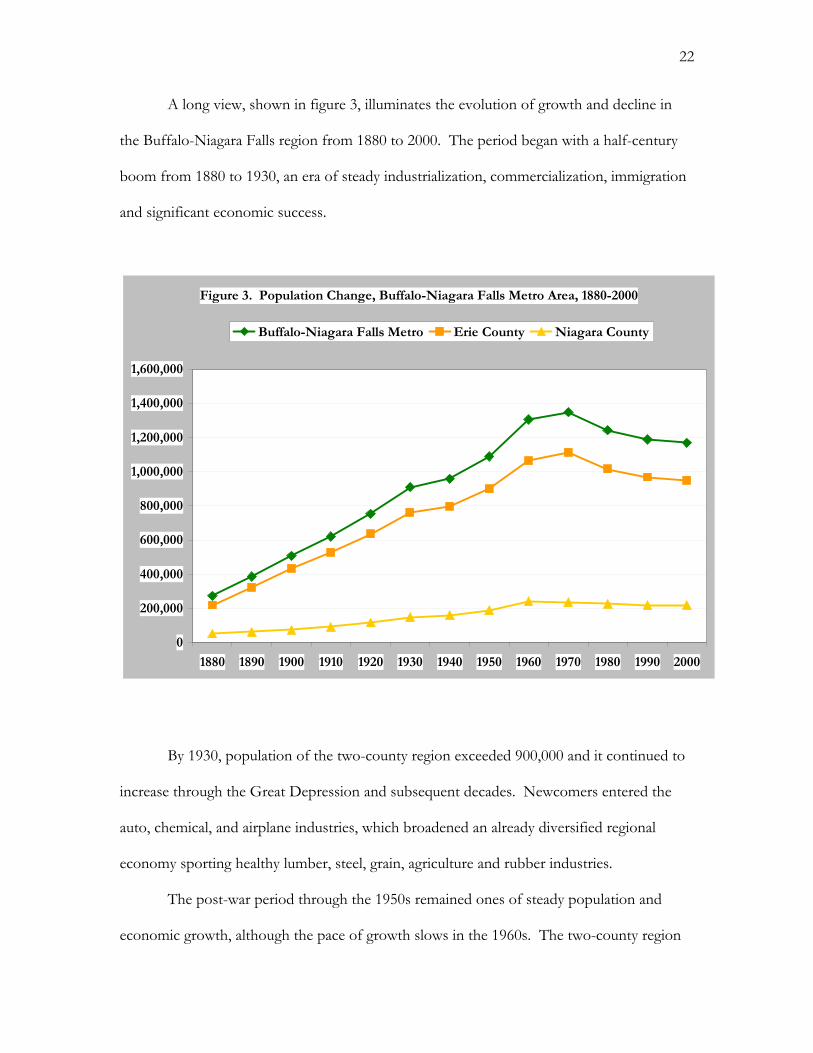
A long view, shown in figure 3, illuminates the evolution of growth and decline in
the Buffalo-Niagara Falls region from 1880 to 2000. The period began with a half-century
boom from 1880 to 1930, an era of steady industrialization, commercialization, immigration
and significant economic success.
By 1930, population of the two-county region exceeded 900,000 and it continued to
increase through the Great Depression and subsequent decades. Newcomers entered the
auto, chemical, and airplane industries, which broadened an already diversified regional
economy sporting healthy lumber, steel, grain, agriculture and rubber industries.
The post-war period through the 1950s remained ones of steady population and
economic growth, although the pace of growth slows in the 1960s. The two-county region
Figure 3. Population Change, Buffalo-Niagara Falls Metro Area, 1880-2000
0
200,000
400,000
600,000
800,000
1,000,000
1,200,000
1,400,000
1,600,000
1880 1890 1900 1910 1920 1930 1940 1950 1960 1970 1980 1990 2000
Buffalo-Niagara Falls Metro Erie County Niagara County
23
reached a metropolitan population peak of 1.35 million people in 1970 after which it
declined steadily—a relatively rare phenomenon for U.S. metropolitan areas--to the 2000
level of 1.17 million population.
How relatively resilient was the region’s performance during this 30 year period of
decline, that is, how well did it navigate stages 3 (response) and 4 (recovery) of the resilience
cycle? To allow the potential for assessing within this case both the response and recovery
stages of resilience, I’ll label the 1970s and 1980s, during which the nation experienced
relatively slow economic growth and periods of recession, as the period of response. The
1990s, a period of general national prosperity, will serve as the decade of recovery.
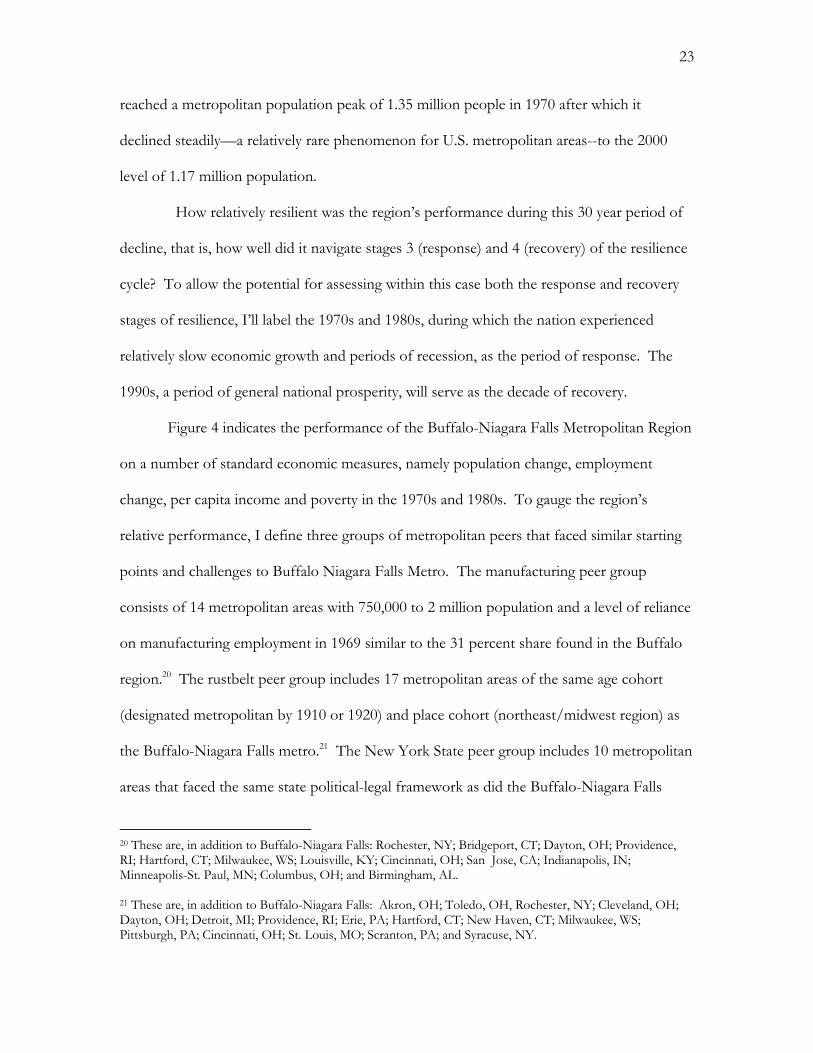
Figure 4 indicates the performance of the Buffalo-Niagara Falls Metropolitan Region
on a number of standard economic measures, namely population change, employment
change, per capita income and poverty in the 1970s and 1980s. To gauge the region’s
relative performance, I define three groups of metropolitan peers that faced similar starting
points and challenges to Buffalo Niagara Falls Metro. The manufacturing peer group
consists of 14 metropolitan areas with 750,000 to 2 million population and a level of reliance
on manufacturing employment in 1969 similar to the 31 percent share found in the Buffalo
region.20 The rustbelt peer group includes 17 metropolitan areas of the same age cohort
(designated metropolitan by 1910 or 1920) and place cohort (northeast/midwest region) as
the Buffalo-Niagara Falls metro.21 The New York State peer group includes 10 metropolitan
areas that faced the same state political-legal framework as did the Buffalo-Niagara Falls
20 These are, in addition to Buffalo-Niagara Falls: Rochester, NY; Bridgeport, CT; Dayton, OH; Providence, RI; Hartford, CT; Milwaukee, WS; Louisville, KY; Cincinnati, OH; San Jose, CA; Indianapolis, IN; Minneapolis-St. Paul, MN; Columbus, OH; and Birmingham, AL. 21 These are, in addition to Buffalo-Niagara Falls: Akron, OH; Toledo, OH, Rochester, NY; Cleveland, OH; Dayton, OH; Detroit, MI; Providence, RI; Erie, PA; Hartford, CT; New Haven, CT; Milwaukee, WS; Pittsburgh, PA; Cincinnati, OH; St. Louis, MO; Scranton, PA; and Syracuse, NY.
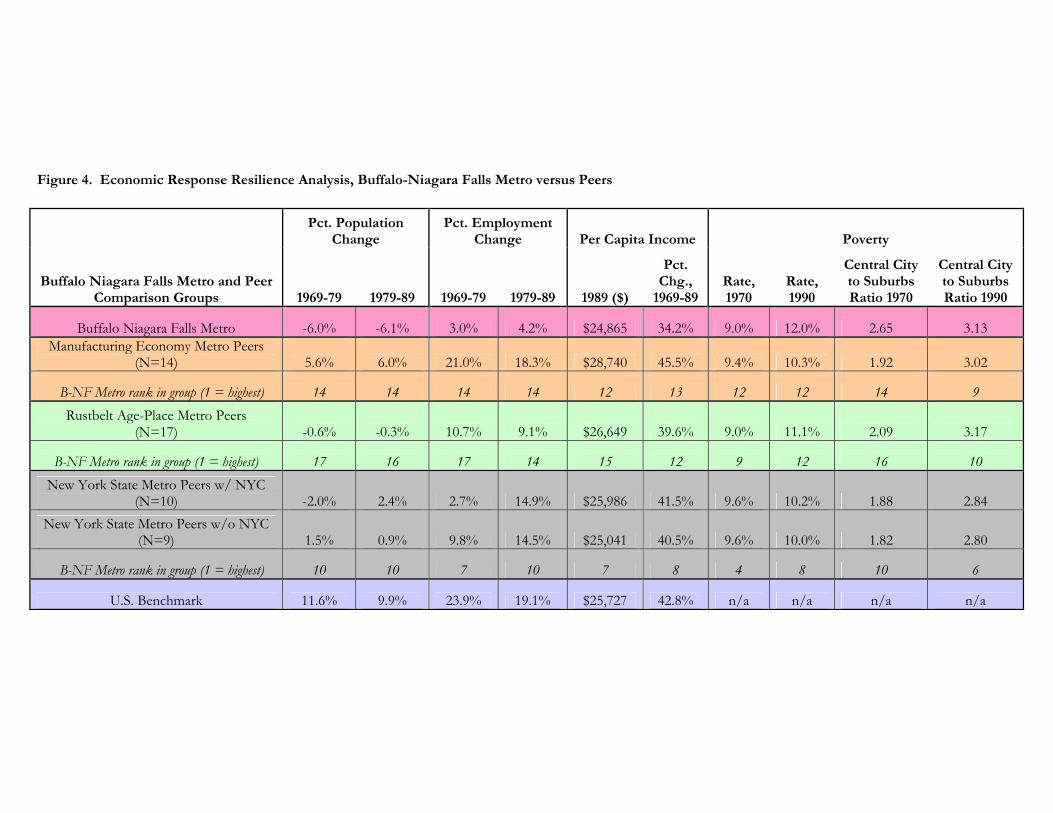
Figure 4. Economic Response Resilience Analysis, Buffalo-Niagara Falls Metro versus Peers
Pct. Population
Change Pct. Employment
Change Per Capita Income Poverty
Buffalo Niagara Falls Metro and Peer Comparison Groups 1969-79 1979-89 1969-79 1979-89 1989 ($)
Pct. Chg.,
1969-89Rate, 1970
Rate, 1990
Central City to Suburbs Ratio 1970
Central City to Suburbs Ratio 1990
Buffalo Niagara Falls Metro -6.0% -6.1% 3.0% 4.2% $24,865 34.2% 9.0% 12.0% 2.65 3.13 Manufacturing Economy Metro Peers
(N=14) 5.6% 6.0% 21.0% 18.3% $28,740 45.5% 9.4% 10.3% 1.92 3.02
B-NF Metro rank in group (1 = highest) 14 14 14 14 12 13 12 12 14 9 Rustbelt Age-Place Metro Peers
(N=17) -0.6% -0.3% 10.7% 9.1% $26,649 39.6% 9.0% 11.1% 2.09 3.17
B-NF Metro rank in group (1 = highest) 17 16 17 14 15 12 9 12 16 10 New York State Metro Peers w/ NYC
(N=10) -2.0% 2.4% 2.7% 14.9% $25,986 41.5% 9.6% 10.2% 1.88 2.84 New York State Metro Peers w/o NYC
(N=9) 1.5% 0.9% 9.8% 14.5% $25,041 40.5% 9.6% 10.0% 1.82 2.80
B-NF Metro rank in group (1 = highest) 10 10 7 10 7 8 4 8 10 6
U.S. Benchmark 11.6% 9.9% 23.9% 19.1% $25,727 42.8% n/a n/a n/a n/a
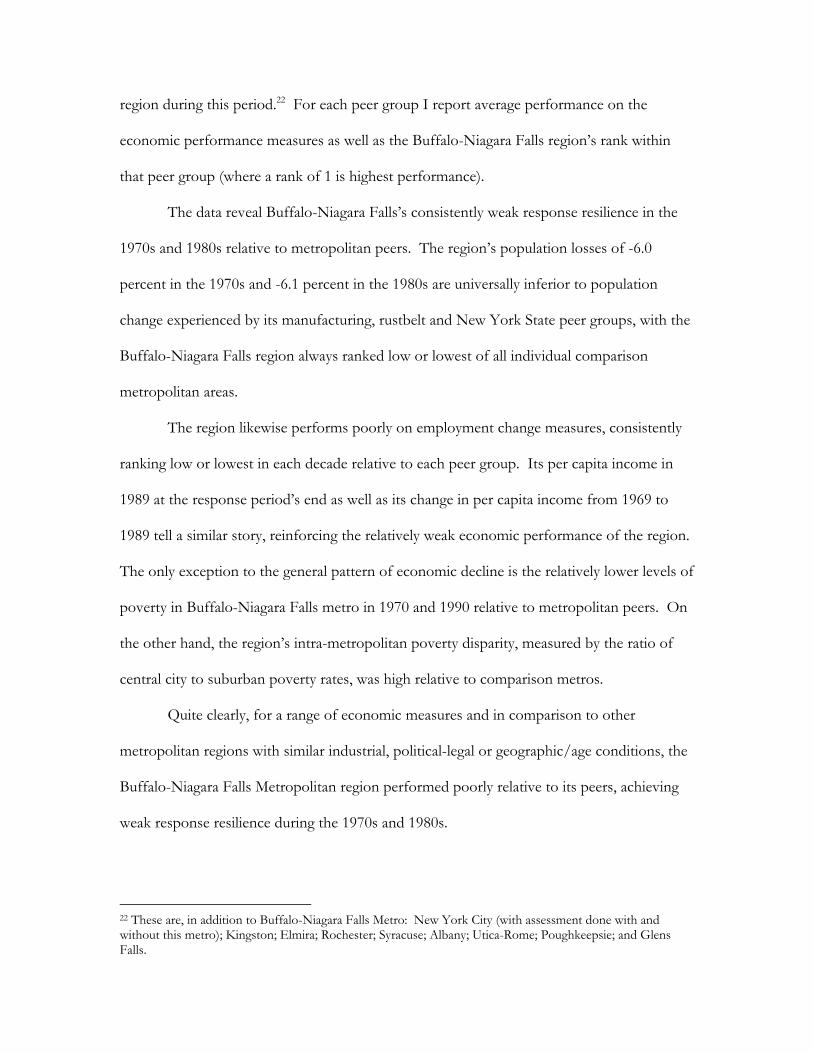
region during this period.22 For each peer group I report average performance on the
economic performance measures as well as the Buffalo-Niagara Falls region’s rank within
that peer group (where a rank of 1 is highest performance).
The data reveal Buffalo-Niagara Falls’s consistently weak response resilience in the
1970s and 1980s relative to metropolitan peers. The region’s population losses of -6.0
percent in the 1970s and -6.1 percent in the 1980s are universally inferior to population
change experienced by its manufacturing, rustbelt and New York State peer groups, with the
Buffalo-Niagara Falls region always ranked low or lowest of all individual comparison
metropolitan areas.
The region likewise performs poorly on employment change measures, consistently
ranking low or lowest in each decade relative to each peer group. Its per capita income in
1989 at the response period’s end as well as its change in per capita income from 1969 to
1989 tell a similar story, reinforcing the relatively weak economic performance of the region.
The only exception to the general pattern of economic decline is the relatively lower levels of
poverty in Buffalo-Niagara Falls metro in 1970 and 1990 relative to metropolitan peers. On
the other hand, the region’s intra-metropolitan poverty disparity, measured by the ratio of
central city to suburban poverty rates, was high relative to comparison metros.
Quite clearly, for a range of economic measures and in comparison to other
metropolitan regions with similar industrial, political-legal or geographic/age conditions, the
Buffalo-Niagara Falls Metropolitan region performed poorly relative to its peers, achieving
weak response resilience during the 1970s and 1980s.
22 These are, in addition to Buffalo-Niagara Falls Metro: New York City (with assessment done with and without this metro); Kingston; Elmira; Rochester; Syracuse; Albany; Utica-Rome; Poughkeepsie; and Glens Falls.

26
Before suggesting several explanations for this performance, I consider how well the
Buffalo-Niagara Falls metro and peer metros did in the 1990s to recover from two decades
of chronic economic decline. Figure 5 provides economic indicator data for the region and
comparison groups for the 1990s recovery period.
Immediately evident is that the Buffalo-Niagara Falls Metro’s population growth,
economic growth, per capita income and poverty measures remained generally inferior to
those of each peer metropolitan comparison group. Even poverty levels, the only measure
for which the Buffalo-Niagara Falls Metro had seen outcomes somewhat better than its
peers in 1969 to 1989, rose more rapidly in the 1990s than those of comparison metros. By
2000, the Buffalo-Niagara Falls region’s poverty levels exceeded those of its peers and its
intra-metropolitan disparities were higher than those of any comparison group. The region’s
recovery resilience was evidently weak compared to its peer metropolitan areas.
The framework criteria provide a means for understanding why the region fared so
poorly in responding and recovering from economic decline. Did the region fail to properly
assess, anticipate or perceive its economic conditions? If not---that is, if the region was
reasonably well informed about its economic conditions---did it have sufficient resources to
respond and implement recovery efforts? Did it follow through to mitigate economic
weaknesses, establish systems and networks for economic recovery, and formulate and
implement policies and processes to respond to economic conditions? If it did all these
things and still performed poorly, were its response efforts perhaps flawed by over- or
under-reaction, weak leadership, poor internal or external relations or counterproductive
stories used to frame regional economic decline? If such causes of low resilience are not
evident, might it be that the region did all it could, but that economic problems simply
outweighed any potential solutions?
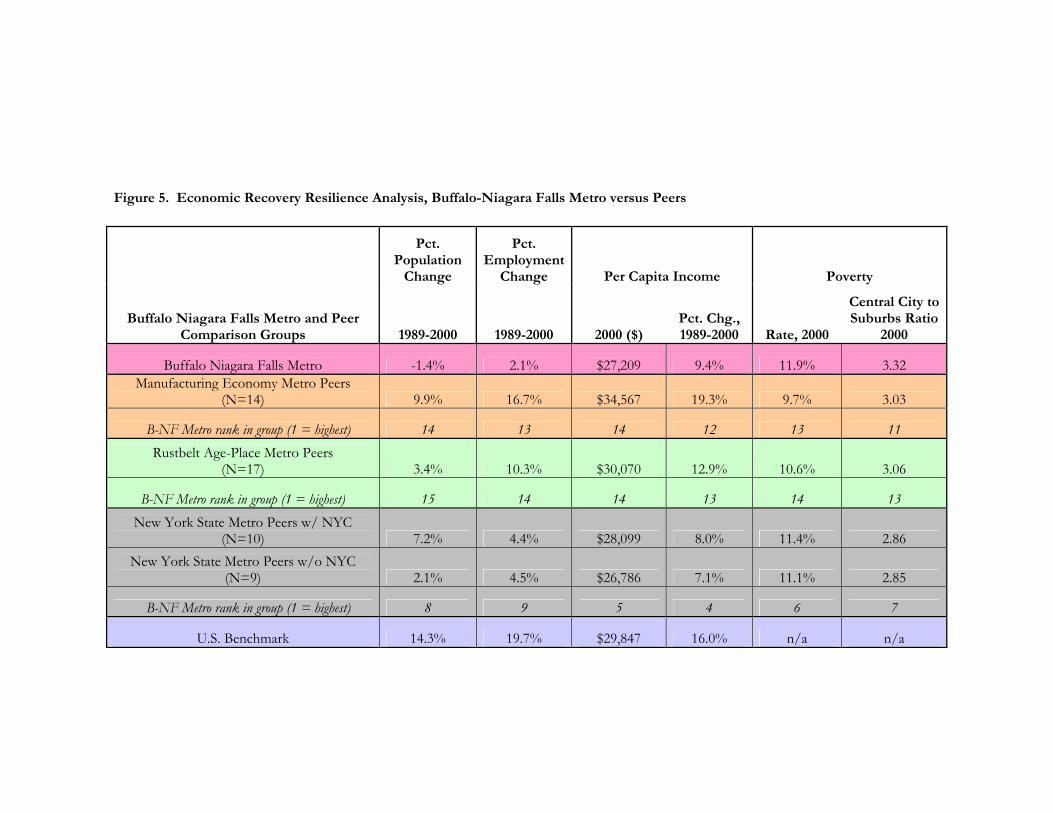
Figure 5. Economic Recovery Resilience Analysis, Buffalo-Niagara Falls Metro versus Peers
Pct. Population
Change
Pct. Employment
Change Per Capita Income Poverty
Buffalo Niagara Falls Metro and Peer Comparison Groups 1989-2000 1989-2000 2000 ($)
Pct. Chg., 1989-2000 Rate, 2000
Central City to Suburbs Ratio
2000
Buffalo Niagara Falls Metro -1.4% 2.1% $27,209 9.4% 11.9% 3.32 Manufacturing Economy Metro Peers
(N=14) 9.9% 16.7% $34,567 19.3% 9.7% 3.03
B-NF Metro rank in group (1 = highest) 14 13 14 12 13 11 Rustbelt Age-Place Metro Peers
(N=17) 3.4% 10.3% $30,070 12.9% 10.6% 3.06
B-NF Metro rank in group (1 = highest) 15 14 14 13 14 13 New York State Metro Peers w/ NYC
(N=10) 7.2% 4.4% $28,099 8.0% 11.4% 2.86 New York State Metro Peers w/o NYC
(N=9) 2.1% 4.5% $26,786 7.1% 11.1% 2.85
B-NF Metro rank in group (1 = highest) 8 9 5 4 6 7
U.S. Benchmark 14.3% 19.7% $29,847 16.0% n/a n/a

Analysis of regional activity during the era of economic decline suggests that low
resilience stemmed from a combination of flawed action (rather than inaction) and
overwhelmingly difficult economic conditions aggravated by regional institutional culture,
structural choices and relations. It would take a fuller case study to flesh out these themes,
but in this pilot case I provide an overview to imply the potential for case study analysis of
regional resilience.
I will start with the assessment and anticipation stage. It would be impossible to read
the record and conclude that paralysis or inaction shaped resilience outcomes or that the
region could not or did not assess its economic conditions during the period of decline.
Rather, the region made significant effort to understand economic forces and trends and
dozens of economic analyses shined light on the economy overall and its specific sectors.23
These analyses came from both public and private sources---in many cases conducted by
respected external consultants---and were widely disseminated. Supplementing these studies
were daily insights on business and economic issues and events offered by The Buffalo News
and, until its demise in 1982, the Courier Express, the region’s two metropolitan newspapers.
The weak performance resilience was also not due to conflicting regional economic
prescriptions. While the depth and quality of economic reports inevitably varied, the studies
and plans were remarkably consistent in their conclusions about economic trends, regional
economic assets (location, labor force, quality of life, manufacturing prowess), weaknesses 23 A small selection suggests the range: Greater Buffalo Development Foundation. 1972. Buffalo Area’s Economic Prospects: A Growth Strategy for the Erie Niagara Area. (Buffalo, NY: Greater Buffalo Development Foundation; Fry Consultants. 1978. “Strategy for the Development of High Technology Growth Industry in Erie County and the City of Buffalo, NY.” (Buffalo, NY: Erie County Industrial Development Agency); Economic Development Coordinating Committee. 1988. “Planning Together: The Greater Buffalo Economic Development Strategy Agenda.” (Buffalo, NY: EDCC); Economic Development Coordinating Committee. 1988. Working Together: Projects in the Greater Buffalo Economic Development Strategy Agenda. (Buffalo, NY: EDCC); Dennis Gorski. 1998. “Preparing for a New Century in a Changing World: An Action Plan for Regional Job Creation and Smart Growth.” Buffalo, NY: Erie County; Niagara County Department of Planning, Development and Tourism. 2000. “Comprehensive Economic Development Strategy.” Lockport, NY: Niagara County; New York State Assembly Ways and Means Committee. 2000. “Regional Economic Profile of Western New York.” (Albany, NY: Assembly Ways and Means Committee).
29
(loss of population, depressed productivity, fragmented economic governance, scarcity of
headquartered firms and attendant civic leadership, limited venture capital, poor image and
excessive politics), opportunities (waterfront, university high tech expansion, downtown
development, international border location, selected industrial sectors including tourism and
transportation logistics) and threats (foreign competition, further reductions in
manufacturing sectors, loss of productive population, scarce fiscal resources, increasing tax
burdens). Moreover, the assessments drew on timely and reliable data and often offered
practical agendas for specific action.
One effort of the late 1980s exemplifies both the action orientation and cross-sector
nature of regional economic assessment. Completed in 1988 by the Economic
Development Coordinating Council (EDCC)---a cross-sector consortium of leaders from
the Western New York Economic Development Corporation (public), Greater Buffalo
Development Foundation (private), Greater Buffalo Chamber of Commerce (private),
Niagara Frontier Transportation Authority (public), State University of New York at Buffalo
(academic, public) and Erie County Industrial Development Agency (public)---identified and
provided financial and governance specifications for 83 projects and initiatives the authors
believed would “be good for economic development in the Greater Buffalo area.”24
For three reasons, the region’s adeptness in the assessment stage was not sustained in
the readiness and response stages. This is not because of inaction, however. Numerous of
the 83 projects or initiatives called for in the 1988 report, including modernization of the
airport and bus system, construction of light industrial parks, completion of academic
facilities at the university, hosting a major international event [the World University Games
in 1993], developing a high-tech corridor in downtown Buffalo, completing the Theater 24 Economic Development Coordinating Council, Working Together, p. 1
30
District redevelopment, and beautifying the pedestrian mall downtown, were completed or
well underway a decade later.
That said, regional response was comparatively tepid. The first hindrance to
resilience was the region’s lack of a structure and process for vetting and legitimizing
assessments, consensually setting priorities emerging from them, and coordinating,
mandating or advancing follow-through actions. This was not a problem of missing or
incapable economic agencies, but, rather, a complication of the multiplicity of economic
development agencies operating in the region. The six members of the Economic
Development Coordinating Council were a small sample of the alphabet soup of dozens of
economic entities serving the region during the era.25 Many independent agencies operating
without authority to advance regional projects and without a mandate to cooperate
aggravated the already difficult mission of forging a unified regional vision and development
goals. Fragmentation of economic governance also hampered coordination, duplicated
services, required high administrative and overhead costs, and diverted attention as regional
media and leaders spent time framing and debating the pros and cons of a regional economic
“super-agency” rather than spending time attracting and retaining firms.26
25 Also in the picture were six industrial development agencies (some operating at the municipal scale), numerous chambers of commerce, several similarly empowered but legally separate city and county agencies (e.g., the Buffalo Economic Renaissance Corporation, the Buffalo Urban Renewal Agency and the Department of Economic Development), a handful of state entities with economic development powers, at least three convention and visitors bureaus, several high-tech business development organizations, and several ad hoc groups formed to shepherd specific development projects (e.g., the Metro Buffalo Alliance for Economic Development and the Northwest Buffalo Commercial Coalition). That wasn’t all: because of strong home rule powers and municipal control over planning and growth, virtually every city, town and village had some form of economic development committee working to spur jobs and create growth. The 1996 report by the University at Buffalo tallied 140 public and private agencies in Erie County alone engaged in job retention and training, economic development planning, marketing, productivity partnerships and provision of loans, bonds and other forms of financing for economic development. See University at Buffalo Governance Project. 1996. Governance in Erie County: A Foundation for Understanding and Action. Buffalo, NY: University at Buffalo, p. 129-133. 26 The EDCC, for example, while recognizing the potential of more centralized economic governance, noted that a “consolidation, merger or substitution…would be a daunting, time-consuming task.” See.Economic Development Coordinating Committee, “Planning Together,” p. 48.

31
A second hindrance to regional readiness resilience was longstanding intra-region
tensions and a culture of competition and distrust. As one report put it,
“Communication between the large economic development entities, public and private, is very poor, with a great deal of distrust and little, if any, source of agreeable regional strategic action. The GBP [Greater Buffalo Partnership, a merger of the former Greater Buffalo Development Foundation and Greater Buffalo Chamber of Commerce] is perceived as highly aggressive in its advisory role to local governments, but it lacks fiscal power. The Erie County IDA [Industrial Development Agency], with more fiscal resources, is perceived as equally aggressive, attempting to move into new areas, but without strong regional political support. The Amherst IDA, with its recent success at attracting new industries is perceived as a hostile neighbor by economic development officers in the City of Buffalo who are critical of attempts by suburban municipalities to attract not only new firms but also to allegedly lure city firms to relocate in their jurisdictions. In at least one case, charges and countercharges of unfair economic competition are being resolved through legal channels.27
A decades-old rift between Erie County and Niagara County resulted in 1990 in a
serious casualty, the demise of the region’s only cross-county entity, the Erie Niagara
Planning Board, just when its bicounty data compilation and analysis were most needed.28
Also problematic for regional economic strategy and action were tense relations between the
major central city of Buffalo and its suburban neighbors. The poorer, more racially diverse
city with its pugnacious and abrasive mayor (James Griffin who served from 1977 to 1993)
clashed continually with its more affluent very white suburbs over issues of economic
development.29 Government-business relations were often strained, manifesting on the one
hand as anti-government sentiment held by business leaders and on the other as resentment 27 University at Buffalo, Governance in Erie County, p. 140. 28 Foster, “Planning Without Plans,” p.54. 29 See discussions in University at Buffalo, Governance in Erie County; and Mark Goldman. 1990. City on the Lake: The Challenge of Change in Buffalo, New York. Amherst, NY: Prometheus Books, pp. 63-64.
32
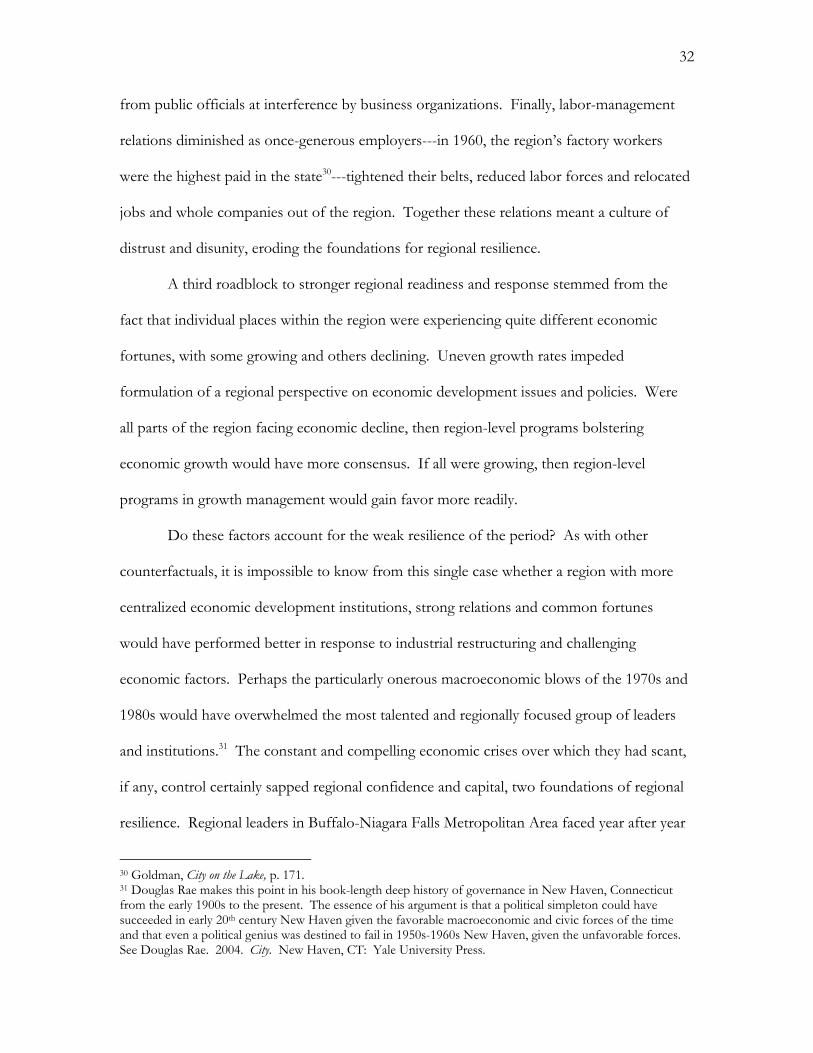
from public officials at interference by business organizations. Finally, labor-management
relations diminished as once-generous employers---in 1960, the region’s factory workers
were the highest paid in the state30---tightened their belts, reduced labor forces and relocated
jobs and whole companies out of the region. Together these relations meant a culture of
distrust and disunity, eroding the foundations for regional resilience.
A third roadblock to stronger regional readiness and response stemmed from the
fact that individual places within the region were experiencing quite different economic
fortunes, with some growing and others declining. Uneven growth rates impeded
formulation of a regional perspective on economic development issues and policies. Were
all parts of the region facing economic decline, then region-level programs bolstering
economic growth would have more consensus. If all were growing, then region-level
programs in growth management would gain favor more readily.
Do these factors account for the weak resilience of the period? As with other
counterfactuals, it is impossible to know from this single case whether a region with more
centralized economic development institutions, strong relations and common fortunes
would have performed better in response to industrial restructuring and challenging
economic factors. Perhaps the particularly onerous macroeconomic blows of the 1970s and
1980s would have overwhelmed the most talented and regionally focused group of leaders
and institutions.31 The constant and compelling economic crises over which they had scant,
if any, control certainly sapped regional confidence and capital, two foundations of regional
resilience. Regional leaders in Buffalo-Niagara Falls Metropolitan Area faced year after year
30 Goldman, City on the Lake, p. 171. 31 Douglas Rae makes this point in his book-length deep history of governance in New Haven, Connecticut from the early 1900s to the present. The essence of his argument is that a political simpleton could have succeeded in early 20th century New Haven given the favorable macroeconomic and civic forces of the time and that even a political genius was destined to fail in 1950s-1960s New Haven, given the unfavorable forces. See Douglas Rae. 2004. City. New Haven, CT: Yale University Press.

33
of economic blows over which they had scant, if any, control. Troublesome news in just the
single decade from 1978 to 1988 includes these challenging events:
• 1978: President Jimmy Carter declares a federal emergency in the 15-acre working class
Love Canal neighborhood in Niagara Falls, New York, the first manmade disaster to
receive this recognition; widespread national coverage of hazardous waste—in this
case, residue from a longstanding chemical industry--publicizes the legacy of an
industrial economy and puts the region in poor light
• 1979-1982: nation suffers strong recession; regional unemployment rates jump to over
11 percent
• 1982: the Courier Express, a major region-serving newspaper dating back to 1834,
abruptly ceases publication, leaving the region with a single metropolitan daily
• 1983: Bethlehem Steel ends steelmaking at its Lackawanna plant, eliminating 17,000 jobs
in one action; previous and subsequent decline in the region’s steel and related
industries will mean a loss between 1977 and 1987 of over 45,000 manufacturing
jobs, nearly one-third of the region’s total manufacturing sector
• 1985: Light rail opens on Buffalo’s Main Street; during the six years it took to complete
the project, many downtown businesses suffered closure or relocation
Trico, the world’s largest manufacturer of windshield wipers and a deeply rooted
home-grown company founded in Buffalo in 1917, announces relocation of all
operations to a facility on the Texas-Mexico border
34
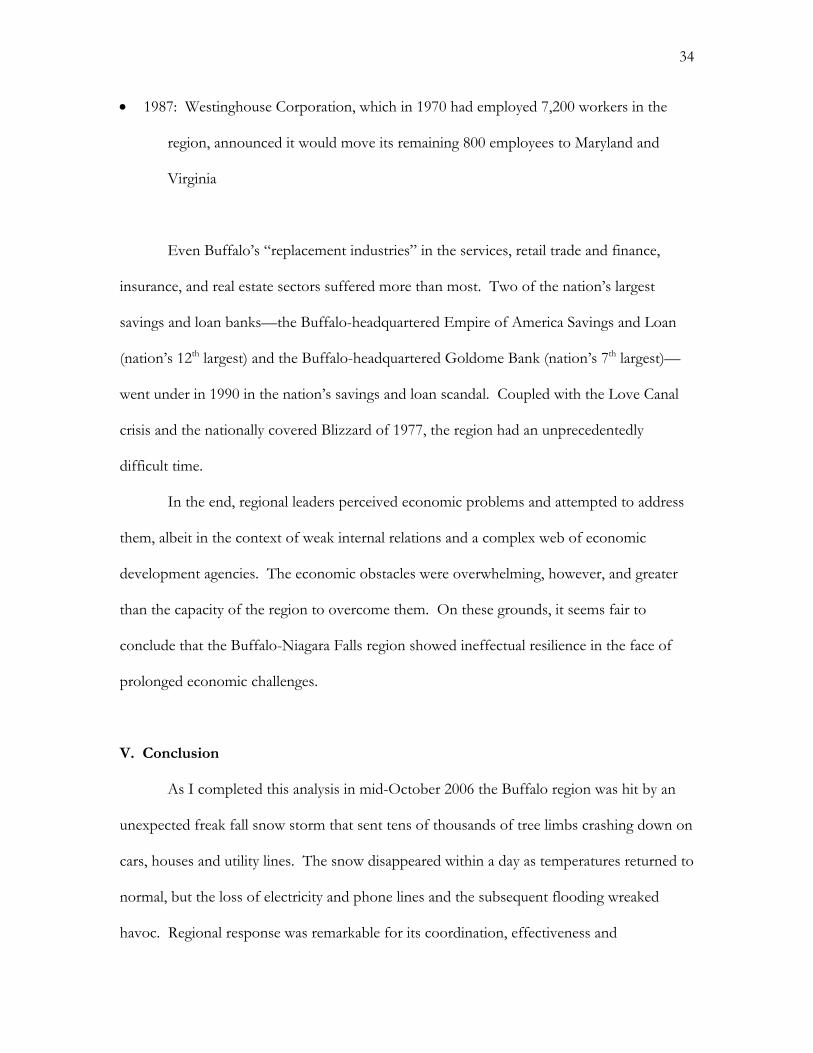
• 1987: Westinghouse Corporation, which in 1970 had employed 7,200 workers in the
region, announced it would move its remaining 800 employees to Maryland and
Virginia
Even Buffalo’s “replacement industries” in the services, retail trade and finance,
insurance, and real estate sectors suffered more than most. Two of the nation’s largest
savings and loan banks—the Buffalo-headquartered Empire of America Savings and Loan
(nation’s 12th largest) and the Buffalo-headquartered Goldome Bank (nation’s 7th largest)—
went under in 1990 in the nation’s savings and loan scandal. Coupled with the Love Canal
crisis and the nationally covered Blizzard of 1977, the region had an unprecedentedly
difficult time.
In the end, regional leaders perceived economic problems and attempted to address
them, albeit in the context of weak internal relations and a complex web of economic
development agencies. The economic obstacles were overwhelming, however, and greater
than the capacity of the region to overcome them. On these grounds, it seems fair to
conclude that the Buffalo-Niagara Falls region showed ineffectual resilience in the face of
prolonged economic challenges.
V. Conclusion
As I completed this analysis in mid-October 2006 the Buffalo region was hit by an
unexpected freak fall snow storm that sent tens of thousands of tree limbs crashing down on
cars, houses and utility lines. The snow disappeared within a day as temperatures returned to
normal, but the loss of electricity and phone lines and the subsequent flooding wreaked
havoc. Regional response was remarkable for its coordination, effectiveness and

35
cooperation in the face of immense damage to utility grids and properties. In comparison to
its performance in addressing chronic economic decline, the Buffalo region is showing
impressive resilience. Like the subjects of the vignettes that began this paper, the region
capably did what it had to do to contain damage, keep up regional spirits and pave the way
for rapid recovery.
The challenge of assessing resilience stems from the concept’s multifaceted nature.
People or places capable of coping with one kind of crisis in one moment may succumb to
another trauma another time. That Buffalo can resolutely face a natural disaster and its after
effects with relative aplomb but not its decades of economic decline speaks to the
complexities of resilience and place.
This paper draws several conclusions from the case study approach in general and
the Buffalo case in particular. First, the case study framework shows promise in offering
insights on the nature and assessment of resilience. Positing resilience as a four-stage cycle
permits independent evaluation of key aspects of resilience---assessment, readiness, response
and recovery---and allows regions to perform well on some and poorly on others.
That said, the single case, as opposed to comparative cases, may be problematic in
assessing resilience. There are limits to what we can conclude from evaluating resilience
performance in the Buffalo-Niagara Falls region. Like the cases of MM, LC and Fixx that
led the paper, the demonstration of resilience is established in part by understanding how
well the region did relative to other places with similar starting places. The analyses in
figures 4 and 5 comparing the Buffalo region to several peer groups of metropolitan regions
imply the value of such relative assessment. These make clear that Buffalo performed less
well than peer groups with similar economic, geographic and legal contexts, which suggests
the significance of governance and leadership choices in shaping regional resilience

36
outcomes. Indeed, the single case reveals the significance of qualitative factors such as
internal and external relations, levels of coordination and collaboration, and the byproducts
of regional structure as important determinants of regional resilience, factors discerned best
through a case study approach. Measuring and assessing such factors for a small set of
comparison metro cases seems warranted.
Another finding is the seemingly trickier challenge of understanding and assessing
resilience for chronic, rather than acute, regional disturbances. Chronic disturbances lend
themselves less than one-time shocks to a tidy four-part resilience cycle. Because prolonged
conditions like decline and demographic change occur continuously, so do the stages of the
resilience framework. One option may be to reformulate the assessment criteria to address
slow burn traumas. Another may be to retain the proposed criteria, but find ways to
consider the criteria as a package rather than sequentially in stages as proposed.
The work also implies the underestimated significance of external factors in
determining regional resilience outcomes. The Buffalo-Niagara Falls region has fallen
further and longer than its peer regions in the rustbelt, manufacturing centers and New York
State. As the case indicates, these outcomes stem in part from internal regional choices and
habits of structure and relations that impede improved resilience performance. But it is also
true that external macroeconomic factors put Buffalo-Niagara Falls in the line of especially
tough challenges that its traditional locational and political-economic strengths could not
beat. Only now is the region more directly leveraging its global economy advantages,
including an international border, abundant water resources and natural endowments to
recreate its economy.
This time factor raises the final conclusion of the analysis, that the period of
response and recovery for chronic regional changes is far longer than would be expected
37
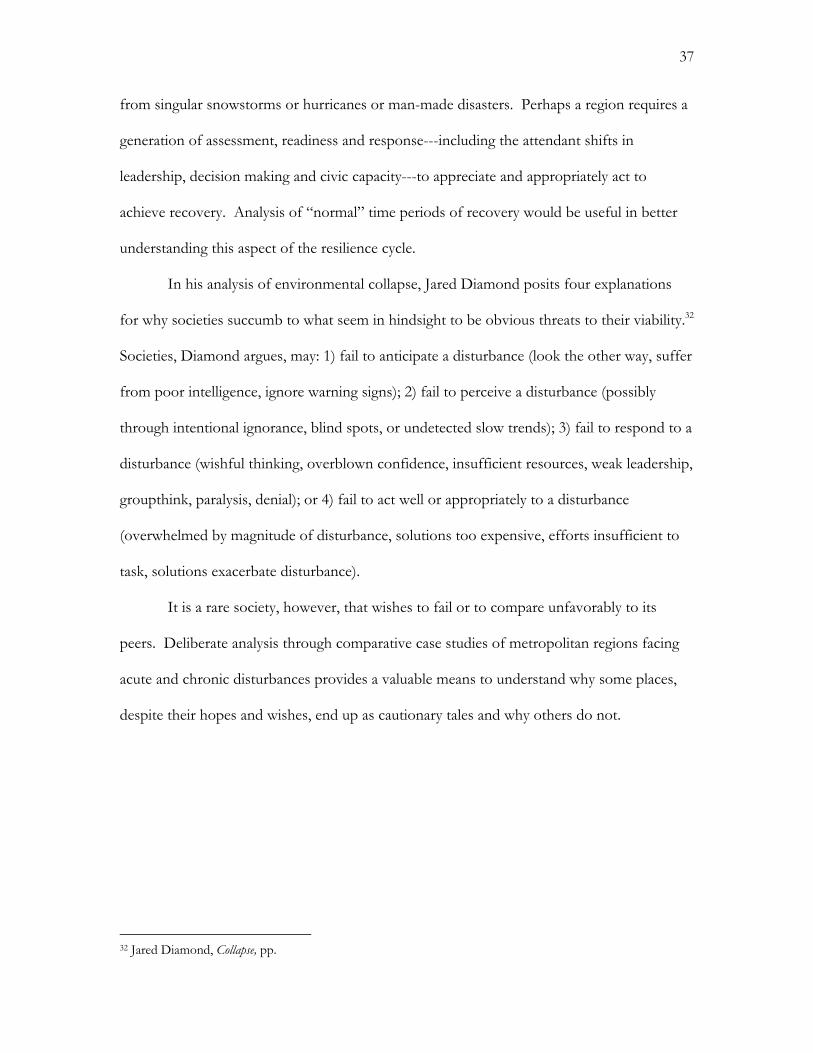
from singular snowstorms or hurricanes or man-made disasters. Perhaps a region requires a
generation of assessment, readiness and response---including the attendant shifts in
leadership, decision making and civic capacity---to appreciate and appropriately act to
achieve recovery. Analysis of “normal” time periods of recovery would be useful in better
understanding this aspect of the resilience cycle.
In his analysis of environmental collapse, Jared Diamond posits four explanations
for why societies succumb to what seem in hindsight to be obvious threats to their viability.32
Societies, Diamond argues, may: 1) fail to anticipate a disturbance (look the other way, suffer
from poor intelligence, ignore warning signs); 2) fail to perceive a disturbance (possibly
through intentional ignorance, blind spots, or undetected slow trends); 3) fail to respond to a
disturbance (wishful thinking, overblown confidence, insufficient resources, weak leadership,
groupthink, paralysis, denial); or 4) fail to act well or appropriately to a disturbance
(overwhelmed by magnitude of disturbance, solutions too expensive, efforts insufficient to
task, solutions exacerbate disturbance).
It is a rare society, however, that wishes to fail or to compare unfavorably to its
peers. Deliberate analysis through comparative case studies of metropolitan regions facing
acute and chronic disturbances provides a valuable means to understand why some places,
despite their hopes and wishes, end up as cautionary tales and why others do not.
32 Jared Diamond, Collapse, pp.

38
References
American Psychological Association. N.D. “The Road to Resilience.” Accessed online
September 14, 2006 at http://www.helping.apa.org/.
American Psychological Association. 2003. “Resilience in a Time of War.” Washington,
D.C.: American Psychological Association; and “Project Resilience” materials
accessed September 14, 2006 online at http://www.projectresilience.com.
Berke, P. R. and T. J. Campanella. 2006. “Planning for Postdisaster Resiliency.” The Annals
of the American Academy of Political and Social Science 604(1): 192 – 207
Timothy Beatley, Philip R. Berke, Raymond Burby, Robert E. Deyle, Steven P. French,
David R. Godschalk, Edward J. Kaiser, Jack D. Kartez, Peter J. May, Robert
Olshansky, Robert G. Paterson, and Rutherford H. Platt. 1999. “Unleashing the
Power of Planning to Create Disaster-Resistant Communities.” Journal of the American
Planning Association 65(
Birch, Eugenie L. and Susan M. Wachter, eds. 2006. Rebuilding Urban Places After Disaster:
Lessons from Hurricane Katrina. Philadelphia, PA: University of Pennsylvania Press.
Bruneau, Michel, Stephanie E. Chang, Ronald T. Eguchi, George C. Lee, Thomas D.
O’Rourke, Andrei M. Reinhorn, Masanobu Shinozuka, Kathleen Tierney, William A.
Wallace and Detlof von Winterfeldt. 2003. “A Framework to Quantitatively Assess
and Enhance the Seismic Resilience of Communities.” Earthquake Spectra 19(4): 737-
38.
Campanella, Thomas. 2006. “Urban Resilience and the Recovery of New Orleans.” Journal
of the American Planning Association 72(2): 141-146.
Comfort, Louise K., ed. 1988. Managing Disaster: Strategies and Policy Perspectives. Durham,
NC: Duke University Press.

39
Diamond, Jared. 2005. Collapse: How Societies Choose to Fail or Succeed. New York: Viking
Penguin.
Economic Development Coordinating Committee. 1988. Planning Together: The Greater
Buffalo Economic Development Strategy Agenda. Buffalo, NY: EDCC.
Economic Development Coordinating Committee. 1988. Working Together: Projects in the
Greater Buffalo Economic Development Strategy Agenda. Buffalo, NY: EDCC
Foster, Kathryn A. 1996. “Planning Without Plans: Evolution of Regional Planning on the
Niagara Frontier. Intersight 5: 13-16.
Fry Consultants. 1978. “Strategy for the Development of High Technology Growth
Industry in Erie County and the City of Buffalo, NY.” Buffalo, NY: Erie County
Industrial Development Agency.
Fulton, William A. 2005. “After the Unrest: Ten Years of Rebuilding Los Angeles
Following the Trauma of 1992.” In The Resilient City: How Modern Cities Recover from
Disaster, edited by Lawrence J. Vale and Thomas J. Campanella, pp. 299-312. New
York: Oxford University Press.
Goldman, Mark. 1990. City on the Lake: The Challenge of Change in Buffalo, New York.
Amherst, NY: Prometheus Books.
Goldman, Mark. 1983. High Hopes: The Rise and Decline of Buffalo, New York. Albany, NY:
State University of New York Press.
Gorski, Dennis. 1998. “Preparing for a New Century in a Changing World: An Action
Plan for Regional Job Creation and Smart Growth.” Buffalo, NY: Erie County.
Greater Buffalo Development Foundation. 1972. Buffalo Area’s Economic Prospects: A Growth
Strategy for the Erie Niagara Area. (Buffalo, NY: Greater Buffalo Development
Foundation.

40
Holling, C.S., Lance H. Gunderson, and Garry D. Peterson. 2002. “Sustainability and
Panarchies.” In Panarchy: Understanding Transformations in Human and Natural Systems,
edited by Lance H. Gunderson and C.S. Holling. Washington, D.C.: Island Press,
pp. 99-101.
Holling, C.S. and Lance H. Gunderson. 2002. “Resilience and Adaptive Cycles.” In
Panarchy: Understanding Transformations in Human and Natural Systems, edited by Lance
H. Gunderson and C.S. Holling. Washington, D.C.: Island Press, pp. 27-33.
Kreiter, Ted. Nov.-Dec. 1994. Book Review of Antioxidant Revolution, by Dr. Kenneth H.
Cooper. Saturday Evening Post, accessed online at
http://findarticles.com/p/articles/mi_m1189/is_n6_v266/ai_15879293.
Liu, Amy. 2006. “Building a Better New Orleans: A Review of and Plan for Progress One
Year after Hurricane Katrina.” Washington, D.C.: The Brookings Institution.
New York State Assembly Ways and Means Committee. 2000. “Regional Economic Profile
of Western New York.” Albany, NY: Assembly Ways and Means Committee, State
of New York.
Niagara County Department of Planning, Development and Tourism. 2000.
“Comprehensive Economic Development Strategy.” Lockport, NY: Niagara
County.
Rae, Douglas. 2004. City. New Haven, CT: Yale University Press.
Schlegel, John Henry. 2005. “Like Crabs in a Barrel: Economy, History and Redevelopment
in Buffalo,” unpublished paper.
Sheffi, Yossi. 2005. The Resilient Enterprise: Overcoming Vulnerability for Competitive Advantage.
Cambridge, Mass.: MIT Press.

41
University at Buffalo Governance Project. 1996. Governance in Erie County: A Foundation for
Understanding and Action. Buffalo, NY: University at Buffalo
Vale, Lawrence J. and Thomas J. Campanella. 2005. The Resilient City: How Modern Cities
Recover from Disaster. Oxford: Oxford University Press.
Winfield, Linda R.. 1994. “Developing Resilience in Urban Youth.” Chicago, Ill.: North
Central Regional Educational Laboratory.

THE INSTITUTE OF URBAN AND REGIONAL DEVELOPMENT CONDUCTS
COLLABORATIVE, INTERDISCIPLINARY RESEARCH AND PRACTICAL WORK
THAT REVEALS THE DYNAMICS OF COMMUNITIES, CITIES, AND REGIONS
AND INFORMS PUBLIC POLICY.
ROOTED IN THE SOCIAL SCIENCES, IURD’S WORK HAS STEADILY GAINED
RECOGNITION SINCE ITS INCEPTION OVER 40 YEARS AGO. IURD HAS
BECOME THE GATEWAY TO THE UNIVERSITY FOR THOSE CONCERNED
WITH URBAN AND REGIONAL ISSUES—INFRASTRUCTURE, HOUSING,
SPRAWL, TRANSPORTATION, ENVIRONMENTAL QUALITY, DISASTER
RECOVERY, AND POVERTY AND PHYSICAL DECLINE IN INNER CITIES—AS
WELL AS A HOME FOR SCHOLARS WHO INTEGRATE REAL-WORLD METRO-
POLITAN PROBLEM-SOLVING IN THEIR TEACHING AND RESEARCH.
AT THE VANGUARD OF LOCAL AND INTERNATIONAL METROPOLITAN
DEVELOPMENT. IURD RESEARCHERS ADDRESS TIMELY CHALLENGES,
EMPLOYING COOPERATIVE METHODS TO ENCOURAGE JOINT LEARNING,
RECOGNIZE INTERDEPENDENCIES, AND UNDERSTAND THE BIG PICTURE.
IURD’S CENTER FOR GLOBAL METROPOLITAN STUDIES WORKS TO
ANALYZE THE IMPLICATIONS OF WORLDWIDE GROWTH AND CHANGE IN
METROPOLITAN AREAS AND DEVELOP STRATEGIES TO BETTER MANAGE
URBANIZATION PROCESSES AND OUTCOMES. IURD IS ALSO HOME TO THE
PRESTIGIOUS JOURNAL OF PLANNING EDUCATION AND RESEARCH,
PRESENTING CONTEMPORARY ISSUES IN PLANNING.
A PIONEER IN COMMUNITY PARTNERSHIPS. IURD’S COMMUNITY PART-
NERSHIPS ARE POWERFUL CATALYSTS FOR SOCIAL AND ECONOMIC
CHANGE. ITS CENTER FOR COMMUNITY INNOVATION SUPPORTS AND
EXPANDS ENTREPRENEURIAL COMMUNITY PROBLEM-SOLVING THROUGH
OUTREACH, TECHNICAL ASSISTANCE, AND RESEARCH THAT BUILDS UPON
LOCAL BEST PRACTICES. IURD’S CENTER FOR CITIES AND SCHOOLS
BRIDGES THE FIELDS OF EDUCATION AND URBAN POLICY, STRESSING
HIGH-QUALITY EDUCATION AS AN ESSENTIAL COMPONENT OF COMMU-
NITY VITALITY AND PROMOTING UNDERSTANDING AND COLLABORATION
AMONG EDUCATORS, POLICYMAKERS, AND COMMUNITY MEMBERS.
UNIVERSITY OF CALIFORNIA INSTITUTE OF URBAN AND REGIONAL DEVELOPMENT
316 WURSTER HALL # 1870 BERKELEY, CA 94720-1870 510.642.4874 T 510.643.9576 F iurd.berkeley.edu