A Business Analytics Approach to Corporate Sustainability ...
57
University of Pennsylvania University of Pennsylvania ScholarlyCommons ScholarlyCommons Master of Environmental Studies Capstone Projects Department of Earth and Environmental Science 2014 A Business Analytics Approach to Corporate Sustainability A Business Analytics Approach to Corporate Sustainability Analysis Analysis Jeff Wen University of Pennsylvania Follow this and additional works at: https://repository.upenn.edu/mes_capstones Part of the Business Law, Public Responsibility, and Ethics Commons, Environmental Indicators and Impact Assessment Commons, Numerical Analysis and Scientific Computing Commons, Other Environmental Sciences Commons, Statistics and Probability Commons, and the Sustainability Commons Wen, Jeff, "A Business Analytics Approach to Corporate Sustainability Analysis" (2014). Master of Environmental Studies Capstone Projects. 62. https://repository.upenn.edu/mes_capstones/62 Primary Reader: James R. Hagan Secondary Reader: Michael Kulik This paper is posted at ScholarlyCommons. https://repository.upenn.edu/mes_capstones/62 For more information, please contact [email protected].
Transcript of A Business Analytics Approach to Corporate Sustainability ...

University of Pennsylvania University of Pennsylvania
ScholarlyCommons ScholarlyCommons
Master of Environmental Studies Capstone Projects
Department of Earth and Environmental Science
2014
A Business Analytics Approach to Corporate Sustainability A Business Analytics Approach to Corporate Sustainability
Analysis Analysis
Jeff Wen University of Pennsylvania
Follow this and additional works at: https://repository.upenn.edu/mes_capstones
Part of the Business Law, Public Responsibility, and Ethics Commons, Environmental Indicators and
Impact Assessment Commons, Numerical Analysis and Scientific Computing Commons, Other
Environmental Sciences Commons, Statistics and Probability Commons, and the Sustainability Commons
Wen, Jeff, "A Business Analytics Approach to Corporate Sustainability Analysis" (2014). Master of Environmental Studies Capstone Projects. 62. https://repository.upenn.edu/mes_capstones/62
Primary Reader: James R. Hagan Secondary Reader: Michael Kulik
This paper is posted at ScholarlyCommons. https://repository.upenn.edu/mes_capstones/62 For more information, please contact [email protected].

A Business Analytics Approach to Corporate Sustainability Analysis A Business Analytics Approach to Corporate Sustainability Analysis
Abstract Abstract Sustainability has become increasingly important to corporations, as stakeholders have called for increased transparency and as corporations have recognized the benefits of considering corporate sustainability. As a result, there has been a dramatic increase in disclosure both through corporate statements and through annual reports in which companies will describe the environmental activities in which they are involved. These documents and reports are of interest to researchers because they represent a wealth of information that can be studied and analyzed. In the past, the contents of these reports have been studied through manual methods; however, there is a great potential for automatic analysis of these reports. This paper will document the methodology taken to produce an automated analytics software that produces outputs that can further be used in analysis. Specifically, the program is meant to calculate the word frequencies of certain words and phrases that are of interest and it also extracts the sentences in which these words or phrases are contained. In this research, the output of the program is used in 2 applications. One regresses the sustainability word frequencies against a published sustainability score and another application uses a simple form of sentiment analysis to analyze the positive and negative sentiment of the extracted sentences. Human methods are usually used to perform tasks such as sentiment analysis and frequency count. The program created in this research provides a first step toward future computational analysis work. While the program is able to perform the tasks for which it was designed, improvements can be made to produce a more comprehensive and versatile program.
Disciplines Disciplines Business Law, Public Responsibility, and Ethics | Environmental Indicators and Impact Assessment | Numerical Analysis and Scientific Computing | Other Environmental Sciences | Statistics and Probability | Sustainability
Comments Comments Primary Reader: James R. Hagan
Secondary Reader: Michael Kulik
This thesis or dissertation is available at ScholarlyCommons: https://repository.upenn.edu/mes_capstones/62

A BUSINESS ANALYTICS APPROACH TO CORPORATE SUSTAINBILITY ANALYSIS
Jeff Wen
Summer 2014
Primary Reader: James R. Hagan
Secondary Reader: Michael Kulik

ii
ABSTRACT
A BUSINESS ANALYTICS APPROACH TO CORPORATE SUSTAINBILITY ANALYSIS
Jeff Wen
Primary Reader: James R. Hagan
Sustainability has become increasingly important to corporations, as stakeholders have
called for increased transparency and as corporations have recognized the benefits of considering
corporate sustainability. As a result, there has been a dramatic increase in disclosure both
through corporate statements and through annual reports in which companies will describe the
environmental activities in which they are involved. These documents and reports are of interest
to researchers because they represent a wealth of information that can be studied and analyzed.
In the past, the contents of these reports have been studied through manual methods; however,
there is a great potential for automatic analysis of these reports. This paper will document the
methodology taken to produce an automated analytics software that produces outputs that can
further be used in analysis. Specifically, the program is meant to calculate the word frequencies
of certain words and phrases that are of interest and it also extracts the sentences in which these
words or phrases are contained. In this research, the output of the program is used in 2
applications. One regresses the sustainability word frequencies against a published sustainability
score and another application uses a simple form of sentiment analysis to analyze the positive
and negative sentiment of the extracted sentences. Human methods are usually used to perform
tasks such as sentiment analysis and frequency count. The program created in this research
provides a first step toward future computational analysis work. While the program is able to
perform the tasks for which it was designed, improvements can be made to produce a more
comprehensive and versatile program.

iii
Table of Contents
Introduction................................................................................................................................... 1
Literature Review.............................................................................................................. 3
Methods......................................................................................................................................... 10
Selection of Companies.....................................................................................................10
Collect Documents............................................................................................................ 10
Concept Vector List.......................................................................................................... 11
Calculate Word Frequency............................................................................................... 13
Extract Sentences.............................................................................................................. 20
Applications.................................................................................................................................. 24
Regression......................................................................................................................... 24
Sentiment Analysis........................................................................................................... 32
Analysis of the program................................................................................................................ 38
Conclusion.................................................................................................................................... 40
References..................................................................................................................................... 43
Appendix....................................................................................................................................... 47
Appendix 1: Concept Vector List..................................................................................... 47
Appendix 2: Complete Code from Project........................................................................ 47

iv
List of Figures
Figure 1: Sample Concept Vector (word) .....................................................................................12
Figure 1.1: Sample Concept Vector (phrase) ................................................................................13
Figure 2: File Location Path..........................................................................................................14
Figure 2.1: “getConceptVectors” Function................................................................................... 15
Figure 3: “calculateWordFreq” Function...................................................................................... 15
Figure 3.1: Setup Portion of the “calculateWordFreq” Function................................................. 16
Figure 3.2: Analysis Portion of the “calculateWordFreq” Function............................................. 16
Figure 3.3: “calculateNormWordFreq” Function......................................................................... 17
Figure 4: “calculateWordFreq” Output......................................................................................... 18
Figure 4.1: Manual Search Example............................................................................................. 19
Figure 4.2: “calculateNormWordFreq” Output............................................................................ 19
Figure 4.3: “calculateWordFreq” Output (simplified) ................................................................. 19
Figure 4.4: “calculateNormWordFreq” Output (simplified) ....................................................... 20
Figure 5: “sentExtract” Function.................................................................................................. 21
Figure 5.1: Setup Portion of the “sentExtract” Function.............................................................. 21
Figure 5.2: Analysis Portion of the “sentExtract” Function......................................................... 23
Figure 5.3: “sentExtract” Output.................................................................................................. 24
Figure 6: Raw Newsweek Ranking Data...................................................................................... 25
Figure 6.1: “writeCSVRegression” Function............................................................................... 26
Figure 6.2: “writeCSVRegression” Output................................................................................... 26
Figure 6.3: Word Frequency (absolute) vs. Newsweek Score...................................................... 27
Figure 6.4: Word Frequency (normalized) vs. Newsweek Score................................................. 28
Figure 6.5: Word Frequency (absolute) vs. Newsweek Score Minus Terms and Companies...... 29
Figure 6.6: Word Frequency (normalized) vs. Newsweek Score Minus Terms and Companies. 30
Figure 6.7: Word Frequency (normalized) vs. Newsweek Score Minus Terms and Outliers...... 31
Figure 7: “sentenceSentiment” Function...................................................................................... 34
Figure 7.1: “sentenceSentiment” Output...................................................................................... 35
Figure 7.2: Positive vs. Negative Word Use................................................................................. 37

1
A Business Analytics Approach to Corporate Sustainability Analysis
Introduction
At the end of the 20th century and into the 21st century, the information age has
allowed for information to be widely accessible to researchers, scholars, and businesses.
This increase in accessibility of information has especially been spurred on in the
corporate world by a desire for greater transparency from various stakeholders. Around
the same time emerged the concept of sustainability, which this paper will define as a
business approach that aims to create long-term shareholder value by embracing
opportunities and managing economic, environmental, and social risks. The intersection
of these two ideas set the stage for the publication of an increased amount of electronic
information. Much of the information is made available through governmental
regulations that require corporations to provide information about their operations. For
example, through annual reports, companies will often share information about how the
company performed relative to expectations. There has also been an increase in voluntary
disclosure through corporate sustainability reports, which allow companies to further
describe their environmental sustainability efforts. The disclosure of business information
is impacted as topics such as sustainability and community empowerment have become
more important in the eyes of stakeholders. While companies vary on the details of the
information that is published, many companies will provide a view of the overall impact.
Therefore, these reports contain a wealth of information that can be studied and
analyzed. While there are many ways to analyze these reports, it is important to explore
the potential of computational analysis because of the sheer amount of information that is
available. Computational methods allow for much quicker analysis and can remove the

2
potential bias that is present in human analysis. It is also essential to note that using
programs to analyze corporate information has become more popular with the increased
computing power of machines. The output of these programs can further be used to
analyze information in more detail. It also allows for flexibility in analysis, as any
disclosure can be analyzed, not just annual reports.
The purpose of this study is to develop a program that can take text document
sources, such as annual reports, as input and provide output that can be further analyzed.
More specifically, the program will aim to dissect documents into individual words,
which can then be counted, so that word frequency scores can be calculated. Furthermore,
the program will isolate sentences in which words of interest appear. These sentences can
then be further analyzed. Ultimately, this program will serve as a preprocessing tool that
can help business, researchers, and scholars analyze textual information quickly. Once
the textual information is analyzed, the program will output basic information, word
frequency count and sentences that can be used in further analysis. The purpose of this
program is to use computational methods to increase the rate at which textual documents
can be analyzed. The value of this type of program is in the scale with which the program
can be applied. Whereas in the past only a handful of documents could be analyzed, the
use of computers allows for many more documents to be analyzed at a fraction of the cost.
In this study, the outputted information is used in two applications where the
individual word frequency count is regressed against a sustainability score that is
annually published by Newsweek, an American news magazine. The application requires
further code that uses a machine learning technique known as gradient descent to
calculate the coefficients of the regression. Another application of the program is to

3
calculate the potential positive or negative sentiment used in the sentences that contain
sustainability words of interest. These applications are meant to test the program and
show the potential of using computational methods of analysis. Ultimately, the value is in
using programs, such as the one that will be constructed in this study, to conduct more in-
depth analyses. The analysis in this study represents the groundwork on which further
analyses can be built; therefore, only two potential applications will be studied.
Literature Review
As there has been a clarion call for corporate transparency over the last couple of
decades, environmental disclosure and issues have become the interest of stakeholders,
governments, and the general public (Ilinitch, Soderstrom, & Thomas, 1998) . However,
with the increase in disclosure and information that is released to the public, it’s harder
for interested individuals to figure out what is being said in the various corporate
disclosures. More specifically, the vast amount of information that is published can be
overwhelming to read and analyze. This review will explore some of the existing
literature regarding the increased pressure for environmental disclosures and also
examine the development of the content analysis field from more qualitative studies
performed by hand to quantitative studies conducted through the use of machine learning
techniques.
With the development of the informational age, businesses started to realize a
deeper purpose than just profit maximization. In fact, English and Schooley (2014) noted
that a strong driver for business awareness was the increase in stakeholder demand for
corporate responsibility related information and project proposals (English & Schooley,
2014) . This shift in corporate philosophy marked the start of a trend towards conscious

4
capitalism and the sustainable enterprise economy, which emphasizes the
interconnectedness of business and society (Waddock & McIntosh, 2011) . As business
and technology have continued to evolve, many companies are looking to “green”
initiatives and strategies to improve their bottom lines, corporate reputations, or
operational efficiency. Porter and Kramer (2011) emphasize that sustainability is
important because it creates a connection between the corporation and the community
within which it operates. In fact, they state that there should be a push towards creating
shared value between the corporation and the community within which it operates
(Porter & Kramer, 2011) . The authors note that it is important to embrace both economic
and societal concerns in order to show the community that the organization is creating
value for the community. One potential method of showing the connection between the
corporation and the community is by sharing the information through corporate
disclosures (Ilinitch et al., 1998). The authors note that with the increased desire for
transparency, corporations, regulatory agencies, and other watchdog groups have tried to
develop ways to analyze the information within these disclosures. The research looks at
the existing environmental performance metrics that are being disclosed and suggests that
care must be taken in analyzing environmental performance information (Ilinitch et al.,
1998). This is especially the case because companies can publish numerous reports full of
information that is ultimately difficult to analyze and interpret.
With so many corporate disclosures, it is difficult to extract information from the
overflow of data. By 2011, 95% of the Global 250 companies reported on corporate
responsibility activities (English & Schooley, 2014) . In order to analyze the information,
researchers and academics have looked to content analysis as a means to study the

5
substance in the companies’ published reports (Jose & Lee, 2007) . Jose and Lee (2007)
looked at content on corporations’ websites to study how companies were reporting
environmental information. Based on the research, the authors noted that up to 60% of
the world’s largest companies disclose environmental information. This research shows
the potential for meaningful information to be extracted through the content of a text
document. Content analysis is defined as “…a process of quantifying the contents of a
text by way of a method that is clear and can be repeated by other researchers”
(Denscombe, 2010) . This type of analysis allows researchers and businesses to improve
the accuracy of decision-making and also helps businesses make more informed
decisions if the company can analyze competitors’ textual documents (Kloptchenko,
Magnusson, Back, Visa, & Vanharanta, 2002) .
While there are many units that can be used to codify the data, Hooks and van
Staden’s (2011) summary paper notes that researchers often use different types of units to
analyze text information. Some researchers favor the use of sentence counts that report on
environmental issues as a proxy for environmental disclosure. Other researchers use
specific environmental word counts or text clauses that contain word or words that are of
interest to the researchers (Hooks & van Staden, 2011) .
Although there are various documents that can be used to analyze the extent of
environmental disclosure, a majority of researchers use annual reports as compared to
sustainability reports because the Securities Exchange Commission (SEC) requires that
companies publish annual reports, whereas corporate sustainability reports are voluntarily
published by companies (Clarkson, Overell, & Chapple, 2011; Guthrie & Abeysekera,
2006) . It is important to note the voluntary publishing of these reports because research

6
has shown “…that worse environmental performers use language and verbal tone to bias
the message presented in their financial report environmental disclosures” and that worse
environmental performance is often covered by more optimistic and less certain language
(Cho, Roberts, & Patten, 2010) . In other words, corporations may skew the language that
is used in voluntary reports to favorably shed light on the company. Therefore, while
there has been an increase in the number of reports and disclosure, many researchers still
analyze annual reports to find information regarding environmental issues. Cho et al.
(2010) used content analysis software, DICTION, to run their analysis on whether or not
the analyzed data was optimistic and certain. The increase in information available for
analysis pushed researchers towards more autonomous methods of content analysis
through the use of software and algorithms. In order to make use of the software analysis,
the authors had to make sure that the input information is standardized and therefore the
companies had to be listed in KLD Research and Analytics, Inc.’s social and
environmental performance rankings list. Although this limits the potential number of
companies that can be studied, it allowed for the researchers to conduct analysis on a
large number (n=190) of companies.
Ultimately content analysis aims to codify the quantitative and qualitative data in
the various reports or documents that are being studied. However, while computational
analysis has been performed on quantitative data, there is often more informative
information that is contained within the qualitative of a text document (Kloptchenko et al.,
2004). In many studies, research assistants will perform the codification of this data
through human-based methods (Hooks & van Staden, 2011) . The researchers who
perform this analysis may be experienced professionals who are able to precisely code
7
the text information; however, human based methods, although thorough, require a lot of
time and resources, which may not be available to businesses (Kloptchenko et al., 2002;
Van den Bogaerd & Aerts, 2011) . Given the tradeoff between quality and speed,
researchers and businesses have started to identify methods to use computational methods
to analyze large numbers of textual documents but also maintain quality. The benefits of
computational analysis are appealing as the number of documents available continues to
increase exponentially. Kloptchenko et al. (2002) studied the contents of quarterly reports
using text-mining methods and noted that there is a need for less expensive computer-
based analysis solutions as opposed to human-based methods. In the research by
Kloptchenko et al. (2004), the authors tried to combine an analysis of both the
quantitative data and qualitative data. They used a computational approach to study
whether or not the information contained in the documents gave an indication towards
future performance of the company. For financial analysts, this tool would be useful to
make educated decisions by looking solely at the company’s corporate reports.
Additionally, this information can be used as an additional metric that can help better
inform investment decisions. While results were mixed, Kloptchenko et al. (2004) noted
that their tool showed that the tone within a given document in a particular quarter is
more pessimistic if financial performance in the next quarter will be worse. In other
words, some changes in financial performance can be anticipated by analyzing the text
from the corporate reports (Kloptchenko et al., 2004).
In terms of analyzing corporate reports, Van den Mogaerd and Aerts (2011)
mention that there are usually 3 main methods that are used to analyze texts. First, there
are individual word-count systems that will count word frequencies and other text

8
characteristics. Second, human-based content analysis will allow researchers to look
more closely at the things that are being said in the documents. Lastly, computer-aided
qualitative data analysis systems use artificial intelligence to analyze text documents
(Van den Bogaerd & Aerts, 2011) . Although it may seem like human-based methods are
more accurate, the authors noted that human-based methods are often subjected to biases,
especially if different researchers analyze the documents. Therefore, the authors argue in
favor of using machines to analyze the documents in order to both save time and money.
In their study, they look at two competing machine-learning algorithms that they then use
to analyze the positivity and negativity of different texts. In the analysis, the researchers
looked only at the positivity and negativity of the texts. As an application, Van den
Bogaerd and Aerts (2011) looked at the degree of favorableness (positive or negative) of
different news sources. They concluded that the machine-learning program was correct in
classifying documents about 90% of the time (Van den Bogaerd & Aerts, 2011) .
Furthermore, several studies note that content analysis methods through counting and
scoring words produces similar results as studies that are performed manually (Laver,
Benoit, & Garry, 2003; Porac, Wade, & Pollock, 1999) . In some cases, automated
analysis even allows researchers to capture patterns and firm attributes that would
otherwise be unidentified (Tetlock, Saar-Tsechansky, & Macskassy, 2008; Uotila, Maula,
Keil, & Zahra, 2009) . Therefore, there is great potential in using computational methods
to analyze textual disclosures by corporations. Beyond simple analyses, some researchers
have tried to use computers to do further analyses related to a broad range of fields.
Computational analytics techniques have been used to predict the change in
company performance based on the analysis of the previous year’s annual report (Qiu,

9
Srinivasan, & Hu, 2014) . The authors use computers to dissect annual reports to measure
the words that they are interested in, then the researchers study the correlation between
the text and the corporate financial performance as measured by the earnings per share.
The authors noted that their program performed better than analysts’ forecasts in
predicting size-adjusted cumulative returns (Qiu et al., 2014). Therefore, this research
identifies another potential application for the use of computational analytics to study
business problems.
As most of the existing research focuses on analyzing broad news sources or
annual reports of a large set of companies, this research paper will study environmental
sustainability text within corporate annual reports (Form 10-K). This research will
attempt to analyze the occurrence of specific environmental- and sustainability-related
words rather than all words contained in a given document. The program that is being
developed in this study is meant to be a foundational model on which other analyses can
be built. This research will focus on sustainability of various companies as expressed
through the usage of certain sustainability terms, and will use the program in two
applications to test and show the analysis that can be performed with the program. The
research will identify the frequencies of these sustainability words and will also identify
the sentences in which desired words are found so that sentiment analysis can be
performed on those sentences. Whereas many of the previous studies used manual
methods to analyze text documents, this research will use a custom-developed Python
module that will allow for automated analysis of these documents. The purpose of this
research is to describe and document the methods through which an inexpensive
10
automated analysis program is made. Further improvements will also be explored
throughout the paper and in the conclusion section of the paper.
Methods
This section of the research aims to clarify the steps that are taken to prepare the
program and the texts for analysis. The various steps that the program performs will be
explained so as to clearly show how the program is analyzing the input information.
Selection of companies
Different factors were taken into account in the selection of companies that were
used in the application of this study: 1) the company must be publicly listed so that there
is available public information about the company. 2) the company must also be listed in
the Newsweek “Green” Rankings, because the scores are used as part of the application
of the program.
In order to make the selection process simple, this study uses 30 companies from
the Newsweek ‘Green’ Rankings to study and analyze. There are 6 main industries for
which annual reports are analyzed in this paper: technology, food and beverage,
consumer products, oil and gas, general industrials, and transportation and aerospace. The
program can analyze and process any of the companies’ documents and therefore the
companies that were selected are simply used as a means to test the program and also
show the potential applicability of the program.
Collect documents
As mentioned earlier, annual reports (Form 10-K) are mandatory documents that
must be submitted by publicly listed companies to the U.S. Securities and Exchange
Commission (SEC) every year. The Form 10-K “provides a comprehensive overview of
11
the company's business and financial condition and includes audited financial statements”
(SEC). Therefore, the annual report is an important source of information about the
corporation and companies also include environmental disclosures through these annual
reports (Guthrie & Abeysekera, 2006) . Other sustainability or corporate responsibility
reports are not used in this study because those reports are voluntary and can potentially
contain favorable language used to improve the public image of the company (Cho et al.,
2010). However, in further analysis, the program can be used to analyze other sources of
information such as corporate sustainability reports.
This study makes use of the EDGAR database of the SEC, which contains the
annual reports for all publically listed companies. In order to streamline the process of
analyzing the documents, the complete company 10-K is downloaded in a .htm format,
which can easily be searched and indexed by the program that is being written.
Concept vectors list
This study analyzes the frequency of various words that are associated with
sustainability. Therefore, a list of these words is first written into a text file, which in the
program is referred to as “conceptvectors.txt”. These words and phrases will later be
extracted by the program and used in finding the occurrences of these words or phrases in
the various documents that have been collected. These words or phrases are referred to as
concept vectors, representing a word or phrase that may capture a certain concept that is
of interest. While a single word or phrase may not be an indication that the document is
speaking on the subject of sustainability, it does indicate that the idea was mentioned in
the document, which for the purposes of this study will represent the company's interest

12
in and potential focus on sustainability. Several studies use simple word occurrences to
represent companies’ interest in the topic at hand (Laver et al., 2003; Porac et al., 1999).
These concept vectors are written in a format that allows the word or phrase to be
directly imported into the program. It is written in regular expression format, which is a
tool that many researchers across many fields from biology to computer science, have
used to search for patterns, particularly in text (Kelty, 2008).
These terms were initially selected to represent terms that are associated with
sustainability or the environment. This study borrows some of these terms from a
published list from E. I. du Pont de Nemours and Company (E. I. du Pont de Nemours
and Company, 2008). DuPont states that these terms are common sustainability terms in
packaging; however, in this study, these terms are considered indicators of overall
sustainability. As mentioned before, the purpose of this tool is to allow for flexibility in
analysis; therefore, the original list of words being searched can be added to or taken
from with ease. The current list stands at 15 words and phrases and is shown in Appendix
1. These words or phrases are written in truncated form to allow the program to maximize
the entries that are found and to broaden the search so that indirect matches can also be
found. Figure 1 and Figure 1.1 present examples of the truncated forms of a search term
and search phrase.
Figure 1: Sample Concept Vector (word). In this search, the program will look for
a phrase that contains “sustaina.” This may mean “sustainable,” “sustainability,”
or another phrase that contains the letters “sustaina” that is bounded by a break
in the sentence “\b”. The code “[a-z]*” included after the initial set of letters

13
allows the program to perform a fuzzy match with lowercase letters until the end
of the word. While this is not the only structure of code that can capture the
desired results, this set-up allows for flexibility in capturing both words and
phrases with strictly alphabetic characters.
Figure 1.1: Sample Concept Vector (phrase). This example shows a phrase being
searched in a similar format. The truncated words are split by a white space “\s.”
The rest of the pattern remains the same and therefore this concept vector
searches for phrases such as “environmental responsibility” or “environmentally
responsible.”
These terms that are listed as concept vectors capture the idea of sustainability and
therefore the program searches for these terms in the documents that are being analyzed.
Calculate word frequency
This portion of the program is the most important as this portion of the program
conducts the bulk of the processing that allows the text to be analyzed. The word
frequency will be calculated in two different methods in this research. First an absolute
count will be tabulated and second a normalized count will be calculated to take into
account the potential differences in the length of the documents. This methodology is
similar to the method that other researchers have implemented in previous studies
(Mattlage, 2008).
Further details will be included in the explanation of the code below:
Step 1: Direct the program to search for the necessary input files in the right
location.

14
Figure 2 shows the code that is used to direct program to look in the correct folders for
the information that will be used later. All of the necessary files are contained in the
“Capstone Project” folder. It should also be noted that the program could be made
available for other computers; however, the folder names and locations must match the
ones that are in the program; otherwise, the directory names must be changed to allow the
program to run.
Figure 2: File Location Paths. The different path names are later called in the
program to help the program locate the correct files to be used in the analysis.
This is beneficial as it means that the files can be stored in one central location to
allow for ease of analysis if there are large amounts of files. The “sets” file
contains the different text documents that are going to be analyzed. The “scores”
file consists of the scores that were published by Newsweek, which will be used in
the application portion of this study. Lastly, the “word_lists” file contains the
positive and negative word lists that will be used to perform sentiment analysis on
the sentences that are extracted by the program.
Step 2: Obtain the concept vectors from the text file in which they are stored.
Next, it is necessary for the program to know which words or phrases to search for in the
text documents. These concept vectors are stored in a text document in a coded form that
allows the program to directly input the search term into the code. The module is a
precursor module that is later called by the module that calculates the word frequencies.

15
Figure 2.1: “GetConceptVectors” Function. This function points the program to
look for the words that are of interest in the specified text file. Once again, these
concept vectors are already in query form and can be directly imputed into the
analysis function; therefore, the concept vectors are simple stored as a variable
that can be called at any point.
Step 3: Calculations are made of the frequency of words that are of interest.
This is the most involved step in the program, as it contains the function that figures out
which documents to search, cleans the documents, and searches the documents.
Figure 3: “calculateWordFreq” Function. The main analysis function of the
program and uses regular expressions to search through the text of each
document that is imported into the program for analysis.

16
Figure 3.1: Set-up Portion of the “calculateWordFreq” Function. This portion
prepares all the necessary inputs for the analysis part of the function. First, the
function retrieves the concept vectors that contain all the words that are of
interest (stored as “conceptVectors”). Then the location of the text files that are
going to be analyzed is set and put into a list “file_list”. This allows the program
to run through the list of text files so that each file can be opened successively.
The “just_counts” and “countHits” variables are also initialized. The “setName”
is the location where the different text files are stored and “option” gives the user
the option to select form two different outputs. Inputting “0” would return a list of
the concept vectors and the frequency counts whereas inputting “1” would return
just the frequency counts. This distinction is made to allow for ease of analysis so
that one function can be used to perform multiple tasks.
Figure 3.2: Analysis Portion of the “calculateWordFreq” Function. This section of
the function conducts the word frequency count. This function calculates the
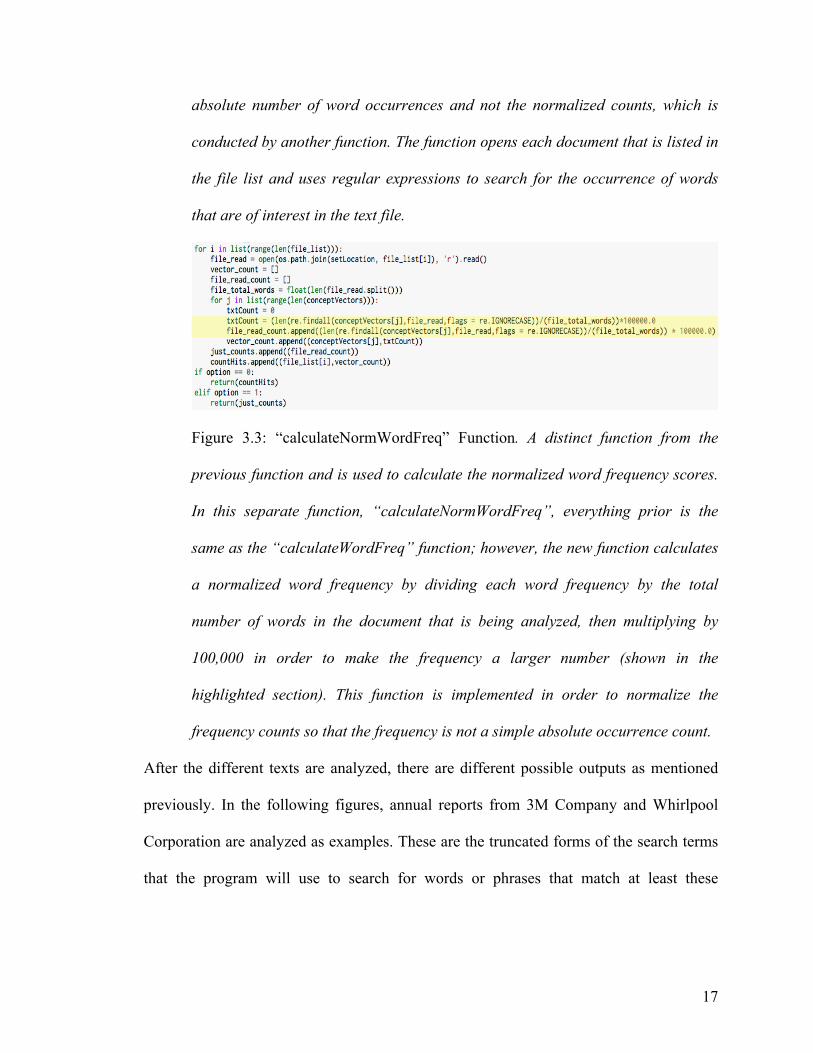
17
absolute number of word occurrences and not the normalized counts, which is
conducted by another function. The function opens each document that is listed in
the file list and uses regular expressions to search for the occurrence of words
that are of interest in the text file.
Figure 3.3: “calculateNormWordFreq” Function. A distinct function from the
previous function and is used to calculate the normalized word frequency scores.
In this separate function, “calculateNormWordFreq”, everything prior is the
same as the “calculateWordFreq” function; however, the new function calculates
a normalized word frequency by dividing each word frequency by the total
number of words in the document that is being analyzed, then multiplying by
100,000 in order to make the frequency a larger number (shown in the
highlighted section). This function is implemented in order to normalize the
frequency counts so that the frequency is not a simple absolute occurrence count.
After the different texts are analyzed, there are different possible outputs as mentioned
previously. In the following figures, annual reports from 3M Company and Whirlpool
Corporation are analyzed as examples. These are the truncated forms of the search terms
that the program will use to search for words or phrases that match at least these

18
expressions. The following figures use a different list of search terms as the one in
Appendix 1, as it was meant to be a test of the program.
Figure 4 and Figure 4.2 are outputs with “option” = 0, meaning that the entire regular
expression search phrase is also outputted. Figure 4.3 and 4.4 show the output with
‘option’ = 1, which only outputs the numerical scores. Figure 4.2 and Figure 4.4 are the
normalized scores and therefore are different than the absolute scores. Figure 4.1 shows a
manual search of terms with “solar” on 3M Company’s 2010 annual report. The
calculated absolute frequencies for words starting with “solar” are 3 in both searches,
which shows that the program performs the analysis correctly.
Figure 4: “calculateWordFreq” Output. This output shows the concept vectors that
are being searched and the absolute number of matches for the terms and phrases
that contain at least the letters in the concept vectors. Therefore, for example, in
Whirlpool’s 2010 annual report the program found words starting with “solar” 3
times.

19
Figure 4.1: Manual Search Example. A manual search for “solar” finds 3 entries,
which matches with the absolute frequency score that was calculated by the
program.
Figure 4.2: “calculateNormWordFreq” Output. This output shows the normalized
word frequency scores for the 2 example texts and the associated concept vectors.
These numbers are different that the absolute numbers because these numbers are
normalized by the total number of words in each document.
Figure 4.3: “calculateWordFreq” Output (simplified). A simplified version of the
output from Figure 4. This output only contains the absolute frequencies of the
different words or phrases of interest.

20
Figure 4.4: “calculateNormWordFreq” Output (simplified). The simple version of
the output from Figure 4.2 that only contains the normalized frequencies of the
words of interest.
Extract sentences
This function allows the program to select and document the sentences in which
words of interest appear. The program will search for all sentences and extract all
sentences with the word or phrase that matches the concept vector. Isolating these
sentences will allow further analysis of the sentences in which these words or phrases
occur. For example, in the application section, this research paper will study the
sentiment of these sentences once the sentences are identified. Figure 5 provides an
overall look at the function and Figures 5.1 and 5.2 show specific parts of the function
that are used to search for and isolate the sentences.

21
Figure 5: “sentExtract” Function. This function allows the program to search for,
identify, and isolate sentences that contain the words or phrases that are of
interest. Similar to the word frequency counter, the sentence extraction function
uses regular expressions to find instances in which words or phrases occur.
However, it then uses a toolkit that is publically available to perform some of the
preprocessing steps.
Figure 5.1: Setup Portion of the “sentExtract” Function. This first portion of the
function sets the function up to perform the necessary steps. First, the concept
vectors are once again retrieved and will be later used in searching for the

22
occurrences of the words or phrases. An important step in this preprocessing
stage is the splitting of sentences in the document. A document’s text is retrieved
as a single string containing all the words within the document. However, this
needs to be split into sentences, which can then be searched through with regular
expressions. The “tokenizer” variable in this case stores each of the sentences in
the file as items within a list. This is made possible through the use of a publically
available natural language toolkit (NLTK), which incorporates a module called
“Punkt” that is essentially a sentence tokenizer that can split documents into
individual sentences (Bird, Klein, & Loper, 2009) . The remaining parts of the
function initialize variables for the latter part of the function.
In Figure 5.1 and Figure 5.2, the portions of the code that are highlighted in
yellow represent code that initially was used to perform the same task as the NLTK
“Punkt” module. However, upon splitting the sentences, there were inaccuracies with the
way that the function split the text. For example, the function would split sentences at
abbreviations. Furthermore, the html code within the text files further complicated the
sentence splitting process. The NLTK is able to overcome these shortcomings because it
uses machine learning and was trained by an unsupervised algorithm, which allows it to
recognize abbreviations and other problematic sentence elements (Bird et al., 2009).

23
Figure 5.2: Analysis Portion of the “sentExtract” Function. The second half of the
“sentExtract” function performs the necessary steps to identify the words or
phrases and then isolates the sentences. First, the text file is imported as a string
and the “nltk.clean_html” function cleans the string so that the html code is
removed from the string. Then, the “tokenizer.tokenize” function splits the
sentences from the string and creates a list of all the sentences in the document.
The concept vector is then used to check each sentence to see whether or not the
word or phrase occurs in any of the sentences. If there is an occurrence, the
sentence is put into a sentence dictionary where the key word is the concept
vector and the values are the sentences. After this step, a second dictionary is
used to store the concept vectors and sentences under the document title, in this
case the company name.

24
Figure 5.3: “sentExtract” Output. The above represents a sample output from the
function. As previously mentioned, “3M-2010.htm” is the file name of the file that
was analyzed, then the concept vector is next followed by the sentences containing
the words or phrases of interest if it exists in the text. In this sample, the phrases
“clean energy” or “clean energies” do not occur in the text, and therefore the
values following the concept vector are empty. In the second item of the list, the
concept vector “environ respon” was searched and the figure above shows two
sentences that matched the search. One sentence contains the phrase
“environmental responsibility” and the other sentence contains the phrase
“environmental responsibilities.”
Once the sentences are identified and stored, the output can be used in further analysis.
This research paper will look at a simple form of sentiment analysis.
Applications
Regression
One of the first applications that this program can be used for is to study the
correlation between the frequency of words and another metric such as sustainability
scores. This entails performing a simple regression of the sustainability words versus the
Newsweek sustainability scores. In this paper, the Newsweek 2010 “Green” Rankings
were used because of the ease of access and comprehensiveness of the data (Newsweek

25
Inc., 2010). The data includes sustainability scores for 500 largest US companies that are
publically traded.
The data from the Newsweek website is first imported into a .csv file on the local
computer from which the information can be pulled and used to perform a regression.
Figure 6 shows the raw format of the data.
Figure 6: Raw Newsweek 2010 Ranking Data. The raw data file for the
Newsweek 2010 scores is a concatenation of the company name, the industry, and
the 2010 sustainability score. The data is formatted in this way so that the
information can later be used in other functions and other parts of the program. It
should be noted that the raw data contains all 500 companies from the Newsweek
list in order to increase flexibility with the program. This program can analyze
any Fortune 500 company in the same way that the 30 companies are being
analyzed in this report.
After the data is stored and accessible to the program, the program uses previous
functions, such as the “calculateWordFreq” and “calculateNormWordFreq” functions to
perform the analysis on the documents. The program then writes the results into
another .csv file on which the regression analysis can be performed. Figure 6.1 shows
that code that is used to perform this step and Figure 6.2 shows a sample of the output
from the code.

26
Figure 6.1: “writeCSVRegression” Function. This function first sums the output of
the”‘calcualteWordFreq” and “calculateNormWordFreq,” which are the
sustainability word scores, then prints the company names, the scores, and the
extracted scores from the Newsweek raw data into another file.
Figure 6.2: “writeCSVRegression” Output. The output allows for the information
to be easily regressed using Microsoft Excel functions. This output is a sample
version and does not contain all the companies that were used in this report. The
output in this figure is of the non-normalized “calcualteWordFreq” function.
This application was meant to use simple regression analysis to show whether or
not there was a correlation between the number of sustainability words used in the
company’s documents and the Newsweek sustainability scores. Upon performing the
analysis, there does not seem to be any correlation that can be discerned. Figure 6.3
shows the absolute word frequencies regressed against the Newsweek sustainability score.

27
Figure 6.3: Word Frequency (absolute) vs. Newsweek Score. The regression does
not show a significant correlation between the number of sustainability words
used and the respective Newsweek sustainability score. The absolute number of
sustainability words is used in this regression.
As evidenced in Figure 6.3, while there is a slight negative correlation, this correlation is
miniscule and is negligible. Therefore, in terms of absolute number of sustainability
words, there does not appear to be a correlation between these the two metrics. However,
it is also important to consider the normalized word frequency counts because some of
the documents may be much longer than other documents simply because the companies
published more information. Figure 6.4 shows the normalized number of sustainability
words regressed against the same Newsweek 2010 “Green” scores. While there seems to
be a slightly less negative correlation, the correlation is still negligible between the two
variables.

28
Figure 6.4: Word Frequency (normalized) vs. Newsweek Score. The plot shows
the regression of normalized sustainability word frequencies versus the Newsweek
sustainability scores.
Even with the normalized numbers, there does not seem to be any type of correlation
between the variables. In order to further test the correlation, the original list of concept
vectors, Appendix 1, was revised. The original concept vectors included 2 search terms
that are related to environmental sustainability but could perhaps skew the results because
the words occur with great frequency for certain industries but not for others: “remedia*”
and “superfund*”. These are simplified versions of the concept vectors but will match
words such as remediate, remediation, remedial, superfund, and superfunds. When
looking at the results of the word frequencies, these words seemed to appear quite often
for oil and gas companies and for general industrial companies. This seems to make sense
because these words deal with the environmental clean-up and regulations that the

29
companies are required to report on to the U.S. Environmental Protection Agency.
However, upon further consideration, the words are not strictly related to sustainability;
therefore, in Figures 6.5 and 6.6, the two search terms are taken out. When these words
were taken out, 2 companies, Boeing and Schlumberger, ended up with 0 counts for
“sustainable words” because the 2 search terms were the only ones that were in the
annual reports for these 2 companies. These two companies were removed from the
regression as well. The regression was run again without the two search terms and with
the two companies removed from the analysis.
Figure 6.5: Word Frequency (absolute) vs. Newsweek Score Minus Terms and
Companies. Absolute number of sustainability words versus the Newsweek
“Green” score for all the companies minus Boeing and Schlumberger, which had
sustainable word counts of 0 after the search terms, “remedia*” and “superfund*”
were removed.
30
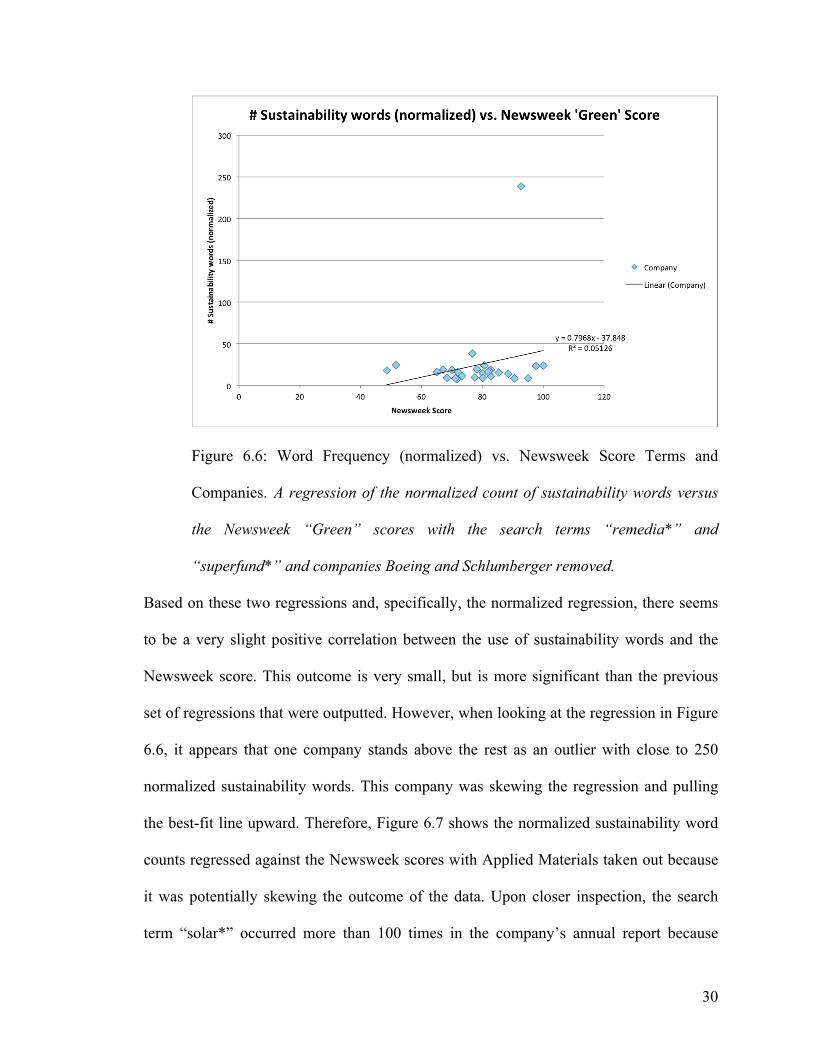
Figure 6.6: Word Frequency (normalized) vs. Newsweek Score Terms and
Companies. A regression of the normalized count of sustainability words versus
the Newsweek “Green” scores with the search terms “remedia*” and
“superfund*” and companies Boeing and Schlumberger removed.
Based on these two regressions and, specifically, the normalized regression, there seems
to be a very slight positive correlation between the use of sustainability words and the
Newsweek score. This outcome is very small, but is more significant than the previous
set of regressions that were outputted. However, when looking at the regression in Figure
6.6, it appears that one company stands above the rest as an outlier with close to 250
normalized sustainability words. This company was skewing the regression and pulling
the best-fit line upward. Therefore, Figure 6.7 shows the normalized sustainability word
counts regressed against the Newsweek scores with Applied Materials taken out because
it was potentially skewing the outcome of the data. Upon closer inspection, the search
term “solar*” occurred more than 100 times in the company’s annual report because
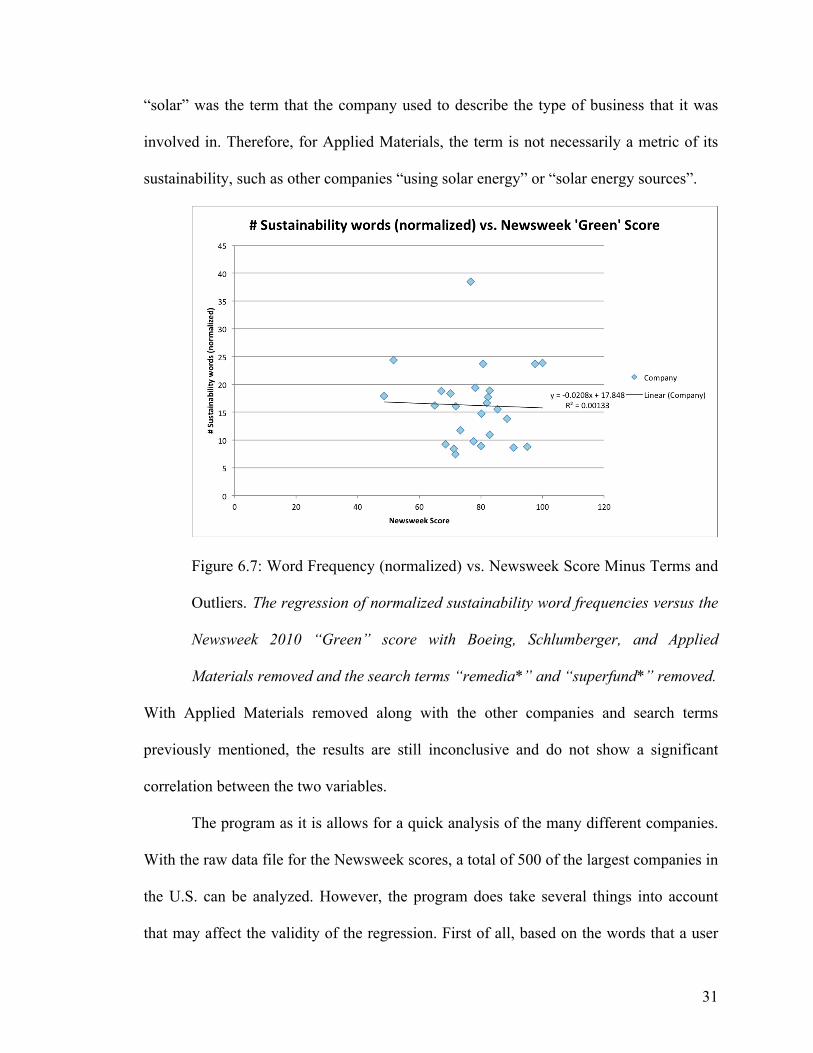
31
“solar” was the term that the company used to describe the type of business that it was
involved in. Therefore, for Applied Materials, the term is not necessarily a metric of its
sustainability, such as other companies “using solar energy” or “solar energy sources”.
Figure 6.7: Word Frequency (normalized) vs. Newsweek Score Minus Terms and
Outliers. The regression of normalized sustainability word frequencies versus the
Newsweek 2010 “Green” score with Boeing, Schlumberger, and Applied
Materials removed and the search terms “remedia*” and “superfund*” removed.
With Applied Materials removed along with the other companies and search terms
previously mentioned, the results are still inconclusive and do not show a significant
correlation between the two variables.
The program as it is allows for a quick analysis of the many different companies.
With the raw data file for the Newsweek scores, a total of 500 of the largest companies in
the U.S. can be analyzed. However, the program does take several things into account
that may affect the validity of the regression. First of all, based on the words that a user

32
selects, the total frequency of sustainability words for a particular company may be
dramatically changed. Therefore, it is important that the word list contain a
comprehensive list of all words that might be related to sustainability. Furthermore, even
though the program allows for phrase searches, not every word that the program
considers “sustainable” is actually used to mean sustainability in the documents. This is a
shortcoming of the program as it searches for the literal occurrence of the word, but
cannot understand how the word is being used.
Another item of concern that arises when analyzing the set up of this regression is
that the occurrence of sustainability words simply does not correlate with the
sustainability scores because companies can use whatever words to describe their
environmental activities, similar to what Cho et. al (2010) noted. Given this, it is possible
to build a more predictive model by incorporating other variables that would potentially
better predict the companies’ sustainability. For example, the companies’ corporate
sustainability reports can also be analyzed to gather information about how the company
specifically deals with sustainability. Financial metrics can also be used in the analysis by
adding onto the existing program so that the program searches for environmentally-
related capital expenditures and uses this as another variable in a multivariate regression.
These changes would potentially allow the program to find a stronger correlation between
the sustainability word use and Newsweek sustainability score.
Sentiment Analysis
Another application that this program can be used for is to analyze the sentences
that have been extracted. These sentences can potentially contain positive and negative
sentiments that aim to indicate a certain emotion or feeling towards the readers. For

33
example, Cho et al. (2010) mentioned that, in their research, worse environmental
performers would often use verbal language to bias the company’s reporting. In the same
way, a very basic application of this program is to perform a similar study on the
sentences that have been extracted. This automated tool helps to simplify and quicken the
process through which these types of analyses can be done.
The next section of this paper will detail the process by which the sentences are
scored for sentiment. Figure 7 presents the full function that is used to analyze the
extracted sentences.

34
Figure 7: “sentenceSentiment” Function. This function performs the sentiment
analysis of the extracted sentences. First, the program sources a list of positive
and negative words that were downloaded online and created by Neal Caren of
the University of North Carolina (Caren, n.d.). These words are then stored as
lists and these lists are cross-checked with the sentences that were extracted. The
occurrence of positive and negative words are noted in the program as the
variables “pos_count” and “neg_count,” respectively. Once again the NLTK
“Punkt” module is used to split the sentences that were extracted into individual
words so that those could be cross-examined with the positive and negative word
lists. A final feature of the function sums up all the positive and all the negatives
words for each document and creates a dictionary with the key as the file name,
which is the company name, and the values as the positive and negative scores.
In the output from the program, Figure 7.1, it is interesting to note the general greater use
of positive words in the sentences having to do with the environment. The total use of
positive words is almost double the use of negative words. Furthermore, of the three
companies with the highest occurrences of positive words associated with sentences
relating to the environment, Applied Materials, Halliburton, and Sunoco, two are in the
oil and gas industry. This is an interesting because it seems follow along with the idea
that oil and gas companies will use words in the annual reports to explain away
environmental issues, which is similar to the idea that Cho et al. (2010) mentioned.
For example, looking more closely at the sentences extracted from the Halliburton
annual report, which received a positive word use score of 129 vs. 74 negative words, it
is possible to see that the company potentially used the positive words to offset the

35
negative words that were used to describe a lot of the remediation and Superfund clean-
up activities. However, it should be noted that these numbers may be inflated due to the
nature of the program and the way that it identifies words. Without a suitable
understanding of the context of these sentences an absolute count of the frequency of
positive and negative words may be biased and not portray the true sentiment of the
sentence.
Figure 7.1: “sentenceSentiment” Output. The generated output from the program
shows the company name, industry, positive and negative word scores for each
company’s 2010 annual report. It should be noted that there are nearly twice as
many positive terms as negative terms in sentences having to do with the
environment.

36
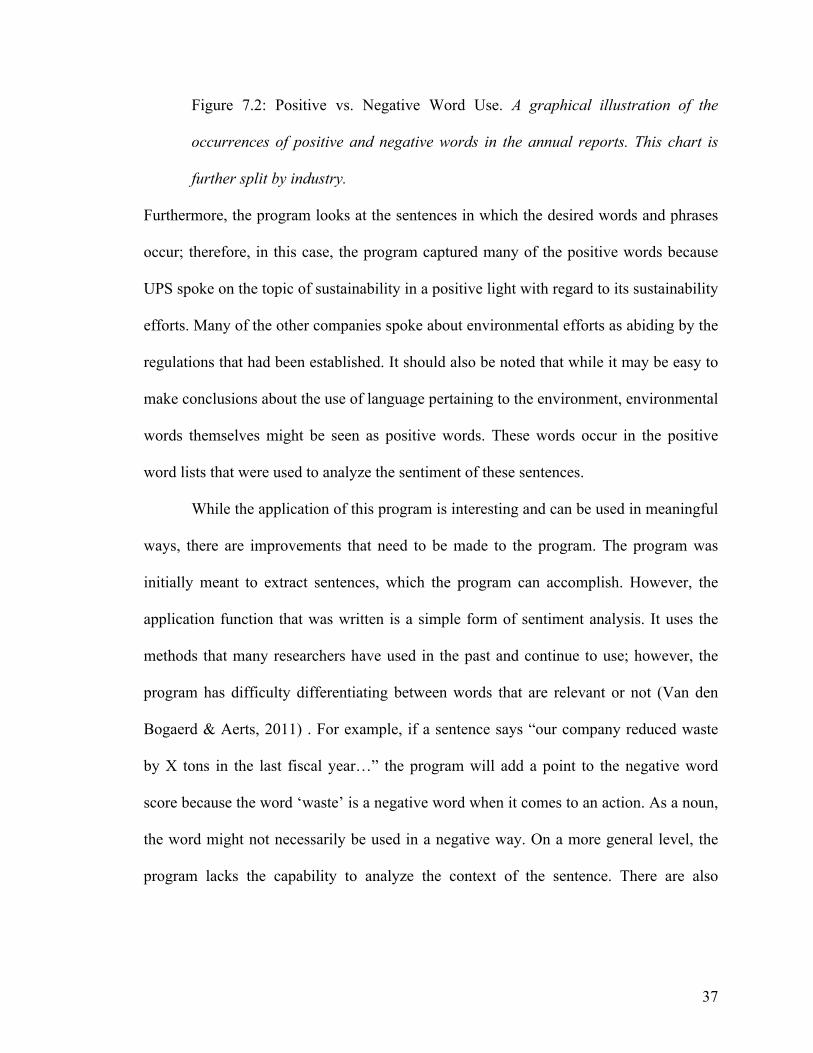
Figure 7.2 further shows the breakdown of positive and negative word occurrences based
on the different industries. Looking at this figure, there does not seem to be any
noticeable pattern with regards to how the analyzed companies used positive and negative
words. However, it was interesting to see that United Parcel Service (UPS) used no
negative words in talking about the environment or its sustainability efforts. Upon closer
inspection, one of the main factors for this was that UPS included a detailed description
of its sustainability efforts with little to no mention of the environmental litigations in
which it was involved. The mentions within the annual reports are mostly descriptions of
how the company may potentially be affected by environmental litigation and
governmental regulations.
Consumer Products
Food and Beverage
General Industrials
Oil and Gas Technology Transportation and Aerospace
37
Figure 7.2: Positive vs. Negative Word Use. A graphical illustration of the
occurrences of positive and negative words in the annual reports. This chart is
further split by industry.
Furthermore, the program looks at the sentences in which the desired words and phrases
occur; therefore, in this case, the program captured many of the positive words because
UPS spoke on the topic of sustainability in a positive light with regard to its sustainability
efforts. Many of the other companies spoke about environmental efforts as abiding by the
regulations that had been established. It should also be noted that while it may be easy to
make conclusions about the use of language pertaining to the environment, environmental
words themselves might be seen as positive words. These words occur in the positive
word lists that were used to analyze the sentiment of these sentences.
While the application of this program is interesting and can be used in meaningful
ways, there are improvements that need to be made to the program. The program was
initially meant to extract sentences, which the program can accomplish. However, the
application function that was written is a simple form of sentiment analysis. It uses the
methods that many researchers have used in the past and continue to use; however, the
program has difficulty differentiating between words that are relevant or not (Van den
Bogaerd & Aerts, 2011) . For example, if a sentence says “our company reduced waste
by X tons in the last fiscal year…” the program will add a point to the negative word
score because the word ‘waste’ is a negative word when it comes to an action. As a noun,
the word might not necessarily be used in a negative way. On a more general level, the
program lacks the capability to analyze the context of the sentence. There are also

38
nuances in the English language that the program is not able to identify. Sarcasm may be
one of these.
Another potential problem is that the program as it is does not normalize the data
that is extracted. Therefore, in some cases, companies may publish a large amount of
information and score better because there are more sentences to score. This may be one
reason why Halliburton received such a high overall score, because the document was
longer. On a related note, the program currently gives a lower score to companies that
publish little information regarding environmental activities because it scores words that
occur within the same sentence as the concept vectors that were selected. If a company
does not use the same words or phrases as the concept vectors, then the sentence
sentiment scores may be lower. An effort was made to use general words in a variety of
industries as the concept vectors; however, there is still the possibility that companies do
not use the same words as the concept vectors. While the program is able to perform the
tasks for which it was made, further improvements must be made to produce a more
comprehensive program.
Analysis of the program
Overall, the program, which was initially created in this study to calculate word
frequencies and extract sentences in which words or phrases of interest occurs, is able to
produce the results that it aimed to produce. Furthermore, analyses were also performed
to show the applicability of the program to a wide range of research. The word
frequencies were regressed against a sustainability score published by Newsweek and the
sentences that were extracted were scored based on positive and negative sentiment.
These types of analyses show the potential of automatic content analysis programs.

39
However, while the program is able to perform the tasks for which it was created, there
are improvements that can be made to further the analytic capabilities of the program.
One of the most important inputs into program was the annual report that the
companies published. This research used the annual reports because the reports are
publicly available, and companies will often publish information regarding the
company’s initiatives and activities. However, as mentioned earlier in the first application
section, other reports can also be analyzed with this tool to broaden the scope of focus.
One reason for this is that certain companies may publish more details about their
environmental activities in annual reports. For example, UPS published a large amount of
information about the sustainability efforts of the company, while only briefly
mentioning the environmental litigation and concerns that the company had. On the other
hand, many oil and gas companies, such as Sunoco and Schlumberger, extensively
discussed the remediation efforts and Superfund sites. Therefore, in some ways,
unbalanced disclosure may actually penalize a company. On a similar note, some
companies will use more words to describe certain environmental activities. The program
takes this into account by normalizing the frequency of sustainability words by dividing
by the total umber of words in the document. Using additional sources of information,
such as corporate sustainability reports, would potentially balance the difference in
disclosure by companies.
In some cases, companies that are not performing well will use words to
neutralize their lack of performance. As Cho et al. (2010) mentioned, companies would
use more optimistic words in some cases to bias the representation of the status of the
environmental programs. One way to deal with this issue, as briefly discussed in the

40
application section of this paper, is to find more tangible metrics that the program can use
in the analysis. For example, the program is built to search for words and phrases of
interest, but it can be adjusted so that it searches for integers as well. Specifically,
environmentally-related capital expenditure can be used as another metric of the
company’s focus on the environment. This metric can be normalized by the market
capitalization of the company. Furthermore, companies should be split into industries to
more accurately reflect a company’s environmental performance versus its peers. A
similar metric that can be used is an integer metric such as green house gas (GHG)
emissions. Ultimately, any metric that is of interest can be used as long as the program is
manipulated to extract and analyze the information. The program as it currently is
performs an analysis on one type of data, verbal strings of characters; however, it is
conceivable for the program to take in and analyze other types of information as well.
These additional metrics could perhaps represent, more clearly, the reality of a company's
sustainability efforts.
Conclusion
The intent of this research was to examine the methods that are commonly used in
content analysis and construct a tool that would be able to automate the process of
analyzing the content. The resulting tool is a combination of multiple functions that
allows the user to dissect documents to extract words or phrases that are of interest, in
this case, sustainability-related words and phrases. More specifically, the tool will count
the frequency of words or phrases that are of interest and that are user-defined. The
program also extracts the sentences in which these words or phrases are contained. With

41
these outputs, the tool sets up the necessary building blocks for further analysis to be
done. In this paper, the output from the program is applied in two ways.
First, a regression analysis is performed with the number of sustainability words,
both absolute and normalized, versus a sustainability score that was published by
Newsweek in 2010. The outcome of this analysis did not show any significant correlation
between the frequency of sustainability words and the sustainability score; however, it
does serve as a proof of the concept that the program is able to conduct the necessary
precursor steps required for further analysis, which in this case was to count the
frequency of sustainability words. Second, a simple form of sentiment analysis was
performed on the sentences that were extracted from the program. The program’s initial
output was a dictionary of all the sentences that contained the words or phrases of interest.
These sentences were then cross-checked with positive and negative word lists to
calculate positive and negative word scores. These scores served as a basic form of
sentiment analysis.
Overall, the program was able to perform the analysis that it was intended for;
however, there are areas for future research that can potentially improve the accuracy of
the program. By increasing the flexibility of the program to analyze integer values, such
as environmental capital expenditure or GHG emissions, the program can better capture
metrics that pertain to the reality of a company’s sustainability initiatives, instead of just
what is written in annual reports. Furthermore, a problem with most computer programs
is that the programs lack the ability to analyze the context in which words are used.
Similarly, the program in this research, while functional and appropriate for the task at
hand, is unable to detect the context and meaning of sentences. Moving forward,

42
different techniques can be used to help the program “learn” the types of language that it
is analyzing. Particularly, a type of machine learning can be performed to “teach” the
program what type of language is common in annual reports. Once the program is able to
identify the differences in the types of language used in annual reports, it can identify
when the report is talking about the companies’ sustainability efforts versus just
describing a general statement about the environment. Additionally, sentiment analysis in
combination with word or phrase searching would allow the program to be more
powerful. For example, a researcher can specify that only sentences with positive uses of
environmental words illustrate desire for sustainability within the company. The program
can then only extract sentences that are positively referring to ideas of sustainability.
These suggestions for future research and other changes can be made to the existing
program to improve the accuracy of the program; however, the program as it stands, is a
first step towards a more comprehensive automated analytics tool.

43
References
Bird, S., Klein, E., & Loper, E. (2009). Natural language processing with Python.
Sebastopol, CA: O'Reilly Media, Inc.
Caren, N. (n.d.). An introduction to text analysis with Python, Part 3. Neal Caren.
Retrieved July 25, 2014, from http://nealcaren.web.unc.edu/an-introduction-to-
text-analysis-with-python-part-3/
Cho, C. H., Roberts, R. W., & Patten, D. M. (2010). The language of U.S. corporate
environmental disclosure. Accounting, Organizations and Society, 35(4), 431-443.
doi:http://dx.doi.org/10.1016/j.aos.2009.10.002
Clarkson, P. M., Overell, M. B., & Chapple, L. (2011). Environmental reporting and its
relation to corporate environmental performance. Abacus, 47(1), 27-60.
doi:10.1111/j.1467-6281.2011.00330.x
Denscombe, M. (2010). The good research guide: For small-scale social research
projects. Maidenhead, England: McGraw-Hill International.
English, D. M., & Schooley, D. K. (2014). The evolution of sustainability reporting. CPA
Journal, , 26-35.
E. I. du Pont de Nemours and Company. (2008). Glossary of common sustainability
terms. Retrieved July 18, 2014, from
http://www2.dupont.com/Packaging_Graphics/en_GB/assets/downloads/Glossary
_of_SustainabilityTerms_EU.pdf

44
Guthrie, J., & Abeysekera, I. (2006). Content analysis of social, environmental reporting:
What is new? Journal of Human Resource Costing & Accounting, 10(2), 114-126.
Hooks, J., & van Staden, C. J. (2011). Evaluating environmental disclosures: The
relationship between quality and extent measures. The British Accounting Review,
43(3), 200-213. doi:http://dx.doi.org/10.1016/j.bar.2011.06.005
Ilinitch, Y. A., Soderstrom, N. S., & Thomas, T. E. (1998). Measuring corporate
environmental performance. Journal of Accounting and Public Policy, 17(4–5),
383-408. doi:http://dx.doi.org/10.1016/S0278-4254(98)10012-1
Jose, A., & Lee, S. (2007). Environmental reporting of global corporations: A content
analysis based on website disclosures. Journal of Business Ethics, 72(4), 307-321.
doi:10.1007/s10551-006-9172-8
Kelty, C. M. (2011). Logical instruments: regular expressions, AI and thinking about
thinking. In F. Bianchini, S. Franchi (Eds.), The search for a theory of cognition
early mechanisms and new ideas. Amsterdam, Netherlands: Rodopi Press.
Kloptchenko, A., Magnusson, C., Back, B., Visa, A., & Vanharanta, H. (2002). Mining
textual contents of quarterly reports. TUCS Technical Reports, 515
Kloptchenko, A., Eklund, T., Karlsson, J., Back, B., Vanharanta, H., & Visa, A. (2004).
Combining data and text mining techniques for analysing financial reports.
Intelligent Systems in Accounting, Finance & Management, 12(1), 29-41.
doi:10.1002/isaf.239

45
Laver, M., Benoit, K., & Garry, J. (2003). Extracting policy positions from political texts
using words as data. American Political Science Review, 97(02), 311-331.
Mattlage, A. J. (2008). Taking apart an industry: Examining the motivations of
organizations participating in the deconstruction industry through content
analysis of organizations' websites. (M.A., Tufts University). ProQuest
Dissertations and Theses. (304428823).
Newsweek, Inc. (2010). Green rankings 2010: U.S. companies. Retrieved July 24, 2014,
from http://www.newsweek.com/2010/10/18/green-rankings-us-companies.html
Porac, J. F., Wade, J. B., & Pollock, T. G. (1999). Industry categories and the politics of
the comparable firm in CEO compensation. Administrative Science Quarterly,
44(1), 112-144.
Porter, M. E., & Kramer, M. R. (2011). The big idea: Creating shared value. Cambridge,
MA: Harvard Business School
Qiu, X. Y., Srinivasan, P., & Hu, Y. (2014). Supervised learning models to predict firm
performance with annual reports: An empirical study. Journal of the Association
for Information Science & Technology, 65(2), 400-413. doi:10.1002/asi.22983
Tetlock, P. C., Saar-Tsechansky, M., & Macskassy, S. (2008). More than words:
Quantifying language to measure firms' fundamentals. The Journal of Finance,
63(3), 1437-1467.

46
Uotila, J., Maula, M., Keil, T., & Zahra, S. A. (2009). Exploration, exploitation, and
financial performance: Analysis of S&P 500 corporations. Strategic Management
Journal, 30(2), 221-231.
U.S. Securities Exchange Commission. (n.d.). Form 10-K. SEC.gov. Retrieved June 30,
2014, from http://www.sec.gov/answers/form10k.htm
Van den Bogaerd, M., & Aerts, W. (2011). Applying machine learning in accounting
research. Expert Systems with Applications, 38(10), 13414-13424.
doi:http://proxy.library.upenn.edu:2092/10.1016/j.eswa.2011.04.172
Waddock, S., & McIntosh, M. (2011). Business unusual: Corporate responsibility in a 2.0
world. Business & Society Review (00453609), 116(3), 303-330.
doi:10.1111/j.1467-8594.2011.00387.x

47
Appendix
Appendix 1: Basic list of concept vectors that was used in the majority of the analysis on
this paper, unless otherwise noted.
Appendix 2: Complete code from the project.
import matplotlib.pyplot as plt import numpy as np import urllib import nltk import re import os pathToSets = '..' + os.sep + 'Capstone Project' + os.sep + 'sets' pathToScores = '..' + os.sep + 'Capstone Project' + os.sep + 'scores' dirWordLists = '..' + os.sep + 'Capstone Project' + os.sep +'word_lists' #get the concept vectors (or the words that we are searching for) from the txt file def getConceptVectors(): f = open('conceptvectors.txt','r').read() f = f.split('\n') return(f) #this calculates the frequency of words (absolute) def calculateWordFreq(setName,option): conceptVectors = getConceptVectors() setLocation = pathToSets + os.sep + setName file_list = os.listdir(setLocation) just_counts_Dict= {} file_list.remove('.DS_Store') file_list.sort() countHits = [] for i in list(range(len(file_list))): file_read = open(os.path.join(setLocation, file_list[i]), 'r').read() file_read = nltk.clean_html(file_read) vector_count = [] just_counts = [] file_read_count = []

48
for j in list(range(len(conceptVectors))): txtCount = 0 txtCount = len(re.findall(conceptVectors[j],file_read,flags = re.IGNORECASE)) file_read_count.append(len(re.findall(conceptVectors[j],file_read,flags = re.IGNORECASE))) vector_count.append((conceptVectors[j],txtCount)) just_counts.append(file_read_count) countHits.append((file_list[i],vector_count)) just_counts_Dict[file_list[i]] = just_counts if option == 0: return(countHits) elif option == 1: return(just_counts_Dict) #this calculates the frequency of words (Normalized) def calculateNormWordFreq(setName,option): conceptVectors = getConceptVectors() setLocation = pathToSets + os.sep + setName file_list = os.listdir(setLocation) file_list.remove('.DS_Store') file_list.sort() countHits = [] just_counts_Dict = {} for i in list(range(len(file_list))): file_read = open(os.path.join(setLocation, file_list[i]), 'r').read() file_read = nltk.clean_html(file_read) vector_count = [] just_counts = [] file_read_count = [] file_total_words = float(len(file_read.split())) for j in list(range(len(conceptVectors))): txtCount = 0 txtCount = (len(re.findall(conceptVectors[j],file_read,flags = re.IGNORECASE))/(file_total_words))*100000.0 file_read_count.append((len(re.findall(conceptVectors[j],file_read,flags = re.IGNORECASE))/(file_total_words)) * 100000.0) vector_count.append((conceptVectors[j],txtCount)) just_counts.append(file_read_count) countHits.append((file_list[i],vector_count)) just_counts_Dict[file_list[i]] = just_counts if option == 0: return(countHits) elif option == 1: return(just_counts_Dict) def writeCSVWordFreqScores(function): daData = function import string alphabet = list(string.ascii_lowercase) if function == calculateWordFreq('trainingset',0): f = open('wordFreqScores.txt', 'w') f.write('Company') for i in list(range(len(daData[0][1]))): f.write(',' + str(daData[0][1][i][0])) f.write(',' + 'SUM' + '\n') for j in list(range(len(daData))): f.write(str(daData[j][0][:-9]) + ',') for n in list(range(len(daData[0][1]))): f.write(str(daData[j][1][n][1]) + ',') f.write('=SUM(B' + str(j+2) + ':K' + str(j+2) + ')' + '\n') f.write('SUM' + ',') for k in alphabet[1:16]: f.write('=SUM(' + str(k) + '2:' + str(k) + '31)' + ',') f.close() print('Done writing file wordFreqScores.txt') elif function == calculateNormWordFreq('trainingset',0): f = open('wordNormFreqScores.txt', 'w') f.write('Company') for i in list(range(len(daData[0][1]))): f.write(',' + str(daData[0][1][i][0])) f.write(',' + 'SUM' + '\n')

49
for j in list(range(len(daData))): f.write(str(daData[j][0][:-9]) + ',') for n in list(range(len(daData[0][1]))): f.write(str(daData[j][1][n][1]) + ',') f.write('=SUM(B' + str(j+2) + ':K' + str(j+2) + ')' + '\n') f.write('SUM' + ',') for k in alphabet[1:16]: f.write('=SUM(' + str(k) + '2:' + str(k) + '31)' + ',') f.close() print('Done writing file wordNormFreqScores.txt') def sentExtract(setName): conceptVectors = getConceptVectors() setLocation = pathToSets + os.sep + setName file_list = os.listdir(setLocation) file_list.remove('.DS_Store') file_list.sort() tokenizer = nltk.data.load('tokenizers/punkt/english.pickle') #sentenceEnds = re.compile('[.!?][\s]{1,2}(?=[A-Z])') file_list_vector_count = [] just_counts = [] final_dict = {} for i in list(range(len(file_list))): file_read = open(os.path.join(setLocation, file_list[i]), 'r').read() file_read =re.sub(r'\n',' ',file_read) #sentenceList = sentenceEnds.split(file_read) file_read = nltk.clean_html(file_read) sentenceList = tokenizer.tokenize(file_read) vector_count = [] file_read_count = [] sent_dict = {} for j in list(range(len(conceptVectors))): foundword_sentence_list = [] #list of sentences with the word in the sentence sentence_count = 0 for n in list(range(len(sentenceList))): if re.findall(conceptVectors[j],sentenceList[n],flags = re.IGNORECASE) != []: foundword_sentence_list.append(sentenceList[n]) sent_dict[conceptVectors[j]] = foundword_sentence_list final_dict[file_list[i]] = sent_dict return(final_dict) #sentence_count = len(foundword_sentence_list) #file_read_count.append(sentence_count) #vector_count.append((conceptVectors[j],sentence_count)) #just_counts.append((file_read_count)) #file_list_vector_count.append((file_list[i],vector_count)) #return(file_list_vector_count) #return(just_counts) def getScores(): scoresLocation = pathToScores + os.sep + 'newsweek_scores_2010.csv' f = open(scoresLocation,'r').read() f = f.replace('"','') f = f.split('\r') f = [f[i].split('|') for i in list(range(len(f)))] #for j in list(range(len(f))): # f[j][0] = f[j][0].replace('-',' ') # f[j][0] = f[j][0].replace('!','') return(f) def matchScores(): scores = getScores() matchedScores_Dict = {} trainingSetLocation = pathToSets + os.sep + 'trainingset' file_list = os.listdir(trainingSetLocation) file_list.remove('.DS_Store') file_list.sort() file_list_names = [file_list[i][:-9] for i in list(range(len(file_list)))] #file_list_names = [file_list_names[j].replace('-',' ') for j in list(range(len(file_list_names)))]

50
#file_list_names = [file_list_names[n].replace('!', '') for n in list(range(len(file_list_names)))] file_list_names = filter(None, file_list_names) for j in list(range(len(file_list_names))): for i in list(range(len(scores))): if re.findall(file_list_names[j], scores[i][0]) != []: matchedScores_Dict[file_list[j]] = scores[i][1:] return(matchedScores_Dict) def writeCSVRegression(): wordFreq = calculateWordFreq('trainingset',1) normWordFreq = calculateNormWordFreq('trainingset',1) scores = matchScores() f = open('Regression.txt', 'w') f.write('Company,' + '# Sustainability Words,' + 'Newsweek Score\n') companies = sorted(wordFreq.keys()) for i in companies: f.write(str(i[:-9]) + ',' + str(sum(wordFreq[i][0])) + ',' + str(scores[i][1]) + '\n') f.write('\n\n') f.write('Company,' + '# Sustainability Words,' + 'Newsweek Score\n') for j in companies: f.write(str(j[:-9]) + ',' + str(sum(normWordFreq[j][0])) + ',' + str(scores[j][1]) + '\n') f.close() print('Done writing file Regression.txt') def sentenceSentiment(option): #option = 0 or 1 from nltk.tokenize.punkt import PunktWordTokenizer urlneg = 'http://www.unc.edu/~ncaren/haphazard/negative.txt' urlpos = 'http://www.unc.edu/~ncaren/haphazard/positive.txt' urllib.urlretrieve(urlneg,dirWordLists + os.sep + 'negative.txt') urllib.urlretrieve(urlpos,dirWordLists + os.sep + 'positive.txt') neg_list = open(dirWordLists + os.sep + 'negative.txt').read() pos_list = open(dirWordLists + os.sep + 'positive.txt').read() neg_list = sorted(list(set(neg_list.split('\n')))) neg_list = filter(None, neg_list) pos_list = sorted(list(set(pos_list.split('\n')))) pos_list = filter(None, pos_list) sent_Dict_sentiment = sentExtract('trainingset') sent_Dict = sentExtract('trainingset') setLocation = pathToSets + os.sep + 'trainingset' file_list = os.listdir(setLocation) file_list.remove('.DS_Store') file_list.sort() conceptVectors = getConceptVectors() for i in file_list: for j in conceptVectors: for n in list(range(len(sent_Dict[i][j]))): pos_count = 0 neg_count = 0 words = PunktWordTokenizer().tokenize(sent_Dict[i][j][n]) for word in words: if word in pos_list: pos_count+=1 elif word in neg_list: neg_count+=1 sent_Dict_sentiment[i][j][n] = (pos_count, neg_count) if option == 0: #calculate overall positive and negative scores for documents return(sent_Dict_sentiment) elif option == 1: #calculate positive and negative separately for each document sent_Dict_Sum_sentiment = {} for x in file_list: total_pos = 0 total_neg = 0 for y in conceptVectors: for z in list(range(len(sent_Dict_sentiment[x][y]))): total_pos += sent_Dict_sentiment[x][y][z][0] total_neg += sent_Dict_sentiment[x][y][z][1] sent_Dict_Sum_sentiment[x] = [total_pos,total_neg]

51
return(sent_Dict_Sum_sentiment) def findIndustry(): scores = getScores() industry_Dict = {} trainingSetLocation = pathToSets + os.sep + 'trainingset' file_list = os.listdir(trainingSetLocation) file_list.remove('.DS_Store') file_list.sort() file_list_names = [file_list[i][:-9] for i in list(range(len(file_list)))] file_list_names = filter(None, file_list_names) for j in list(range(len(file_list_names))): for i in list(range(len(scores))): if re.findall(file_list_names[j], scores[i][0]) != []: industry_Dict[file_list_names[j]] = scores[i][1] return(industry_Dict) def writeCSVSentenceSentiment(): f = open('sentenceSentimentScores.txt', 'w') daData = sentenceSentiment(1) keys = sorted(daData.keys()) industry_Dict = findIndustry() import string alphabet = list(string.ascii_lowercase) f.write('Company' + '|' + 'Industry' + '|' + 'Positive' + '|' + 'Negative' +'\n') for i in keys: f.write(str(i[:-9]) + '|' + industry_Dict[i[:-9]] + '|' + str(daData[i][0]) + '|' + str(daData[i][1]) + '\n') f.write('SUM' + '|' + ' |') for k in alphabet[2:4]: f.write('=SUM(' + str(k) + '2:' + str(k) + '31)' + '|') f.close() print('Done writing file sentenceSentimentScores.txt')