A Business Activities Tax for Minnesota · A Business Activities Tax for Minnesota ... franchise...
38
A Business Activities Tax for Minnesota A Report Prepared for the Legislative Coordinating Commission Laura Kalambokidis University of Minnesota September 2005
Transcript of A Business Activities Tax for Minnesota · A Business Activities Tax for Minnesota ... franchise...

A Business Activities Tax for Minnesota A Report Prepared for the Legislative Coordinating Commission
Laura Kalambokidis University of Minnesota
September 2005

Contact information: Department of Applied Economics 231 Classroom Office Building 1994 Buford Avenue St. Paul, Minnesota 55108 email: [email protected]

September 2005 To The Members of the Legislative Coordinating Commission Oversight Committee: It is my pleasure to submit to you the report entitled A Business Activities Tax for Minnesota, as required under 1997 Minnesota Laws Ch. 32l, Art. 5 § 18(1), as amended by 1998 Minnesota Laws Ch. 389, Art. 16 § 27. The purpose of this report is to analyze the effects of replacing the present corporate franchise tax (measured by the net income of C corporations) with a business activity tax (“BAT”) on value added. This report shows the effects of substituting a BAT, apportioned by sales only, for the corporate franchise tax by sector and by business type (C corporations, S corporations, partnerships, and proprietorships). It also includes the estimates of the cost of a de minimus exemption to the BAT and analysis of the effect on C corporations of a revenue-neutral BAT apportioned according to current (1999) law. The approximate cost of preparing this report was $145,000. Sincerely,
Laura Kalambokidis


Table of Contents
Page
Executive Summary ...................................................................................................................1
Chapter 1: Introduction .............................................................................................................5
Chapter 2: The Minnesota Business Tax Database...................................................................7
Chapter 3: Replacing Corporate Franchise Tax Revenue for Tax Year 1999.......................................................................................................13
Chapter 4: Effects of a Minnesota BAT by Business Type ....................................................19
Chapter 5: The Effect of a Business Activities Tax by Industry ............................................21
Chapter 6: Effects of a BAT Small Business Exemption .......................................................25
Chapter 7: Forecasting BAT Receipts ....................................................................................29


Executive Summary A Business Activities Tax
This study analyzes the effects of a revenue-neutral replacement of the current Minnesota
Corporate Franchise Tax (CFT) and minimum fee with a consumption-type Business Activities
Tax (BAT) on all firms doing business in Minnesota. The BAT is a tax on the value-added of all
firms, regardless of organizational form. The base of the BAT is equivalently equal to (1) the
sum of the payments to factors of production (labor and capital) and (2) the difference between a
firm’s sales and its purchases from other businesses.1 A “consumption-type” BAT allows full
expensing for purchases of depreciable capital assets, and disallows depreciation allowances. As
specified in the mandating legislation, in this study, the BAT for multi-state firms is apportioned
according to the firm’s share of total sales in Minnesota.
The Business Activities Tax Database
The Minnesota Business Activities Tax Database (hereafter, the database) was
constructed under the assumption that all firms doing business in Minnesota would have nexus
for the Minnesota BAT. Therefore, the database includes records for each firm that had nexus
for any major Minnesota tax2 during tax year 1999, the most recent year of federal tax data
available at the time the study was begun. For each firm, the database record includes variables
from the state tax filing, variables from the federal tax return (where available), and imputed
variables that were necessary for simulating the base of a BAT, but which were available
nowhere on the tax returns. The database is made up of 831,689 firms distributed by type of firm
as shown below:
Firm type Number of Records
in the Database Total C-corps 60,956 Total S-corps 59,815 Total Partnerships 34,051 Total Sole Props 420,498 Total Farms 84,431 Total rent-earners 169,619 Total other (FI, Coops, LLCs) 2,319 Total businesses 831,689
1A detailed discussion of a state value-added tax can be found in Michigan Department of Revenue, Office of Revenue and Tax Analysis. The Michigan Single Business Tax 1999-2000, August 2003. 2 We did not explicitly include firms with MinnesotaCare tax liability, although many of those will likely be captured in the other categories.
1

Results
We estimate that replacing 1999 corporate franchise tax and minimum fee revenues with
a broad-based BAT on all firms doing business in Minnesota would have required a BAT rate of
0.71 percent. Note that the 0.71 percent rate is revenue-neutral only for 1999. The revenue-
neutral rate in other years would differ from 0.71 percent because of changes in CFT receipts and
changes in the BAT base in those years.
For businesses that filed no entity-level taxes in 1999, but which would nevertheless be
liable for the BAT, we had only sales tax and income tax withholding information, which was
insufficient to impute the variables necessary to estimate the BAT base. Therefore, the estimated
tax base for these entities is based on factors: gross sales for those companies with collecting
general sales tax in 1999, and gross wages for those companies withholding income tax (and not
remitting sales tax). Eliminating these 21,859 companies from the calculation would increase
the required revenue neutral rate to 0.81%.
For C-corps filing a CFT return (Minnesota Form M-4), BAT liability calculated at the
revenue-neutral rate is less than CFT liability, generating an overall tax cut for M-4 filers of
$391,569,608, and an average change in liability of -$8,430. Of the 46,451 M-4 filers, 19,970
have a tax cut, with an average tax change of -$26,374 and an average tax liability of $7,020.
17,100 M-4 filers have a tax increase, with an average change of $7,902 and an average tax
liability of $10,317. 9,381 M-4 filers have no change in tax.
A BAT that is revenue-neutral for M-4 filers only would require a rate on those taxpayers
of 1.58%. Applying this increased rate to M-4 filers alone can illustrate the distribution of the
effects of the BAT by industry. Under this simulation, the industries with aggregate tax cuts (in
descending order of the percentage cut) would be management of companies, finance and
insurance, utilities, manufacturing, information, and real estate. The industries with aggregate
tax increases (in descending order of the percentage increase) would be health care, professional
and technical services, mining, retail trade, construction, accommodation and food services,
transportation, other services, agriculture, educational services, administrative and waste
services, arts and entertainment, and wholesale trade.
2

Allowing each taxpayer, including each member of a unitary group, to exempt the first
$100,000 of its BAT base is estimated to raise the required revenue-neutral BAT rate to 0.86%.
Under the exemption, 588,393 out of 831,639 total businesses (66,462 of which had liability for
CFT or minimum fee in 1999) are exempt from the BAT. Ninety-two percent of the exempt
firms (539,997) are Schedule C, E, and F filers (farm and nonfarm proprietors and rent-earners).
At this level of exemption, 134,551 proprietors (Schedule C, E, or F filers) would pay BAT.
3


Chapter 1: Introduction
This study analyzes the effects of a revenue-neutral replacement of the current Minnesota
Corporate Franchise Tax (CFT) and minimum fee with a consumption-type Business Activities
Tax (BAT) on all firms doing business in Minnesota. The BAT is a tax on the value-added of all
firms, regardless of organizational form. The base of the BAT is equivalently equal to (1) the
sum of the payments to factors of production (labor and capital) and (2) the difference between a
firm’s sales and its purchases from other businesses.3 A “consumption-type” BAT allows full
expensing for purchases of depreciable capital assets, and disallows depreciation allowances. As
specified in the mandating legislation, in this study, the BAT for multi-state firms is apportioned
according to the firm’s share of total sales in Minnesota.
This study estimates the revenue-neutral tax rate for a Minnesota BAT. We also report
how the revenue-neutral switch to a BAT would affect tax liability for firms doing business in
Minnesota by type of firm (Chapter 4) and by industry (Chapter 5). In Chapter 6 we report the
effects of a small business exemption from the BAT. The steps necessary to produce these
analyses are listed in Figure 1.1. The first step, building the Business Activities Tax Database, is
described in Chapter 2. Chapter 3 outlines the second step, simulating the BAT base for firms in
the database.
As explained in Chapter 2, the Business Activities Tax Database includes records from
tax year 1999, and Chapter 7 forecasts BAT receipts for future years.
3 A detailed discussion of a state value-added tax can be found in Michigan Department of Revenue (2003).
5

Figure 1.1: Steps in Analyzing the BAT
(1) Build a database that includes the population of firms doing business in Minnesota.
(2) Identify the current CFT and minimum fee liability for these firms. (3) Simulate the BAT base for each of these firms from data elements included in the
dataset. (4) Calculate the revenue-neutral BAT rate equal to current CFT and minimum fee
liability divided by the aggregate BAT base. (5) Apply the revenue-neutral tax rate to the simulated BAT base and calculate the
change in tax liability for each firm. (6) Tabulate the change in tax liability by type of firm and industry. (7) Re-simulate the BAT base for each firm with the small business exempt amount. (8) Re-calculate the revenue-neutral BAT rate equal to current CFT and minimum fee
liability divided by the aggregate BAT base with the exemption. (9) Apply the new revenue-neutral tax rate to the re-simulated BAT base and
calculate the change in tax liability for each firm. (10) Tabulate the change in tax liability by type of firm.
6

Chapter 2: The Minnesota Business Tax Database
The Minnesota Business Tax Database (hereafter, the database) was constructed under
the assumption that all firms doing business in Minnesota would have nexus for the Minnesota
BAT. Therefore, the database includes records for each firm that had nexus for any major
Minnesota tax4 during tax year 1999, the most recent year of federal tax data available at the
time the study was begun. For each firm, the database record includes variables from the state
tax filing, variables from the federal tax return (where available), and imputed variables that
were necessary for simulating the base of a BAT, but which were available nowhere on the tax
returns. The distribution of these 831,689 firms by type of tax paid and by organizational form is
given in Table 2.1. The categories of companies appearing in Table 2.1 are each described in
turn.
The final section in this chapter explains the procedures for matching the records of
Minnesota taxpayers with federal tax returns.
4 We did not explicitly include firms with MinnesotaCare tax liability, although many of those will likely be captured in the other categories.
7

Table 2.1: The Minnesota Business Tax Database
Number of Firms and Tax Liability for Tax Year 1999
Number of
Entities
Total Liability ($) for CFT andMinimum Fee
Percent of Total Tax Liability
Average Tax ($)
Current MN filers C-corps (M4)5 46,451 $708,177,185 0.98% $15,581 S-corps (M8) 57,468 12,670,783 0.02% 220 Partnerships (M3) 31,363 5,356,039 0.01% 171 Sole props (M1 w/ Sched C) 420,498 0 0.00% 0 Farms (M1 w/ Sched F) 84,431 0 0.00% 0 Rent-earners (M1 w/ Sched E rental income) 169,619 0 0.00% 0 Total current MN filers 808,830 $726,204,007 1.00% $898
Businesses filing no entity return 1999; liable for sales tax or income tax withholding
C-corps 14,505 $0 $0 S-corps 2,347 0 0 Partnerships 2,688 0 0 Finance and insurance6 956 0 0 Coops 142 0 0 LLCs 1,221 0 0 Total non-entity tax businesses 21,859 $0 $0
Total businesses liable for BAT
Total C-corps 60,956 $708,177,185 0.98% $11,812 Total S-corps 59,815 12,670,783 0.02% 212 Total Partnerships 34,051 5,356,039 0.01% 157 Total Sole Props 420,498 0 0.00% 0 Total Farms 84,431 0 0.00% 0 Total rent-earners 169,619 0 0.00% 0 Total other (FI, Coops, LLCs) 2,319 0 0.00% 0 Total businesses 831,689 $726,204,007 1.00% $874
Current Minnesota Filers
These companies were represented by state business entity or individual income tax
returns in 1999. They include C-corporations that were liable for the Minnesota Corporate
Franchise Tax (CFT) and filed a Minnesota Form M-4; S-corporations that were liable for the
S-corp minimum fee and filed a Minnesota Form M-8; and partnerships that were liable for the
5 This is the count or non-unitary filers plus unitary groups. The total number of individual entity filings, including all of the members of each unitary group, is 54,164. 6 Legal organizational form unknown.
8
------------------------------------------
partnership minimum fee and filed a Minnesota Form M-3. The tax returns for all of these firms
were identified as being filed for a tax year beginning in 1999, regardless of the calendar year in
which they were filed. That is, we searched for these records in multiple years of tax collection
files.
These 135,282 firms reported on their 1999 returns a combined tax liability of
$726,204,007. While the S-corps and partnerships are more numerous than the C-corp filers
(66% of this group), their liability from the small minimum fee was only 3 percent of the total
taxes reported by this group.
Also included in the database are records for all Minnesota individual income tax filers
who reported business income on their federal tax returns. Individuals who earn business
income in Minnesota are liable for the Minnesota individual income tax, and must file a
Minnesota Form M-1. Their attached federal Form 1040 will report business income on
Schedules C (sole proprietorship), E (rental real estate, royalties, partnerships, S-corps, estates,
trusts, and REMICs), and F (farms). The database includes a record in the database for each of
the Schedules C and F that were included with Minnesota Form M-1 filings. We also created
records for each of the Schedules E that included rental income. This approach assumes that the
business income reported on the federal schedules of M-1 filers is for firms doing business in
Minnesota. We treated each Schedule C, E, or F as a separate taxpaying entity under the BAT,
adding 674,548 records to the database.
Non-Entity-Level Filers
Companies that do not have nexus for any of the taxes described above will still have
nexus for the BAT if they sell goods or services in Minnesota or if they have employees in the
state. In order to capture these businesses, we include in the database all entities that either paid
state sales taxes in 1999 or withheld Minnesota income taxes for their employees in 1999.
The Department of Revenue’s Profile database includes information on all firms
registered for any Minnesota state or local tax. From this database, we collected identifying
information for each business that either paid state sales tax or income tax withholding in 1999.
9

The Profile database includes all businesses that are registered for the CFT, S-corp tax,
and partnership tax. It also includes the sole proprietorships that either collect sales tax or
withhold income tax. To avoid double-counting businesses, we took four steps to exclude from
the Profile records any of the firms that were already accounted for in the database.
First, we only extracted from the Profile database records for those firms that were not
registered for the CFT, the S-corp tax, or the partnership tax. Second, we assumed that any firm
identified as a sole proprietorship or a farm in the Profile database was already captured through
our inclusion of the Schedule C and F records. Therefore, we excluded those records from the
Profile records. Third, we did not include in the database records whose legal form could not be
identified (because we could not determine if they were already included), and those with legal
forms that would not be liable for the BAT7. Finally, we used a unique identifier to match the
Profile records with the database records, and added to the database only the new firms.
The addition of the Profile firms increased the size of the database by 21,859 records.
Excluded Businesses
Two classes of businesses that could have nexus for the BAT may be missing from the
database: (1) firms protected from the state corporate income tax from PubL 86-272 and
(2) firms that sell into Minnesota through mail order or e-commerce, but are not registered for
the state sales tax.
While we know of no way to learn the identity of businesses in the second group, it is
likely that we have captured the firms in the first group by including businesses that are
registered for taxes other than the CFT, S-corp tax, and partnership tax. In particular, PubL 86-
272 firms that have a sales force in Minnesota will need to withhold Minnesota income taxes for
their employees, and therefore will be in the database.
Matching with Federal Data
The algorithm for calculating the BAT base (explained in Chapter 3) requires many data
elements that do not appear on state tax filings, but which do appear on federal tax returns.
7 Includes the following business types: issued doc pro, farm assistance fund, government, nonprofit organization; nonprofit MN corp; nonprofit non-MN corp, other, spousal proprietorship, and use tax individual.
10

Therefore, to the extent possible, we linked firms’ state tax returns to their federal returns using a
unique index composed of the firms’ Employer Identification Number (EIN) and the tax filing
period. Where possible, M-8 returns were linked with the firms’ federal S-corp return, Form
1120S, and M-3 returns were linked with the firms’ federal partnership return, Form 1065.
Schedule C, E, and F data elements were already included in M-1 database for individual
taxpayers.
Identifying the Federal Parents of M-4 Filers:
Complexities arise when linking state and federal C-corp records, because a corporation
may file a Minnesota Form M-4 as a unitary group, and they may file their federal tax return
(Form 1120) on a consolidated basis. Moreover, the parent of the corporation’s federal
consolidated group may not be the same entity as the primary record on the unitary filing—
indeed, the federal parent may not have nexus in Minnesota, and hence may not appear on the
unitary M-4 at all. In order to make as many state-federal matches as possible, we needed to
(1) identify the EINs of the federal parents of each member of each Minnesota unitary group and
(2) obtain the federal tax returns for those parents. To do that, we took the following steps, the
results of which are summarized in Table 2.2:
(1) We linked Minnesota Form M-4s with the federal corporate tax returns available at the
Minnesota Department of Revenue by matching both the federal EIN and the tax period.
We did this for all non-unitary filers and for every firm listed on a unitary filing—which
should be every member of the unitary group that has CFT nexus in Minnesota—because
firms in the same unitary group might have different federal parents, and because non-
unitary filers may also be members of a federal consolidated group.
(2) For firms that did match with available federal tax returns, we obtained EINs of their
federal parents from the “Parent-Sub File,” which includes data from corporations’
federal Form 851, the corporate affiliations schedule. We accessed this file through the
Statistics of Income Division (SOI) of the Internal Revenue Service.
(3) We obtained the Form 1120 records for those federal parents.
(4) For firms that did not appear on the Parent-sub File, we used the federal parent EIN listed
on the Form M-4.
(5) If no federal parent EIN was listed, we assumed that the taxpayer is a sole entity, and
used the taxpayer’s federal EIN listed on the Form M-4.
11

Table 2.2: M-4 Filers, C-Corps (tax year 1999) Results of Matching with the
Federal Parent-Sub File Number of
Records Minnesota CFT
Liability
Taxpayer is not listed as a sub, and the M4 EIN matches the federal EIN 40,839 $359,131,330 No match with the parent-sub file was found. The federal EIN is assumed to be the federal consolidated parent EIN listed on the M4 196 1,155,117 The federal EIN was obtained from a match with the parent-sub file 81 4,270,179 No match with the parent-sub file was found, and no consolidated federal parent EIN is listed on the M4, so the taxpayer is assumed not to be a sub, and the M4 EIN is the federal EIN 13,048 343,620,559 Total M4 filers, tax year beginning in 1999 54,164 708,177,185 Number of taxpaying units 46,451
Linking with Federal Tax Returns:
As shown in Table 2.3, we had three different sources from SOI for federal C-corp tax
return data, each with a different set of data elements. Records that matched with the SOI
Sample File had the most complete federal data. Records that matched with the Business Master
File (BMF)—which formed the bulk of the C-corp records—had much less complete data, but
nearly all the variables needed to simulate the BAT. Records that matched with the SOI
Population File had very few data elements.
Table 2.3: M-4 Filers, C-Corps (tax year 1999)
Source of Federal Data Number of
Records Minnesota CFT Liability SOI corporation sample file 7,797 $388,339,684 BMF/BRTF file 34,942 145,916,317 SOI corporation population file 3,021 3,377,304 No federal data found, federal data are imputed 8,404 170,543,880 Total M4 filers, tax year beginning in 1999 54,164 708,177,185
Number of taxpaying units 46,451
12

Chapter 3: Replacing Corporate Franchise Tax Revenue for Tax Year 1999
As shown in Table 2.1, 1999 CFT and minimum fee liability for firms included in the
database was about $726.2 million. To estimate the BAT rate that would replace these revenues,
we first calculated the hypothetical BAT base for each firm in the database using a
microsimulation program. The basic formula for calculating the BAT base, beginning from
federal taxable income, is shown in Figure 3.1.
Most of the data items appearing in the simulation formula came from federal tax filings.
However, some of the necessary required data elements were unavailable from either state or
federal tax sources, requiring that these data items be imputed. Because the number of available
data elements varied by the type of firm and the source of the firm’s data, the simulation and
imputation methodologies also varied. Those methodologies are explained in turn. Estimating the BAT Base for M-4 Filers
As explained in Chapter 2, the records with the most complete federal data were those
that matched with the SOI Corporation Sample file. These records included all of the data
elements in Figure 3.1, except income from partnerships and purchases of depreciable assets.
Imputing Data Elements for Incomplete Records:
We used data published by SOI to impute income from partnerships to corporate records.
According to SOI’s Table 5: 1999, Partnerships with Income or Loss Distributed to Partners, by
Selected Industrial Groups8, transfers from partnerships to corporate partners primarily occur in
the financial institutions and real estate (FIRE) industries (NAICS 52 and 53). Therefore, we
only imputed income from partnerships to the C-corps records that were in the FIRE industry.
We assumed that the ratio of income from partnerships to net income for these C-corps was the
same as the ratio of income from other partnerships to net income for partnerships in the FIRE
industry, as reported in SOI’s Table 1: 1999, All Partnerships: Total Assets, Trade or Business
Income and Deductions, Portfolio Income.9 We calculated the ratio, and applied it to net income
for FIRE C-corps in the database to impute income from partnerships.
8 Available here http://www.irs.gov/pub/irs-soi/99pa05ig.xls. 9 Available here http://www.irs.gov/pub/irs-soi/99pa01ig.xls.
13

For the records that did not match with the corporate sample, we needed to impute the
cost of labor and depreciation included in cost of goods sold. We did this by calculating the
ratios of labor and depreciation costs included in cost of goods sold to total cost of goods sold,
by industry, from the records that matched with the corporate sample. We then applied those
industry-specific ratios to cost of goods sold for the remaining corporate records.
The records that matched only with the SOI Population File included the fewest data
elements. We imputed the required data elements by calculating the ratios of those elements to
total receipts or total deductions from the more complete C-corp records in the dataset, by
industry. We then applied those industry-specific ratios to the population file records.
Figure 3.1: BAT Base Calculation for C-Corporations BAT base =
Federal taxable income before NOL and statutory special deductions + Deductible taxes paid + Net depreciation + Depletion + Depreciation included in cost of goods sold + Interest paid + Compensation of officers + Salaries and wages + Contributions to pensions and profit sharing plans + Employee benefit programs + Cost of labor included in cost of goods sold + Charitable contributions – Total dividends received – Interest income received – Royalties received – Income from partnerships – Purchases of depreciable assets.
14

Imputing Purchases of Depreciable Assets:
We took several steps to simulate a deduction for purchases of depreciable assets of
depreciable assets under the BAT. First, we matched the EINs from our database records with
the COMPUSTAT database of public corporations’ financial filings for 1999. To ensure that the
COMPUSTAT records were for the same entities that appeared in our database, we matched
several variables that are common between the tax return and the financial record. For those
1,125 matches, we obtained the value of depreciable capital expenditures.
For 6,913 records that included data elements from the SOI Corporation Sample File, we
were able to estimate purchases of depreciable assets from line items on the federal Form 4562.
Finally, we ran a regression on COMPUSTAT firms with capital expenditure as the dependent
variable, and several data elements that are common to the COMPUSTAT record and corporate
tax return as the explanatory variables. We used those regression parameters to estimate capital
purchases for the remaining 46,126 C-corps.
Imputing Data Elements to Records With No Federal Data:
As show in Table 2.3, 8,404 corporate members of the database did not match with any
federal data. If an entity that was missing federal data was a member of a unitary group, and all
of the other members of the group had the same federal parent, together with the same linked
federal data, we assumed that this entity had that same federal parent and assigned them the same
federal data elements. For the remaining records missing federal data, we imputed those data
elements according to a “most similar neighbor” (MSN) methodology. We classified all
matched records by size of total assets (three groups) and industry. For each unmatched record,
we then searched within its group for the record that minimized the sum of the squared
differences between the two firms’ apportionment factors (Minnesota property, Minnesota sales,
and Minnesota payroll). The federal data elements for this “most similar” record were then
imputed to the unmatched record.
Simulating the BAT Base:
Once the necessary data elements were either obtained from federal tax returns or
imputed, we simulated the BAT base for all C-corp records in the database with a
microsimulation program that followed the algorithm in Figure 3.1.
15

Adjusting the BAT Base for Differences Between Unitary and Consolidated Groups:
For firms to be included in a consolidated federal filing, they must be 80% owned by a
common parent, but for inclusion in a Minnesota unitary filing, they must only be 50% owned by
a common parent. Therefore, the Minnesota unitary group filing a Form M-4 might not be the
same group of companies that is represented on the federal consolidated tax return to which it
was linked. Moreover, the Form M-4 will include apportionment information only for those
members of the unitary group that have nexus in Minnesota. Because we use data elements from
the linked federal return to simulate a firms’ BAT base, and then use the apportionment data on
the From M-4 to apportion that base, we must adjust the estimated BAT base to account for
possibly significant differences in the sizes of the federal and state groups. We do this by
identifying data elements that are common between Form 1120 and Form M-4.
Federal taxable income before NOL and special deductions (FTI) is one such variable.
We assume that the ratio of unitary group BAT base to consolidated group BAT base is the same
as the ratio of unitary group FTI to consolidated group FTI. To estimate the BAT base for the
Minnesota unitary group, we multiply the BAT base calculated from data elements on the federal
Form 1120 by the ratio between FTI reported on the Minnesota Form M-4 and FTI reported on
the federal Form 1120.
Any federal tax data item, including FTI, appearing on the Minnesota Form M-4 should
be the aggregate amount for the entire unitary group. However, the apportionment factors and
the amount of Minnesota tax liability are reported only for those members of the unitary group
that have nexus. We know of no variable that measures the relationship between the unitary
group and the subset of the unitary group that has nexus for the corporate income tax in
Minnesota. Some members of the unitary group that do not have nexus under the CFT would
have nexus under the BAT, but we have no way of knowing which firms they are. Therefore,
our method overstates the BAT base by the amount that the unitary group tax liability exceeds
the liability for the members with nexus for BAT.
Apportioning the BAT Base:
Finally, BAT base for each corporation was apportioned according to the corporation’s
share of total sales in Minnesota, obtained from the Minnesota CFT Form M-4.
16

Estimating the BAT Base for Non-C-Corp Entity Filers (S-Corps, Partnerships, Schedule C, E, F Filers) The datasets obtained from federal tax filings for these firms included very few data
elements. In particular, these records did not include enough data to reliably impute purchases of
depreciable assets. Therefore, we first calculated a gross, unadjusted BAT base for these firms
from the available data elements according to this formula: Unadjusted BAT base = net income
+ labor costs – interest received + interest paid – depreciation. We then adjusted that base to
account for the difference between depreciation to expensing.
We twice ran the BAT simulation for C-corps: first with the reported depreciation
deduction and a second time replacing depreciation deductions with expensing of depreciable
assets. We then computed the ratio of those two bases by industry. We multiplied the industry-
specific ratios by the unadjusted BAT base for the non-C-corps to proxy the BAT base for those
companies with expensing, instead of depreciation.
The Minnesota state tax filings for these firms did not include any information that could
be used to apportion the BAT base to Minnesota. Therefore, we assumed that the entire base
would be taxable in Minnesota.
Estimating BAT Base for Profile Records
Records that were obtained from the Profile database included vary few variables that
could be used to simulate the BAT base: industry, taxable and gross sales, income tax
withholding. Therefore, we modeled the BAT as a factor tax for these records, where BAT base
= gross sales for companies remitting sales tax, and BAT base = gross payroll for companies
remitting only income tax withholding. Because we had no information on depreciation
deductions for these companies, we had no means to adjust the base for expensing, as we did for
the non-C-corp entity-filers. Therefore, the base for these companies is gross of capital
purchases.
17


Chapter 4: Effects of a Minnesota BAT by Business Type
Replacing corporate franchise tax and minimum fee revenues with a broad-based BAT on
all firms doing business in Minnesota would have required a BAT rate of 0.71 percent in 1999.
Note that the 0.71 percent rate is revenue-neutral only for 1999. The revenue-neutral rate in
other years would differ from 0.71 percent because of changes in CFT receipts and changes in
the BAT base in those years.
As explained in Chapter 3, for the businesses that filed no entity-level taxes in 1999, we
had only sales tax and income tax withholding information, which was insufficient to impute the
variables necessary to estimate the BAT base. Therefore, the estimated tax base for these entities
is based on factors: gross sales for those companies with collecting general sales tax in 1999,
and gross wages for those companies withholding income tax (and not remitting sales tax).
Eliminating these 21,859 companies from the calculation would increase the required revenue
neutral rate to 0.81 percent.
Table 4.1 shows that for M-4 filers, BAT liability calculated at the revenue-neutral rate is
less than CFT liability, generating an overall tax cut for M-4 filers of $391,569,608, and an
average change in liability of -$8,430. Of the 46,451 M-4 filers, 19,970 have a tax cut, with an
average change of -$26,374 and an average tax liability of $7,020. 17,100 M-4 filers have a tax
increase, with an average change of $7,902 and an average tax liability of $10,317. 9,381 M-4
filers have no change in tax.
All other entity types—other than C-corps—are estimated to receive a tax increase, with
an average change in liability of about $500.
19

Table 4.1: The Effect of a Revenue-Neutral (0.71%) BAT by Type of Business
1999 CFT and Minimum Fee Simulated BAT Liability Change in Tax Number of
Entities
Business Type Number
of Entities Total
Liability ($) Percent of
Total Average Tax ($)
Total Liability
Percent of Total
Average Tax ($)
Total Change in
Liability ($)
Percent of Total
Change
Average Change
($)
With a Tax Cut
With No Tax Cut
Current MN filers C-corps (M4) 46,451 $708,177,185 0.98% $15,246 $316,607,577 0.50% $6,816 -$391,569,608 4.32% -$8,430 19,970 26,481 S-corps (M8) 57,468 12,670,783 0.02% 220 115,270,216 0.18% 2,006 102,599,433 -1.13% 1,785 4,758 52,710 Partnerships (M3) 31,363 5,356,039 0.01% 171 94,860,284 0.15% 3,025 89,504,245 -0.99% 2,854 7,842 23,521 Sole props (M1 w/ Sched C) 420,498 0 0.00% 0 73,637,929 0.12% 175 73,637,929 -0.81% 175 0 420,498 Farms (M1 w/ Sched F) 84,431 0 0.00% 0 7,475,151 0.01% 89 7,475,151 -0.08% 89 0 84,431
Rent-earners (M1 w/ Sched E rental income) 169,619 0 0.00% 0 27,635,113 0.04% 163 27,635,113 -0.30% 163 0 169,619
Total Current MN Filers 809,830 $726,204,007 1.00% $897 $635,486,270 1.00% $785 -$90,717,737 1.00% -$112 32,570 777,260 Businesses liable for no entity tax in 1999, liable for sales tax or income tax withholding
20 C-corps 14,505 $0 $0 $71,053,338 0.78% $4,899 $71,053,338 0.78% $4,899 0 14,505 S-corps 2,347 0 0 3,084,804 0.03% 1,314 3,084,804 0.03% 1,314 0 2,347 Partnerships 2,688 0 0 1,918,076 0.02% 714 1,918,076 0.02% 714 0 2,688 Finance and insurance 956 0 0 1,695,644 0.02% 1,774 1,695,644 0.02% 1,774 0 956 Coops 142 0 0 1,323,372 0.01% 9,320 1,323,372 0.01% 9,320 0 142 LLCs 1,221 0 0 11,642,474 0.13% 9,535 11,642,474 0.13% 9,535 0 1,221
Total Non-Entity Tax Businesses 21,859 $0 $0 $90,717,709 1.00% $4,150 $90,717,709 1.00% $4,150 0 21,859
Total businesses liable for BAT Total C-corps 60,956 $708,177,185 0.98% $11,618 $387,660,915 0.53% $6,360 -$320,516,270 -$5,258 19,970 40,986 Total S-corps 59,815 12,670,783 0.02% 212 118,355,020 0.16% 1,979 105,684,237 1,767 4,758 55,057 Total Partnerships 34,051 5,356,039 0.01% 157 96,778,360 0.13% 2,842 91,422,321 2,685 7,842 26,209 Total Sole Props 420,498 0 0.00% 0 73,637,929 0.10% 175 73,637,929 175 0 420,498 Total Farms (not listed above) 84,431 0 0.00% 0 7,475,151 0.01% 89 7,475,151 89 0 84,431 Total rent-earners 169,619 0 0.00% 0 27,635,113 0.04% 163 27,635,113 163 0 169,619 Total other (FI, coops, LLCs) 2,319 0 0.00% 0 14,661,491 0.02% 6,322 14,661,491 6,322 0 2,319
Total Businesses 831,689 $726,204,007 1.00% $873 $726,203,979 1.00% $873 -$28 $0 32,570 799,119
-----_ ...............................................•------------

Chapter 5: The Effect of a Business Activities Tax by Industry
Table 5.1 shows the effects on M-4 filers (excluding other firm types) of a BAT that is
revenue neutral over all businesses. In this case, most M-4 industry groups will get an aggregate
tax cut (because taxes would increase for other firm types, as shown in Table 4.1), making it
difficult to see what is going on by industry. Table 5.2, therefore, gives results by industry of a
BAT that is revenue-neutral for M-4 filers only. The required rate would be 1.58 percent.
Applying this increased rate to M-4 filers alone can illustrate the distribution of the effects of the
BAT by industry. Under this simulation, the industries with aggregate tax cuts (in descending
order of the percentage cut) would be management of companies (68%), finance and insurance
(56.8%), utilities (32.4%), manufacturing (16.3%), information (12.3%), and real estate (9.5%).
The industries with aggregate tax increases (in descending order of the percentage increase)
would be health care (348.7%), professional and technical services (152%), mining (110.1%),
retail trade (96.4%), construction (43.6%), accommodation and food services (41.6%),
transportation (37.4%), other services (36.3%), agriculture (33.3%), educational services
(22.4%), administrative and waste services (19.8%), arts and entertainment (5.1%), and
wholesale trade (1.4%).
The results in Tables 5.1 and 5.2 include the effects of both moving to a BAT base and
shifting from the apportionment formula in place in 1999 (70 percent weighting on sales and 15
percent weighting on both payroll and property) to 100 percent sales apportionment. These two
changes could affect industries differently. To separate out the two effects, Table 5.3 reports
results of shifting to a BAT that is revenue-neutral for M-4 filers only, but is apportioned
according to 1999 law. The distribution of tax changes under this simulation is similar to the
distribution shown in Table 5.2, with the percentage change in tax (whether a cut or an increase)
increasing for most industries. Industries with a larger tax change under current law
apportionment than 100 percent sales apportionment are wholesale trade (going from a 1.4% tax
increase to 5.4%), information (going from a 12.3% cut to 23.4%), educational service (going
from a 22.4% increase to 39.8%), and other services (going from a 36.3% increase to 52.4%).
One industry, arts and entertainment, switched from receiving a small tax increase (5.1%) to a
tax cut (3.1%).
21
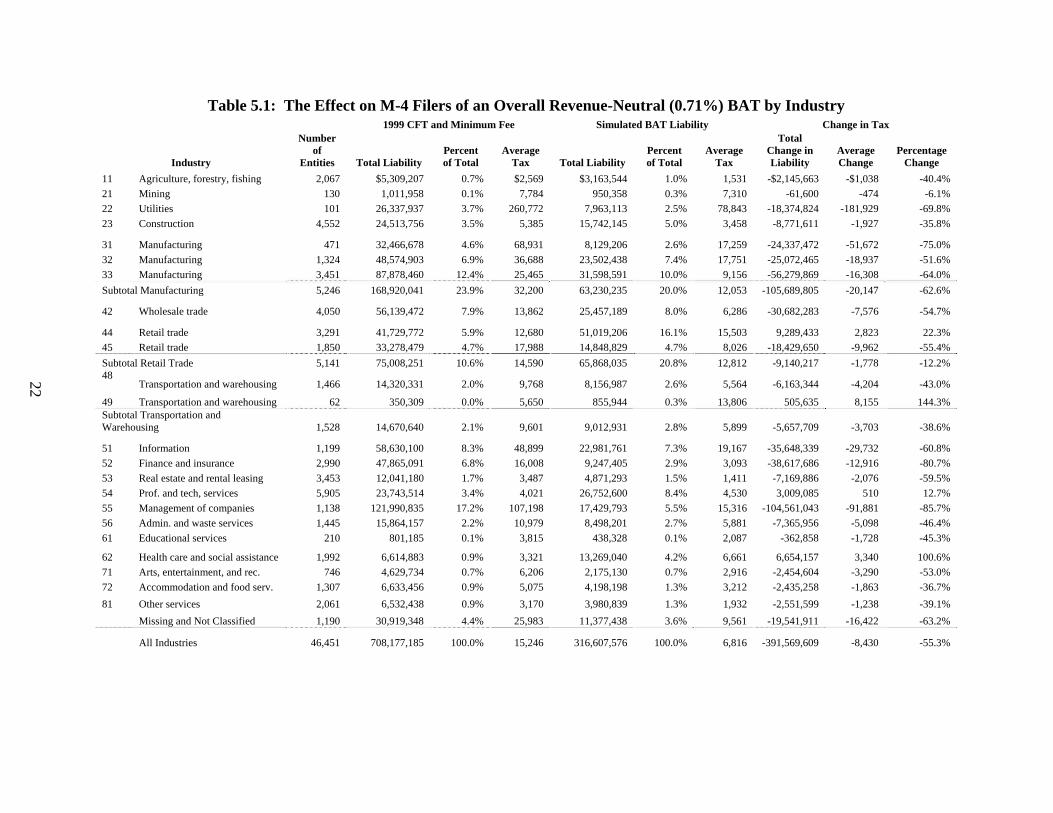
Table 5.1: The Effect on M-4 Filers of an Overall Revenue-Neutral (0.71%) BAT by Industry 1999 CFT and Minimum Fee Simulated BAT Liability Change in Tax
Industry
Number of
Entities Total Liability Percent of Total
Average Tax Total Liability
Percent of Total
Average Tax
Total Change in Liability
Average Change
Percentage Change
11 Agriculture, forestry, fishing 2,067 $5,309,207 0.7% $2,569 $3,163,544 1.0% 1,531 -$2,145,663 -$1,038 -40.4% 21 Mining 130 1,011,958 0.1% 7,784 950,358 0.3% 7,310 -61,600 -474 -6.1% 22 Utilities 101 26,337,937 3.7% 260,772 7,963,113 2.5% 78,843 -18,374,824 -181,929 -69.8% 23 Construction 4,552 24,513,756 3.5% 5,385 15,742,145 5.0% 3,458 -8,771,611 -1,927 -35.8%
31 Manufacturing 471 32,466,678 4.6% 68,931 8,129,206 2.6% 17,259 -24,337,472 -51,672 -75.0% 32 Manufacturing 1,324 48,574,903 6.9% 36,688 23,502,438 7.4% 17,751 -25,072,465 -18,937 -51.6% 33 Manufacturing 3,451 87,878,460 12.4% 25,465 31,598,591 10.0% 9,156 -56,279,869 -16,308 -64.0% Subtotal Manufacturing 5,246 168,920,041 23.9% 32,200 63,230,235 20.0% 12,053 -105,689,805 -20,147 -62.6%
42 Wholesale trade 4,050 56,139,472 7.9% 13,862 25,457,189 8.0% 6,286 -30,682,283 -7,576 -54.7%
44 Retail trade 3,291 41,729,772 5.9% 12,680 51,019,206 16.1% 15,503 9,289,433 2,823 22.3% 45 Retail trade 1,850 33,278,479 4.7% 17,988 14,848,829 4.7% 8,026 -18,429,650 -9,962 -55.4% Subtotal Retail Trade 5,141 75,008,251 10.6% 14,590 65,868,035 20.8% 12,812 -9,140,217 -1,778 -12.2% 48
Transportation and warehousing 1,466 14,320,331 2.0% 9,768 8,156,987 2.6% 5,564 -6,163,344 -4,204 -43.0%
49 Transportation and warehousing 62 350,309 0.0% 5,650 855,944 0.3% 13,806 505,635
22
8,155 144.3% Subtotal Transportation and Warehousing 1,528 14,670,640 2.1% 9,601 9,012,931 2.8% 5,899 -5,657,709 -3,703 -38.6%
51 Information 1,199 58,630,100 8.3% 48,899 22,981,761 7.3% 19,167 -35,648,339 -29,732 -60.8% 52 Finance and insurance 2,990 47,865,091 6.8% 16,008 9,247,405 2.9% 3,093 -38,617,686 -12,916 -80.7% 53 Real estate and rental leasing 3,453 12,041,180 1.7% 3,487 4,871,293 1.5% 1,411 -7,169,886 -2,076 -59.5% 54 Prof. and tech, services 5,905 23,743,514 3.4% 4,021 26,752,600 8.4% 4,530 3,009,085 510 12.7% 55 Management of companies 1,138 121,990,835 17.2% 107,198 17,429,793 5.5% 15,316 -104,561,043 -91,881 -85.7% 56 Admin. and waste services 1,445 15,864,157 2.2% 10,979 8,498,201 2.7% 5,881 -7,365,956 -5,098 -46.4% 61 Educational services 210 801,185 0.1% 3,815 438,328 0.1% 2,087 -362,858 -1,728 -45.3%
62 Health care and social assistance 1,992 6,614,883 0.9% 3,321 13,269,040 4.2% 6,661 6,654,157 3,340 100.6% 71 Arts, entertainment, and rec. 746 4,629,734 0.7% 6,206 2,175,130 0.7% 2,916 -2,454,604 -3,290 -53.0% 72 Accommodation and food serv. 1,307 6,633,456 0.9% 5,075 4,198,198 1.3% 3,212 -2,435,258 -1,863 -36.7% 81 Other services 2,061 6,532,438 0.9% 3,170 3,980,839 1.3% 1,932 -2,551,599 -1,238 -39.1% Missing and Not Classified 1,190 30,919,348 4.4% 25,983 11,377,438 3.6% 9,561 -19,541,911 -16,422 -63.2% All Industries 46,451 708,177,185 100.0% 15,246 316,607,576 100.0% 6,816 -391,569,609 -8,430 -55.3%
......................................•------------
............................................._-----------
.....................................•------------
......................................•---------

Table 5.2: The Effect on M-4 Filers of a BAT That is Revenue Neutral for M-4 Filers Only (1.58% Rate)
1999 CFT and Minimum Fee Simulated BAT Liability Change in Tax
Industry
Number of
Entities Total Liability Percent of Total
Average Tax Total Liability
Percent of Total
Average Tax
Total Change in Liability
Average Change
Percentage Change
11 Agriculture, forestry, fishing 2,067 $5,309,207 0.7% $2,569 $7,076,110 1.0% $3,423 $1,766,903 $855 33.3% 21 Mining 130 1,011,958 0.1% 7,784 2,125,729 0.3% 16,352 1,113,771 8,567 110.1% 22 Utilities 101 26,337,937 3.7% 260,772 17,811,624 2.5% 176,353 -8,526,313 -84,419 -32.4% 23 Construction 4,552 24,513,756 3.5% 5,385 35,211,500 5.0% 7,735 10,697,745 2,350 43.6%
31 Manufacturing 471 32,466,678 4.6% 68,931 18,183,135 2.6% 38,605 -14,283,542 -30,326 -44.0% 32 Manufacturing 1,324 48,574,903 6.9% 36,688 52,569,464 7.4% 39,705 3,994,561 3,017 8.2% 33 Manufacturing 3,451 87,878,460 12.4% 25,465 70,678,668 10.0% 20,481 -17,199,792 -4,984 -19.6% Subtotal Manufacturing 5,246 168,920,041 23.9% 32,200 141,431,267 20.0% 26,960 -27,488,774 -5,240 -16.3%
42 Wholesale trade 4,050 56,139,472 7.9% 13,862 56,941,786 8.0% 14,060 802,314 198 1.4%
44 Retail trade 3,291 41,729,772 5.9% 12,680 114,118,046 16.1% 34,676 72,388,273 21,996 173.5% 45 Retail trade 1,850 33,278,479 4.7% 17,988 33,213,362 4.7% 17,953 -65,117 -35 -0.2% Subtotal Retail Trade 5,141 75,008,251 10.6% 14,590 147,331,408 20.8% 28,658 72,323,157 14,068 96.4% 48
Transportation and warehousing 1,466 14,320,331 2.0% 9,768 18,245,274 2.6% 12,446 3,924,943 2,677 27.4%
49 Transportation and warehousing 62 350,309 0.0% 5,650 1,914,547 0.3% 30,880 1,564,238 25,230 446.5% Subtotal Transportation and Warehousing 1,528 14,670,640 2.1% 9,601 20,159,822 2.8% 13,194 5,489,182 3,592 37.4%
51 Information 1,199 58,630,100 8.3% 48,899 51,404,832 7.3% 42,873 -7,225,268 -6,026 -12.3% 52 Finance and insurance 2,990 47,865,091 6.8% 16,008 20,684,285 2.9% 6,918 -27,180,806 -9,091 -56.8% 53 Real estate and rental leasing 3,453 12,041,180 1.7% 3,487 10,895,945 1.5% 3,156 -1,145,235 -332 -9.5% 54 Prof. and tech, services 5,905 23,743,514 3.4% 4,021 59,839,317 8.4% 10,134 36,095,802 6,113 152.0% 55 Management of companies 1,138 121,990,835 17.2% 107,198 38,986,375 5.5% 34,259 -83,004,460 -72,939 -68.0% 56 Admin. and waste services 1,445 15,864,157 2.2% 10,979 19,008,491 2.7% 13,155 3,144,335 2,176 19.8% 61 Educational services 210 801,185 0.1% 3,815 980,437 0.1% 4,669 179,251 854 22.4%
62 Health care and social assistance 1,992 6,614,883 0.9% 3,321 29,679,743 4.2% 14,899 23,064,860 11,579 348.7% 71 Arts, entertainment, and rec. 746 4,629,734 0.7% 6,206 4,865,258 0.7% 6,522 235,524 316 5.1% 72 Accommodation and food serv. 1,307 6,633,456 0.9% 5,075 9,390,388 1.3% 7,185 2,756,932 2,109 41.6% 81 Other services 2,061 6,532,438 0.9% 3,170 8,904,207 1.3% 4,320 2,371,769 1,151 36.3% Missing and Not Classified 1,190 30,919,348 4.4% 25,983 25,448,671 3.6% 21,385 -5,470,677 -4597 -17.7% All Industries 46,451 $708,177,185 100.0% $15,246 $708,177,195 100.0% $15,246 $11 0 0.0%
23
------------_ -----
--------------- -------
.............................................._-----------_.

Table 5.3: The Effect on M-4 Filers of a BAT That is Revenue Neutral for M-4 Filers only, Current Law Apportionment (1.45% Rate)
1999 CFT and Minimum Fee Simulated BAT Liability Change in Tax
Industry
Number of
Entities Total Liability Percent of Total
Average Tax Total Liability
Percent of Total
Average Tax
Total Change in Liability
Average Change
Percentage Change
11 Agriculture, forestry, fishing 2,067 $5,309,207 0.7% $2,569 6,650,385 0.9% 3,217 1,341,177 649 25.3% 21 Mining 130 1,011,958 0.1% 7,784 1,968,645 0.3% 15,143 956,687 7,359 94.5% 22 Utilities 101 26,337,937 3.7% 260,772 17,534,544 2.5% 173,609 -8,803,393 -87,162 -33.4% 23 Construction 4,552 24,513,756 3.5% 5,385 32,577,325 4.6% 7,157 8,063,570 1,771 32.9%
31 Manufacturing 471 32,466,678 4.6% 68,931 19,996,926 2.8% 42,456 -12,469,751 -26,475 -38.4% 32 Manufacturing 1,324 48,574,903 6.9% 36,688 51,254,518 7.2% 38,712 2,679,615 2,024 5.5% 33 Manufacturing 3,451 87,878,460 12.4% 25,465 91,328,136 12.9% 26,464 3,449,676 1,000 3.9% Subtotal Manufacturing 5,246 168,920,041 0.24 32,200 162,579,580 23.0% 30,991 -6,340,460 -1,209 -3.8%
42 Wholesale trade 4,050 56,139,472 7.9% 13,862 59,158,877 8.4% 14,607 3,019,405 746 5.4%
44 Retail trade 3,291 41,729,772 5.9% 12,680 102,989,824 14.5% 31,294 61,260,052 18,614 146.8% 45 Retail trade 1,850 33,278,479 4.7% 17,988 31,486,607 4.4% 17,020 -1,791,871 -969 -5.4% Subtotal Retail Trade 5,141 75,008,251 0.11 14,590 134,476,432 19.0% 26,158 59,468,180 11,567 79.3% 48
Transportation and warehousing 1,466 14,320,331 2.0% 9,768 17,438,455 2.5% 11,895 3,118,124 2,127 21.8%
49 Transportation and warehousing 62 350,309 0.0% 5,650 1,746,033 0.2% 28,162 1,395,724 22,512 398.4% Subtotal Transportation and Warehousing 1,528 14,670,640 0.02 9,601 19,184,488 2.7% 12,555 4,513,848 2,954 30.8%
51 Information 1,199 58,630,100 8.3% 48,899 44,883,339 6.3% 37,434 -13,746,761 -11,465 -23.4% 52 Finance and insurance 2,990 47,865,091 6.8% 16,008 22,788,898 3.2% 7,622 -25,076,193 -8,387 -52.4% 53 Real estate and rental leasing 3,453 12,041,180 1.7% 3,487 10,927,535 1.5% 3,165 -1,113,645 -323 -9.2% 54 Prof. and tech, services 5,905 23,743,514 3.4% 4,021 57,179,035 8.1% 9,683 33,435,520 5,662 140.8% 55 Management of companies 1,138 121,990,835 17.2% 107,198 44,039,288 6.2% 38,699 -77,951,548 -68,499 -63.9% 56 Admin. and waste services 1,445 15,864,157 2.2% 10,979 19,106,743 2.7% 13,223 3,242,586 2,244 20.4% 61 Educational services 210 801,185 0.1% 3,815 1,120,363 0.2% 5,335 319,178 1,520 39.8%
62 Health care and social assistance 1,992 6,614,883 0.9% 3,321 28,637,863 4.0% 14,376 22,022,980 11,056 332.9% 71 Arts, entertainment, and rec. 746 4,629,734 0.7% 6,206 4,487,669 0.6% 6,016 -142,065 -190 -3.1% 72 Accommodation and food serv. 1,307 6,633,456 0.9% 5,075 8,705,951 1.2% 6,661 2,072,495 1,586 31.2% 81 Other services 2,061 6,532,438 0.9% 3,170 9,952,384 1.4% 4,829 3,419,946 1,659 52.4% Missing and Not Classified 1,190 30,919,348 4.4% 25,983 22,217,837 3.6% 21,385 -5,470,677 -4597 -17.7% All Industries 46,451 $708,177,185 100.0% $15,246 708,177,181 100.5% 15,246 -4 0 0.0%
24
------------_ -----
--------------- -------
.............................................._-----------_.

Chapter 6: Effects of a BAT Small Business Exemption
Tables 6.1 and 6.2 illustrate the effects of a $100,000 exempt amount for all businesses:
each firm, including each member of a unitary group, would be allowed to exempt the first
$100,000 of its BAT base. This exemption is estimated to raise the required revenue-neutral
BAT rate to 0.86 percent.
Under the exemption, 588,393 out of 831,639 total businesses (66,462 of which had
liability for CFT or minimum fee in 1999) are exempt from the BAT. Ninety-two percent of the
exempt firms (539,997) are Schedule C, E, and F filers (farm and nonfarm proprietors and rent-
earners). At this level of exemption, 134,551 proprietors (Schedule C, E, or F filers) would pay
BAT.
25

Table 6.1: The Effect on the BAT Base of a $100,000 Exemption by Business Type All Entities With a Small Business Exemption = $100,000 Simulated BAT Base Simulated BAT Base
Number of
Entities Total BAT
Base ($) Percent of Total
Average Base ($)
Number of Entities Above
Threshold Total BAT
Business Type Base ($) Percent of Total
Average Base ($)
Number of
Exempt Entities
Current MN filers C-corps (M4) 46,451 $44,808,860,231 0.50% $964,648 32,691 $42,355,887,121 0.59% $3,078,189 13,760 S-corps (M8) 57,468 16,313,971,520 0.18% 283,879 38,485 13,062,816,928 0.18% 526,662 18,983 Partnerships (M3) 31,363 13,425,393,142 0.15% 428,065 24,626 12,969,589,691 0.18% 526,662 6,737 Sole props (M1 w/ Sched C) 420,498 10,421,834,228 0.12% 24,785 81,404 3,399,274,147 0.05% 10,025 339,094 Farms (M1 w/ Sched F) 84,431 1,057,943,757 0.01% 12,530 43,956 184,662,803 0.00% 4,201 40,475 Rent-earners (M1 w/ Sched E rental income) 169,619 3,911,144,243 0.04% 23,058 9,191 135,266,132 0.00% 14,717 160,428 Total current MN filers 809,830 $89,939,147,121 1.00% $111,059 230,353 $72,107,496,822 1.00% $153,711 579,477
Businesses liable for no entity tax in 1999, liable for sales tax or income tax withholding
C-corps 14,505 $10,056,041,987 0.78% $693,281 8,864 $9,602,874,833 0.79% $1,083,357 5,641 S-corps 2,347 436,586,384 0.03% 186,019 1,363
26
383,000,379 0.03% 280,998 984 Partnerships 2,688 271,461,614 0.02% 100,990 1,323 227,798,854 0.02% 172,184 1,365 Finance and insurance 956 239,981,294 0.02% 251,026 531 210,519,400 0.02% 396,458 425 Coops 142 187,294,353 0.01% 1,318,974 88 182,993,001 0.01% 2,079,466 54 LLCs 1,221 1,647,736,889 0.13% 1,349,498 774 1,616,318,668 0.13% 2,088,267 447 Total non-entity tax businesses 21,859 $12,839,102,519 1.00% $587,360 12,943 $12,223,505,133 1.00% $944,411 8,916
Total businesses liable for BAT Total C-corps 60,956 $54,864,902,218 0.53% $900,074 41,555 $51,958,761,954 0.62% $2,296,621 19,401 Total S-corps 59,815 16,750,557,904 0.16% 280,039 39,848 13,445,817,307 0.16% 337,428 19,967 Total Partnerships 34,051 13,696,854,756 0.13% 402,245 25,949 13,197,388,545 0.16% 508,589 8,102 Total Sole Props 420,498 10,421,834,228 0.10% 24,785 81,404 3,399,274,147 0.04% 10,025 339,094 Total Farms 84,431 1,057,943,757 0.01% 12,530 43,956 184,662,803 0.00% 4,201 40,475 Total rent-earners 169,619 3,911,144,243 0.04% 23,058 9,191 135,266,132 0.00% 14,717 160,428 Total other (FI, Coops, LLCs) 2,319 2,075,012,535 0.02% 894,788 1,393 2,009,831,068 0.02% 1,442,808 926
Total businesses 831,689 $102,778,249,640 1.00% $123,578 243,296 $84,331,001,955 1.00% $174,941 588,393
~ ~------~~------~~-----~ ---~---~~---~---~---------

Table 6.2: The Effect on BAT Liability of a $100,000 Exemption by Type of Business
1999 CFT and Minimum Fee Simulated BAT Liability Change in Tax Number of Entities
Business Type
Number of
Entities
Number with
CFT/Fee Total Liability Percent of Total
Average Tax
Total Liability
Percent of
Total Average
Tax Total Change
in Liability
Percent of Total Change
Average Change
With a Tax Cut
With No
Tax Cut
Current MN filers C-corps (M4) 46,451 31,781 $708,177,185 0.98% $22,283 $359,548,537 0.58% $7,740 -$348,628,648 3.36% -$7,505 23,426 23,025 S-corps (M8) 57,468 24,634 12,670,783 0.02% 514 110,886,987 0.18% 1,930 98,216,204 -0.95% 1,709 9,063 48,405 Partnerships (M3) 31,363 10,047 5,356,039 0.01% 533 110,095,604 0.18% 3,510 104,739,565 -1.01% 3,340 8,746 22,617 Sole props (M1 w/ Sched C) 420,498 0 0 0.00% 0 28,855,588 0.05% 69 28,855,588 -0.28% 69 0 420,498 Farms (M1 w/ Sched F) 84,431 0 0 0.00% 0 1,567,556 0.00% 19 1,567,556 -0.02% 19 0 84,431
Rent-earners (M1 w/Schedule E rental income) 169,619 0 0 0.00% 0 11,487,538 0.02% 68 11,487,538 -0.11% 68 0 169,619
Total current MN filers 809,830 66,462 $726,204,007 1.00% $10,927 $622,441,811 1.00% $769 -$103,762,195 1.00% -$128 41,235 768,595
Businesses liable for no entity tax in 1999, liable for sales tax or income tax withholding
C-corps 14,505 0 $0 $0 $81,516,404 0.79% $5,620 $81,516,404 0.79% $5,620 0 14,505 S-corps 2,347 0 0 0 3,251,194 0.03% 1,385 3,251,194
27
0.03% 1,385 0 2,347 Partnerships 2,688 0 0 0 1,933,728 0.02% 719 1,933,728 0.02% 719 0 2,688 Finance and insurance 956 0 0 0 1,787,047 0.02% 1,869 1,787,047 0.02% 1,869 0 956 Coops 142 0 0 0 1,553,382 0.01% 10,939 1,553,382 0.01% 10,939 0 142 LLCs 1,221 0 0 0 13,720,525 0.13% 11,237 13,720,525 0.13% 11,237 0 1,221
Total non-entity tax businesses 21,859 $0 $0 $0 $103,762,279 1.00% $4,747 103,762,279 1.00% $4,747 0 21,859
Total businesses liable for BAT Total C-corps 60,956 31,781 $708,177,185 0.98% $11,618 $441,064,941 0.61% $7,236 -$267,112,244 -$4,382 23,426 37,530 Total S-corps 59,815 24,634 12,670,783 0.02% 212 114,138,182 0.16% 1,908 101,467,399 1,696 9,063 50,752 Total Partnerships 34,051 10,047 5,356,039 0.01% 157 112,029,332 0.15% 3,290 106,673,293 3,133 8,746 25,305 Total Sole Props 420,498 0 0 0.00% 0 28,855,588 0.04% 69 28,855,588 69 0 420,498 Total Farms (not listed above) 84,431 0 0 0.00% 0 1,567,556 0.00% 19 1,567,556 19 0 84,431 Total rent-earners 169,619 0 0 0.00% 0 11,487,538 0.02% 68 11,487,538 68 0 169,619 Total other (FI, Coops, LLCs) 2,319 0 0 0.00% 0 17,060,953 0.02% 7,357 17,060,953 7,357 0 2,319
Total businesses 831,689 66,462 $726,204,007 1.00% $873 $726,204,090 1.00% $873 $84 $0 41,235 790,454
------------------.._--------_ ..........................................................•---_._---_.
------------------.._--------_ ..........................................................•---_._---_.
........................................................................................................................._----------------_._--------_ ................................................................•---_._---_.


Chapter 7: Forecasting BAT Receipts The Business Activities Tax Database (hereafter, the database) includes business entities
that filed tax returns for tax year 1999, regardless of the year those returns were received. We
used 1999 returns, because that was the most recent year of federal tax data available at the time
the study began. Therefore, the previous chapters report BAT liabilities for tax year 1999, not
for any particular calendar or fiscal year. This chapter forecasts BAT liabilities to future tax
years, and converts those liabilities to tax receipts for calendar years 2004 to 2009 and fiscal
years 2005 to 2009.
One way to forecast tax receipts is with an econometric model that recognizes that future
year tax receipts are a function of receipts in past years and certain economic variables, such as
personal income and corporate profits. Having no history with the BAT, we cannot know the
relationship between BAT receipts and macroeconomic variables, or the relationship between
one year’s BAT receipts and the receipts in previous years.
An alternative method takes advantage of the fact that the database is built from tax
return data for individual firms. For each future tax year, the variables in each database record
that are used to calculate the BAT base are grown by the growth rates in relevant macroeconomic
variables. The result is a set of simulated tax databases for each of the forecast years. The BAT
simulation program is run on those new records, generating BAT liability estimates for those tax
years.
One advantage of this second method is that it retains the unique relationships among the
elements of the BAT base for each firm. For example, if a firm has a high ratio of labor to
capital costs, that relationship is retained as the elements of the BAT base are “grown.” A
second advantage is that this method results in a micro-level database for future years that can be
used to simulate alternative versions of the BAT, for example, with different exempt amounts or
with changes to the base.
One disadvantage to this method is that one of the data elements that must be forecast is
federal taxable income (FTI), a value that for many firms is negative. It is not clear whether loss
firms should be forecast to continue as loss firms over time, or if their FTI should be forecast to
29

turn positive. Another challenge is whether or not to change the number of firms in the database
over time, so that the future year databases reflect not only changes in economic variables over
time, but also changes in business demographics.
We chose to use this second method to forecast BAT receipts for C-corporations, the
firms for which the database contains the richest data. We also chose to grow the data elements
for positive and negative FTI firms the same way, so that firms that have losses in the base year,
1999, remain loss firms throughout the forecast period, and vice versa. We did not attempt to
forecast changes in the population of businesses, but if the forecast values of the macroeconomic
variables reflect increases or decreases in the number of firms, the aggregate simulation results
arising from the forecast databases should reflect them as well.
As explained in Chapter 2, the database includes only very limited data elements for non-
C-corp businesses. Therefore, we chose not to forecast the individual records for these firms.
Instead, the total BAT liability generated by these companies is simply increased by the growth
rate in the largest component of the BAT base: labor compensation. This method does not lead
to future year micro-level databases for these firms.
For all of the forecasts, we apply to the estimated BAT base the BAT rate that we
estimated to be revenue-neutral in 1999, 0.71 percent, and the base allows no small business
exemption. Note that the 0.71 percent rate is revenue-neutral only for 1999. The revenue-
neutral rate in other years would differ from 0.71 percent because of changes in CFT receipts and
changes in the BAT base in those years.
Forecasting BAT Liabilities for Tax Years 2002-2007:
For C-corporations in the database, each variable in the BAT base simulation algorithm
(Figure 7.1) was grown according to forecasts in the February 2005 Economic Forecast
(Minnesota Department of Finance, February 2005) and the U.S. Economic Outlook February
2005 (Global Insight 2005). The growth factors by business type, classified as they are in
Chapter 2, are shown in Tables 7.1-7.3.
30

Figure 7.1: Calculating the BAT Base for C-Corps
BAT base = Federal taxable income before NOL and statutory special deductions + Deductible taxes paid + Net depreciation + Depletion + Depreciation included in cost of goods sold + Interest paid + Compensation of officers + Salaries and wages + Contributions to pensions and profit sharing plans + Employee benefit programs + Cost of labor included in cost of goods sold + Charitable contributions – Total dividends received – Interest income received – Royalties received – Income from partnerships – Purchases of depreciable assets.
Table 7.1: Growth Factors for C-Corp Data Elements Variable Forecast Method/Growth Factor
Net Income Federal Corporate Tax Receipts Taxes Paid State Corporate Tax Receipts Net Depreciation Book Value of Depreciation Depletion Constant Depreciation from Schedule A Book Value of Depreciation Interest Paid Long Term Interest Rate Growth Compensation of Officers MN Wage & Salary Disbursement Salaries & Wages MN Wage & Salary Disbursement Pension, Profit Sharing Plans Other Labor Income Employee Benefit Programs Other Labor Income Cost of Labor included in COGS MN Wage and Salary Disbursement Charitable Contributions Corporate Profits Dividends Received Dividends Forecast Interest Received Long Term Interest Rate Growth Royalties Received Corporate Profits Income from Partnerships Non Farm Proprietors’ Income Purchases of Business Property Business Fixed Investment
Table 7.2: Growth Factors for the BAT Base of Business Filers Other than C-Corps Filers Growth Factor
S-Corps(M8) MN Wage & Salary Disbursement Growth Partnerships(M3) MN Wage & Salary Disbursement Growth Sole Proprietorships (M1 w/Sched C) MN Proprietors’ Income Farms (M1 w/Sched F) National Farm Proprietors’ Income Rent-earners (M1 w/Sched E) MN Proprietors’ Income
31

Table 7.3: Growth Factors for the BAT Base of Businesses Filing No Entity Filers Growth Factor
All business types MN Wage & Salary Disbursement Growth
Converting Liability Forecasts into Receipts Forecasts
The month and year a corporate tax return was received by the Minnesota Department of
Revenue appears in the firms’ database record. Examining the year variables reveals that
approximately 82 percent of the tax year 1999 records were received in calendar year 2000, and
18 percent were received during calendar year 2001. Similarly, the month variables reveal that
86 percent of tax year 1999 corporate returns were received in during the state’s fiscal year 2000
(ending June 30, 2000), 10 percent in fiscal year 2001, and 4 percent in fiscal year 2002. We
assume that this basic relationship between tax years and filing date remains constant over time,
and that the same relationship applies to non-C-corp businesses. Therefore, we convert the tax
year liability estimates into calendar year receipts estimates according to the following formulas:
(1) CYRt = 0.82(TYLt-1)+0.18(TYLt-2) and
(2) FYRt= 0.86(TYLt-1)+0.10(TYLt-2)+.04(TYLt-3), where TYLt = tax year t tax liabilities, CYRt = calendar year t tax receipts, and FYRt = fiscal year t tax receipts.
Results
We report our results in Table 7.4. We forecast that BAT liabilities would grow from
$708.2 million in tax year 1999 to $832 million in tax year 2002 and to $1,094.1 million in tax
year 2008. Converting these liabilities to tax receipts, we forecast the 0.71%, broad-based BAT
with no exemptions to yield $1,084.5 million in both calendar year and fiscal year 2009.
Table 7.4: BAT Liabilities and Receipts ($ thousands) 2002 2003 2004 2005 2006 2007 2008 2009 Tax year liabilities $832,048.8 $860,854.3 $905,622.8 $940,744.1 $987,130.7 $1,040,970.6 $1,094,080.6 Fiscal year receipts 898,203.0 934,036.4 979,231.7 1,031,577.5 $1,084,491.6 Calendar year receipts 855,669.3 897,564.5 934,422.2 978,781.1 1,031,279.4 1,084,520.8
32