A brief portrait of the Spanish Organic Farming market ... · PDF fileA brief portrait of the...
12
A brief portrait of the Spanish Organic Farming market. Elements for a strategy 12 Séminaire International d’information et de réflexion su l’agriculture biologique Paris, 28 February 2017 Francisco Javier Maté Caballero Subdirector General de Calidad Diferenciada y Agricultura Ecológica (SGCDAE) Dirección General de la Industria Alimentaria (DGIA) Secretaría General de Agricultura y Alimentación (SGAA) Ministerio de Agricultura y Pesca, Alimentación y Medio Ambiente (MAPAMA)
Transcript of A brief portrait of the Spanish Organic Farming market ... · PDF fileA brief portrait of the...

A brief portrait of the Spanish Organic Farming market. Elements for a strategy
12 Séminaire International d’information et de réflexion su l’agriculture biologique Paris, 28 February 2017
Francisco Javier Maté Caballero Subdirector General de Calidad Diferenciada y Agricultura Ecológica (SGCDAE)
Dirección General de la Industria Alimentaria (DGIA) Secretaría General de Agricultura y Alimentación (SGAA)
Ministerio de Agricultura y Pesca, Alimentación y Medio Ambiente (MAPAMA)

SPANISH ORGANIC FARMING EVOLUTION. SURFACE AND OPERATORS.
In ten years the surface and operators have doubled. Now it has near 8% of total Useful Agricultural Land of Spain, and we are the 1st of UE and 5th of world. But 77% are in the South (Andalucia, Castilla-La Mancha, Extremadura and Murcia)
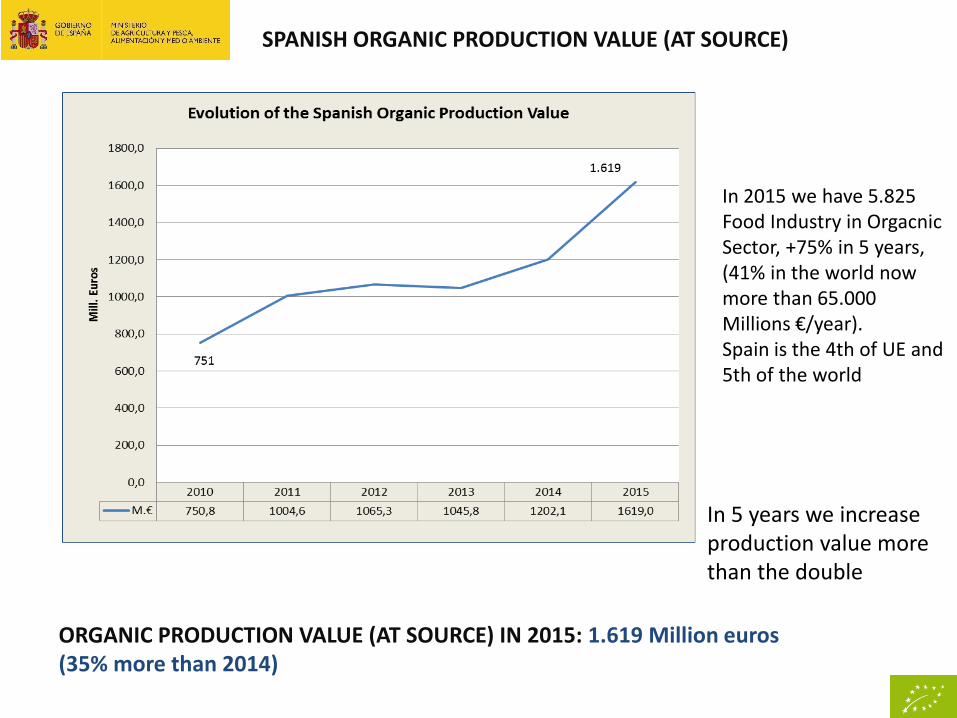
SPANISH ORGANIC PRODUCTION VALUE (AT SOURCE)
ORGANIC PRODUCTION VALUE (AT SOURCE) IN 2015: 1.619 Million euros (35% more than 2014)
In 2015 we have 5.825 Food Industry in Orgacnic Sector, +75% in 5 years, (41% in the world now more than 65.000 Millions €/year). Spain is the 4th of UE and 5th of the world
In 5 years we increase production value more than the double

SPECIFIC WEIGHT OF THE ORGANIC PLANT ORIGIN PRODUCTION VERSUS ORGANIC ANIMAL ORIGIN PRODUCTION
EVOLUTION OF THE SPECIFIC WEIGHT OF THE ORGANIC PRODUCTION OF PLAN AND ANIMAL ORIGIN
% of the organic production value at source
2015 2014 2013 2015/2013 (%)
Plant Origin 83,9% 82,4% 86,7% -3,2%
Animal Origin 16,1% 17,6% 13,3% +21%
TOTAL VALUE 100,0% 100,0% 100,0%
GREAT ASYMMETRY IN FAVOR OF PLANT ORIGIN PRODUCTION.
7.553 animal origin units

ECONOMIC VALUE OF THE MAIN ORGANIC PRODUCTIONS (2015)
ECONOMIC VALUE OF THE MAIN ORGANIC PRODUCTIONS (2015)
Products lines (% vs total sector production) Production value at source
2015 (Mill €)
% Total value production at
source
1. Olive Oil (10,8%) 442,9 27,4%
2. Fresh vegetables and potatoes (2,4%) 226,7 14,0%
3. Meat and meat products (0,6%) 206,8 12,8%
4. Wine (8,6%) 198,6 12,3%
5. Fruits, except nuts (2,4%) 169,1 10,4%
6. Nuts (14,4%) 105,0 6,5%
7. Cereals 53,9 3,3%
8. Pulses (3,3%) 21,7 1,3%
9. Raw mil (all species) 17,7 1,1%
10. Aquiculture 16,3 1,0%
11. Fodder 15,6 1,0%
12. Eggs (0,5%) 13,3 0,8%
13. Industrial crops 5,4 0,3%
14. Honey (2,7%) 3,7 0,2%
15. Other products of plant and animal origin 122,3 7,6%
TOTAL PRODUCTION AT SOURCE VALUE 2015 1.619,0 100,0%

EVOLUTION OF ORGANIC FOOD CONSUMPTION IN THE INTERNAL MARKET
ORGANIC FOOD SPANISH CONSUMPTION(2015): 1.498 Mill. Euro ( 24,5% increase and 18,2% 2014 vs 2013)
Spain is the 10th country of organic consumption and 6th of UE
Conventional foods consumption increase +1% in 2015

ORGANIC FOOD per capita CONSUMPTION IN SPAIN
% ORGANIC PROD./NON ORGANIC PROD. (2015): 1,51%
Evolution of per capita consumption of organic food (shopping basket of households and on-premises channel included)
Year per capita consumtion of organic food
(€/inhabitant/year) per capita consumtion of non organic food
(€/inhabitant/year)
2011 20,61 2.178,4
2012 21,34 2.152,6
2013 21,85 2.173,2
2014 25,89 2.110,5
2015 32,27 2.133,5
56,6% -2,1%
Germany 97€ France 73€ Italy 38€ UK 36€ Sweden 145€

COMPOSITION OF THE ORGANIC SHOPPING BASKET
Organic food Non organic food
1. Vegetables , potatoes and their processed products 16,0% 11,4%
2. Fresh frui t and their processed products 15,0% 9,5%
3. Cereals (including rice) and cereal products (bread, pasta, etc) 12,6% 10,7%
4. Meat and meat products 10,0% 21,8%
5. Wines , biers and other beverages 9,0% 3,1%
6. Oi ls and fats 8,8% 2,2%
7. Nuts and nuts products 4,0% 1,4%
8. Mi lk and mi lk products 4,0% 12,4%
9. Pulses and preserved pulses 2,0% 0,3%
10. Eggs and eggs products 1,3% 1,2%
11. Aquaculture and preserved fi shPesca y acuicultura y sus conservas 1,2% 13,4%
12. Honey and honey products 1,0% 0,5%
13. Other products of plant origin 13,5% 7,4%
14. Other products of animal origin 1,6% 4,6%
100,0% 99,9%
Composition of the shopping basket in organic and non organic food.
TOTAL
Products lines Specific weight in value of the composition of the shopping basket
Fresh 65% and Procesed foods 35%

SALES OF ORGANIC FOODS. SEGMENTATION BY CHANNELS
TOTAL DISTRIBUTION
SPECIALIST CHANNEL 63% 73%
Organic supermarket
Organic traditional shop
Organic food consumption groups 14% 16%
Organic food direct marketing/ on-line 7% 9%
Organic on-premises channel 2% 3%
NON ORGANIC CHANNEL 27% 37%
Non organic hypermarket 14% 18%
Discount 4% 7%
Non organic supermarket 7% 8%
Non organic traditional shop 2% 4%
Sales of organic products. Segmentation by channels
Market shares (%)
Ranges
100%
40% 45%
THE ORGANIC FOOD DISTRIBUTION MODEL IN SPAIN IS SLIGHTLY DIFFERENT FROM OTHERS: SIGNIFICATIVE PRESENCE IN SPECIALIST CHANNEL
Increasing in Hyper and Discount non organic. Not in supermarket (Mercadona)
Only in 20% of shops the citicens can buy organic food products

EVOLUTION OF ORGANIC FOOD FOREIGN TRADE
Year Exports (Million
euro) Imports (Millio euro)
Trade balance
(Million euro)
Percentage cover
import/export
2011 514,5 219,0 295,5 234,9%
2012 590,0 201,0 389,0 293,5%
2013 671,5 298,0 373,5 225,3%
2014 724,0 365,0 359,0 198,4%
2015 778,0 431,0 347,0 180,5%
Evolution of the Spanish organic food foreign trade
Export increasing 51% en 5 years (Total Spain agrifood export increasing 29%)
Total Spain agrifood exports in 2015 was 44.065 M€. (organic agrifood was 1,8%)
Spain is the 4th world export country of organic foods and 3rd of UE after Italy and Netherland. The main goods are Olive oil (1st), Wine (1st), Fruits, Vegetables and Pulses.

STRUCTURE OF ORGANIC FOOD FOREIGN TRADE
Products lines
1. Wine, bier,cider and other a lcohol ic drinks 22%
2. fruits and frui ts products (nuts included) 22%
3. Fresh vegetables , potatoes , pulses and derivates . 22%
4. Ol ive oi l 20%
5. Other products of plant origin (cereals included) 9%
6. Meat and meat products 3%
7. Other products animal origin 2%
100% 100%
Organic food export structure
TOTAL
% sobre el total de
exportaciones
95%
5%
Cereals products and soya products (drinks, pasta, flour,sauces,rice, soups,
condiments, seeds, spices, etc) 25 - 30%
Seasonal fruits and vegetables, tropical/exotic fruit (and derivates and jams) 5 - 10%
Baby foods, dietary products, nutraceutics and energy drinks 15 - 20%
Dairy products and dairy drinks 5 - 8%
Prepared dishes, special preserves, snacks, etc 5 - 8%
Coffee and tea, infusions, cocoa-derived products, confectionery and
sweeteners 10 - 15%
Other organic products of plant and animal origin 1 - 5%
Animal feed, and bulk and raw materials for use in organic holdings and
industries 20 - 25%
TOTAL 100%
Organic food import structure
Products lines % /Total Imports
(aprox.)
Destinations : 90%UE, 10% TTCC
Cereals and feed

Thank you Merci beaucoup
mapama.gob.es
Strategic lines 2014-2017: 1. Support for the consolidation of ecological production 2. Promotion of domestic consumption and marketing 3. Boosting the sectorial structure and professionalization