A Brief on (C-DAP) for Purnea District Prepared By Bihar Institute of Economic Studies 103A/1,...
43
A Brief on (C-DAP) for Purnea District Prepared By Bihar Institute of Economic Studies 103A/1, Nageshwar Colony, Boring Road, Patna-800001
-
Upload
posy-simmons -
Category
Documents
-
view
221 -
download
2
Transcript of A Brief on (C-DAP) for Purnea District Prepared By Bihar Institute of Economic Studies 103A/1,...
A Brief on
(C-DAP)for Purnea District
Prepared ByBihar Institute of Economic Studies
103A/1, Nageshwar Colony, Boring Road, Patna-800001

2
Map of Purnea

3
PurneaGeneral Statistics
No. of Subdivision 4
No. of Blocks 14
No. G. Panchayats 251
Revenue Village: 1281
Inhabited 1077
Uninhabited 174
Total Population (Rural) 2321544
Population/G.P. 9249.18
Average Rev. Village/G.P 5.10
Sex-Ratio 915 Females/1000Males
Percentage of SC Population 12.27%
ST Population 4.40%

4
District Income/Intra-district growth
District GDDP
(in Rs. Cr.)
Per Capita GDDP (in Rs.)
Purnea 1549.90 5600.00
Patna (Highest) 15923.90 31441.00
Seohar (Lowest) 204.70 3636.00
5
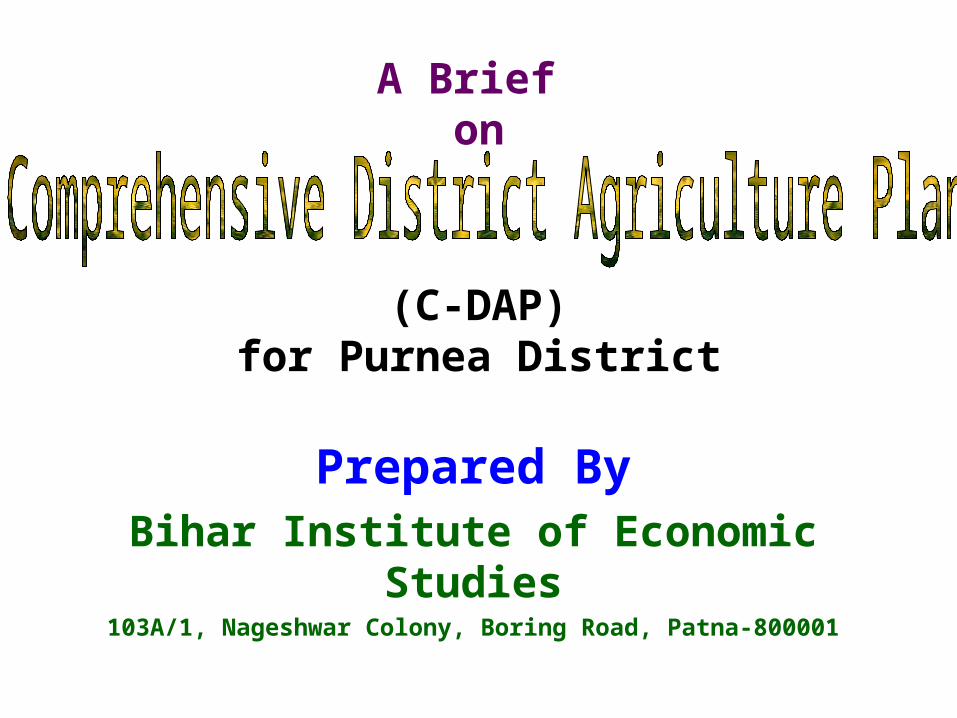
Credit/Deposit Ratio (C.D. Ratio)
Particulars Bihar (All Banks)
Purnea
Commercial Bank
Regional Rural Bank
Total Deposit (Rs in cr) 56342 1820 189
Total Credit (Rs in cr) 19372 952 107
Credit/Deposit Ratios 34.38 52.3 56.6
Source - Economic survey year 2007-08.

6
Land Use
Land Use (in %age)0.04
14.323.98
0.14
2.79
1.53
9.99
67.21
Forest area
Land put to non-agricultureuseCulturable waste land
ParmanentPastures/Grazing LandLand under Misc Tree &GrovesOther Fallow
Current fallow
Net Area Sown

7
Class I Land – 21.66
Class II Land – 40.76
Class III Land – 21.74
Class IV Land – 15.87
In percent

8
Land Holding
87.59
7.484.15 0.78
Marginal Farmers
Small Farmers
Semi MediumFarmers
Medium Big Farmers
In percent

9
Area, Production and Productivity Trend of Main Crops in the District (Area-000’ha, Production-000’qn, productivity-qn/ha)
Name of Crop
2005-06 to 2007-08 2008-09 (Projected) 2009-10(Projected) 2010-11(Projected) 2011-12 (Projected)
A P Y A P Y A P Y A P Y A P Y
Paddy 123.8 118.2 9.6 125.0 181.2 14.5 135.0 270 20.00 138.0 345.0 25.0 140.0
406 29.0
Jite 29.3 63.0 21.5 30.0 66.0 22.0 32.0 72.0 22.5 35.0 87.0 25.0 38.0 98.8 26.0
Maize (Rabi)
42.9 150.7 35.0 44.0 158.4 36.0 46.0 184.0 40.0 46.5 188.3 40.5 50.0 210.0 42.0
Wheat 46.3 62.2 13.4 46.5 72.0 15.5 50.0 100.0 20.0 552.0 127.0 24.5 55.0 165.0 30.0
Masoor 5.0 0.4 0.8 5.5 0.55 1.0 6.0 0.9 1.5 6.5 1.3 2.0 6.5 1.95 3.0
Rai/Sarsoon
17.1 12.14 7.1 18.0 13.5 7.5 18.5 15.7 8.5 19.0 17.1 9.0 20.0 19.0 9.5

10
52 48 Irriagated area
Unirrigated area
In percent

11
Irrigation By Source
14.37
5.89
0.8
35.760.34
42.83
Canal
Ponds
Tube Wells
Wells
Rivers
Others sources
In percent

12
PH Value 6.6-7.3
Organic carbon 0
Available Nitrogen 260-310 kg/ha
Available Phosphorus 10to 25 kg/ha
Available Potash 150 to 325 kg/ha
Saline/Alkaline affected soil area
0

13
Requirement of Fertilizer (In tones)
Fertilizer 2008-09 2009-10 2010-11 2011-12
Urea 52194 56613 59374 64898
DAP 9665 11046 11874 13808
MOP 3590 3896 4170 4501
SSP 1795 1933 2098 2264
NPK 6213 6904 7456 8008
Source: District Agriculture Officer, Purnea

14
Overhead/Transportation cost for fertilizer
YearOverheads/transportation etc. (Rs in
Lakh)
2008-09 41.42
2009-10 27.62
2010-11 27.62
2011-12 27.62
Total 124.28

15
Vermi/NADEP Compost(Physical & Financial Requirement)
Items/year Physical(No.) Financial requirement (Rs. Lakh)
2008-09331 99.42
2009-10497 149.13
2010-11663 198.84
2011-12663 198.84
Total 2154 646.23

16
Integrated Nutrient Management (Physical & Financial Requirement)
Items/year Physical (Area in. Ha.)
Financial requirement (Rs. Lakh)
2008-09 276213.81
2009-10 5523 27.62
2010-11 8285 41.42
2011-12 11046 55.23
Total 27616 138.08

17
Distribution of Micro nutrients
Year Physical (Area in. Ha.) Financial requirement @ Rs. 500/ha (Rs.
Lakh)
2008-09 5524 27.62
2009-10 8285 41.42
2010-11 11046 55.23
2011-12 13808 69.04
Total 38663 193.31

18
Total fund requirement for Soil health Management is as follows:
Name of programme
Financial requirement (Rs. in Lakh)
2008-09 2009-10 2010-11 2011-12Total
Overhead cost for imported fertilizers
41.42 27.62 27.62 27.62 124.28
Vermi/NADEP Compost
99.42 149.13 198.84 198.84 646.23
Integrated Nutrient Management
13.81 27.62 41.42 55.23 138.08
Distribution of Micro-nutrient
27.62 41.42 55.23 69.04 193.31
Application of Gypsum/pyrites
27.62 41.42 48.33 55.23 172.6
Grand Total 209.89 287.21 371.44 405.96 1274.5

19
Total financial assistance for Drip Irrigation & Sprinkler irrigation
Financial year Area Total Financial Assistance
(Rs. In Lakh)Drip Irrigation Sprinkler
irrigation (Ha.)
Area (Ha.)
(Ha.)
2008-09 488.96 122.12 1365.3 611.08
2009-10 977.94 203.53 2508.6 1181.47
2010-11 1711.37 223.88 3668.55 1935.25
2011-12 1711.37 264.57 3890.55 1975.94
Total 488.64 814.1 11433 5703.74

20
Crop Protection Centre
Type of Centre Exists Proposed
Plant Protection Centre
6 8
Soil Testing Laboratories
1 13

21
Fund requirement for proposed crop protection Centre
Name of Programme
Financial Requirements. (Rs. in Lakh)
2008-09 2009-10 2010-11 2011-12 Total
Operationalisation of P.P. Centre
4.00 4.00 4.00 4.00 16.00
Soil testing laboratory
47.73 47.73 47.73 62.73 205.92
Grand Total 51.73 51.73 51.73 66.73 221.92

22
Financial requirements for farm mechanization
Items/year Subsidy on implements. (Rs. In Lakh)
2008-09215.40
2009-10243.02
2010-11248.54
2011-12276.16
Total 983.12

Storage Capacity
Source: District Agriculture Officer, Purnea
StorageExisting
(No.)Capacity Felt requirements
Cold Storage2 2250 5
Rural godown5 400 11
Onion storage- - 2
23

24
Annual Seeds Requirement
Crop Quantity of seeds to be distributed per
farmer (Kg)
Annual seed requirement (qn)
Wheat 20 502.44
Rice 6 150.73
Maize 4 50.24
Arhar 2 50.24
Gram 8 149.24
Moong 3 32.05
Rai/Sarson/Tori 1 12.56
25
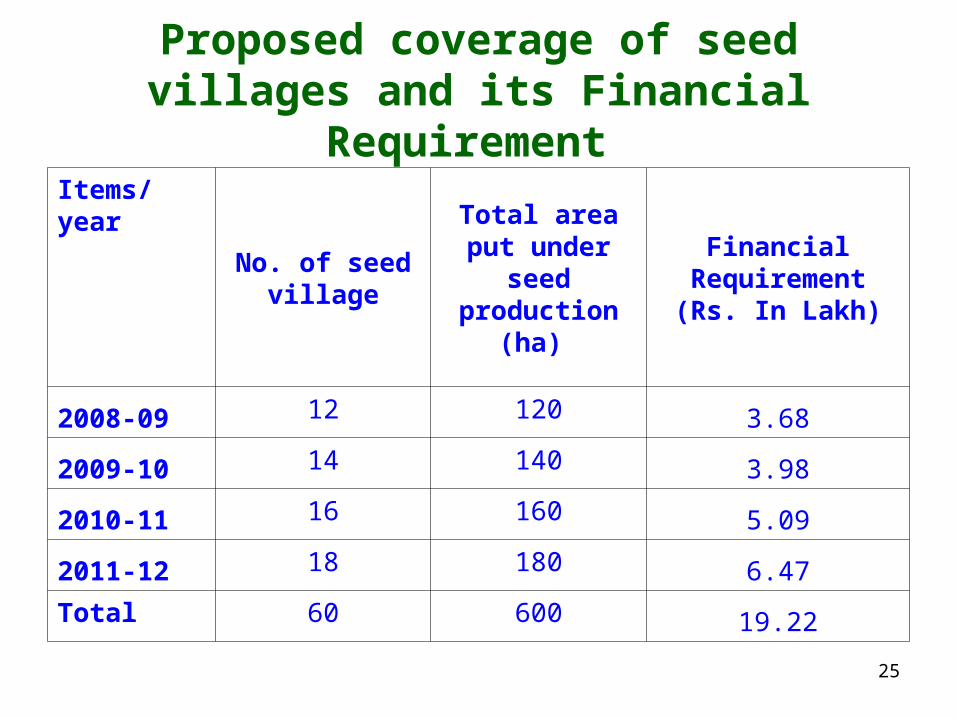
Proposed coverage of seed villages and its Financial Requirement
Items/year
No. of seed village
Total area put under seed
production (ha)
Financial Requirement (Rs.
In Lakh)
2008-09 12 120 3.68
2009-10 14 140 3.98
2010-11 16 160 5.09
2011-12 18 180 6.47
Total 60 600 19.22

26
Total Financial requirement of the Seed Plan
Name of programme
2008-09 2009-10 2010-11 2011-12 Total
Crash Programme 21.51 21.78 22.014 22.32 87.65
Production of foundation seed on S.M.F.
19.05 19.05 19.05 19.05 76.2
Seed Village Programme
3.68 3.98 5.09 6.47 19.22
Distribution of quality seed
102.17 110.46 118.74 127.03 458.4
Infrastructure Development
14.72 15.94 17.17 18.40 66.23
Total 161.13 171.21 182.09 193.09 707.7

27
Physical Programme for transfer of technology
Components Year Total
2008-09 2009-10 2010-11 2011-12
Farmers Field School 125 135 135 135 530
Farmers training on Crop production.
110 165 221 234 730
Farmers training on Farm mechanization.
55 55 55 55 220
Demonstration of seed Production technology.
165 221 276 176 938
Demonstration on Crop Production
468 702 936 1170 3276
Demonstration of SRI 83 83 83 83 332
Demonstration on Hybrid Rice
276 276 276 276 1104
Exposure Visit 28 33 39 44 144
Officers training 6 6 8 8 28
Training of Facilitators 22 27 33 33 115
Kishan Samman Yojana 15 15 15 15 60
Total 3553 1718 2077 2229 7477

28
Financial requirements for transfer of technology
Components Year Total
2008-09 2009-10 2010-11 2011-12
Farmers Field School 72.52 52.21 39.16 31.33 195.22
Farmers training on Crop production.
5.5 8.25 11.05 11.7 36.5
Farmers training on Farm mechanization.
2.75 2.75 2.75 2.75 11.00
Demonstration of seed Production technology.
6.87 6.90 6.90 6.90 27.57
Demonstration on Crop Production
9.36 14.04 18.72 23.04 65.52
Demonstration on SRI 1.66 1.66 1.66 1.66 6.64
Demonstration on Hybrid Rice 6.9 6.9 6.9 6.9 27.6
Exposure Visit 14.00 16.5 19.5 22.00 72.00
Officers training 0.06 0.06 0.08 0.08 0.28
Training of Facilitators 0.22 0.27 0.33 0.33 1.15
Kishan Samman Yojana 16.00 16.00 16.00 16.00 64.00
Total 135.84 125.54 123.05 122.69 507.48
Rs. In Lakh

29
Sector wise Financial Requirement Estimated
Sector 2008-09 2009-10 2010-11 2011-12 Total
Soil Health Management 209.89 287.21 371.44 405.96 1274.5
Water Conservation 31.754 31.754 30.865 25.865 120.238
Water Resource Management (Drip & Sprinkler Irrigation)
611.08 1181.47 1935.25 1975.94 5703.74
Various activities under crop protection
51.73 51.73 51.73 66.73 221.92
Farm Mechanization 215.40 243.02 248.54 276.16 283.12
Enhancement of crop productivity & intensity
20.03 19.91 21.23 20.45 81.62
Financial requirement for the seeds plan
161.13 171.21 182.09 193.27 707.7
Transfer of technology 135.84 125.54 123.54 123.05 507.48
Total 1436.584 2111.844 2964.685 3087.425 8900.318
Rs. In Lakh

30
Breeds
Cow Crossbreed 48561
Indigenous 356102
Buffalow Improved 14682
Indigenous 168835
Goats Improved 2603
Indigenous 431254
Poultry Broiler 1114890
Layer 538316
Sheeps Improved
Indigenous 146111
Note:- 144 GP does not have any veterinary Institution out of 181.

31
Available infrastructural facilities
Facilities Available Required
No. of Veterinary Hospitals 1 3
No. of Veterinary ispensary 23 4
Mobile Veterinary Centre 1 0
Diagnostic 4 0
Artificial Insemination Centre 20 0
Cold room for Storage of Vaccines 0 0
Training Centre for Cattle Farmers 0 0

32
Dispensary / hospital to be equipped with estimated cost
Year No. of dispensary/hospital To be equipped
Cost (In Lakh)
2008-09 0 0
2009-10 0 0
2010-11 0 0
Total 0 0

33
Expenditure of different programmes
under Animal husbandry Component 2008-09 2009-10 2010-11 2011-12 Total
Door step Vetn. services
96.344 104.144 111.944 57.004 369.436
Door to door Vaccination
272.6 289.64 306.68 323.72 1192.64
Disposal of Carcass 124.00 124.00 126.00 128.00 502.00
Poultry farm 190.00 285.00 190.00 267.00 932.00
Strengthening of A.H. office
117.00 53.00 16.00 64.00 250.00
Total 799.944 855.784 750.624 839.724 3246.076

34
Fisheries
• Total Fish Production – Tonnes
• Hatchery – 10Ha cr fingerlings
@ lakh fingerlings/ha• Consumption requirement –
Tonnes (approx)
@11kg/capita/annum

35
Industries Scenario
Types of Industry Unit of Cottage industry
Persons Engaged
Annual Produce (Rs. In Lakh)
General Machinery - - -
Timber - - -
Food Processing Units - - -
Cement - - -
Electric & Electronics - - -
Leather - - -
Ready made garments - - -
Chemical Industry - - -
Others - - -
Total - - -

36
Product wise no. of SSI Units in the District
Category of Industry Nos.Investment (Rs. In lakh)
Employment
Agriculture Based 7 554.00 176
Core/Iron/Engg 3 180.00 95.00
Total 10 734.00 271.00

37
Action Plans for K.V.I Programmes during XI Plan
(Rs. In lakh)
Programme Unit cost
Target
2008-09 2009-010 2010-011 2011-012 Total
Phy Fin Phy. Fin Phy. Fin Phy. Fin Phy. Fin
Bamboo based Industries
1.5 14 21.00 14 21.00 14 21.00 14 21.00 56 84.00
Furniture 0.5 14 7.00 14 7.00 14 7.00 14 7.00 56 28.00
Soap/Detergent 5.00 4 20.00 4 20.00 3 15.00 3 15.00 14 70.00
Steel based 1.00 6 6.00 6 6.00 8 8.00 8 8.00 28 28.00
Gate/Grill 1.00 8 8.00 8 8.00 6 6.00 6 6.00 28 28.00
Agriculture Implements
2.00 3 6.00 3 6.00 4 8.00 4 8.00 14 28.00
Gee/Paneer 1.00 4 4.00 4 4.00 3 3.00 3 3.00 14 14.00
Total 12 53 72.00 53 72.00 52 68.00 52 68.00 210 280.00

38
Action Plans for K.V.I Programmes during XI Plan
Item 2008-09 2009-10 2010-11 2011-12 Total (Rs in Lakh)
Phy Fin Phy Fin Phy Fin Phy Fin Phy Fin
Handloom Textiles
20 60.00 25 75.00 25 75.00 25 75.00 95 285.00

39
Financial requirement for the development of Food Processing Units
Scheme 2008-09 2009-10 2010-11 2011-12 Total
Phy Fin Phy Fin Phy Fin Phy Fin Phy Fin
Rice Mill 3 30.00 3 30.00 4 40.00 4 40.00 14 140.00
Flour Mill 4 8.00 4 8.00 4 8.00 2 4.00 14 28.00
Oil Mill 1 5.00 1 5.00 1 5.00 1 5.00 4 20.00
Milk processing unit
4 8.00 4 8.00 1 8.00 2 4.00 14 28.00
Pickles & Murabba
20 10.00 20 10.00 20 10.00 20 10.00 80 40.00
vegetable processing unit
8 8.00 6 6.00 8 8.00 8 8.00 28 28.00
Total 101.00 99.00 111.00 85.00 396.00
(phy. in No . & fin. Rs. In Lakh)

40
Physical & Financial requirement for the Agricultural Marketing
Year
Marketing Infrastructure
Rural Hats OFPPC
Phy Fin Phy Fin
2008-09 7 245.00 42 50.4
2009-10 7 245.00 42 50.4
2010-11 7 245.00 42 50.4
2011-12 7 245.00 42 50.4
Total 28 980.00 168 201.6
Grand Total 56 1960.00 336 1081.6
41
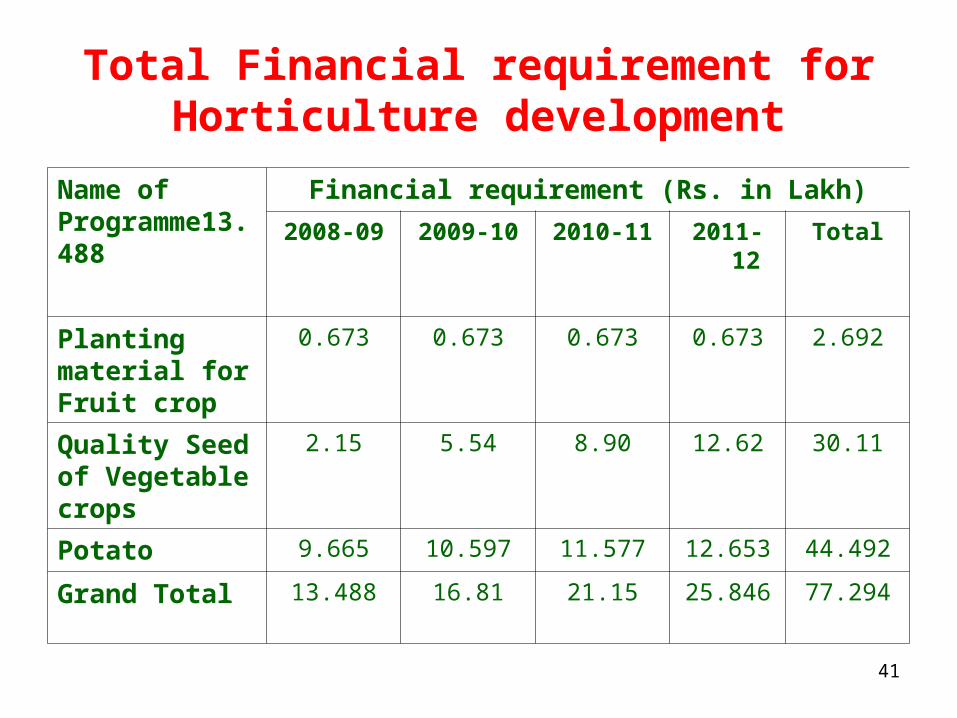
Total Financial requirement for Horticulture development
Name of Programme13.488
Financial requirement (Rs. in Lakh)
2008-09 2009-10 2010-11 2011-12 Total
Planting material for Fruit crop
0.673 0.673 0.673 0.673 2.692
Quality Seed of Vegetable crops
2.15 5.54 8.90 12.62 30.11
Potato 9.665 10.597 11.577 12.653 44.492
Grand Total 13.488 16.81 21.15 25.846 77.294

42
Financial Requirement for Allied Agricultural Sector (Rs. In Lakh)
Sector 2008-09 2009-10 2010-11 2011-12 Total
Horticulture 13.488 16.81 21.15 25.846 77.294
Sericulture Development 14.775 117.975 60.00 31.90 225.25
Animal Husbandry 799.944 855.784 750.624 31.90 3246.076
Fisheries 1078.704 972.044 1009.025 1022.825 4082.598
Social Forestry 79.83 88.15 98.01 109.15 317.14
Food Processing Unit 101.00 99.00 111.00 85.00 396.00
Development of Rural Industries 145.4 160.4 157.6 157.6 621.00
Agriculture Marketing 295.4 295.4 295.4 295.4 295.4
Total 2528.541 2605.563 2502.809 1759.621 9260.758

43

![[XLS] · Web viewSI Group - India Limited 20121100158 NAGESHWAR REDDY Steel City Securities Limited 20121100159 AZAM ISMAIL 20121100160 Warner Multimedia Ltd. 20121100161 Trident](https://static.fdocuments.us/doc/165x107/5ae0e66d7f8b9ac0428e06f1/xls-viewsi-group-india-limited-20121100158-nageshwar-reddy-steel-city-securities.jpg)