A BRIEF GUIDE TO PRESENTING BIOLOGICAL DATA AND INFORMATION
32
1 A BRIEF GUIDE TO PRESENTING BIOLOGICAL DATA AND INFORMATION A.N. Hodgson & M.H. Villet Department of Zoology & Entomology, Rhodes University
Transcript of A BRIEF GUIDE TO PRESENTING BIOLOGICAL DATA AND INFORMATION

1
A BRIEF GUIDE TO PRESENTING
BIOLOGICAL DATA AND INFORMATION
A.N. Hodgson & M.H. Villet
Department of Zoology & Entomology, Rhodes University

2
CONTENTS
PLAGIARISM ........................................................................................................................... 3
GUIDELINES FOR WRITING LABORATORY AND PROJECT REPORTS ....................... 4
HYPOTHETICAL EXAMPLE OF AN UNDERGRADUATE STUDENT LABORATORY
REPORT .................................................................................................................................. 10
DATA REPRESENTATION, GRAPHICAL TECHNIQUES AND TABLES ...................... 14
A GUIDE TO ESSAY WRITING ........................................................................................... 22
RESEARCH POSTERS .......................................................................................................... 27
PRESENTING RESEARCH TALKS ..................................................................................... 29
1
First Published 1999: Revised Editions 2001, 2003, 2006, 2007, 2008, 2010, 2011, 2013,2014, 2017
Copyright: A.N. Hodgson & M.H. Villet
All rights reserved. No part of this publication may be reproduced, stored in a retrieval system, or transmitted,
in any form or by any means, without the prior permission in writing of the authors.

3
PLAGIARISM
Taking someone else’s work, and presenting it as your own (plagiarism), is a serious offence, and
punishable by rustication from Rhodes University.
Plagiarism is defined as:
Taking and using the ideas, writings, works or inventions of another as
if they were one's own.
Ensure that you are familiar with the university’s policy on plagiarism; this can be accessed at:
1) www.ru.ac.za/zoologyandentomology/studying/undergraduate/learningtools/
2) www.scifac.ru.ac.za/plag.htm
ALL STUDENTS REGISTERED FOR COURSES IN ZOOLOGY & ENTOMOLOGY MUST
SIGN A FORM AT THE BEGINNING OF EACH SEMESTER WHICH DECLARES THAT
THEY UNDERSTAND WHAT PLAGIARISM IS. THIS FORM CAN BE OBTAINED FROM
THE DEPARTMENTAL WEB SITE AT:
http://www.ru.ac.za/zoologyandentomology/studying/undergraduate/learningtools/

4
GUIDELINES FOR WRITING LABORATORY AND PROJECT REPORTS
An important skill that all scientists must acquire is the written presentation of their findings,
either in the form of a report or scientific paper. Two of the aims of laboratory classes and field
trips are
1) training in the collection of data and
2) developing skills (through writing and feedback) in the presentation of data.
The results from laboratory classes, field work and undergraduate projects must be written in a
standard format. This is normally in the form of a scientific paper. The standard format of
scientific papers was developed by scientists over years and there are many good reasons for the
format that has been agreed upon. Perhaps the most important reason is that it ensures that
information is presented logically and in a uniform way.
The majority of scientific papers are structured in the following way. They begin with a title to
the work, the name(s) and affiliation(s) of the author(s), and an abstract. Following this are an
introduction, methods section, a results section, a discussion and a reference list. (Note: there are
a few journals where the order is Title, Abstract, Introduction, Results, Discussion, Methods,
References). Tables and graphs of data are usually placed after the reference section i.e. there is
no need to embed these in the main body of the text.
Most undergraduate laboratory experiments reports need not be long or detailed (about 5
double-spaced typed A4 pages should be regarded as the maximum) but they should contain all
of the above elements. The abstract, which is a summary of the contents, is important to scientific
documents as this is recorded by abstracting services. The abstract, along with the title, allows
scientists to determine whether the contents of your paper, or thesis, may be relevant to their
work without having to read the entire manuscript.
Before beginning a report it is advisable to look through some published papers in biological
journals to give you a better idea of the correct approach and what information each section
contains. In short, the introduction and methods respectively tell why the work was done and how
you got your results, the results section explains what the main findings were, and the discussion
explains what they mean.
General information
As computers are readily accessible to students, it is expected that student reports are printed
using a good quality printer. Basic use of a computer is an essential skill that all university
students should acquire as soon as possible. Reports should be printed on one side of the paper
only and the text should be double spaced (unlike this document which has single spaced text)
using at least a 12 point font size. This document for example has used 12 point Times New
Roman font. The reason for the double spaced format is that it allows markers or reviewers to
read the information more easily and provides space between the lines of text in which to insert
comments on what you have written. It is also important that the report is written in good,
concise English, with no typographical or spelling errors. Such errors indicate a lack of care in
the final production of the report and possibly with the rest of the work. Most word processing
packages have spell checkers, but beware; these do not detect words that are used incorrectly
even though they may have been spelt correctly, and also tend to correct English spelling to
American. You must proofread your report carefully. Always prepare a rough draft of your report

5
before typing information into the computer. Never be satisfied with your first effort. A good
report is usually one that has been edited and rewritten several times.
The Title
The title should be short, but informative and enable a reader to grasp immediately the subject of
the report. For example, a project report entitled “Estuaries practical” is vague and
uninformative. The only thing that a reader would understand from such a title is that the report
has something to do with estuaries. A title such as “Distribution and abundance of zooplankton
in the Kariega estuary” would at least inform the reader of what was studied (zooplankton), what
aspect of its biology was investigated (distribution and abundance) and where the study was
carried out (Kariega estuary). If the title contains the scientific name of a species, this name
should be followed by further information on the group of animals to which it belongs, for
example, Sesarma catenata (Crustacea, Brachyura). Whereas some researchers may not know
what type of animal Sesarma catenata is, all zoologists should know what crustaceans and
brachyurans are.
Reminder: Generic and specific names should be written in italics.
The Abstract
This is a very brief summary of what the study was, what the main results were and what
conclusions are drawn. Abstracts should be no longer than 200-250 words. They can be shorter.
Note: For short undergraduate laboratory reports an abstract may not be required (check
with lecturer in charge).
The Introduction
The purpose of the introduction is to supply the readers with sufficient background to allow them
to understand and evaluate the results of your work without needing to refer to previous
publications on the topic. It should:
Explain what problem was investigated, referring to previous published studies to place
the work in context. It will, therefore, be necessary to present some relevant general
information at the beginning of the introduction about the cells, tissue(s), animal(s),
community, or ecosystem being studied.
Once some relevant general background information is given you can then -
present the nature and scope of the problem investigated.
Mention how you approached the problem.
Present the rationale for the study - why is the work being undertaken?
Give the aims of the study or better still present a hypothesis to be tested or questions that
are being asked.
The last three points (rationale, aims/hypothesis) are usually presented at the very end of the
introduction, not the beginning. Finally, an introduction does not need separate subheadings
and you should not use subheadings such as Aims, Objectives or Hypothesis.

6
Materials and methods
The materials and methods must provide enough detail on how you did your experiments, or
collected the data, to enable experimentation and data collection to be repeated by someone else.
N.B. Methods are not a set of instructions or a recipe e.g., "Put six limpets in a glass jar and
place them in a water bath. Measure the temperature with a thermometer".
Methods are usually (but not always) written in the 3rd person and past tense. For example the
instructions given above should be written as "Six limpets were put in a glass jar placed in a
water bath. The temperature was measured to the nearest degree Celsius using a mercury
thermometer."
Important information that should be presented in this section could include; the number of
animals used, number of times the experiment or sampling was replicated, controls used, area
sampled, time and date of sampling, duration of experiments, experimental conditions (e.g.
temperature, humidity, salinity - were these environmental conditions kept constant and if so
how?), if experiments were on aquatic organisms was the water aerated, etc.
Excessive detail, however, is not always needed. For example, the principles of operation of
instrumentation (e.g. spectrophotometers, oxygen probes, osmometers etc.) need not be
described. It is adequate to state what instrumentation was used. Some extra detail is, however,
sometimes necessary. For example, because there are several different possible ways and
configurations for measuring oxygen consumption in some animals it may be necessary to state
that "oxygen consumption was measured in an open flow-through system" and to describe the
order in which air passed through the different components of the system. It may be necessary to
give some details on the make and model of equipment used.
The final information often placed in the Materials and Methods section is how the data were
analysed statistically. This includes details on the statistical software package used (name,
version, publishers: e.g. SigmaStat version 3, SPSS Science).
Where several different experiments, types of analyses or sampling were carried out it may be
necessary to present these in relevant subsections e.g.
Materials and Methods (= main subheading)
Study Sites (= subsection 1)
Population Structure (= subsection 2)
Reproductive seasonality (= subsection 3)
These subsections may then be used (repeated) in the Results section.
The Results
The results section is where the data obtained are presented. Normally these are presented, where
possible, in Figures (diagrams, photographs or graphs - see data representation and graphical
techniques) and Tables.
N.B. It is not sufficient to present results as tables and figures only, leaving the reader with
the task of interpreting them. The important results or trends from tables and figures must be
explained using text, otherwise the reader might misinterpret results or overlook important
points. All Tables and Figures must have a table or figure number (e.g. Figure 1). Readers can
then be referred to the relevant table or figure in the text of the results section (look at a scientific

7
paper to see how this is done). For example "Oxygen consumption of large animals was double
that of small animals at the same temperature (Table 2)". Rather use this parenthetical format and
avoid self-evident phrases like “Table 3 shows that….” or “As can be seen in Figure 2, …”. Each
table and figure must be accompanied by a caption which briefly explains the contents of the
table or figure. For example:
Fig.1 Relationship between external salinity and blood osmolarity in the intertidal limpet
Scutellastra cochlear.
It is not necessary (or desirable) to present all of your raw data, although for some laboratory
reports you may (consult with the lecturer in charge). For example, you may take numerous
readings of a parameter over a period of observation, or readings from several animals. It is not
necessary to present every reading for each animal when what is important are the mean values
(and some estimate of the variability such as standard deviation or standard error, and the sample
size).
Do not discuss results in this section.
Reporting Results of Statistical Test In The Results Section of Laboratory Reports
Statistical analyses help you to understand your results, e.g., whether or not a variable has an
effect, whether variables are related, whether treatments or groups of observations are the same
or different, etc. Statistics are tools of science, not an end unto themselves; they are part of the
journey, not the destination. Statistics should be used to substantiate findings and allow you to
state objectively whether you have non-random results. Therefore, when reporting the statistical
outcomes relevant to your study, incorporate them into the actual biological results. In short, do
not subdivide the results section – one section in which you first explain what the data in your
graphs or tables show, and a second section explaining the statistics. This is a mistake that many
students make.
Note: It is standard practice to include a section in the Materials and Methods (usually at the end)
that explains the statistical test(s) used to analyze the data and gives details of the statistical
software used (name of software and version).
Examples – Summarizing Results Containing Averaged Data
Example 1
Suppose that you have sampled the same species of lizard from two different geographic
localities. You want to know whether lizards from these two places are of different sizes. When
lizards were caught, their lengths were measured to the nearest 0.1 cm, after which they were
released. You then calculated the mean lengths and plotted the data as a graph, but to determine
whether there was a significant difference in mean length between the two populations you
compared the means using a t-test. A good way to report your findings in the results section of
your report (in addition to the graph) would be to write:
“The mean total length of lizards at Site A (38.2 cm, S.D. = 1.7 cm, n = 20) was
significantly greater (t = 3.91, d.f. = 43, p = 0.011) than that of those at Site B (34.4 cm,
S.D. = 2.4 cm, n = 25) (Fig. 1)."

8
(note: S.D. is a widely understood and accepted abbreviation for standard deviation, S.E. for
standard error and d.f. for degrees of freedom.)
Therefore, in one concise sentence you have provided the reader with comparative information
on the mean size of lizards and its variation, and informed the reader that the means are
significantly different at a particular probability level (which is the p-value). You have also
informed the reader about which statistical test was used to compare the means. In other words
the information on the data and the analysis are linked.
Example 2
Here is another example in which three means were compared in an experiment (Note: to
compare three means a statistical test called an ANOVA is usually used).
Good example of how results could be presented:
“The mean weight of plants grown under white light was significantly greater (ANOVA,
F = 3.14, df = 12, p = 0.035) than the mean weight of plants grown under green or red
light (Figure 1, Table 1).”
In this example, rather than stating all weights and statistics, the reader is referred to the Figure
(i.e. Figure 1) and Table (Table 1) respectively, that show these.
Poor example of how the same results could be presented:
“The mean weight of plants grown in Treatment 1 was 27 grams. The mean weight of
plants grown in Treatment 2 was 19 grams and in Treatment 3, 20 grams.”
… Then later in the results section you write …
“The statistics show a variance of 99.1343870. The ANOVA value was 3.1384. The df
was calculated to be 12. The p was 0.035, so the probability that the results were owing to
chance was less than 5%.”
What this second example shows is that in some cases it is also possible to summarize the
results of statistical analyses as a table. Look at the results section of the ‘Hypothetical Student
Report’ (pages 9-12) to see this.
The Discussion
The discussion is where the meaning of the results is interpreted; it is not where the results are
repeated or new/more results reported. Essential features of a discussion are:
To present the principles, relationships and generalisations shown by the results
i.e. put results into context.
To point out any correlations or lack of correlations.
To show how the hypotheses, results and interpretations agree (or disagree) with
previously published information on the subject, citing references where
appropriate. Consulting previously published work may help you interpret the
meaning of your results.
To state any conclusions and summarize evidence for them.
The Reference List (Note: to find out how to cite references in the text, read pages 23-25)
These are cited in alphabetical order and completely so that a reader may locate them if required.
There are many different formats by which scientific references are presented in a reference list.
What most have in common is that they are presented with the names of the authors first
(surname followed by initials), the date of publication, the title of the reference, name of the
9
journal (in full or abbreviated, often presented in italics), volume number and then page numbers
of articles. All this information enables readers to find the reference themselves.
For example:
Rahn, H., Ar, A. & Paganelli, C.V. 1979. How bird eggs breathe. Scientific American.
240: 46-55.
NOTE: Do not make up journal abbreviations. Journals have internationally recognized
abbreviations and you can find these in handbooks in the library. To find the correct journal
abbreviation, go to the Interlibrary Loan section and ask the staff there for the indices to journal
abbreviations. Alternatively, these are now online at
http://www.ru.ac.za/library/journals/journaltitleabbreviations
Within the reference list, references are placed in alphabetical order. Where more than one
paper from the same author has been cited, the references are then placed in chronological order.
If an author has published work on their own, as well as with other researchers, then these papers
appear in the reference list as the single author papers in chronological order followed by multi-
author papers in chronological order. An example of such a sequence is given below, the titles of
the papers and journal names having been omitted for clarity.
Smith, J. 1990
Smith, J. 1995
Smith, J. & Jones, F. 1990
Smith, J. & Jones, F. 1995
Smith, J., Jones, F. & Brown, A. 1990
Smith, J. Jones, F. & Brown, A. 1995
Endnote
The key to good writing is to consider your readers’ needs, and to rewrite and edit the text several
(e.g. five) times with that in mind.

10
HYPOTHETICAL EXAMPLE OF AN UNDERGRADUATE STUDENT
LABORATORY REPORT
Zoology 202 – Experimental Report
Does the epiphragm reduce the rate of water loss in the pulmonate land snail Cornu
aspersum?
D.R. Upward
Department of Zoology & Entomology, Rhodes University, Grahamstown, South Africa
Email: [email protected]
Introduction
Terrestrial snails can lose water from the mantle cavity via respiration, by evaporation through
the aperture of the shell, and across the shell (Machin, 1975; Perrott, Levin and Hyde, 2007).
Although terrestrial pulmonates are tolerant of water loss (Machin, 1975), these animals
minimize loss of fluid using behavioural, structural and physiological mechanisms (Asami,
1993). One morphological mechanism is to retract the body inside the shell and then seal the
shell opening (aperture) with an epiphragm which is made of solidified mucus (Perrott, Levin and
Hyde, 2007).
The brown garden snail Cornu aspersum is native to western Europe although it has been
introduced to many parts of the world including South Africa where it can be a pest (Herbert,
2010). Like other terrestrial pulmonates this species seals its body inside its shell with an
epiphragm during periods of inactivity. The aim of this experiment was to determine how
effective this seal is in reducing the rate of water loss in C. aspersum.
Materials and Methods
Twenty inactive Cornu aspersum of similar size (shell height 20 ± 0.3 mm) with intact
epiphragms were collected from gardens in Grahamstown. The epiphragms of 10 snails were
removed gently with a scalpel and all snails were weighed to two decimal places of a gram. Each
snail was put on an aluminium dish, and then dishes with snails were placed in an incubator at
25oC and 70% relative humidity for 24 hours. During this time all snails were inactive. After 24
hours the snails were re-weighed. Water loss was determined by calculating loss in snail weight.
11
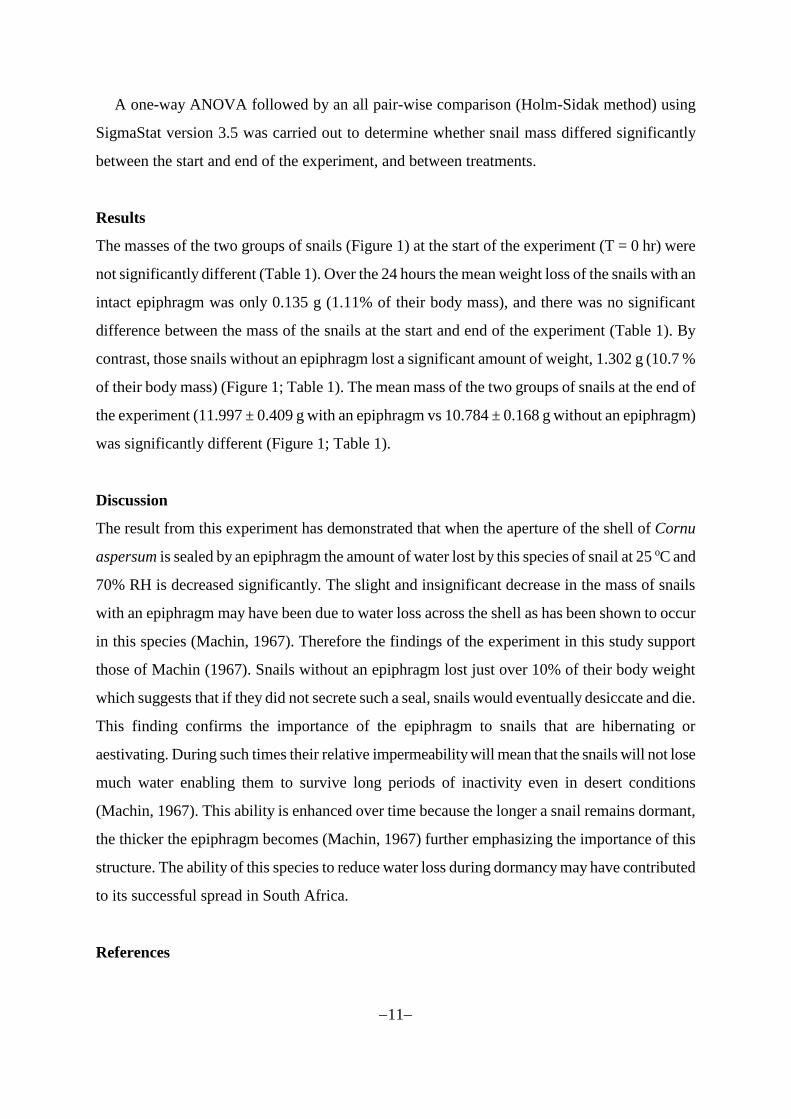
A one-way ANOVA followed by an all pair-wise comparison (Holm-Sidak method) using
SigmaStat version 3.5 was carried out to determine whether snail mass differed significantly
between the start and end of the experiment, and between treatments.
Results
The masses of the two groups of snails (Figure 1) at the start of the experiment (T = 0 hr) were
not significantly different (Table 1). Over the 24 hours the mean weight loss of the snails with an
intact epiphragm was only 0.135 g (1.11% of their body mass), and there was no significant
difference between the mass of the snails at the start and end of the experiment (Table 1). By
contrast, those snails without an epiphragm lost a significant amount of weight, 1.302 g (10.7 %
of their body mass) (Figure 1; Table 1). The mean mass of the two groups of snails at the end of
the experiment (11.997 ± 0.409 g with an epiphragm vs 10.784 ± 0.168 g without an epiphragm)
was significantly different (Figure 1; Table 1).
Discussion
The result from this experiment has demonstrated that when the aperture of the shell of Cornu
aspersum is sealed by an epiphragm the amount of water lost by this species of snail at 25 oC and
70% RH is decreased significantly. The slight and insignificant decrease in the mass of snails
with an epiphragm may have been due to water loss across the shell as has been shown to occur
in this species (Machin, 1967). Therefore the findings of the experiment in this study support
those of Machin (1967). Snails without an epiphragm lost just over 10% of their body weight
which suggests that if they did not secrete such a seal, snails would eventually desiccate and die.
This finding confirms the importance of the epiphragm to snails that are hibernating or
aestivating. During such times their relative impermeability will mean that the snails will not lose
much water enabling them to survive long periods of inactivity even in desert conditions
(Machin, 1967). This ability is enhanced over time because the longer a snail remains dormant,
the thicker the epiphragm becomes (Machin, 1967) further emphasizing the importance of this
structure. The ability of this species to reduce water loss during dormancy may have contributed
to its successful spread in South Africa.
References

12
Asami, T. 1993. Interspecific differences in desiccation tolerance of juvenile land snails.
Functional Ecology 7: 571-577.
Herbert, D.G. 2010. The introduced terrestrial Mollusca of South Africa. SANBI Biodiversity
Series 15. South African National Biodiversity Institute, Pretoria. 108pp.
Machin, J. 1967. Structural adaptation for reducing water-loss in three species of terrestrial snail.
Journal of Zoology. 152: 55-65.
Machin, J. 1975. Water relationships. In: Pulmonates, eds V. Fretter and J Peake. Volume 1, pp.
105-163. Academic Press, London.
Perrott, K.K., Levin, I.I. and Hyde, E.A. 2007. Morphology, distribution and desiccation in the
brown garden snail (Cantareus asperses) in northern New Zealand. New Zealand Journal
of Ecology, 31: 60-67.
Table 1. All pairwise comparison of weights of snails. epi = epiphragm present; no epi =
epiphragm removed. N = 10 snails per treatment.
Comparison Difference of
means
t P P<0.05
T = 0 epi vs. T = 24 no epi 1.348 8.894 <0.001 Yes
T= 0 no epi vs. T = 24 no epi 1.302 8.591 <0.001 Yes
T = 24 epi vs. T = 24 no epi 1.213 8.003 <0.001 Yes
T = 0 epi vs. T = 24 epi 0.135 0.891 0.760 No
T= 0 no epi vs. T = 24 epi 0.0890 0.587 0.807 No
T = 0 epi vs. T= 0 no epi 0.0460 0.304 0.763 No

13
Figure 1. Mean (+ S.D.) mass (with shell) of snails with and without an epiphragm after 24 hours
at 25oC. N = 10 per treatment.
Epiphragm No Epiphragm
An
ima
l m
ass (
g)
0
2
4
6
8
10
12
14
16
18
20
T = 0 hr
T = 24 hr
14
DATA REPRESENTATION, GRAPHICAL TECHNIQUES AND TABLES
Introduction
Data obtained by biologists from experiments, measurements or observations are eventually
presented in the results section of a scientific report or manuscript, although summary data in
which your work is compared (in either a table or graph) with that of other published information
may be placed in the discussion. An important aspect of a results section is the representation of
the data. In many cases the investigator will have gathered the results at great financial and
personal (in terms of man hours) cost. The scientist must present, or represent, these results in a
clear and unambiguous way. This ensures that they are perfectly understandable to other workers
who will eventually read the report. Data presentation is therefore a valuable skill that must be
acquired.
Scientific data (results) can be presented in the form of tables or graphs. It is the graphical
representation of data which is the focus of this section. Good and appropriate graphs allow rapid
comparison of the effects of different treatments, the effect of parameters on different species, or
assessment of trends, be they temporal or relationships between variables.
There are numerous ways of representing data graphically, some of which are more
appropriate to certain types of data than others. Selecting the appropriate type of graph that best
shows the important features of your data can sometimes be confusing. There are also several
components that go into constructing a graph, and carefully considering these can go a long way
towards making the graph easy for readers (and yourself) to grasp. Almost as important as the
graph itself is the caption (an alternate name is the legend), describing what the graph represents.
Visual Presentation of Results
As mentioned above, results may be presented in two fundamental ways:
Tables
Graphs
There are many cases where data can be presented either way, and whether to use a table or a
graph is not always obvious. The advantage of a table is that it allows other readers to see precise
numbers that may be difficult to determine from a graph (e.g. 22.367 ± 3.678). Thus, if precision
is important for complete understanding of the findings, then the data are best presented as tables.
All lists e.g. of species on which various measurements have been taken (e.g. length, width,
height etc.) are also often best represented in a table.
Table Formatting
A common formatting error of tables produced by students is that their tables contain all the grid
lines that most software inserts by default e.g. Table 1. These must be removed so that there are
no vertical lines and the only horizontal lines are one above and below the headings and one at
the foot of the table (read any journal paper to see this). Table 2 gives you a correctly formatted
example of Table 1.

15
Incorrect format of a table:
Table 1. Mean (± S.D.) density and biomass of thrips on plants.
Male thrips Female thrips
Density (number/m2) 505 ± 30 450 ± 21
Biomass (g/m2) 20 ± 5 30 ± 3
Correct format of the table above:
Table 2. Mean (± S.D.) density and biomass of thrips on plants.
Male thrips Female thrips
Density (number/m2) 505 ± 30 450 ± 21
Biomass (g/m2) 20 ± 5 30 ± 3
Graphs
The advantage of a graph is that it has more visual impact which makes it easier to see trends and
patterns in some types of data. The data represented as a scatter plot in Figure 1 immediately
reveal that there is a relationship between yolk content and egg mass. If the data were presented
in a table, this relationship would be much harder to see.
% yolk = 40.2 - 0.029 egg mass
r2 = 0.89
Egg mass (g)
0 100 200 300 400 500 600
Yo
lk (
% e
gg
co
nte
nts
)
20
25
30
35
40
45
50
Figure 1. Yolk content (% of egg content) in relation to egg mass for 32 species of Procellariiformes
There are several ways of plotting data as graphs and some data can be represented by more
than one graph type. Often, however, a specific type of graph is more appropriate to certain types

16
of data. The first thing to be decided, therefore, is the type of data you have and therefore graph
to use.
Types of Graph - Which One To Use?
There are five basic types of two-dimensional graphs, although on occasions data must be plotted
as three-dimensional graphs. These, however, are rather specialised and the majority of scientific
reports will not require them. This section concentrates on fundamental 2-D plots.
The five types are:-
Bar graphs or histograms (vertical or horizontal).
Point graphs (with or without lines joining the points).
Scatter plots (which may have a line showing a trend).
Pie diagrams.
Kite diagrams.
Bar Graphs and Histograms
Bar graphs or histograms are useful for data involving frequencies. For example: numbers (or
percentage) of animals in different size categories; number (or percentage) of animals per month
or per site; rainfall over specific time periods. The category (size, number, month) is plotted on
the horizontal or X-axis, and the number (number of observations or percentage) in each category
is plotted on the vertical or Y-axis (note that some graphs may need two y-axes if types of data
are plotted). The difference between a bar graph and a histogram is that bar graphs are used when
dealing with discrete measurements - the bars on the graph do not touch each other. Histograms
are used to represent continuous data and the bars should be continuous (compare Figure 2 with
Figure 3 upper and middle histograms), although many authors seem to ignore this convention.
Bar graphs and histograms are not restricted to data involving total numbers or percentages,
but means and variability in the form of standard deviations or standard error can also be
represented in this way (Figure 3 upper histogram).
Species
ES RWS WS GS
Nu
mber
of nests
occupie
d
0
2
4
6
8
10
12
14
16

17
Figure 2. The number of nest boxes occupied by European starlings (ES), Redwinged starlings (RWS),
Wattled starlings (WS) and Glossy starlings (GS).
Figure 3. A, mean (± S.D.) monthly change in size of the ovotestis of Xerocerastis minutus, expressed as
percentage of the cross-sectional area of the visceral hump. Horizontal blocks represent months in which
gametogenesis was occurring. B, total monthly precipitation from fog at the Hamilton range weather station;
numbers above histograms are total number of fog days. Asterisk indicates incomplete months, data from
which may therefore be an underestimate. ND = no data. C, maximum and minimum (stippled) air
temperatures recorded in each month.
Line or Point Graphs
Line graphs are often used when plotting data of two variables e.g. oxygen consumption at
different temperatures; blood osmolarity in relation to urine osmolarity. Data can be plotted as
individual points (Figure 4) or as means with the variability (Figure 5). If the data are continuous,
or in temporal or spatial sequence, then the means can be joined by lines (as shown in Figure 5).
When all data points are plotted as a scattergram (e.g. length width relationship) a line, based on
the appropriate statistics (e.g. a regression) can then be plotted through these points to describe,
mathematically, the relationship between the variables (Figure 4). This line should never be
fitted by eye as you would be guessing.

18
Dry moult mass = 3.34 x 10⁻⁵
X length 3.045
r2
= 0.98; n=26
Carapace length (mm)
0 20 40 60 80 100 120 140 160D
ry m
ou
lt m
ass (
g)
0
20
40
60
80
100
120
140
B
Dry mass (g)
0 100 200 300 400 500 600
Dry
exu
via
(g
)
0
20
40
60
80
100
120
140
A
Exuvial DM = 0.271 DM + 0.6664
r2 = 0.94; n=26
Figure 4. Exuvial mass of different sized Jasus lalandii (A = carapace length; B = dry mass).
Figure 5. Comparison of the number of dead ostracods (x,¯ ± S.D.) during a 26 day experiment in which the
crustaceans were either infected or uninfected by trematode parasites.
Pie Diagrams
Pie graphs (Figure 6) are often used to show proportions or percentages and an example of a pie
diagram is presented below.

19
Figure 6. Division of searching time during foraging by bat-eared foxes in June 1987. Data are expressed as
percentage of total time spent on each subdivision.
Kite Diagrams
Kite diagrams (Figure 7) are sometimes used in ecology to show density and distribution of
species along a transect line or other environmental gradient. The scales are not always linear.
Figure 7. Biomass and distribution of dominant macrobenthic invertebrates in the Kariega river estuary.
There are other types of graph, but the above, particularly the histogram and point graph, are the
most frequently used.
How Many Graphs? - Comparative Graphs
When there is only one data set a single graph is all that can be used. Often several different data
sets will have been collected or separate experiments carried out. For example, data might have
been collected monthly on temperature, rainfall and reproductive condition of an animal over a

20
12 month period. Rather than plotting these parameters as individual graphs it might make more
sense to combine them into one graph so that reproductive condition can be pictured in relation to
temperature and rainfall (e.g. Figure 3). Another example of plotting all of the data on one graph
could be data (e.g. oxygen consumption) collected over the same time period but for different
species or for one species at different temperatures or weights. Such graphical representation
would allow immediate visual comparison of trends.
How Should The Data Be Plotted? - Independent and Dependent Variables
When plotting a graph it is important to ensure that the right data are plotted on the right axis. In
most cases there is a convention for deciding which is plotted on the X and which on the Y axis
and is based on which of the variables is dependent on the other. For example, the rate of oxygen
consumption of an animal may be dependent on ambient temperature, its body size or sex, but
not the other way around i.e. the ambient temperature, body size or sex are not dependent on the
animal’s oxygen consumption. In the example just given, therefore, oxygen consumption is the
dependent variable and this always goes on the Y-axis. Temperature, body size or sex are
independent variables and always go on the X-axis.
Sometimes it is not possible to distinguish the dependent and independent variables and in
these cases the choice of axes is arbitrary. For example there may be a relationship between two
size parameters of an animal, both increasing as the animals grows. The two variables may be
related, but it is not possible to say that one is dependent on the other.
Scale and Labelling
Once the type of graph has been selected and the independent and dependent variables identified,
the graph can be drawn. It is important to choose a sensible scale for the axes so that the graph
does not look ridiculous (e.g. too compacted so that trends cannot be seen or too expanded so that
trends are exaggerated). The axes must be labelled correctly. Make sure that the labels are large
enough to be easily read. Data points on point graphs should be represented by symbols and on
comparative graphs different symbols must be used for different sets of data. If the bars of bar
graphs and histograms are to have filling, ensure that this is done sensibly.
Hand drawn graphs
If you have to draw graphs using a pen or pencil on graph paper ensure that: a) all labels are
printed, b) symbols are drawn neatly, c) lines that join points are drawn by ruler, d) variability
lines about a mean are drawn with a ruler, e) when drawing the graph ensure that there is
sufficient room (about 3 cm) on the paper to enable labels for the axes to be placed to the left side
of the y-axis and beneath the x-axis.
The Legend (or Caption)
The legend should contain enough text, along with the information on the graph itself, to enable
the reader to understand the graph completely. If this is not possible, then the legend is
inadequate. At the same time, the legend should be succinct. Avoid legends that begin “A graph
showing....” or “A histogram showing....”. Thus a legend should not read “A graph showing
21
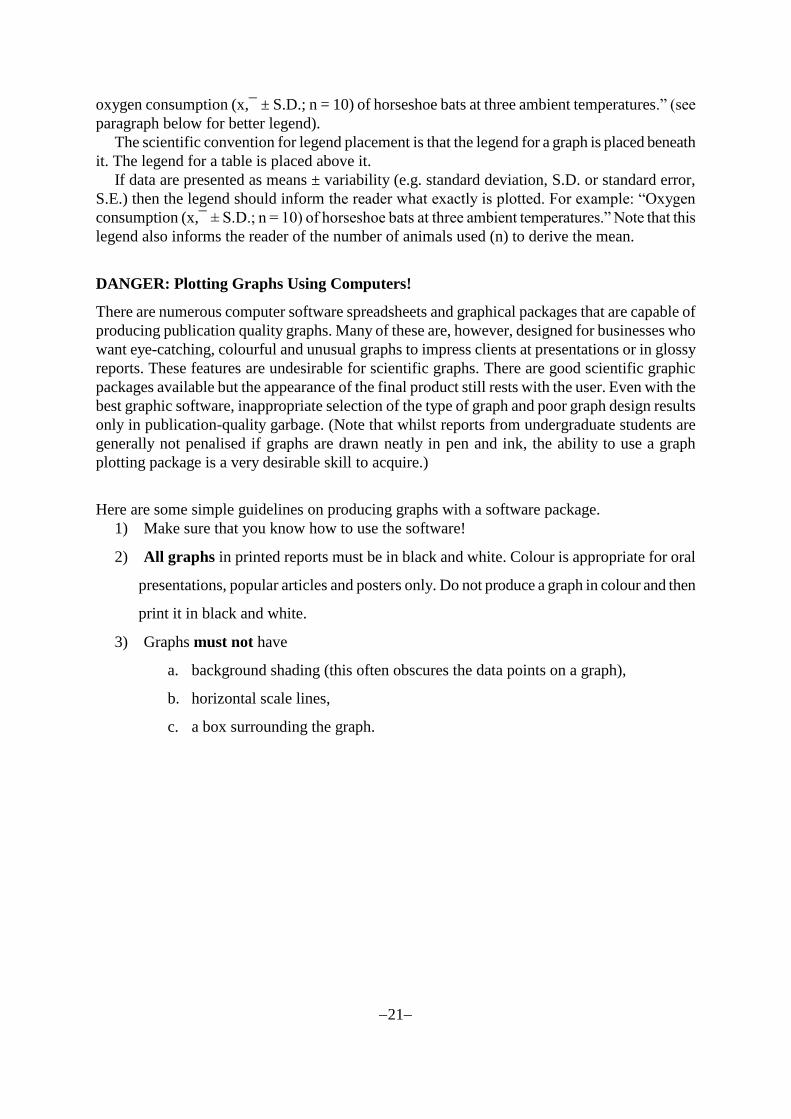
oxygen consumption (x,¯ ± S.D.; n = 10) of horseshoe bats at three ambient temperatures.” (see
paragraph below for better legend).
The scientific convention for legend placement is that the legend for a graph is placed beneath
it. The legend for a table is placed above it.
If data are presented as means ± variability (e.g. standard deviation, S.D. or standard error,
S.E.) then the legend should inform the reader what exactly is plotted. For example: “Oxygen
consumption (x,¯ ± S.D.; n = 10) of horseshoe bats at three ambient temperatures.” Note that this
legend also informs the reader of the number of animals used (n) to derive the mean.
DANGER: Plotting Graphs Using Computers!
There are numerous computer software spreadsheets and graphical packages that are capable of
producing publication quality graphs. Many of these are, however, designed for businesses who
want eye-catching, colourful and unusual graphs to impress clients at presentations or in glossy
reports. These features are undesirable for scientific graphs. There are good scientific graphic
packages available but the appearance of the final product still rests with the user. Even with the
best graphic software, inappropriate selection of the type of graph and poor graph design results
only in publication-quality garbage. (Note that whilst reports from undergraduate students are
generally not penalised if graphs are drawn neatly in pen and ink, the ability to use a graph
plotting package is a very desirable skill to acquire.)
Here are some simple guidelines on producing graphs with a software package.
1) Make sure that you know how to use the software!
2) All graphs in printed reports must be in black and white. Colour is appropriate for oral
presentations, popular articles and posters only. Do not produce a graph in colour and then
print it in black and white.
3) Graphs must not have
a. background shading (this often obscures the data points on a graph),
b. horizontal scale lines,
c. a box surrounding the graph.

22
A GUIDE TO ESSAY WRITING
Essays are written as part of a training in science, with the specific aims of developing skills in:
finding information
assimilating and integrating that information concisely
planning and developing a logical presentation
presenting a well-formatted manuscript.
This short guide offers some advice on how to plan and structure an essay.
Preparing the Essay
After taking careful note of the essay topic, first define the scope of the essay. This means
analyze the subject matter carefully, using a dictionary if you need to; formally write down (1)
the instruction words (e.g. discuss, criticize, etc.) and (2) the topics to cover. For example, look at
the essay topic below:
“Inter-relate evolutionary trends in the foraging habits, communication systems and
colony sizes of ants. Illustrate each level of evolutionary development with an example”.
You could begin by noting
· Inter-relate
· Illustrate
· Evolutionary trends in ant foraging habits
· Evolutionary trends in ant communication system
· Evolutionary trends in ant colony sizes
· The interactions of the trends.
Read around each topic, relying first on any references supplied by your set works or with the
essay title. Then read some of the references cited by these readings if they seem relevant. Try to
find recent scientific articles in journals (note that electronic resources in most libraries are useful
for this), and especially the original articles, but cross-check second-hand reports or older work
by reading the originals yourself. Make notes as you read, asking yourself:-
“What is this evidence based on?”,
“How logical is the argument?”, and
“Does this have direct relevance to the title of the essay?”.
Keep critical notes about your reading and all details of the source(s) of your facts, especially
quotations (see citation). Failure to acknowledge your sources (i.e. plagiarism) is theft, and has
the same consequences if you are caught. Try to avoid photocopying information. Rather make
your own notes from reference sources, putting information into your own words. You will find
that by doing this you will develop a greater understanding of the topic.

23
Writing The Essay
Break each topic down into logical parts and arrange them in a logical sequence so that the
background to each part is clear before the reader reaches it. Write a paragraph for each point you
raise. It may help to make sure that each paragraph addresses one point, and give each paragraph
an appropriate temporary heading. Check that the outline created by the order of these headings
is logical and complete. Remember to remove these temporary headings before printing your
essay. Create a summary based on these headings and include it as an abstract at the start of your
essay. Add sub-headings to major sections of the essay based on your analysis of the essay
material.
After drafting the body of your essay, create a discussion that summarizes YOUR opinion of
the topic. Support your arguments with precise, quantitative information and accurate citations.
Above all, do not be vague as it creates the impression that you do not understand the topic. Your
essay should finish with a concluding paragraph which ‘ties’ the essay together. It is usually
easiest to write your introduction last, when you know what is in the rest of the essay. The
introduction should put the essay title into context and lay out the aims and structure of the rest of
the essay. Remember to define your terms before you use them.
Finally, use tables and figures to summarize data, and refer to these in the text. Do not use
redundant phrases such as “Table 1 shows that......”; rather state “.......ants were more abundant
than other insects (Table 1)” . Legends or titles go above tables and below figures. All drawings,
graphs and charts are called figures. If you copy figures or tables from other sources, you must
acknowledge this e.g.
Table 3. Life history parameters of palaeotropical holothuroids (from Young 1976).
Ideally you should try to produce your own version of a figure or table by redrawing the
original. For example a table may contain far more information than you require to illustrate the
point you are making. You can therefore edit out the superfluous information. Alternatively, you
may need to combine and synthesize information from several sources (tables, text or figures).
Such editing of information and/or synthesis will gain you a great deal of credit when your essay
is marked. The ability to synthesize information is another valuable skill to acquire.
Essays should be produced using a computer and word processing package. Such facilities are
readily available to students and should be used. Most employers expect employees to have basic
skills in the use of computers. The text must be double-spaced on one side of A4 paper. This
makes it easier to read the work and there is space for the assessor to write comments. Figures
and tables can be placed on separate pages at the end of the manuscript if they disrupt the text too
much. Although an essay is primarily a demonstration of your grasp of a subject, your spelling,
grammar and general use of English are also important. Spelling mistakes and grammatical errors
are seldom excusable, and mark you as careless, so proof read your work thoroughly.
Referencing formats
In the text of your essay, you will make references to the work of other scientists. These are
called citations. They are complemented by a detailed reference list of the cited works which is
placed at the end of the text.
24
Citations in the text
Citations are used in the essay whenever you state a fact that is supported by someone else’s
work. This gives them credit, protects you from others’ mistakes, and allows your reader to
follow up the work. Remember that plagiarism is illegal (and immoral), and you will lose marks
if you are caught. If the plagiarism is extensive your essay will be given zero and you may loose
your D.P. (see end of this section for more details on plagiarism).
There are two major forms of citation: footnotes and what is called the Harvard or Cambridge
system; scientific writing generally uses the latter. Within the text citations take the following
general forms:
one author - (Fox, 1986)
two authors - (Crane & Driver, 1965)
three or more authors - (Grynche et al., 1990)
several citations - (Smith, 1986, 1988a, 1988b)
complex citations - (Sieve, 1990, 1991; Sieve & Roe, 1991)
indirect citations - (Payne, 1922 cited by Hurt, 1980)
Example - “...are the longest in the Amazon (Hall & Wu, 1989). Some of...”
A direct reference to an author is followed by the date alone, for example, “Dawse (1972a,
1972c) claims that mad cow disease is...”
In complex cases, citations are usually listed first in order of year of publication, and then
alphabetically by author; “...has been reviewed several times (Reed, 1922; Soule et al., 1956;
Mickle, 1969, 1987; Klutter, 1992b).”
When making particularly accurate citations, e.g. of quotations, you should include the page
number: ...these reasons, Berndt (1989: 26) concluded that reinforcement “has no time to operate
before extinction”.
Avoid using too many quotations, especially long ones. All quotations must be so accurate that
they even include any mistakes made in the original text.
Indirect citations should be used when you have not read the original work yourself. You need to
let your reader know where they can follow up your claims. Indirect citations are not listed in the
reference list, only the paper in which you found reference to the citation.
The Reference List
A list of references is placed after the text and contains all the works you cited, and no others.
The list helps readers to trace other papers on the subject. The references are listed in alphabetical
order by author(s), and then by date. Works by the same authors in the same year are given as an
identifying letter after the date, and this letter is used in the text. The general format includes the
following information:-
i. For a scientific paper (journal article):
Author (surname and initials), date of publication, title of article, name of journal (in full or
abbreviated – usually in italics), volume number (often in bold), page numbers.
Example:

25
Carpenter, B., Ball, I. & Green, C. 1992. Methods for measuring Quine intervals. Journal of
Quantitative Biology 34: 23-27.
ii. For a scientific paper with DOI assigned:
Author, A. A., & Author, B. B., date of publication, title of article, name of journal, volume
number, page range. doi:0000000/000000000000
Example:
Brownlie, D. 2007. Toward effective poster presentations: An annotated bibliography. European
Journal of Marketing, 41: 1245-1283. doi:10.1108/03090560710821161.
iii. For a chapter from an edited book:
Author(s) surname(s) and initials, year, title of paper, editor, title of book (often underlined or in
italics), publisher, city of publication, inclusive page numbers.
Example:
Cale, J.J. 1987. Antiguan polydesmid millipedes. In: Invertebrates of Antigua. Ed. B.R. Eath,
Greenhouse Press, London. pp. 221-234.
iv. For a book:
Author(s) surname(s) and initials, year, title of book (usually in italics), publisher, city of
publication, number of pages.
Example:
Freedman, Y.K. 1990. Introductory Quantitative Oology. Practical Press, New York. 147 pp.
If you have doubts as to how a reference should be cited, examine recent copies of journals for
appropriate examples.
Before listing your cited references it is important to check the details of punctuation within
the reference against a recent copy of the journal you are writing for. Detailed information can be
found in the instructions to authors, which are usually inside the back cover of one of the issues
of the journal.
Check with your lecturer what referencing format is required for any given assignment.
Internet Citations
There is a great deal of information available at internet sites. Care should be taken in the citation
of information from such sources. Unlike journal articles which are strictly refereed, internet
websites may not have been subjected to any rigorous peer review process. For example some
web pages may be information posted by other students as part of a course assignment. The
accuracy of website data may not have been authenticated. At present internet information is
generally not regarded as “primary literature” (such as journals or books) and you should avoid
citing such information unless the information has an author(s), date, and there is some proof that
the article has been reviewed. If you do quote an internet site ensure that you give the internet
address accurately.
Internet citations should be given as:

26
Author(s) surname(s) and initials, date of the release of the web page, title of article, internet
address, author affiliation, date the web site was accessed.
Example
Smith, A.A. 1999. The density and distribution of frogs in Grahamstown, South Africa.
http://www.ru.ac.za/zoology/toad.pdf. Rhodes University, Accessed 20/3/99.
Plagiarism (L. plagiarius - a kidnapper)
Plagiarism is the act of stealing the thoughts or writings of others and presenting these as one’s
own. It is a crime and is also immoral. Therefore copying text verbatim from printed works,
or cutting and pasting from the internet is an act of plagiarism. We regard plagiarism as a
serious offence and students who do this will have their work penalised and will be required to
re-write assignments. One of the aims of assignments such as essays is to give students
experience in synthesizing information obtained from a variety of sources. It is therefore
important that students develop the ability to present this information in their own words and to
give credit to the ideas of others. If it is necessary to quote from the work of others, ensure that
the text is placed in quotation marks and an accurate citation given.
Detailed information on the university policy on plagiarism can be found at:-
http://www.scifac.ru.ac.za/plag.htm

27
RESEARCH POSTERS
Information from research projects can be displayed (either in the department or at a conference)
in the form of a poster (sometimes known as a poster paper). As many scientific conferences are
attended by well over 100 delegates, there is often insufficient time in the conference program to
allow all delegates to present their work verbally (usually as a 15-20 minute talk). Delegates may
be asked to present their work as a poster paper. Poster papers can be used to present preliminary
findings and are often the first way in which postgraduate students participate in a scientific
conference. The ability to produce a good poster paper is another valuable skill that a scientist
must acquire.
Poster papers contain all the same elements as a written paper: a title (which often
incorporates the names of the author/s), introduction, results section and a discussion (see section
on scientific writing) and list of references. Because posters have a constraint to their physical
size (conference organisers always set some limit to the physical dimensions of a poster - the
most common size of a poster is about A0 or 1 m x 1.2 m), the amount of information that can be
presented is limited. It is therefore very important that before making the poster you decide upon
the most important information that needs to be included in all sections. Once information has
been selected, design the layout of the poster using rough sketches. Once you are satisfied with
the layout of the poster make a full-sized model using drafts of the text, graphs and tables. This
gives you the opportunity of seeing whether your design will work. It is very important that you
check the limits of poster dimensions set by the conference organisers.
A good poster has the following features:
It is eye-catching and colourful (without being garish).
It synthesizes important findings in as few words as possible (readers do not want to
spend hours trying to read the poster). Uncomplicated graphs (preferably in colour) and
tables are therefore very important.
It should be possible to read the text at a distance of about 1 m. Text size should therefore
be about 10-15 mm high. The title should be in larger print.
The text and illustrations are neatly trimmed and mounted straight (if the poster has not
been printed by a graphics unit).
For undergraduates, one of the simplest ways to make a poster is to produce the text on a good
printer (e.g. laser or ink jet). The text is then attached to coloured card. The text cards are in turn
mounted on a single large backing panel or a series of panels which fit together to form the
poster. Posters made of panels are common because the panels are easier to carry and can often
be packed into a suitcase or other travel bag.
Most scientists now make posters using computer software packages (e.g. PowerPoint) and the
final poster is printed on a large printer, usually on A0 paper. The poster is often laminated to
protect it. The use of such software means that it is possible to experiment with the design of the
poster and all students are encouraged to learn how to produce posters in this way. The
disadvantage of this method is that printing the poster is expensive and any errors on the final
product are not readily corrected (especially if the poster has been laminated). Computer-
generated posters must therefore be checked most thoroughly for errors.
Most science departments have a variety of research posters on display. Take the time to
examine these for ideas on design, layout and colour schemes.

28
Finally, before departing for the conference, see if the organisers have provided any
information on how the posters are to be mounted. Conference organisers usually provide all
mounting materials but it is often a good idea to take your own drawing pins, Velcro-tape and
Prestik with you as well as material to repair your poster in case of damage in transit.

29
PRESENTING RESEARCH TALKS
Most students at some stage have to give a talk to the rest of the class and to their lecturers. Such
oral presentations are another important aspect of scientific training. Whilst many people find
talking in public a harrowing experience, this need not be so if the talk is well prepared. Good
talks are rarely ‘off the cuff’. A good presentation is usually one which has been long in
preparation and well rehearsed.
Whilst an oral presentation contains most of the elements of a written paper (e.g. an
introduction with the rationale and aims, materials and methods, results and discussion), talks
must differ from written papers in one important respect. A reader of a scientific paper has time
to read (and re-read) the paper slowly and to consider carefully the information contained within
it. A talk gives the audience only one chance to grasp the important information, unless the
speaker repeats important points. To ensure that a talk has maximum impact, therefore, talks
must be very well organised, logical in structure and content, and not contain information which
diverts the listeners’ attention from the main point of the talk. Delivery must be clear and smooth.
Below are a number of points which form elements of a good presentation.
Content
Research the background of your audience. A talk at a specialist scientific meeting, for
example, needs to be pitched at a different level to that of a public lecture where the
audience will have a wide range of interests and levels of knowledge.
Many speakers begin their talk with an overview (in point form) of the structure of the
talk. Whilst this is not always necessary, it can be very helpful to the audience and shows
that you have planned your talk carefully. Do not begin your talk by stating the title of
your talk. Your audience has usually been given this in advance. However you may like
to display a slide or overhead transparency with the title of the talk, your name and
affiliation whilst you make your introductory remarks.
The first part of the talk should contain important background information, which places
your study in context. Here it is important to draw the audience’s attention to a few
important previous works. This background information should gradually lead you to tell
your audience of the aims of your study. This could perhaps be presented in the form a
question (which you pose to your audience) or a hypothesis (which you will try to test).
Some speakers often incorporate the question into the title of the talk.
Unlike a research paper, the materials and methods of the work, results and a discussion
of them, can often be combined, rather than presenting them as discrete entities. When
presenting information on how the work was done it is often useful to show the audience:
a photograph, diagram or specimen of the animal(s) studied; photographs or maps of the
study site; examples of the equipment used (if special) and/or experimental enclosures.
Always inform your audience of the numbers of animals used, numbers of replicates of
experiments (or samples) carried out, what controls were used in experiments, how
experimental conditions were controlled.
When presenting results, ensure that any tables and graphs used to show results contain
relevant data only. Avoid showing a table (or graph) and informing the audience that they
must only concentrate on one line of data! Graphs and tables should show the variability

30
in the data and you should explain whether comparative data are statistically significantly
different (or not). Explain what statistics were used to reach this conclusion.
Lead you audience through the presented results, highlighting and pointing to (on your
visual aid) the important findings. This gives your audience a chance to examine your
results. Do not display data for a few seconds only, as if you had something to hide.
When discussing the meaning/interpretation of your results put your results in context.
How do they relate to findings from other studies? How have they advanced knowledge
of a field of research? Do they confirm or refute previous findings? If your results do not
agree with those of other workers, how might the differences be explained?
Make sure that all information can be read from the back of the lecture hall. Do not put
too much information on visual graphics.
Finish your talk by summarizing all important points, perhaps as a single visual graphic
with a series of important points. It is important, however, to leave the audience with a
‘take home message’. If you have posed any questions at the beginning of the talk, make
sure that you have attempted to answer them or explained why you were unable to answer
them.
Delivery
Make sure that you know your material. It is a great advantage if you can present a talk
without referring to your notes. This comes with confidence of knowing the material, and
is helped by practice and well prepared visual aids to prompt you. If you do require your
notes, try to refer to them as little as possible. Make sure your notes are written so that
you can find information in them rapidly. Never read your notes word for word; this
makes for a very boring talk and poor communication with the audience. When using
Powerpoint never have your entire talk written out on the ppt slides – all you end up
doing is reading what is on the screen.
Look at your audience frequently. Talk to them, not the black (or white) board, visual
graphic or the computer screen. Unless you have to write something on the board, do not
turn you back on your audience. Eye contact is a key factor in giving a lively talk.
Project your voice as if you were addressing someone in the back row. Voice projection
needs to be adjusted according to the acoustics of the room, and size of the room. Vary
the pitch of your voice. Nothing sends an audience to sleep faster than someone speaking
in a dull monotone.
On some occasions you may be asked to use a microphone (fixed, hand held or lapel
type). Their use requires practice as many speakers continually bump the microphone,
turn away from it or shout into it. All this results in poor voice projection and is very
distracting.
Try to practice your talk in the room in which it will be presented. This allows you to
judge the acoustics of the room and enables you to become familiar with the position of
light switches and the controls of any equipment.
Your manner of speech should be friendly and helpful, not dictatorial or aggressive.
Never talk down to your audience. Do not be flippant or use colloquial expressions. If
you need to use specialist terms (‘jargon’) or acronyms, explain these carefully. When
making important points slow down the speed of your delivery. Tell the audience that
these are important points.

31
Try to inject enthusiasm into your talk to let the audience know that you find the work
interesting and that you enjoyed doing the study.
Some humour in a talk can be welcome. However, the overuse of humour can detract
from your talk. Do not tell jokes!
NEVER overrun your allotted speaking time. It is rude and inconsiderate to other
speakers who may have to follow you. If you have practised your talk carefully you
should be able to keep to time. If you see your audience glancing at their watches this is a
sure sign that you are talking for too long.
Try to end your talk on a positive note, perhaps including a word of thanks to your
audience for their attention.
Use of Data projectors and Computers
At conferences all speakers present talks aided by a computer linked to a data projector. A talk
using such facilities can be very effective because it is possible to combine images (still and
video) and text, but it can also be disastrous if:
you are not fully familiar with the use of the software package;
the computer and data projector are not set up correctly and in advance of the talk;
and if the computer crashes (ensure that you have a back-up e.g. CD or DVD or even on
overhead transparencies);
you include too many ‘special effects’ in your presentation.
There are also some very common errors made with such presentations. It is recommended that
when delivering a talk using a computer and data projector:
keep the slides simple with as few gimmicks as possible (e.g. lots of unnecessary and
variable animated features). These will only distract and possibly irritate your audience.
Remember you are providing your audience with scientific information and not a display
of the capabilities of a software package.
do not put the entire text of your talk on screen and then read it. Powerpoint slides should
support your talk and contain summary points, simple tables, graphs or pictures only.

32
settle on one colour scheme for all of the slides. These colours should enable any text to
be read easily. A dark blue background with white or yellow text works very well.
Similarly a white background with dark text also works.
Avoid a combination of red and green. People who are colour bind will not be able to
read your slides.
Dress
Presentation of a research talk was once a very formal occasion and speakers dressed
accordingly. Except for special talks, these days many speakers tend to dress more casually.
Casual dress, however, does not mean that you should dress as if you were about to spend the day
at the beach. At least make sure that you appear before your audience neatly dressed. This tells
your audience that you are taking the talk seriously. You are also showing your audience some
respect. Send the wrong message to the audience via your appearance, and you may be in for a
hard question time!
Nervousness
Even experienced speakers get nervous before a talk. You should therefore not worry about some
adrenalin in the system, because this means you are ready. Nevertheless nervousness can be
minimized by being well prepared. Beware of nervous habits e.g. jingling of keys or loose change
in your pockets, excessive pacing in front of the audience, mumbling, and punctuating or ending
your sentences with words such as ‘OK’, ‘right’, ‘err’, ‘umm’. All these, and other, habits are
very distracting to the audience.