A Bow Echo and Severe Weather Associated with a Kona Low ...On 2 November 1995 a kona low formed to...
16
576 VOLUME 13 WEATHER AND FORECASTING q 1998 American Meteorological Society A Bow Echo and Severe Weather Associated with a Kona Low in Hawaii STEVEN BUSINGER AND THOMAS BIRCHARD JR. University of Hawaii, Honolulu, Hawaii KEVIN KODAMA* Joint Institute for Marine and Atmospheric Research, Honolulu, Hawaii PAUL A. JENDROWSKI National Weather Service Forecast Office, Honolulu, Hawaii JIAN-JIAN WANG 1 UCAR COMET Outreach Program, Boulder, Colorado (Manuscript received 23 April 1997, in final form 21 November 1997) ABSTRACT On 2 November 1995 a kona low formed to the northwest of Hawaii. During the following 48 h a series of convective rainbands developed on the southeastern side of the low as it slowly moved eastward. On the afternoon of 3 November 1995 Hawaiian standard time (HST), a bow-echo signature was identified in the reflectivity observations from the recently installed WSR-88D located on the south shore of Kauai, and led to the first severe thunderstorm warning ever issued by the National Weather Service Forecast Office in Honolulu, Hawaii. Subsequent to the warning, winds of 40 m s 21 (80 kt) were observed at Nawiliwili Harbor on the southeast side of Kauai. The goals of this paper were to (i) document, within the constraints of the observational data, the synoptic and mesoscale environment associated with the formation of the bow echo and severe weather in Hawaii and contrast them with investigations of similar phenomena in the midlatitudes and Tropics, and (ii) provide a discussion of the implications of the availability of data from the new WSR-88D radars in Hawaii to operational forecasting of severe weather in the central Pacific. 1. Introduction Despite its reputation for benign tranquillity, punc- tuated only by brief tropical showers, the atmosphere over Hawaii can produce surprisingly violent storms. This is a fact that did not escape the islands’ earliest inhabitants and is much on the minds of operational forecasters working in the Pacific region (Kodama and Businger 1998, this issue): Coming is the dark cloud and the rainbow; Wildly comes the rain and the wind; *Current affiliation: National Weather Service Forecast Office, Ho- nolulu, HI. 1 Current affiliation: Department of Atmospheric Sciences, Uni- versity of Illinois at Champaign–Urbana, Urbana, Illinois. Corresponding author address: Dr. Steven Businger, Department of Meteorology, University of Hawaii, 2525 Correa Rd., Honolulu, HI 96822. E-mail: [email protected] Whirlwinds sweep over the earth; Rolling down are the rocks of the ravines; The red mountain-streams are rushing to the sea. Here are the waterspouts; Tumbled about are the clustering clouds of heaven; Gushing forth are the springs of the mountains. [ancient Hawaiian chant describing kona low; Fornander (1996)] Most notable of these violent storms are hurricanes such as Iniki in 1992. However, from October to April, extratropical weather systems can propagate sufficiently equatorward to substantially alter the dominant, stable trade wind pattern in the vicinity of the Hawaiian Is- lands. 1 Among these synoptic-scale disturbances is a class of subtropical cyclones known as kona 2 low pres- sure systems that can produce a wide range of weather 1 The Hawaiian Islands range in latitude from ;198 to 228N, and mean temperatures in summer and winter differ by only a few degrees. 2 Kona is Hawaiian for leeward, with respect to the usual NE trade wind flow.
Transcript of A Bow Echo and Severe Weather Associated with a Kona Low ...On 2 November 1995 a kona low formed to...

576 VOLUME 13W E A T H E R A N D F O R E C A S T I N G
q 1998 American Meteorological Society
A Bow Echo and Severe Weather Associated with a Kona Low in Hawaii
STEVEN BUSINGER AND THOMAS BIRCHARD JR.
University of Hawaii, Honolulu, Hawaii
KEVIN KODAMA*
Joint Institute for Marine and Atmospheric Research, Honolulu, Hawaii
PAUL A. JENDROWSKI
National Weather Service Forecast Office, Honolulu, Hawaii
JIAN-JIAN WANG1
UCAR COMET Outreach Program, Boulder, Colorado
(Manuscript received 23 April 1997, in final form 21 November 1997)
ABSTRACT
On 2 November 1995 a kona low formed to the northwest of Hawaii. During the following 48 h a series ofconvective rainbands developed on the southeastern side of the low as it slowly moved eastward. On the afternoonof 3 November 1995 Hawaiian standard time (HST), a bow-echo signature was identified in the reflectivityobservations from the recently installed WSR-88D located on the south shore of Kauai, and led to the firstsevere thunderstorm warning ever issued by the National Weather Service Forecast Office in Honolulu, Hawaii.Subsequent to the warning, winds of 40 m s21 (80 kt) were observed at Nawiliwili Harbor on the southeast sideof Kauai. The goals of this paper were to (i) document, within the constraints of the observational data, thesynoptic and mesoscale environment associated with the formation of the bow echo and severe weather in Hawaiiand contrast them with investigations of similar phenomena in the midlatitudes and Tropics, and (ii) provide adiscussion of the implications of the availability of data from the new WSR-88D radars in Hawaii to operationalforecasting of severe weather in the central Pacific.
1. Introduction
Despite its reputation for benign tranquillity, punc-tuated only by brief tropical showers, the atmosphereover Hawaii can produce surprisingly violent storms.This is a fact that did not escape the islands’ earliestinhabitants and is much on the minds of operationalforecasters working in the Pacific region (Kodama andBusinger 1998, this issue):
Coming is the dark cloud and the rainbow;Wildly comes the rain and the wind;
*Current affiliation: National Weather Service Forecast Office, Ho-nolulu, HI.
1Current affiliation: Department of Atmospheric Sciences, Uni-versity of Illinois at Champaign–Urbana, Urbana, Illinois.
Corresponding author address: Dr. Steven Businger, Departmentof Meteorology, University of Hawaii, 2525 Correa Rd., Honolulu,HI 96822.E-mail: [email protected]
Whirlwinds sweep over the earth;Rolling down are the rocks of the ravines;The red mountain-streams are rushing to the sea.
Here are the waterspouts;Tumbled about are the clustering clouds of heaven;Gushing forth are the springs of the mountains.
[ancient Hawaiian chant describing kona low;Fornander (1996)]
Most notable of these violent storms are hurricanessuch as Iniki in 1992. However, from October to April,extratropical weather systems can propagate sufficientlyequatorward to substantially alter the dominant, stabletrade wind pattern in the vicinity of the Hawaiian Is-lands.1 Among these synoptic-scale disturbances is aclass of subtropical cyclones known as kona2 low pres-sure systems that can produce a wide range of weather
1 The Hawaiian Islands range in latitude from ;198 to 228N, andmean temperatures in summer and winter differ by only a few degrees.
2 Kona is Hawaiian for leeward, with respect to the usual NE tradewind flow.
SEPTEMBER 1998 577B U S I N G E R E T A L .
hazards, including heavy rains, hailstorms, flash floods,landslides, high winds, large surf and swell, water-spouts, and in the case that is the subject of this paper,severe thunderstorms (Simpson 1952; Ramage 1962;Schroeder 1977a,b; Kodama and Barnes 1997; Ramage1995).
Most kona lows form from extratropical cyclones thatbecome secluded at lower latitudes by the blocking ac-tion of a warm high. Less frequently, kona lows developfrom cutoff mid- and upper-tropospheric cold-core lowsthat extend their circulations to the surface. In both theseinstances the cold low aloft draws on sources of coldvorticity-rich air from higher latitudes. Kona lows tendto track in slow and erratic loops, resulting in a periodof weather characterized by moist south/southwesterlyflow and rain squalls, with episodes of high winds andflooding over the Hawaiian Islands that can last for aweek or more. A significant fraction of the annual totalrainfall on the kona or southwest-facing slopes of theislands can be attributed to the occurrence of a smallnumber of these subtropical lows.
On 2–4 November 1995, a kona low evolved froman occluded wave cyclone and spawned a series ofsquall lines as it approached the Hawaiian Islands fromthe northwest. As one of these convective bands ap-proached the island of Kauai, it exhibited a pronouncedbow-echo structure (Nolen 1959; Fujita 1978) in re-flectivity observations with the recently installed Weath-er Surveillance Radar-1988 Doppler (WSR-88D) radarlocated on the south side of the island of Kauai. Rec-ognition of the implications of the radar data led to theissuance of a severe thunderstorm warning, the first suchwarning ever issued by the National Weather ServiceForecast Office in Honolulu, Hawaii (WFSO HNL) (seeappendix A). Subsequent to the warning, winds of 40m s21 (80 kt) were observed at Nawiliwili Harbor onthe southeast side of Kauai and convective-scale windgusts tore the roof off the Nawiliwili Small Boat Harboroffice and knocked down trees and power lines acrossportions of south and east Kauai. Radar in this caseprovided critical lead time for the issuance of a severethunderstorm warning that was subsequently verifiedand provides the data for the mesoscale postanalysispresented here.
The idealized evolution of an isolated, or single-celltype, bow echo is described by Fujita (1978). Duringthe most intense phase, the center of the bow forms aspearhead, with cyclonic and anticyclonic rotation at theends of the bow. Rear inflow notches along the trailingedge of the line segment usually indicate where thestrongest downburst winds are located. Rear inflownotches are a result of rear inflow jets that appear toform bow echoes by differentially advecting a part ofthe squall line or thunderstorm cell forward, and byentraining dry, lower ue air into the rear flank, whichthen erodes the back side of the advancing bow echothrough the evaporation of hydrometeors.
Observational studies and numerical simulations have
been utilized to determine the dynamics of rear inflowsthat characterize bow-echo mesoconvection in midlati-tudes (Lee et al. 1992; Weisman 1992, 1993; Johns1993; Skamarock et al. 1994; Przybylinski 1995; Knupp1996; among others). Johns and Hirt (1987) observedthat bow echoes associated with widespread damagingwinds (derechos) east of the Rocky Mountains can occurwith either strong, migrating low pressure systems(called the ‘‘dynamic’’ pattern) or with weather patternsexhibiting relatively weak synoptic-scale features(called the ‘‘warm season’’ pattern). Moreover, Johns(1993) noted that individual bow echoes and bowingline segments can form in a wide variety of synopticenvironments.
There have also been a considerable number of ob-servational and numerical modeling studies of tropicalsquall lines (Aspliden et al. 1976; Houze 1977; Zipser1977; Barnes and Sieckman 1984; Chong et al. 1987;Nicholls 1987; Roux and Ju 1990; Keenan and Carbone1992; Trier et al. 1996, 1997; Jorgensen et al. 1997).The majority of tropical squall lines studied propagatefrom east to west, and those exhibiting greater low-levelwind shear tend to propagate faster than those withweaker wind shear (Barnes and Sieckman 1984). Themajority of midlatitude squall lines propagate from westto east consistent with the prevailing low-level windsin the midlatitude and tropical latitude belts.
The growth, intensity, and dynamics of tropical andmidlatitude squall lines have been related to environ-mental thermodynamic instability and vertical shear ofthe horizontal winds in the lower troposphere (e.g.,Weisman and Klemp 1982; Barnes and Sieckman 1984).The observation of a variety of organized mesoscaleconvective systems has led to a classification methodthat relates storm severity to the bulk Richardson num-ber (Ri 5 B/0.5U 2, where B is the buoyant energy inthe storm’s environment and U is a measure of the ver-tical wind shear). The combination of higher convectiveavailable potential energy (CAPE) and shear values isassociated with midlatitude supercells and tornadicstorms, whereas tropical squall lines typically exhibitlower CAPE and shear values (Keenan and Carbone1992).
A squall line over the western tropical Pacific Oceandocumented by Jorgensen et al. (1997) moved west toeast and exhibited a bow-shaped radar reflectivity struc-ture. A mesoscale vortex developed as the reflectivitysignature became increasingly bow shaped. The asso-ciated CAPE value in their case was ;1500 J kg21 andthe environmental hodograph showed a 12 m s21 west-erly jet at ;2 km, with little directional shear up to ;5km. A recent paper by Alfonso and Naranjo (1996) de-scribes a serial bow echo, or derecho, that formed in abaroclinic environment of a midlatitude low pressuresystem that affected Cuba, demonstrating the penetra-tion of an essentially midlatitude phenomena to sub-tropical latitudes. This paper provides the first docu-mentation of a bow echo in association with a subtrop-
578 VOLUME 13W E A T H E R A N D F O R E C A S T I N G
ical or kona low, in an ocean environment far removedfrom continental landmasses.
The goals of this paper are to discuss the implicationsof the availability of data from the new WSR-88D radarsin Hawaii to operational forecasting of severe weatherin the central Pacific and to document, within the con-straints of the observational data, the synoptic and me-soscale environment associated with the formation ofthe Hawaiian bow echo.
2. Synoptic setting
It is always challenging to accurately analyze the lo-cation and intensity of storm systems over the centralPacific Ocean because of the lack of in situ data. Upper-air analyses (Fig. 1) are based on the initialization ofthe Aviation (AVN) run of the Global Spectral Model(GSM) and have the benefit of the prior informationcontent of the model and aircraft and satellite data inputover the ocean. Surface analyses (Fig. 2) include alloperationally available and archived ship-based obser-vations obtained from the National Climatic Data Cen-ter. Critical sounding data from Lihue, Kauai, on theday of the bow echo are missing due to a lightning strikeat the radiosonde release site. The last available sound-ing was for 0000 UTC on 3 November 1995, whereasthe bow echo formed at ;0200 UTC on 4 November1995. Therefore, in the vicinity of the bow echo, outputfrom the National Centers for Environmental Predic-tion’s Regional Spectral Model (RSM) (Juang and Kana-mitsu 1994) are utilized to infer some meso-alpha-scalefeatures associated with the bow-echo environment. TheRSM output utilized in this paper is based on the firstnest of the model, with 25-km resolution. Wang et al.(1998, in this issue) describe in detail the operational3
and case study use of the RSM in Hawaii and provideadditional documentation of the RSM simulation of thisbow echo case. The RSM simulation did produce abanded maximum in the rainfall just west of Kauai(Wang et al. 1998, Fig. 6b), generally consistent withradar data. However, the RSM did not capture mesoscaledetails of the bow-echo development; thus, only thosemodel structures that are generally consistent with otherdata sources (satellite and radar) are cautiously pre-sented in this section.
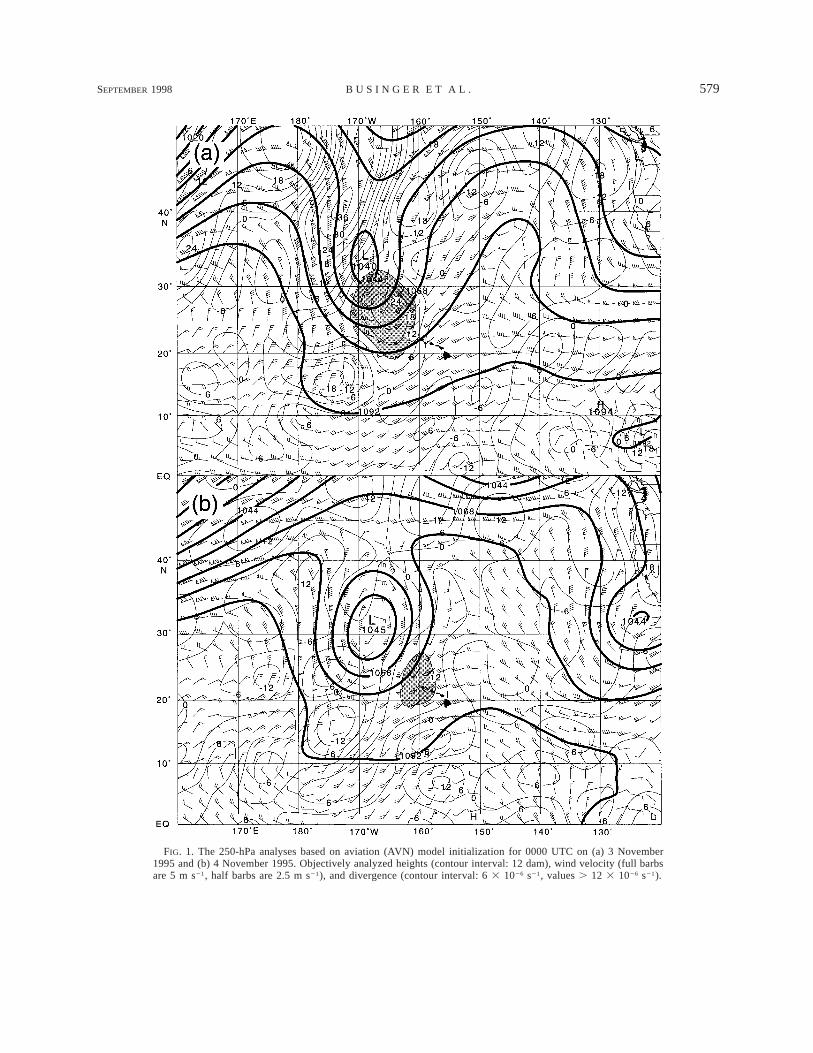
The kona low developed from a wave cyclone on 2November 1995. As the wave cyclone occluded, highpressure to the west moved northeastward, secludingthe storm from the westerlies and the source of cold airto the north. At 0000 UTC 3 November 1995, a high-amplitude, cold-core low is seen in the 250-hPa analysisalong 1708W longitude (Fig. 1a). A region of enhanceddivergence aloft can be seen northwest of the islands.
3 The RSM forecasts output at 10-km resolution and through 72 hbecame operationally available at the WSFO HNL in the summer of1997.
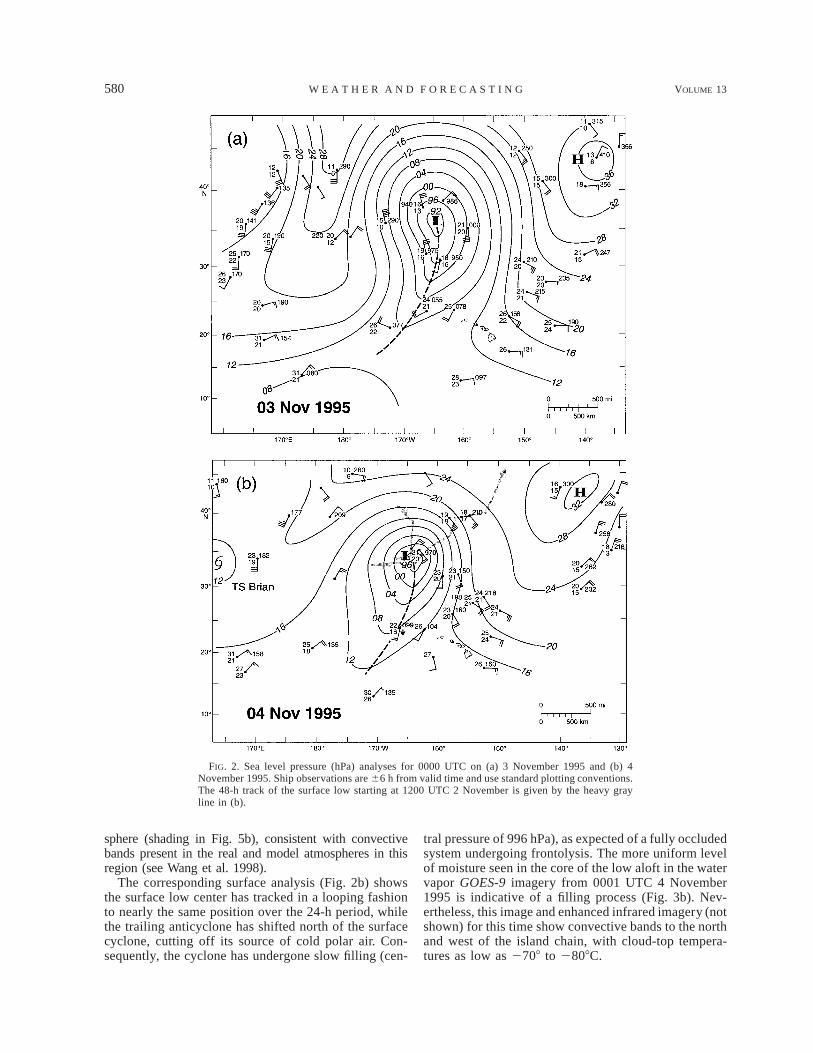
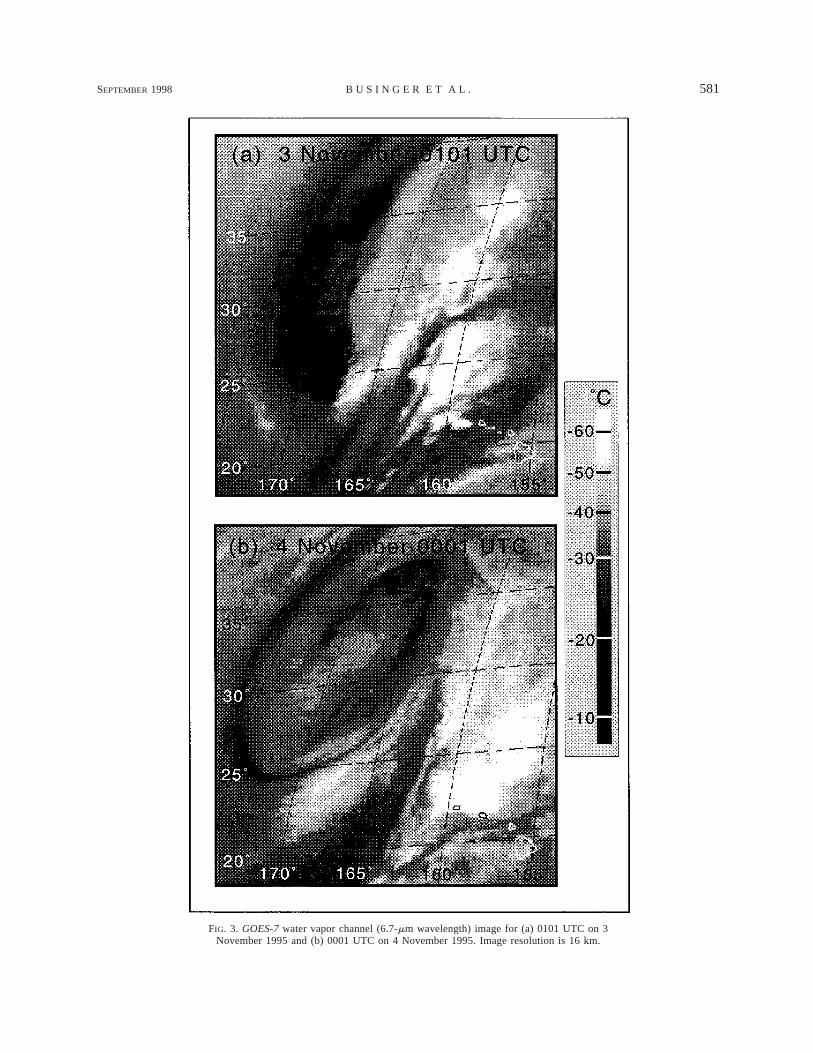
A short-wave–jet streak with winds of 70 m s21 on thewest side of the trough axis aloft (Fig. 1a) causes thetrough to propagate equatorward and increases upper-level divergence over the Hawaiian Islands during theensuing 24 h (Fig. 1b). A region of subsiding, dry airis seen in the GOES-9 water vapor imagery for 0101UTC 3 November on the west side of the cold low aloft(Fig. 3a). In the southeast quadrant of the kona low,alternating bands of dry and moist air with convectiveanvils are seen in the water vapor image (Fig. 3a), andcold cloud tops (#2708C) associated with the anvilsfrom bands of convective thunderstorms are present ininfrared imagery at the same time (not shown). The sealevel pressure analysis for 0000 UTC 3 Novembershows a 989-hPa cyclone center near 368N and 1648W(Fig. 2a). On the southeast side of the low, confluentinflow feeds moist air into the low, whereas on thesouthwest side of the low the airflow is diffluent. Thetrailing anticyclone, with a central pressure of 1032 hPa,is located near 478N and 1778E and is tracking north-eastward.
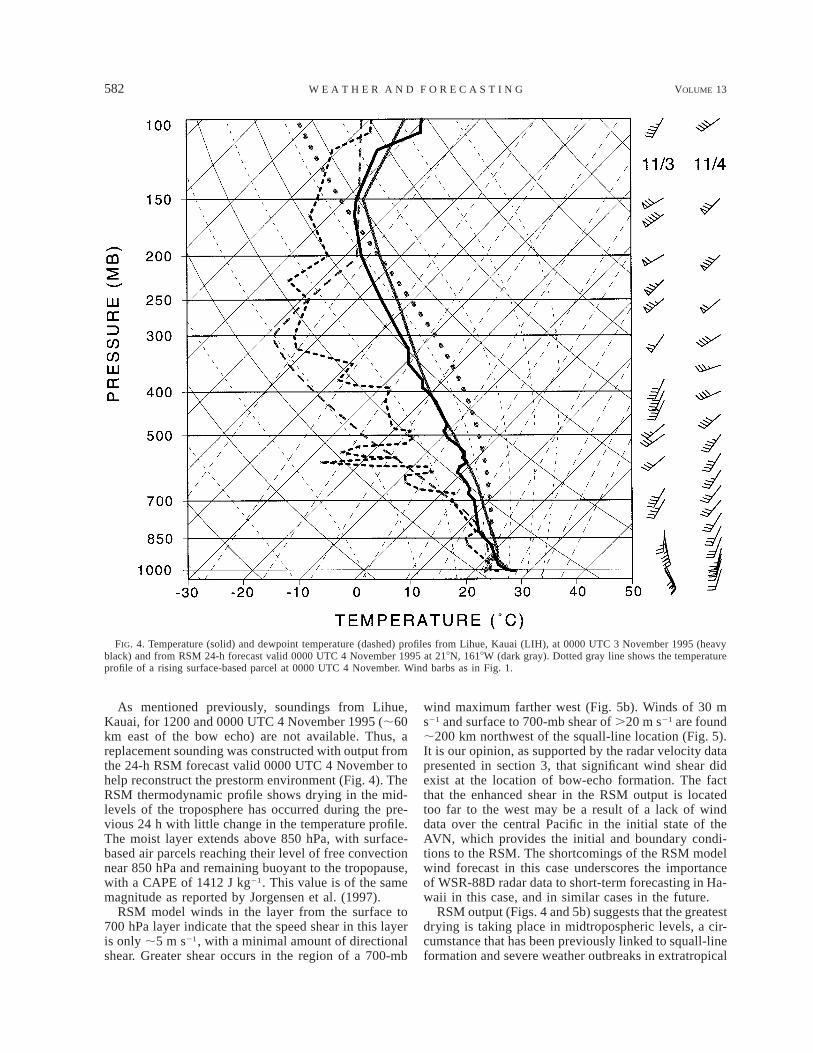
The atmospheric sounding from Lihue, Kauai, at 0000UTC 3 November 1995 (Fig. 4) is moist and unstable,with a lifted index of 25 and CAPE of 2364 J kg21.The vertical wind profile shows veering and consider-able low-level vertical shear of the horizontal winds.The surface to 700-hPa layer vertical shear is ;5 31023 s21, with a bulk Richardson number of ;50. No-tably absent from the sounding is the typical trade windinversion, normally present between 2.0 and 2.5 kmabove sea level (Grindinger 1992). Although severeweather was not observed in the Hawaiian Islands on3 November (UTC), heavy rainfall did occur over theisland of Kauai, with 24-h rainfall totals as high as 263mm (.10 in.).
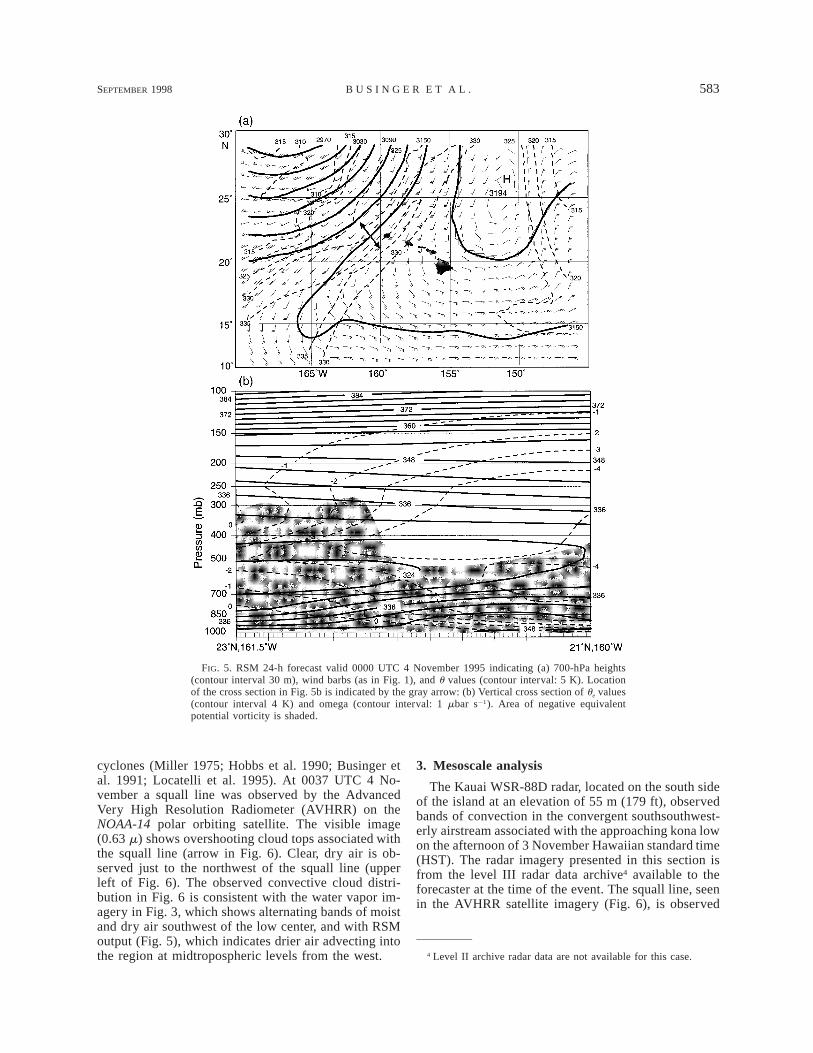
By 0000 UTC 4 November 1995, the cold low at 250hPa (Fig. 1b) is cut off from the main belt of the polarwesterlies and enhanced upper-tropospheric divergence ispresent over the northwesternmost islands of Kauai andOahu. The RSM 24-h forecast for 700 hPa valid at thistime shows a jet of 27 m s21 (55 kt) and cold/dry airadvection to the west of the island of Kauai (Fig. 5a).These model features are not inconsistent with dynamicforcing associated with the jet entrance region aloft overthis region (Fig. 1b) (Uccellini and Johnson 1979). Thewater vapor image for 0001 UTC on 4 November showsa woundup system with ribbons of moist and dry air en-circling each other in the secluded core of the cold lowaloft (Fig. 3b). On the southeast side of the kona low afinger of markedly drier air is penetrating northeastwardjust to the west of the anvil outflow associated with thebow-echo squall line. A minimum in ue at midlevels inthe model atmosphere (Fig. 5b) is consistent with midleveladvection of cooler, drier air. Anticyclonic shear associatedwith the approaching kona low circulation contributes tothe presence of conditional symmetric instability (Emanuel1983; Hoskins et al. 1985) up to 300 mb across the north-west side of the cross section of the RSM model atmo-
SEPTEMBER 1998 579B U S I N G E R E T A L .
FIG. 1. The 250-hPa analyses based on aviation (AVN) model initialization for 0000 UTC on (a) 3 November1995 and (b) 4 November 1995. Objectively analyzed heights (contour interval: 12 dam), wind velocity (full barbsare 5 m s21, half barbs are 2.5 m s21), and divergence (contour interval: 6 3 1026 s21, values . 12 3 1026 s21).
580 VOLUME 13W E A T H E R A N D F O R E C A S T I N G
FIG. 2. Sea level pressure (hPa) analyses for 0000 UTC on (a) 3 November 1995 and (b) 4November 1995. Ship observations are 66 h from valid time and use standard plotting conventions.The 48-h track of the surface low starting at 1200 UTC 2 November is given by the heavy grayline in (b).
sphere (shading in Fig. 5b), consistent with convectivebands present in the real and model atmospheres in thisregion (see Wang et al. 1998).
The corresponding surface analysis (Fig. 2b) showsthe surface low center has tracked in a looping fashionto nearly the same position over the 24-h period, whilethe trailing anticyclone has shifted north of the surfacecyclone, cutting off its source of cold polar air. Con-sequently, the cyclone has undergone slow filling (cen-
tral pressure of 996 hPa), as expected of a fully occludedsystem undergoing frontolysis. The more uniform levelof moisture seen in the core of the low aloft in the watervapor GOES-9 imagery from 0001 UTC 4 November1995 is indicative of a filling process (Fig. 3b). Nev-ertheless, this image and enhanced infrared imagery (notshown) for this time show convective bands to the northand west of the island chain, with cloud-top tempera-tures as low as 2708 to 2808C.
SEPTEMBER 1998 581B U S I N G E R E T A L .
FIG. 3. GOES-7 water vapor channel (6.7-mm wavelength) image for (a) 0101 UTC on 3November 1995 and (b) 0001 UTC on 4 November 1995. Image resolution is 16 km.
582 VOLUME 13W E A T H E R A N D F O R E C A S T I N G
FIG. 4. Temperature (solid) and dewpoint temperature (dashed) profiles from Lihue, Kauai (LIH), at 0000 UTC 3 November 1995 (heavyblack) and from RSM 24-h forecast valid 0000 UTC 4 November 1995 at 218N, 1618W (dark gray). Dotted gray line shows the temperatureprofile of a rising surface-based parcel at 0000 UTC 4 November. Wind barbs as in Fig. 1.
As mentioned previously, soundings from Lihue,Kauai, for 1200 and 0000 UTC 4 November 1995 (;60km east of the bow echo) are not available. Thus, areplacement sounding was constructed with output fromthe 24-h RSM forecast valid 0000 UTC 4 November tohelp reconstruct the prestorm environment (Fig. 4). TheRSM thermodynamic profile shows drying in the mid-levels of the troposphere has occurred during the pre-vious 24 h with little change in the temperature profile.The moist layer extends above 850 hPa, with surface-based air parcels reaching their level of free convectionnear 850 hPa and remaining buoyant to the tropopause,with a CAPE of 1412 J kg21. This value is of the samemagnitude as reported by Jorgensen et al. (1997).
RSM model winds in the layer from the surface to700 hPa layer indicate that the speed shear in this layeris only ;5 m s21, with a minimal amount of directionalshear. Greater shear occurs in the region of a 700-mb
wind maximum farther west (Fig. 5b). Winds of 30 ms21 and surface to 700-mb shear of .20 m s21 are found;200 km northwest of the squall-line location (Fig. 5).It is our opinion, as supported by the radar velocity datapresented in section 3, that significant wind shear didexist at the location of bow-echo formation. The factthat the enhanced shear in the RSM output is locatedtoo far to the west may be a result of a lack of winddata over the central Pacific in the initial state of theAVN, which provides the initial and boundary condi-tions to the RSM. The shortcomings of the RSM modelwind forecast in this case underscores the importanceof WSR-88D radar data to short-term forecasting in Ha-waii in this case, and in similar cases in the future.
RSM output (Figs. 4 and 5b) suggests that the greatestdrying is taking place in midtropospheric levels, a cir-cumstance that has been previously linked to squall-lineformation and severe weather outbreaks in extratropical
SEPTEMBER 1998 583B U S I N G E R E T A L .
FIG. 5. RSM 24-h forecast valid 0000 UTC 4 November 1995 indicating (a) 700-hPa heights(contour interval 30 m), wind barbs (as in Fig. 1), and u values (contour interval: 5 K). Locationof the cross section in Fig. 5b is indicated by the gray arrow: (b) Vertical cross section of ue values(contour interval 4 K) and omega (contour interval: 1 mbar s21). Area of negative equivalentpotential vorticity is shaded.
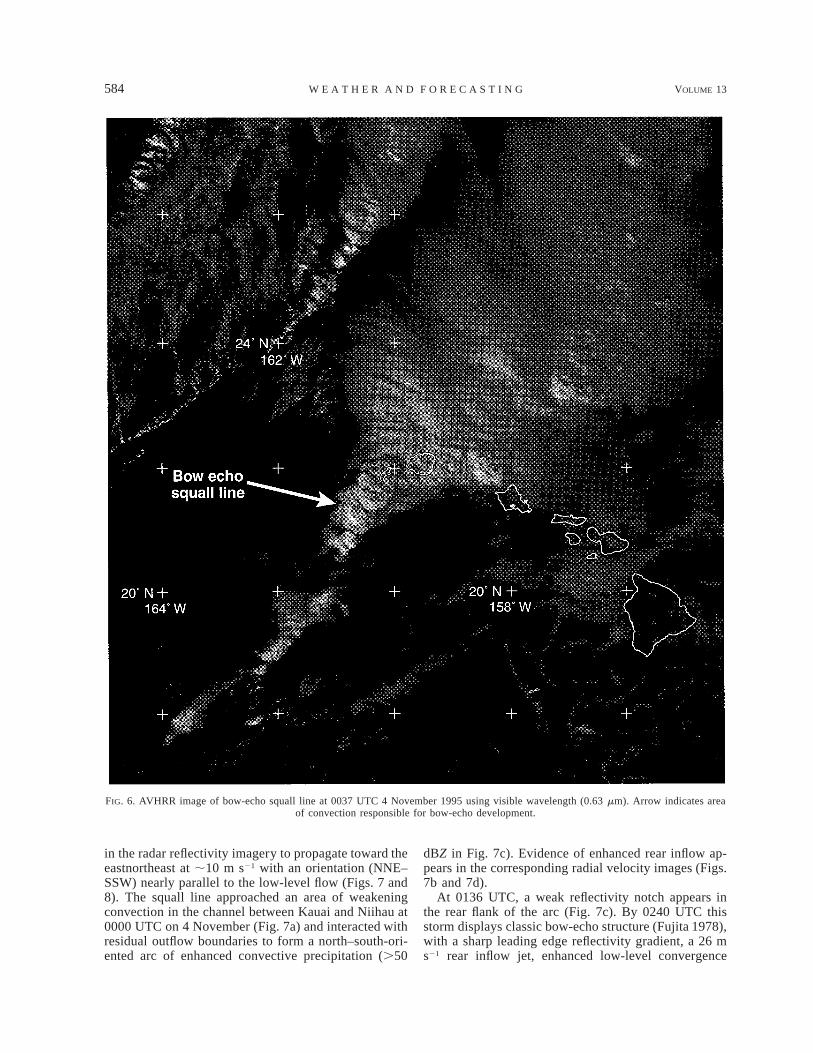
cyclones (Miller 1975; Hobbs et al. 1990; Businger etal. 1991; Locatelli et al. 1995). At 0037 UTC 4 No-vember a squall line was observed by the AdvancedVery High Resolution Radiometer (AVHRR) on theNOAA-14 polar orbiting satellite. The visible image(0.63 m) shows overshooting cloud tops associated withthe squall line (arrow in Fig. 6). Clear, dry air is ob-served just to the northwest of the squall line (upperleft of Fig. 6). The observed convective cloud distri-bution in Fig. 6 is consistent with the water vapor im-agery in Fig. 3, which shows alternating bands of moistand dry air southwest of the low center, and with RSMoutput (Fig. 5), which indicates drier air advecting intothe region at midtropospheric levels from the west.
3. Mesoscale analysis
The Kauai WSR-88D radar, located on the south sideof the island at an elevation of 55 m (179 ft), observedbands of convection in the convergent southsouthwest-erly airstream associated with the approaching kona lowon the afternoon of 3 November Hawaiian standard time(HST). The radar imagery presented in this section isfrom the level III radar data archive4 available to theforecaster at the time of the event. The squall line, seenin the AVHRR satellite imagery (Fig. 6), is observed
4 Level II archive radar data are not available for this case.
584 VOLUME 13W E A T H E R A N D F O R E C A S T I N G
FIG. 6. AVHRR image of bow-echo squall line at 0037 UTC 4 November 1995 using visible wavelength (0.63 mm). Arrow indicates areaof convection responsible for bow-echo development.
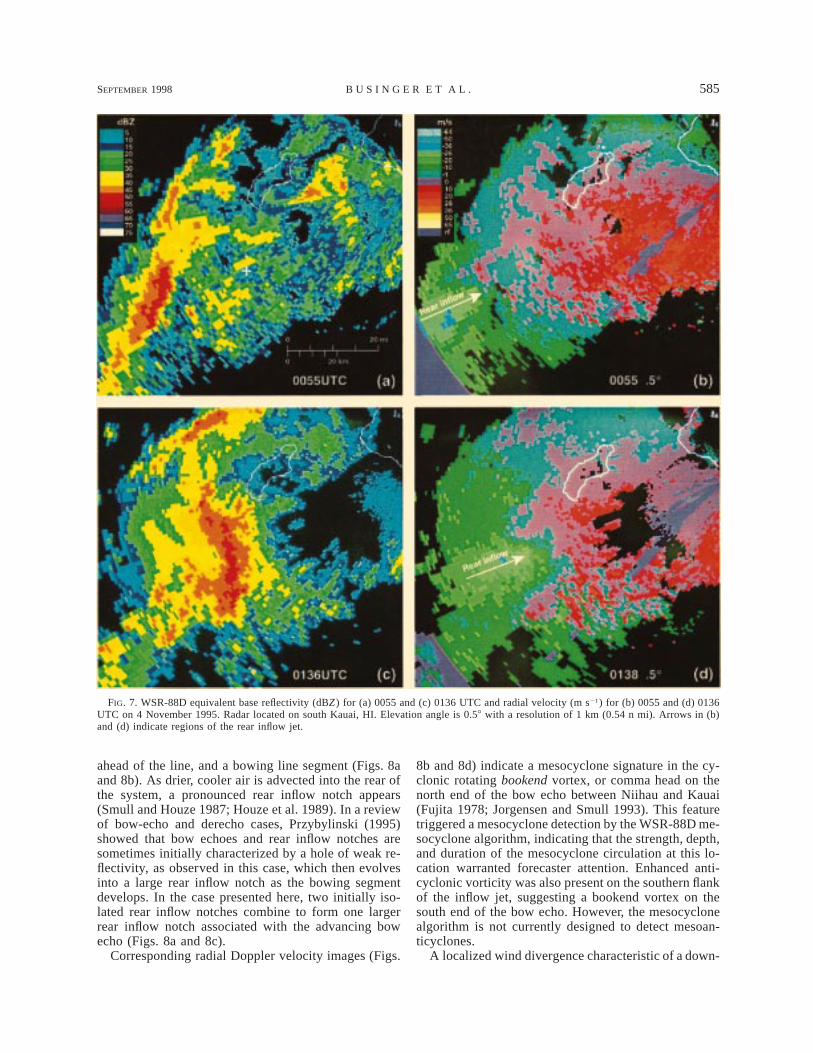
in the radar reflectivity imagery to propagate toward theeastnortheast at ;10 m s21 with an orientation (NNE–SSW) nearly parallel to the low-level flow (Figs. 7 and8). The squall line approached an area of weakeningconvection in the channel between Kauai and Niihau at0000 UTC on 4 November (Fig. 7a) and interacted withresidual outflow boundaries to form a north–south-ori-ented arc of enhanced convective precipitation (.50
dBZ in Fig. 7c). Evidence of enhanced rear inflow ap-pears in the corresponding radial velocity images (Figs.7b and 7d).
At 0136 UTC, a weak reflectivity notch appears inthe rear flank of the arc (Fig. 7c). By 0240 UTC thisstorm displays classic bow-echo structure (Fujita 1978),with a sharp leading edge reflectivity gradient, a 26 ms21 rear inflow jet, enhanced low-level convergence
SEPTEMBER 1998 585B U S I N G E R E T A L .
FIG. 7. WSR-88D equivalent base reflectivity (dBZ ) for (a) 0055 and (c) 0136 UTC and radial velocity (m s21) for (b) 0055 and (d) 0136UTC on 4 November 1995. Radar located on south Kauai, HI. Elevation angle is 0.58 with a resolution of 1 km (0.54 n mi). Arrows in (b)and (d) indicate regions of the rear inflow jet.
ahead of the line, and a bowing line segment (Figs. 8aand 8b). As drier, cooler air is advected into the rear ofthe system, a pronounced rear inflow notch appears(Smull and Houze 1987; Houze et al. 1989). In a reviewof bow-echo and derecho cases, Przybylinski (1995)showed that bow echoes and rear inflow notches aresometimes initially characterized by a hole of weak re-flectivity, as observed in this case, which then evolvesinto a large rear inflow notch as the bowing segmentdevelops. In the case presented here, two initially iso-lated rear inflow notches combine to form one largerrear inflow notch associated with the advancing bowecho (Figs. 8a and 8c).
Corresponding radial Doppler velocity images (Figs.
8b and 8d) indicate a mesocyclone signature in the cy-clonic rotating bookend vortex, or comma head on thenorth end of the bow echo between Niihau and Kauai(Fujita 1978; Jorgensen and Smull 1993). This featuretriggered a mesocyclone detection by the WSR-88D me-socyclone algorithm, indicating that the strength, depth,and duration of the mesocyclone circulation at this lo-cation warranted forecaster attention. Enhanced anti-cyclonic vorticity was also present on the southern flankof the inflow jet, suggesting a bookend vortex on thesouth end of the bow echo. However, the mesocyclonealgorithm is not currently designed to detect mesoan-ticyclones.
A localized wind divergence characteristic of a down-

586 VOLUME 13W E A T H E R A N D F O R E C A S T I N G
FIG. 8. WSR-88D equivalent base reflectivity (dBZ ) for (a) 0240 and (c) 0257 UTC and radial velocity (m s21) for (b) 0240 and (d) 0257UTC on 4 November 1995. Radar located on south Kauai, HI. Elevation angle is 1.58 with a resolution of 1 km (0.54 n mi). Line A–B in(a) indicates the location of the range–height cross section in Fig. 10. Arrows in (b) and (d) indicate regions of the rear inflow jet.
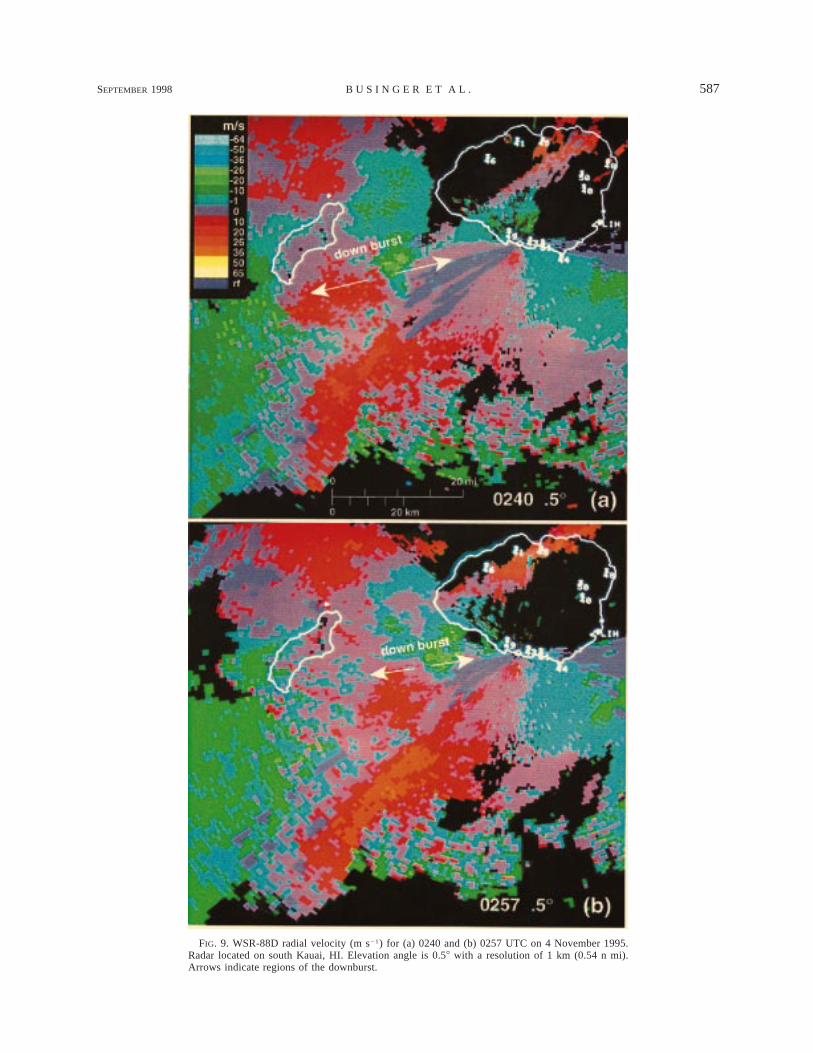
burst is seen in the radar radial wind field just south ofthe mesocyclone in the lowest (0.58) elevation angle dataat 0240 UTC (Fig. 9a). This feature appears again inthe radar data for 0257 UTC, indicating a coherent eventof some duration.
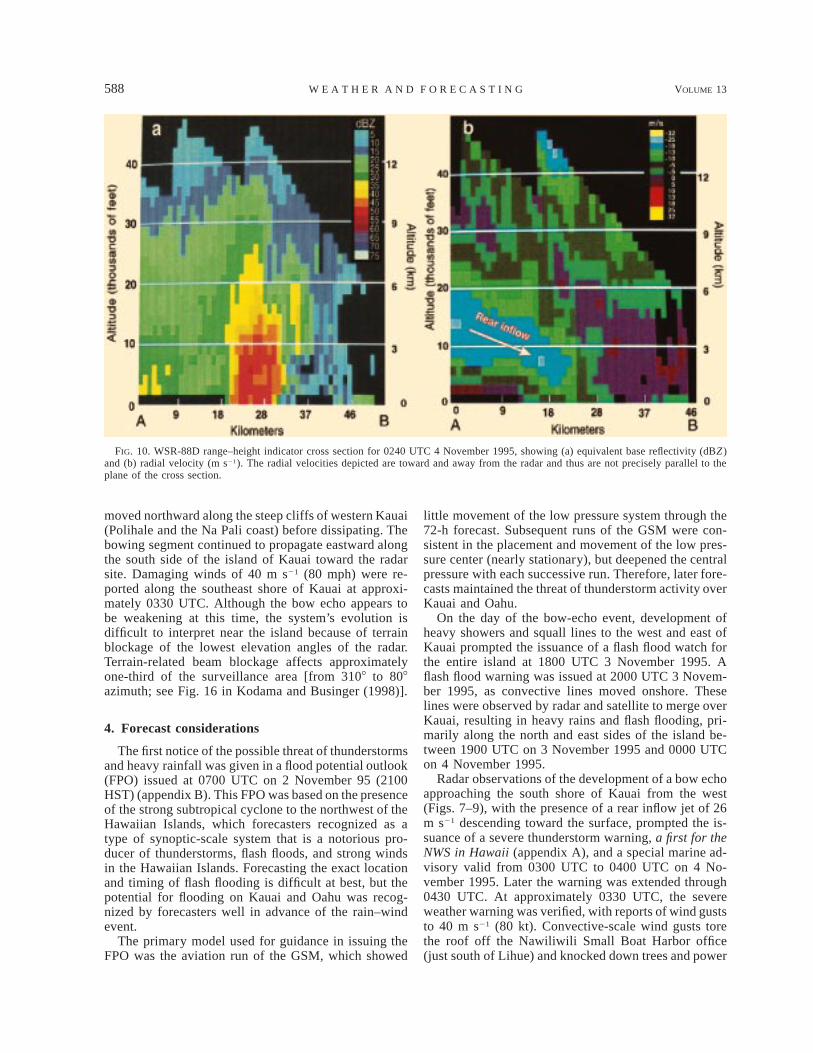
A reflectivity cross section taken through the bowingportion of the line at 0240 UTC (Fig. 10a) indicates thun-derstorm tops reaching .13.5 km (45 000 ft). The strong-est returns are located below the freezing level at a heightof ;3.5 km (;12 000 ft), typical of tropical oceanic con-vective clouds that have been associated with relativelyweak updrafts (Jorgensen and LeMone 1989), in contrastto those found in midlatitude continental convective cells(Houze et al. 1989; Zipser and Lutz 1994).
Figure 10b shows a cross section of the radial velocityrelative to the radar taken through the bowing portionof the line at 0240 UTC and documents a 26 m s21 (52kt) jet descending from the rear of the system towardthe location of the downburst, confirming the rear inflowjet as its source. Small radial velocities ahead of theline suggest the flow here is from the south-southeast,roughly at right angles to the radar beam. The leadingedge of the bow echo was propagating at ;24 m s21
toward the radar at this time. Low-level convergence inthe plane of the cross section near the leading edge ofthe band is ;4 3 1023 s21.
As the bow echo approached Kauai, the comma headportion broke away from the main bowing segment and
SEPTEMBER 1998 587B U S I N G E R E T A L .
FIG. 9. WSR-88D radial velocity (m s21) for (a) 0240 and (b) 0257 UTC on 4 November 1995.Radar located on south Kauai, HI. Elevation angle is 0.58 with a resolution of 1 km (0.54 n mi).Arrows indicate regions of the downburst.
588 VOLUME 13W E A T H E R A N D F O R E C A S T I N G
FIG. 10. WSR-88D range–height indicator cross section for 0240 UTC 4 November 1995, showing (a) equivalent base reflectivity (dBZ )and (b) radial velocity (m s21). The radial velocities depicted are toward and away from the radar and thus are not precisely parallel to theplane of the cross section.
moved northward along the steep cliffs of western Kauai(Polihale and the Na Pali coast) before dissipating. Thebowing segment continued to propagate eastward alongthe south side of the island of Kauai toward the radarsite. Damaging winds of 40 m s21 (80 mph) were re-ported along the southeast shore of Kauai at approxi-mately 0330 UTC. Although the bow echo appears tobe weakening at this time, the system’s evolution isdifficult to interpret near the island because of terrainblockage of the lowest elevation angles of the radar.Terrain-related beam blockage affects approximatelyone-third of the surveillance area [from 3108 to 808azimuth; see Fig. 16 in Kodama and Businger (1998)].
4. Forecast considerations
The first notice of the possible threat of thunderstormsand heavy rainfall was given in a flood potential outlook(FPO) issued at 0700 UTC on 2 November 95 (2100HST) (appendix B). This FPO was based on the presenceof the strong subtropical cyclone to the northwest of theHawaiian Islands, which forecasters recognized as atype of synoptic-scale system that is a notorious pro-ducer of thunderstorms, flash floods, and strong windsin the Hawaiian Islands. Forecasting the exact locationand timing of flash flooding is difficult at best, but thepotential for flooding on Kauai and Oahu was recog-nized by forecasters well in advance of the rain–windevent.
The primary model used for guidance in issuing theFPO was the aviation run of the GSM, which showed
little movement of the low pressure system through the72-h forecast. Subsequent runs of the GSM were con-sistent in the placement and movement of the low pres-sure center (nearly stationary), but deepened the centralpressure with each successive run. Therefore, later fore-casts maintained the threat of thunderstorm activity overKauai and Oahu.
On the day of the bow-echo event, development ofheavy showers and squall lines to the west and east ofKauai prompted the issuance of a flash flood watch forthe entire island at 1800 UTC 3 November 1995. Aflash flood warning was issued at 2000 UTC 3 Novem-ber 1995, as convective lines moved onshore. Theselines were observed by radar and satellite to merge overKauai, resulting in heavy rains and flash flooding, pri-marily along the north and east sides of the island be-tween 1900 UTC on 3 November 1995 and 0000 UTCon 4 November 1995.
Radar observations of the development of a bow echoapproaching the south shore of Kauai from the west(Figs. 7–9), with the presence of a rear inflow jet of 26m s21 descending toward the surface, prompted the is-suance of a severe thunderstorm warning, a first for theNWS in Hawaii (appendix A), and a special marine ad-visory valid from 0300 UTC to 0400 UTC on 4 No-vember 1995. Later the warning was extended through0430 UTC. At approximately 0330 UTC, the severeweather warning was verified, with reports of wind guststo 40 m s21 (80 kt). Convective-scale wind gusts torethe roof off the Nawiliwili Small Boat Harbor office(just south of Lihue) and knocked down trees and power
SEPTEMBER 1998 589B U S I N G E R E T A L .
lines across portions of south and east Kauai. Given themountainous character of Kauai, and the presence of aneast–west-oriented ridge on the south side of the harbor,flow enhancement by the terrain cannot be discountedas a potential contributor to the high winds observed atNawiliwili (e.g., Brinkmann 1974; Smith 1985; Masset al. 1995).
The severe thunderstorm warning was issued withsignificant lead time and verified. This kind of warningperformance would not have been possible without theWSR-88D observations. Although this is the first radar-documented case of severe weather in Hawaii, subse-quent radar observations of the tropical Hawaiian at-mosphere have confirmed that this was not an isolatedevent. In fact, several severe thunderstorm warningshave been issued for the Hawaiian Islands since theobservation of the bow echo, with the WSR-88D in-dicating thunderstorm cells with supercell characteris-tics (see Kodama and Businger 1998; Pfost and Gerard1997), and strong straight-line winds .25 m s21. Severeweather is not a recent development in Hawaiian weath-er; rather the WSR-88D allows meteorologists to ob-serve mesoscale phenomena that occur on temporal andspatial scales that are too small to be observed by thepreviously available observing platforms. The signifi-cance of the impact of the WSR-88D radar observationson severe weather forecasting in Hawaii should not beunderestimated. For example, the volume of air trafficin this tourist destination is considerable and particularlyvulnerable to the impact of severe wind shears such asthose documented in this case (e.g., Fujita and Byers1977).
5. Summary and conclusions
During the first week of November 1995, a subtrop-ical cyclone, or kona low, spawned a series of squalllines as it approached the Hawaiian islands from thenorthwest. As one of these convective bands approachedthe island of Kauai, it displayed pronounced bow-echostructure in reflectivity observations taken by a recentlyinstalled WSR-88D radar located on the south side ofthe island of Kauai. Recognition of the implications ofthe radar signatures led to the issuance of a severe thun-derstorm warning, the first such warning ever issued bythe National Weather Service Forecast Office in Ho-nolulu, Hawaii (appendix A). Subsequent to the warn-ing, winds of 40 m s21 (80 kt) were observed at Na-wiliwili Harbor on the southeast side of Kauai and con-vective-scale wind gusts tore the roof off the NawiliwiliSmall Boat Harbor office and knocked down trees andpower lines across portions of south and east Kauai.
The cold-core kona low developed as a product ofthe occlusion process of an extratropical wave cyclonethat became secluded at lower latitudes by the blockingaction of a warm high. A jet streak on the western sideof the cold low aloft on 3 November contributed to thefavorable dynamics at the time of squall-line formation
on 4 November. Observational data and model outputsuggest that these conditions include enhanced diver-gence and cyclonic shear aloft (Fig. 1b), the likely pres-ence of a wind maximum or jet (700 mb) resulting inenhanced midlevel advection of cool, dry air, and low-level wind shear, and a convergent southerly stream ofmoist, unstable air near the surface.
Output from the RSM 24-h forecast, currently avail-able operationally with 10-km resolution in the WSFO-HNL, did not correctly predict the magnitude of envi-ronmental wind shear present at the location of the bowecho. The fact that the enhanced shear in the RSM out-put was located too far to the west may be a result ofa lack of wind data over the central Pacific in the initialstate of the AVN, which provides the initial and bound-ary conditions to the RSM. The shortcomings of theRSM model wind forecast in this case underscore theimportance of WSR-88D radar data to short-term fore-casting in Hawaii in this and in similar cases at thistime.
By 0240 UTC on 4 November a classic bow-echostructure is seen in the radar reflectivity plan-positionindicators (Fig. 8), with a sharp leading edge reflectivitygradient, a 26 m s21 rear inflow jet with a pronouncedrear inflow notch, enhanced low-level convergenceahead of the line, and a bowing line segment. Radaranimation indicates counterrotating vortices on thenorthern and southern flanks of the bow echo, with amesocyclone signature detected by radar algorithms onthe north end of the bow echo.
The bow echo had a relatively short life span, com-pared to serial bow echoes modeled by Weisman (1992,1993). Radar observations suggest the rear inflow jetdescended rapidly to the ground and the convection-generated cold pool overwhelmed the ambient shear,resulting in short-lived, localized strong winds near thesurface. It is hypothesized that less than optimal verticalshear and instability prevented the development of alonger-lived serial bow echo. The impact of the complextopography cannot be discounted in the storm’s dissi-pation and the observed distribution of wind damage.These issues are the subject of further research.
The availability of WSR-88D data has increased theability to sample the subtropical atmosphere and hasprovided forecasters and researchers with new insightinto convective-scale phenomena near the Hawaiian Is-lands. Cases of mesoscale severe weather that weremissed by the coarsely spaced synoptic network in thepast have proven to be relatively common in radar ob-servations of the otherwise data-sparse region surround-ing the Hawaiian Islands.
Efforts are under way to use data derived from theWSR-88D radars, GOES-9 satellite, and Global Posi-tioning System receivers to enhance the initial state ofa high-resolution nonhydrostatic version of the RSM inHawaii (Wang et al. 1998). With the availability of datafrom geostationary and polar-orbiting satellites, GSMand RSM numerical output, and WSR-88D radar ob-
590 VOLUME 13W E A T H E R A N D F O R E C A S T I N G
servations, the tools forecasters have to increase theaccuracy of forecasts ranging from nowcasting to 48-htimescales are rapidly improving in the Pacific region.
Acknowledgments. The authors wish to extend theirthanks to Dr. Gary Barnes for drawing attention to thisunusual case and for his critical review of the manu-script. We also wish to thank John Porter for assistancewith satellite data processing and James Partain for hismotivation in shepherding the papers for the specialissue. The authors are indebted to Arnold Hori, TomSchroeder, Roger Pierce, Tom Heffner, Jim Weyman,and anonymous reviewers for their constructive contri-butions to this paper. This work has been supported byNOAA through the UCAR COMET Outreach Programunder Grants UCAR S94-43844 and UCAR S97-86992and the National Science Foundation through GrantATM-9496335, SOEST Contribution number 4652.
APPENDIX A
Severe Thunderstorm Bulletin
WOHW42 PHNL 040300HIZ002-040400-
BULLETIN - IMMEDIATE BROADCAST RE-QUESTED SEVERE THUNDERSTORM WARNINGAND SPECIAL MARINE ADVISORY NATIONALWEATHER SERVICE HONOLULU HI 500 PM HSTFRI NOV 3 1995
. . . THE NATIONAL WEATHER SERVICE HAS IS-SUED A SEVERE THUNDERSTORM WARNINGEFFECTIVE UNTIL 6 PM FOR THE ISLAND OFKAUAI AND THE ADJACENT COASTAL WATERS. . .
AT 445 PM RADAR INDICATES A STRONG THUN-DERSTORM JUST SOUTHWEST OF KAUAI MOV-ING NORTHEAST AT 25 MPH.
PERSONS ON KAUAI SHOULD BE READY FORSTRONG AND GUSTY WINDS FROM 50 TO 60MPH WITH THIS THUNDERSTORM AS IT MOVESINTO KAUAI. VERY HEAVY RAINS AND DAN-GEROUS LIGHTNING WILL LIKELY ACCOMPA-NY THIS THUNDERSTORM. BOATERS ON WA-TERS ADJACENT TO KAUAI SHOULD BE PRE-PARED FOR STRONG AND ERRATIC WINDSWITH LOCALLY HIGH SEAS.
NATIONAL WEATHER SERVICE HONOLULU
APPENDIX B
Flood Potential Outlook
FLOOD POTENTIAL OUTLOOKNATIONAL WEATHER SERVICE HONOLULU HI9 PM HST WED NOV 01 1995
. . . HEAVY SHOWERS AND THUNDERSHOWERSARE POSSIBLE OVER THE NEXT FEW DAYS ONALL ISLANDS . . .
THE WEATHER PATTERN IS DEVELOPING INTOONE THAT COULD PRODUCE HEAVY FLOODPRODUCING RAINS OVER THE HAWAIIAN IS-LANDS DURING THE NEXT FEW DAYS. THE IS-LANDS MOST EXPOSED TO THIS THREAT OFHEAVY SHOWERS AND THUNDERSTORMS AREKAUAI AND OAHU.
AN INTENSE LOW PRESSURE SYSTEM OFSTORM INTENSITY HAS DEVELOPED TO THENORTHWEST OF THE HAWAIIAN ISLANDSWHERE IT WILL REMAIN STATIONARY FOR ADAY OR TWO. THIS IS CAUSING MOIST TROPI-CAL AIR TO BE DRAWN NORTHWARD OVER THECHAIN. THIS MOISTURE IS IN TURN BEING ACT-ED UPON BY THE DYNAMICS OF THE LOWPRESSURE SYSTEM WHICH WILL CAUSE ACLOUD BAND OF HEAVY SHOWERS TO FORM.THIS CLOUD BAND WILL AT FIRST AFFECT THEWESTERN ISLANDS OF KAUAI AND OAHU ANDLATER ON THE OTHER ISLANDS ALSO. IN AD-DITION LOCALIZED HEAVY SHOWERS WILL DE-VELOP OUT AHEAD OF THE CLOUD BAND ANDMOVE ACROSS THE ISLANDS FROM SOUTHER-LY DIRECTIONS.
PRECISE TIMING OF THE WEATHER EVENTS ASTHEY WILL OCCUR IS STILL UNCERTAIN. KEEPTABS ON THE WEATHER CONDITIONS OVERTHE NEXT DAY OR TWO AND BE READY TO ACTQUICKLY IF FLOODING STARTS OR A WARNINGIS ISSUED.
AN UPDATED OUTLOOK WILL BE ISSUED AT 9AM THURSDAY OR SOONER IF NEEDED.
REFERENCES
Alfonso, A. P., and L. R. Naranjo, 1996: The 13 March 1993 severesquall line over western Cuba. Wea. Forecasting, 11, 89–102.
Aspliden, C. I., Y. Tourre, and J. B. Sabine, 1976: Some climatologicalaspects of West African disturbance lines during GATE. Mon.Wea. Rev., 104, 1029–1035.
Barnes, G. M., and K. Sieckman, 1984: The environment of fast- andslow-moving tropical mesoscale convective cloud lines. Mon.Wea. Rev., 112, 1782–1794.
Brinkmann, W. A. R., 1974: Strong downslope winds at Boulder,Colorado. Mon. Wea. Rev., 102, 592–602.
Businger, S., B. H. Bauman III, and G. F. Watson, 1991: The devel-opment of the Piedmont front and associated outbreak of severeweather on 13 March 1986. Mon. Wea. Rev., 119, 2224–2251.
Chong, M., P. Amayenc, G. Scialom, and J. Testud, 1987: A tropicalsquall line observed during the COPT 81 experiment in WestAfrica. Part I: Kinematic structure inferred from dual-Dopplerradar data. Mon. Wea. Rev., 115, 670–694.
Emanuel, K. A., 1983: On assessing local conditional symmetric in-stability from atmospheric soundings. Mon. Wea. Rev., 111,2016–2033.
Fornander, A., 1996: Ancient History of the Hawaiian People: To thetimes of Kamehameha I. Mutual Publishing, 445 pp.
SEPTEMBER 1998 591B U S I N G E R E T A L .
Fujita, T. T., 1978: Manual of downburst identification for ProjectNIMROD. Satellite and Mesometeorology Research Paper 156,Dept. of Geophysical Sciences, University of Chicago, 104 pp.[Available from Dept. of Geophys. Sci., University of Chicago,5801 South Ellis, Chicago, Illinois 60637.], and H. R. Byers, 1977: Spearhead echo and downburst in thecrash of an airliner. Mon. Wea. Rev., 105, 129–146.
Grindinger, C. M., 1992: Temporal variability of the trade wind in-version: Measured with a boundary layer vertical profiler. M.S.thesis, Department of Meteorology, University of Hawaii, 93 pp.[Available from Department of Meteorology, Univ. of Hawaii,2525 Correa Rd., HIG-331, Honolulu, HI 96822.]
Hobbs, P. V., J. D. Locatelli, and J. E. Martin, 1990: Cold fronts aloftand the forecasting of precipitation and severe weather east ofthe Rocky Mountains. Wea. and Forecasting, 5, 613–626.
Hoskins, B. J., M. E. McIntyre, and A. W. Robertson, 1985: On theuse and significance of isentropic potential vorticity maps. Quart.J. Roy. Meteor. Soc., 111, 877–946.
Houze, R. A., 1977: Structure and dynamics of a tropical squall-linesystem. Mon. Wea. Rev., 105, 1540–1567., S. A. Rutledge, M. I. Biggerstaff, and B. F. Smull, 1989: In-terpretation of Doppler weather radar displays of midlatitudemesoscale convective systems. Bull. Amer. Meteor. Soc., 70,608–619.
Johns, R. H., 1993: Meteorological conditions associated with bowecho development in convective storms. Wea. Forecasting, 8,294–299., and W. D. Hirt, 1987: Derechos: Widespread convectively in-duced windstorms. Wea. Forecasting, 2, 32–49.
Jorgensen, D. P., and M. A. LeMone, 1989: Vertical velocity char-acteristics of oceanic convection. J. Atmos. Sci., 46, 621–640., and B. F. Smull, 1993: Mesovortex circulations seen by airborneDoppler radar within a bow-echo MCS. Bull. Amer. Meteor. Soc.,74, 2146–2157., M. A. LeMone, and S. B. Trier, 1997: Structure and evolutionof the 22 February 1993 TOGA COARE squall line: Aircraftobservations of precipitation, circulation, and surface energyfluxes. J. Atmos. Sci., 54, 1961–1985.
Juang, H.-M. H., and M. Kanamitsu, 1994: The NMC nested regionalspectral model. Mon. Wea. Rev., 122, 3–26.
Keenan, T. D., and R. E. Carbone, 1992: A preliminary morphologyof precipitation systems in northern Australia. Quart. J. Roy.Meteor Soc., 118, 283–326.
Knupp, K. R., 1996: Structure and evolution of a long-lived, micro-burst-producing storm. Mon. Wea. Rev., 124, 2785–2806.
Kodama, K. R., and G. M. Barnes, 1997: Heavy rain events over thesouth-facing slopes of Hawaii: Attendant conditions. Wea. Fore-casting, 12, 347–367., and S. Businger, 1998: Weather and forecasting challenges inthe Pacific Region of the National Weather Service. Wea. Fore-casting, 13, 253–276.
Lee, W. C., R. M. Wakimoto, and R. E. Carbone, 1992: The evolutionand structure of a ‘‘bow-echo microburst’’ event. Part II: Thebow echo. Mon. Wea. Rev., 120, 2211–2225.
Locatelli, J. D., J. E. Martin, J. A. Castle, and P. V. Hobbs, 1995:Structure and evolution of winter cyclones in the central UnitedStates and their effects on the distribution of precipitation. PartIII: The development of a squall line associated with weak coldfrontogenesis aloft. Mon. Wea. Rev., 123, 2641–2662.
Mass, C. F., S. Businger, M. D. Albright, and Z. A. Tucker, 1995: Awindstorm in the lee of a gap in a coastal mountain barrier. Mon.Wea. Rev., 123, 315–331.
Miller, R. C., 1975: Notes on analysis and severe storm forecastingprocedures of the Air Force Global Weather Central. Tech. Rep.
200 (revised), AWS, USAF. [Available from Headquarters AWS,Scott AFB, IL 62225.]
Nicholls, M. E., 1987: A comparison of the results of a two-dimen-sional numerical simulation of a tropical squall line with ob-servations. Mon. Wea. Rev., 115, 3055–3077.
Nolen, R. H., 1959: A radar pattern associated with tornadoes. Bull.Amer. Meteor. Soc., 40, 277–279.
Pfost, R. L., and A. E. Gerard, 1997: ‘‘Bookend vortex’’ inducedtornadoes along the Natchez Trace. Wea. Forecasting, 12, 572–580.
Przybylinski, R. W., 1995: The bow echo: Observations, numericalsimulations, and severe weather detection methods. Wea. Fore-casting, 10, 203–218.
Ramage, C. S., 1962: The subtropical cyclone. J. Geophys. Res., 67,1401–1411., 1995: Forecasters guide to tropical meteorology, AWS TR 240Updated. AWS/TR-95/001, AWS, USAF, 392 pp. [Availablefrom Headquarters AWS, Scott AFB, IL 62225.]
Roux, F., and S. Ju, 1990: Single-Doppler observations of a WestAfrican squall line on 27–28 May 1981 during COPT 81: Kin-ematics, thermodynamics and water budget. Mon. Wea. Rev.,118, 1826–1854.
Schroeder, T. A., 1977a: Meteorological analysis of an Oahu flood.Mon. Wea. Rev., 105, 458–468., 1977b: Hawaiian waterspouts and tornadoes. Mon. Wea. Rev.,105, 1163–1170.
Simpson, R. H., 1952: Evolution of the Kona storm: A subtropicalcyclone. J. Meteor., 9, 24–35.
Skamarock, W. C., M. L. Weisman, and J. B. Klemp, 1994: Three-dimensional evolution of simulated long-lived squall lines. J.Atmos. Sci., 51, 2563–2584.
Smith, R. B., 1985: On severe downslope winds. J. Atmos. Sci., 42,2597–2603.
Smull, B. F., and R. A. Houze Jr., 1987: Rear inflow in squall lineswith trailing stratiform precipitation. Mon. Wea. Rev., 115,2869–2889.
Trier, S. B., W. C. Skamarock, M. A. Lemone, D. B. Parsons, andD. P. Jorgensen, 1996: Structure and evolution of the 22 February1993 TOGA COARE squall line: Numerical simulations. J. At-mos. Sci., 53, 2861–2886., , and , 1997: Structure and evolution of the 22 Feb-ruary 1993 TOGA COARE squall line: Organization mecha-nisms inferred from numerical simulation. J. Atmos. Sci., 54,386–407.
Uccellini, L. W., and D. R. Johnson, 1979: The coupling of upperand lower tropospheric jet streaks and implications for the de-velopment of severe convective storms. Mon. Wea. Rev., 107,682–703.
Wang, J. J., H.-M. H. Juang, K. Kodama, S. Businger, Y. L. Chen,and J. Partain, 1998: Application of the NCEP Regional SpectralModel to improve mesoscale weather forecasts in Hawaii. Wea.Forecasting, 13, 290–305.
Weisman, M. L., 1992: The role of convectively generated rear-inflowjets in the evolution of long-lived mesoconvective systems. J.Atmos. Sci., 49, 1826–1847., 1993: The genesis of severe, long-lived bow echoes. J. Atmos.Sci., 50, 645–670., and J. B. Klemp, 1982: The dependence of numerically sim-ulated convective storms on vertical wind shear and buoyancy.Mon. Wea. Rev., 110, 504–520.
Zipser, E. J., 1977: Mesoscale and convective-scale downdrafts asdistinct components of squall-line structure. Mon. Wea. Rev.,105, 1568–1589., and K. R. Lutz, 1994: The vertical profile of radar reflectivityof convective cells: A strong indicator of intensity and lightningprobability? Mon. Wea. Rev., 122, 1751–1759.