A blueprint for a climate friendly cement...
101
A blueprint for a climate friendly cement industry
Transcript of A blueprint for a climate friendly cement...

A blueprint for a climate friendly cement industry

A report prepared for the WWF –Lafarge Conservation Partnership
On behalf of: WWF International
GlandSwitzerland
Nicolas Müller & Jochen HarnischEcofys Germany GmbH
Nürnberg – Germany
+49 911 994358-12
How to Turn Around the Trend of Cement Related Emissions in the Developing World.
Pho
togr
aph
Jean
-Phi
lipp
e M
esg
uen
© L
afar
ge P
hoto
Lib
rary

iiA blueprint for a climate friendly cement industry
The crisis of climate change needs urgent solutions. This report proposes solutions for an industry sector which is responsible for 8% of global CO2 emissions, the cement industry.
As economies grow and get wealthier, the demand for construction materials such as cement and concrete is booming. This is particularly visible in emerging economies. The global cement industry is facing the challenge to sustain its business while decreasing its carbon intensity, from production processes, fuel uses and its product end use.
Science tells us that the world must reduce its emissions of greenhouse gases by at least 80 per cent below 1990 levels by 2050. WWF insists that developed countries show the way to this goal with decisive actions to reduce their emissions by 25-40 per cent below 1990 levels by 2020 while supporting and financing additional emissions reductions in carbon- and energy-intensive sectors in developing nations.
This report offers a range of solutions to enable cement companies to turn around their growth of CO2 emissions and shows how the cement industry can contribute to the task ahead of us. It describes a scenario in which the industry sector grows to more than twice its size in volume by 2050 while it reduces its absolute CO2 emissions by approximately three quarters compared to global emissions in 2007. Compared to a business-as-usual scenario, the reduction options are even more impressive: the avoided CO2 emissions amount to 90% compared to the situation in a “frozen technology scenario” in 2050.
WWF believes that cement companies around the world must take steps to reduce their carbon footprint today, both in emerging economies and industrialized countries. The solutions proposed in this report can help the industry move in the right direction, set targets and take action that will lead to deep greenhouse gas emission reductions.
It is clear that these actions need support from a corresponding policy framework, which must be based on strong caps on overall emissions in developed countries. At the same time, the framework must ensure that developing countries, in particular emerging economies, deviate substantially from a business-as-usual development path.
Preface

iiiA blueprint for a climate friendly cement industry
Preface
To make this possible, sufficient financial resources and technology must be made available from developed countries. A policy framework specifically for the cement sector must contain the following elements:
Policy regulations taking effect as soon as possible, which guarantee that any newly built or retrofitted cement plants •install only best available technology.
A technology action programme to enable the industry to reach globally set sectoral standards. This action •programme should receive financial support for Non-Annex 1 countries from Annex 1 countries.
Policies to support cross-sectoral mitigation efforts, as the end-user industries such as the construction industry •will play a crucial role in the efficient and appropriate use of cement. This type of cross-sectoral mitigation effort has been largely unexplored to date.
Policies that guarantee the sustainable production of biomass energy sources, which could reduce the industry’s •dependency on fossil fuels.
Standardized criteria and screens for financial service companies to define and integrate the climate risk of the •cement sector and individual cement companies.
While this report in particular focuses on solutions for the cement sector in China, it is obvious that these solutions can and must be transferred to other countries as well, including industrialized countries. The carbon intensity of cement production in industrialized regions, in particular in North America, is sometimes worse than that in emerging economies. WWF urges cement producers all around the world to develop serious action and investment plans to achieve a low carbon business model for their industry.
WWF would like to thank the authors from Ecofys, as well as the experts and reviewers in China and elsewhere for the excellent work contributed to this report. WWF would also like to thank Lafarge staff in France and China for contributing their expertise and time to this report.
Kim Carstensen Oliver RapfLeader, Global Climate Initiative, WWF International Head, Climate Business Engagement, WWF International

ivA blueprint for a climate friendly cement industry
We would like to thank the following persons for their input made during and after the study trip to China:
Sui Tongbo Vice President, Chinese Building Materials Academy.
Kong Xiangzhong Secretary General, China Cement Association.
Lui Ming Deputy Director, Office of Rare Earth & Building Materials of Department of Industry – National Development & Reform Commission.
Tan Li Director of Foreign Affairs Office, Chinese Building Materials Academy.
Cui Yuansheng Vice President, Institute of Technical Information for Building Materials Industry of China, National Cement Information Network.
Zhuang Guiyang Senior Research Fellow, Research Center for Sustainable Development, Chinese Academy of Social Sciences.
Chen Ying Senior Research Fellow, Research Center for Sustainable Development, Chinese Academy of Social Sciences.
Zhang Ruiying Program Officer, China Sustainable Energy Program, Energy Foundation.
Hu Xiulian Research Professor, Energy Research Insitute.
Wang Lan China Building Material Academy.
Cui Qi Director Professor, Research Institute of Cement & New Building Materials.
Peng Zhihui Director, Chongqing Administration Office of Supporting Fees for Urban Construction.
Mr. Farseer Department of Science and Technology of Ministry of Construction; Sino-Dutch Sustainable Building Demonstration Project Management Office.
He Hong Director Engineer; Chongqing Municipal Economic Commission.
Jane Zhou Lafarge China, Senior Vice President.
Frederic Vallat Resource Recovery Manager, Lafarge.
Liu Zuoyi Senior Consultant, DigitalCement.
Further we would like to thank all reviewers who contributed to this report through their comments: Lynn Price (Lawrence National Berkeley Laboratories), Prof. Niklaus Kohler (University of Karlsruhe), Prof. Elmar Bollin (University of Applied Sciences Offenburg), Wang Lan (China Building Material Academy) and Ying Chen (Chinese Academy of Social Sciences).
This report was prepared as a master thesis by Nicolas Müller at the University of Applied Sciences Offenburg (Germany) under the supervision of Prof. Elmar Bollin (University of Applied Sciences Offenburg) and Dr. Jochen Harnisch (Ecofys Germany GmbH in Nürnberg (Germany)).
Acknowledgements

vA blueprint for a climate friendly cement industry
Contents
1. Executive Summary .................................................................................................................................................................................................. 011.1 Rapid expansion of production in developing countries ............................................................................................................... 011.2 Cement related emissions and future climate action ........................................................................................................................ 011.3 Conventional and advanced emission reduction options ............................................................................................................ 011.3.1 Improve the thermal efficiency of kilns .............................................................................................................................................................. 021.3.2 Increase the share of biomass ................................................................................................................................................................................... 021.3.3 Improve the electrical efficiency of plants ...................................................................................................................................................... 031.3.4 Develop Carbon Capture and Storage (CCS) ........................................................................................................................................... 031.3.5 Use cement more efficiently ......................................................................................................................................................................................... 031.3.6 Expand the use of additives and substitutes to cement clinker ............................................................................................ 031.4 The result: a pathway to a low carbon cement industry ................................................................................................................ 041.5 Making it happen – a climate-friendly cement industry .................................................................................................................. 05
2. Introduction ............................................................................................................................................................................................................................ 102.1 Background of this report ............................................................................................................................................................................................... 102.2 Scope of the study .................................................................................................................................................................................................................. 102.3 Global emission and production scenarios .................................................................................................................................................. 112.4 Cement in global mitigation scenario ................................................................................................................................................................. 142.5 Evolving climate policy framework ......................................................................................................................................................................... 14
3. Cement production and emission reduction options ...................................................................................... 173.1 Cement production ................................................................................................................................................................................................................. 173.2 CO2 impact of cement production .......................................................................................................................................................................... 173.3 Process energy efficiency ............................................................................................................................................................................................... 183.3.1 Kilns ......................................................................................................................................................................................................................................................... 183.3.2 Preheater and precalciner ............................................................................................................................................................................................... 203.3.3 Grinding and blending ......................................................................................................................................................................................................... 203.3.4 Transportation .............................................................................................................................................................................................................................. 213.4 Electricity efficiency ................................................................................................................................................................................................................. 223.4.1 Electrical consumption ....................................................................................................................................................................................................... 223.4.2 Waste heat recovery .............................................................................................................................................................................................................. 223.4.3 Cement and power hybrid plants ........................................................................................................................................................................... 233.4.4 Topping cycles ............................................................................................................................................................................................................................. 243.4.5 Comparison of strategies ................................................................................................................................................................................................ 243.5 Fuel type ............................................................................................................................................................................................................................................. 253.5.1 Conventional fossil fuels .................................................................................................................................................................................................... 253.5.2 Fossil based alternative fuels ....................................................................................................................................................................................... 273.5.3 Biomass .............................................................................................................................................................................................................................................. 293.6 Clinker substitutes and alternative raw materials .................................................................................................................................. 313.7 Innovative cement based material ......................................................................................................................................................................... 333.8 Transition to low CO2 products .................................................................................................................................................................................. 373.9 More efficient use of concrete .................................................................................................................................................................................... 383.9.1 Optimized construction ....................................................................................................................................................................................................... 383.9.2 Durability of buildings ............................................................................................................................................................................................................. 393.9.3 Disposal and recycling of concrete ....................................................................................................................................................................... 403.10 Integrated analysis of potential .................................................................................................................................................................................. 403.11 Carbon capture and storage ........................................................................................................................................................................................ 41
4. Reduction scenarios for selected developing countries ........................................................................... 424.1 Brazil ....................................................................................................................................................................................................................................................... 424.2 Malaysia .............................................................................................................................................................................................................................................. 434.3 Morocco ............................................................................................................................................................................................................................................. 434.4 Philippines ........................................................................................................................................................................................................................................ 444.5 Discussion of commonalities and differences .......................................................................................................................................... 45
5. Emission reduction scenarios for cement production in China .................................................... 465.1 The framework ............................................................................................................................................................................................................................. 465.2 Production scenario for China .................................................................................................................................................................................... 485.2.1 Demographics .............................................................................................................................................................................................................................. 485.2.2 National economy .................................................................................................................................................................................................................... 505.2.3 Relation between wealth and cement demand ...................................................................................................................................... 505.2.4 Scenario for China ................................................................................................................................................................................................................... 505.2.5 Energy sector in China ........................................................................................................................................................................................................ 515.3 The Chinese cement sector: status quo and trends ......................................................................................................................... 525.4 Potentials and barriers for reduction measures ...................................................................................................................................... 545.5 Ancillary effects ........................................................................................................................................................................................................................... 565.6 Energy in buildings .................................................................................................................................................................................................................. 575.7 Greenhouse gas emission mitigation scenario for China ............................................................................................................. 585.8 National and regional policies and measures to realize reduction measures ........................................................ 605.9 International policies and measures: e.g. CDM and activities under AP6 ................................................................. 625.10 Relevance of results from China for other developing countries .......................................................................................... 63
6. Towards an Action Plan ...................................................................................................................................................................................... 656.1 Conventional and advanced emission reduction options ............................................................................................................ 666.1.1 Improve the thermal efficiency of kilns .............................................................................................................................................................. 666.1.2 Increase the share of biomass ................................................................................................................................................................................... 666.1.3 Improve the electrical efficiency of plants ...................................................................................................................................................... 666.1.4 Develop Carbon Capture and Storage (CCS) ........................................................................................................................................... 666.1.5 Use cement more efficiently ......................................................................................................................................................................................... 676.1.6 Expand the use of additives and substitutes to cement clinker ............................................................................................ 676.2 The result: a pathway to a low carbon cement industry ................................................................................................................ 676.3 Making it happen – a climate-friendly cement industry .................................................................................................................. 69
7. Acronyms .......................................................................................................................................................................................................................................... 738. Glossary ............................................................................................................................................................................................................................................... 749. Units ........................................................................................................................................................................................................................................................ 7510. Annex I – Methodology – Chinese cement demand .......................................................................................................................... 7611. References ....................................................................................................................................................................................................................................... 78

1. Executive Summary
1A blueprint for a climate friendly cement industry
Figure 1.aCement production in industrialized and developing countries [1]
Gt
cem
ent
Other developing countries
OECD, other industrial nations and transition economies
China
India
1990 205020402030202020102000
0
1
2
3
4
5
6
Projection
1. Executive Summary
The continued growth of key world economies results in an increasing demand for construction materials. As a consequence, the global production of cement in 2030 is projected to grow to a level roughly five times higher than its level in 1990, with close to 5 billion tonnes worldwide [1]. This has a significant impact on the overall level of anthropogenic greenhouse gas (GHG) emissions as the production of each tonne of cement leads to emissions of roughly 0.89 tonnes of carbon dioxide [2]. As a consequence, the emissions of the global cement sector alone are very likely to surpass the total amount of CO2 emissions of the EU before 2030. This report attempts to identify the drivers of this process and explore options to mitigate emissions.
1.1 Rapid expansion of production in developing countriesFigure 1.a shows the rapid expansion of global cement production since 1990, which mainly stems from production increases in China. The viewgraph also shows projected future increases of cement production. Many new cement plants are going to be built in the next decade, especially in developing countries. Their lifespan will probably exceed 40 years. In a future carbon constrained world, the profitability of individual plants will depend on their CO2 intensity. Significant emissions reductions at existing plants by improving the technology and operating practices are achievable. The accelerated closure of outdated plants with low efficiency can also make substantial contributions to emission reductions.
1.2 Cement related emissions and future climate actionGlobally, widespread agreement has been reached that the threat of climate change is real. Global action needs to be taken to reverse the increasing trend of global greenhouse gas emissions. During the next 10 years, global emissions levels should be reduced to 50% less than their 1990 levels by 2050. This will reflect the so-called 450 ppm stabilization scenario aiming to limit global warming during the 21st century to 2°C [3]. These objectives find growing acceptance, including at the international policy level. They are likely to be implemented in negotiations under the umbrella of the United Nations.
By 2006, cement production contributed to roughly 8% of worldwide anthropogenic CO2 emissions [4] or 6% of total anthropogenic greenhouse gas emissions. Despite significant improvements in efficiency, cement related emissions are expected to increase by 260% throughout the 1990-2050 period (Figure 1.b).
As a result, the challenge arises of how to transform the traditional way of producing cement into a sustainable business model, and how efforts to reduce the emissions from the cement sector can be implemented in a timely fashion.
1.3 Conventional and advanced emission reduction options Currently the production of one ton of cement commonly results in the release of 0.65 to 0.95 tonnes of CO2 depending on the efficiency of the process, the fuels used, and the specific type of cement product. Considering the scale of, the worldwide cement production, even a slight decrease in the average global emissions per ton has a large CO2 reduction potential. Every 10% decrease in the cement CO2 intensity by 2050 could save around 0.4 Gt CO2
[5], and substantially contribute to slowing climate change.

1. Executive Summary
2A blueprint for a climate friendly cement industry
Figure 1.bCement emission forecast vs. mitigation path
0
5
10
15
20
25
30
35
40
45
CementCO2 emissions:+260%
CO2 globalemissions target:-50%
Relative CO2 emission change 1990-2050
1990 205020402030202020102000
Gt CO2
450 ppm mitigation path
Global emissions from the cement sectorunder Business As Usual (BAU)
Typically, around 55% of the CO2 emissions in the production of cement clinker originate from the conversion of limestone (CaCO3) into lime (CaO). Around 40% of the emissions result from combustion processes needed to yield the thermal energy required for this reaction (1450°C). Through energy efficiency measures, emissions and fuel costs can both be considerably reduced. The use of biomass as substitutes to carbon intensive fuels can contribute substantially to reducing emissions of fossil CO2. By reducing the electricity consumption of one plant additional emissions reductions are possible which could contribute up to 10% of total emissions, depending on the local electricity mix.
Further abatement could originate from the more efficient use of cement and concrete. Even large cement producers cannot significantly influence the demand for building materials. However they can guide participants in the building sector in their specific choices, especially in cooperation with governments. Similar to energy efficiency, or avoided energy consumption, the avoided or reduced consumption of concrete deserves full consideration.
When used in a more efficient way, high strength, specialty concrete or even ordinary concrete and cement products can largely decrease the overall quantity of material used to meet the requirements for projects. The extension of specified lifetimes of buildings from only a few decades to at least a century is also a potent long-term reduction measure of cement demand and related emissions.
Additionally, innovative low CO2 cementitious materials are to be considered as a reduction measure. The potential CO2 reduction using different kinds of advanced products and optimizations is significant. In the light of the required emission mitigation pathways, they have to obtain large market shares before 2050. These products also require the distribution of information and know-how on all levels and will require the changes to relevant building codes and standards.
The following section provides an overview of the key types of technical measures available to achieve significant reductions of greenhouse gas emissions.
Cement Production
1.3.1 Improve the thermal efficiency of kilns The most efficient solution regarding the production of clinker in new kilns, (new rotary kilns with pre-calciner and suspension pre-heaters), is widely applied already today, including in China. It is important to ensure that all new plants are built according to the best available technology. The equipment in numerous plants worldwide is still very far from the best being able to achieve efficiency; energy consumption can reach twice the level of the best available technology and practices. The efficiency of some of these plants can greatly be enhanced through upgrades. Outdated technologies should be phased out because of low efficiency as such plants are commonly heavy polluters and the quality of the cement produced is often inferior. This inhibits the switch to good practices and high quality products.
1.3.2 Increase the share of biomassThe use of biomass in cement kilns is still quite low in the developing world, even if close to 40% were achieved in Brazil. Despite favorable tropical weather which allows a fast growth of the biomass its share as kiln fuel is under 5% in most developing countries. Setting a long term goal of 40% of sustainable biomass in the fuel by 2050 is challenging but achievable. It would require a long term sustainable supply chain for biomass fuels originating from forestry, biological wastes or crops.

1. Executive Summary
3A blueprint for a climate friendly cement industry
1.3.3 Improve the electrical efficiency of plants Large improvements can be achieved regarding electricity consumption and efficiency. Less than 40 kWh are consumed per ton of cement using WHR (Waste Heat Recovery) and very efficient equipment. This corresponds to a reduction of the current plant electricity consumption by two thirds. This is especially important in countries with a carbon intensive electricity mix. A maximum consumption of electricity in kWh / ton of cement can be agreed between cement companies with developing countries governments for all new plants with WHR (Waste Heat Recovery) as a requirement. At the same time, a goal could be applied for existing plants with increasing targets. This could be done in the frame of a voluntary agreement with all cement companies.
1.3.4 Develop Carbon Capture and Storage (CCS)Reducing the CO2 generated from the cement sector on a scale and in a timeframe compatible with the mitigation scenario is difficult. The sequestration of the CO2 produced can be a solution for a low-carbon future. This technology could cover a majority of the cement emissions by 2050. Only 3,000 cement plants worldwide could supply the 5 Gt cement demand by 2050. In order to be able to recover the CO2 from all plants by then, it is important that new plants are designed in a way that would allow an upgrade with CCS. Plants which use biomass and are equipped with CCS would remove carbon from the atmospheric cycle and as such have the potential to reduce the CO2 in the atmosphere.
Use of Cement
1.3.5 Use cement more efficiently Focus can first be set on specifically answering the required function of a project rather than simply delivering a certain quantity of material. In several cases, the concrete consumption can be reduced, sometimes by more than 50%, by applying the right design, and switching to high quality or special concretes. This requires an enhanced cooperation with the customer as well as improved education, information and training on the most advanced alternatives available from cement suppliers. It also requires sound scientific methods and quality controls to be applied throughout the whole life-cycle of cement from production to use.
1.3.6 Expand the use of additives and substitutes to cement clinkerThe use of Ordinary Portland Cement is the established business practice in the building sectors of most industrialized and developing countries. Conventional and advanced alternatives to Portland cement can lead to substantial CO2 reductions ranging from 20 to 80% depending on the case.
Until now, the use of additives and substitutes to Ordinary Portland Cement (OPC) clinker has been one of the most successful measures in decreasing the specific CO2 emissions from making cements. A long term clinker ratio as low as 0.75 is desirable. Such a target is still challenging since the availability of additives will not necessarily grow at the same rate as the cement demand.

1. Executive Summary
4A blueprint for a climate friendly cement industry
If new alternatives to Portland Cement can account for 20% of the market by 2030, they would lead to a 10% decrease in CO2 emissions from the sector. The introduction of new alternatives to Portland cement is generally very challenging and is expected to take a long time. Therefore, it is advisable to start this process as soon as possible, especially in countries which are still in an earlier stage of development. For this purpose, pilot projects and applications could be developed to “lead by example”. Large projects use large quantities of cement for one single customer. Such projects are ideally suited for the introduction of new alternatives to Portland cement before having the technology spread to a broader customer basis. Strong carbon financing or other incentive tools could greatly help to launch these substitutes until they start to spread on their own.
1.4 The result: a pathway to a low carbon cement industryMost options can be implemented independently. Table 1.a gives an overview of the discussed technical options and shows respective reduction potentials.
Table 1.a Potential greenhouse mitigation measures and respective potentials until 2050 based on a reference “frozen technology” scenario assuming a consumption of 5.7 Gt cement of cement in 2050 with a constant CO2 intensity of 0.89 t CO2 / t cement through 2005-2050 leading to 5.1 Gt CO2 emitted in 2050 from the cement production
Measures Quantification (all figures are given on a per year basis)
Use cement more efficiently; especially cement used for buildings. Reduce the need for concrete and switch to higher qualities with higher added value. Eliminate low quality concrete for applications.
Set a goal for an efficient cement use which would lead to an equivalent of a 15% decrease of cement related CO2 emissions by 2050
15% consumption avoided
= 0.86 Gt cement avoided
= 0.75 Gt CO2 avoided
Remaining quantity of cement to be produced = 4.84 Gt
Remaining CO2 emissions = 4.32 Gt
Further expand the use of additives and substitutes to produce blended cements and promote alternatives to Portland Cement on large projects to “lead by example” and increase their share in the market.
Decrease the clinker ratio to 0.75 worldwide by 2050 (from 0.87 in 2005)
0.88 Gt CO2 avoided
Remaining quantity of clinker to be produced = 3.09 Gt
Remaining CO2 emissions from the clinker production = 3.12 Gt
Improve the thermal efficiency of kilns: to encourage and develop CO2 reductions using the best available technology combined with good practices
Improve the average kiln efficiency from 4.4 GJ / t clinker in 2005 to 3.0 GJ / t in 2050
Energy saved in the kiln
= 0.375 Gt CO2 avoided
Use of 9.27 EJ instead of 13.60 EJ
Energy need reduced by 4.33 EJ
Improve the electrical efficiency of plants on new and existing cement plants through WHR (Waste Heat Recovery) and efficient equipments.
Reduce the net electrical consumption of all cement plants to 40 kWh / t clinker by 2050
Emission savings:
= 0.125 Gt CO2 avoided (based on the displacement of coal)

1. Executive Summary
5A blueprint for a climate friendly cement industry
Figure 1.c Impact of different reduction levers on cement related emissions in 2050
Gt
CO
2 /
year
1990 20502005
0
1
2
3
4
5
Develop Carbon Capture and Storage (CCS)
Improve the average thermal efficiency of kilns
Increase the share of biomass in the fuel mix
Improve the electrical efficiency of plants
Use cement more efficiently
Further expand the use of alternatives to OPC clinker
Measures Quantification (all figures are given on a per year basis)
Increase the share of biomass in the fuel mix
Set a long term goal of 45% of sustainable biomass fuel by 2050 in the fuel mix for cement kilns
The equivalent CO2 saved from the displacement of coal as a fossil fuel is around 0.41 Gt
Resulting CO2 emissions per year Fossil origin: 2.12 Gt
(G) Develop Carbon Capture and Storage (CCS) with the target to reach a high sequestration of CO2 emissions by 2050. Develop now plants which are able to be upgraded with CCS.
Reach a 60% CO2 sequestration share by 2050.
60% of the real CO2 stream sequestrated = 1.54 t CO2 captured per year
Remaining NET CO2 emissions of CO2 in the atmosphere by 2050: 0.6 Gt / year
From combining these measures, the resulting Global Mitigation Path has been quantified and compared to a “frozen technology scenario” in which the CO2 intensity would remain at the level of 2005 by 2050. Figure 1.c visualizes the quantitative impact of each “reduction wedge” against the reference trend of emissions.
1.5 Making it happen – a climate-friendly cement industryIn order to rapidly progress towards a low-carbon cement sector in developing and developed countries, a combination of different measures have to be taken in order to implement the technical options. The following list provides a portfolio of options. A summary overview is given in Table 1.b at the end of this list.
(1) Implement a global sectoral approach for the cement industry
Policy or market instruments guaranteeing a certain minimum efficiency of cement plants can be applied by a country, a region or on an international basis in order to have a rapid convergence worldwide towards the best achievable technology and efficiency. Both countries and companies have the possibility to set a minimum standard of efficiency for all new cement plants. Such an approach of a minimum standard in the sector could also be integrated into future climate agreements. Moreover, carbon credits could provide an incentive for plants to achieve a higher performance, based on enhanced technologies and application of best practices.

1. Executive Summary
6A blueprint for a climate friendly cement industry
Specific tools to accelerate the phase-out of bad practices and outdated technologies are currently missing in the international framework. Financial incentives for the closure of outdated plants are especially lacking. New approaches to retire a maximum of outdated plants can be established in the framework of the Kyoto Protocol (and its successor) with an agreed target to progressively retire plants according to their fuel consumption. In order to accelerate the movement, governments could reduce taxes on imports for advanced technologies or introduce penalty taxes on cement plants with poor efficiency.
(2) Make CO2 reductions integral part of the business model
Together with building academies, civil engineering companies and environmental groups, leading cement companies should become leaders in low CO2 construction. Cement companies have the possibility to start strengthening their skills on the CO2 consulting field now to provide customers with solutions which have the lowest impact on the climate.
Cement companies, together with building associations and academies should promote the switch to high strength and low CO2 materials. By switching to high quality cement with a high added value, the companies can enhance their profitability while reducing the quantities and still be answering the demand for construction materials as sufficiently as they do today. In many countries, first steps have been taken to progressively reduce the share of low strength cement produced. A gradual ban of the lowest qualities can be envisioned through the implementation of minimum standards for different applications. The increased use of innovative building materials can play an important role in emissions reduction strategies.
Generally, such new kinds of reduction programs could be implemented under the “Programmatic Clean Development Mechanism” which rewards the result of a program or policy rather than the result of a single project. The development, spread and use of this instrument is essential and could also be part of a future post-Kyoto treaty. Generally, strong measures could accelerate the market penetration of alternative cementitious materials like fiber re-inforced concretes or belite cements up to a critical scale. As such, a policy rewarded by carbon credits is a good instrument to promote these materials.
(3) Improve the framework for the use of substitution materials
Substitution materials used as binder and mixed with cement already avoid large amounts of CO2 emissions. Their use can be increased to 35% locally in the cement mix. Several developing countries are going to build a large number of coal power plants in the coming decades. Producing high quality ashes with low carbon content is essential. Used in blended cement, the substitution material provides the same decrease in the CO2 emissions as increasing the efficiency of a power plant. In turn, standards can be set for the quality of ashes, possibly using tax and discount instruments. Furthermore, the potential positive impact of ashes on the power plant energy balance and economics should be assessed. For this purpose, operators and technology suppliers of coal power plants need to be involved from an early stage.

1. Executive Summary
7A blueprint for a climate friendly cement industry
(4) Set up goals for a growing share of biomass
Cement companies should set up a long term sustainability goal for the use of biomass. Together with national governments and environmental groups, cement companies can develop a program for the sustainable use of biomass resources. This could lead to a 2050 goal of 50% average use of biomass in the fuel mix worldwide, which is very close to the current technological limit. However, an increase in biomass use must go hand in hand with the assurance of sustainable biomass sources.
(5) Update standards for cements
In order to obtain a large share of the market, blended cements or even advanced alternative cementitious materials require product standards in order to permit a judgment based on their performance (e.g. strength, setting time, CO2 per ton), not on their chemical composition which might be different from ordinary Portland cement. This process should involve cement companies, cement associations as well as individual governments and national and international standardization bodies.
(6) Create new international policy instruments for the construction sector
All parts of the whole life cycle chain of cement, concrete and final products or construction projects should be taken into consideration for CO2 reductions. This requires the development of proper instruments related to programs, national policies or carbon markets. Ideally, a large number of these options could be identified, quantified and verified to qualify as emissions reductions and be rewarded by national policies or carbon markets.
One way to proceed could be to integrate the CO2 factor in the bidding for large projects. Additionally, a policy could be set up to lower the quantity of CO2 used per building surface built.
Discussions on the international level should consider these aspects for their integration into a Post-Kyoto agreement.
(7) Establish market based instruments on the national level
Financial instruments could be set up easily to target the fossil fuel consumption of the cement industry. A global “cap and trade” system where the emission permits for the cement sector are limited would deliver financial incentives to decrease the carbon intensity. Such a “cap and trade” system can be implemented in various forms [6].
Putting a carbon price on fuel use or emissions creates an incentive for the most efficient plants to fully use their capacity and at the same time restrains the use of the most inefficient ones. Consequently, this would create a large incentive to recover and use as much biomass fuels. If set up properly, the instruments would encourage new plants to be built using even more efficient technologies, and accelerate the phase out of the least efficient.
1. Executive Summary
8A blueprint for a climate friendly cement industry
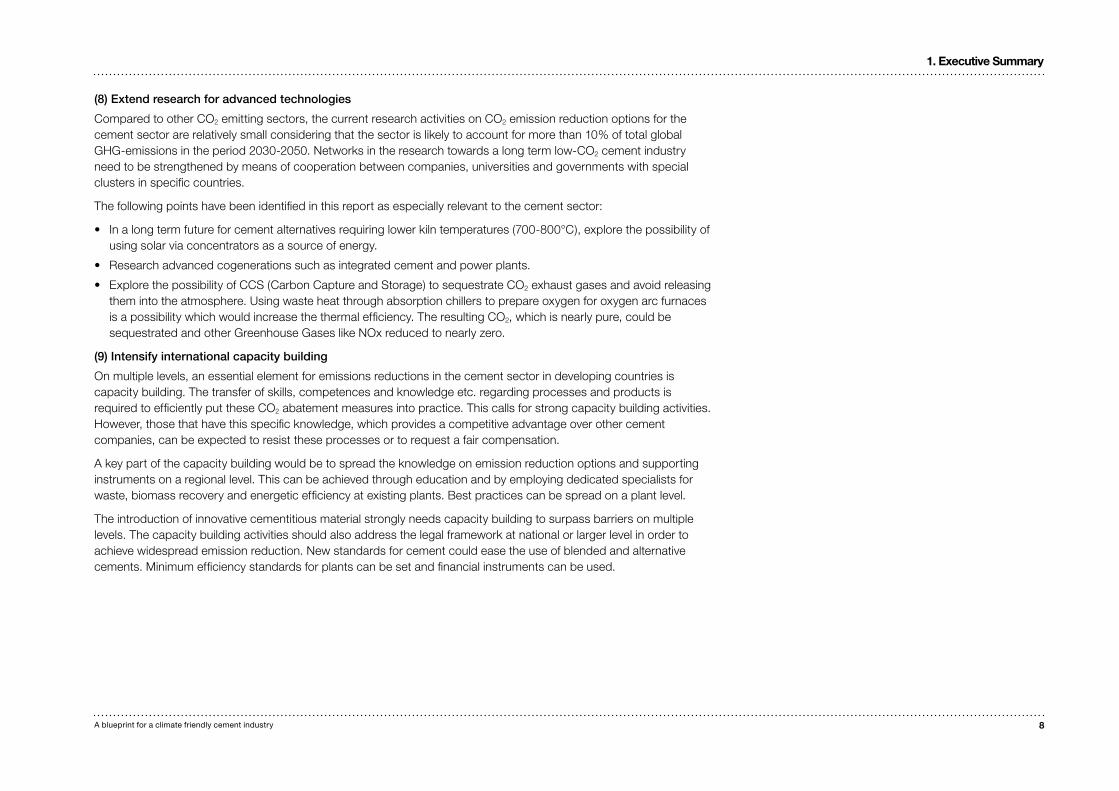
(8) Extend research for advanced technologies
Compared to other CO2 emitting sectors, the current research activities on CO2 emission reduction options for the cement sector are relatively small considering that the sector is likely to account for more than 10% of total global GHG-emissions in the period 2030-2050. Networks in the research towards a long term low-CO2 cement industry need to be strengthened by means of cooperation between companies, universities and governments with special clusters in specific countries.
The following points have been identified in this report as especially relevant to the cement sector:
In a long term future for cement alternatives requiring lower kiln temperatures (700-800°C), explore the possibility of •using solar via concentrators as a source of energy.
Research advanced cogenerations such as integrated cement and power plants.•
Explore the possibility of CCS (Carbon Capture and Storage) to sequestrate CO• 2 exhaust gases and avoid releasing them into the atmosphere. Using waste heat through absorption chillers to prepare oxygen for oxygen arc furnaces is a possibility which would increase the thermal efficiency. The resulting CO2, which is nearly pure, could be sequestrated and other Greenhouse Gases like NOx reduced to nearly zero.
(9) Intensify international capacity building
On multiple levels, an essential element for emissions reductions in the cement sector in developing countries is capacity building. The transfer of skills, competences and knowledge etc. regarding processes and products is required to efficiently put these CO2 abatement measures into practice. This calls for strong capacity building activities. However, those that have this specific knowledge, which provides a competitive advantage over other cement companies, can be expected to resist these processes or to request a fair compensation.
A key part of the capacity building would be to spread the knowledge on emission reduction options and supporting instruments on a regional level. This can be achieved through education and by employing dedicated specialists for waste, biomass recovery and energetic efficiency at existing plants. Best practices can be spread on a plant level.
The introduction of innovative cementitious material strongly needs capacity building to surpass barriers on multiple levels. The capacity building activities should also address the legal framework at national or larger level in order to achieve widespread emission reduction. New standards for cement could ease the use of blended and alternative cements. Minimum efficiency standards for plants can be set and financial instruments can be used.

1. Executive Summary
9A blueprint for a climate friendly cement industry
Table 1.b Potential: policies and measures to reach the emissions goals
Potential action Stakeholders Timeframe
(1) Implement a global sectoral approach for the cement industry
Cement companies / NGOs
Countries
UNFCC
Short and medium term
(2) Expand the scope of CO2 reductions by starting to integrate a CO2 reduction consulting service in the companies
Cement companies
NGOs
Short term
(3) Improve the framework for the use and the availability of substitution material
Cement companies
Industrial producers of substitution material
Medium term
(4) Set up a goal for a growing share of biomass On the basis of internal goals and / or on a voluntary agreement for specific regions of the world.
Cement companies
Developing countries
NGOs
Medium and long term
(5) Update standards for cements to allow a maximum blending of cements with clinker substitutes in all countries and allow alternative cementitious materials
Cement associations
Cement companies
Countries
Short and medium term
(6) Create new international policy instruments on the construction sector in order to promote a low CO2 path of the construction sector
Cement companies
Producers of substitute an additives for cement
National governments
Long term goal
(7) Establish market based instruments on the national level such as fuel taxes or a cap and trade system.
Countries
Cement companies
Medium and short term
(8) Extend research for advanced technologies for long term CO2 decrease: Solar concentrators, Oxygen arc-furnace with CCS, solar air preheater, advanced cogenerations
Cement companies
Governments
Research institutes
Long term
(9) Intensify international capacity building
Spread the knowledge about possible reduction CO2 opportunities across the cement, concrete and building materials chain, including on a local level (producers, users, etc.).
Provide advisory capacity on improvements on the legal frame.
International institutions
Developing countries
Annex 1 countries
Major cement companies
Short and medium term
10A blueprint for a climate friendly cement industry
2. Introduction
2. Introduction
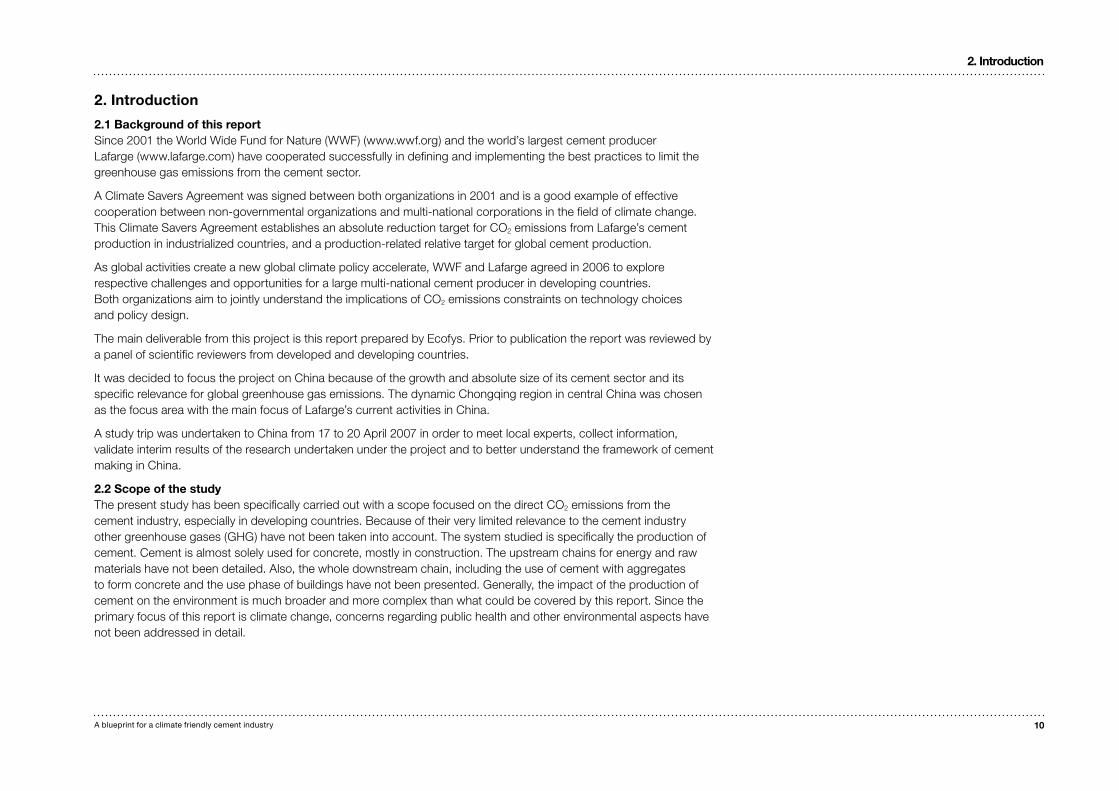
2.1 Background of this report Since 2001 the World Wide Fund for Nature (WWF) (www.wwf.org) and the world’s largest cement producer Lafarge (www.lafarge.com) have cooperated successfully in defining and implementing the best practices to limit the greenhouse gas emissions from the cement sector.
A Climate Savers Agreement was signed between both organizations in 2001 and is a good example of effective cooperation between non-governmental organizations and multi-national corporations in the field of climate change. This Climate Savers Agreement establishes an absolute reduction target for CO2 emissions from Lafarge’s cement production in industrialized countries, and a production-related relative target for global cement production.
As global activities create a new global climate policy accelerate, WWF and Lafarge agreed in 2006 to explore respective challenges and opportunities for a large multi-national cement producer in developing countries. Both organizations aim to jointly understand the implications of CO2 emissions constraints on technology choices and policy design.
The main deliverable from this project is this report prepared by Ecofys. Prior to publication the report was reviewed by a panel of scientific reviewers from developed and developing countries.
It was decided to focus the project on China because of the growth and absolute size of its cement sector and its specific relevance for global greenhouse gas emissions. The dynamic Chongqing region in central China was chosen as the focus area with the main focus of Lafarge’s current activities in China.
A study trip was undertaken to China from 17 to 20 April 2007 in order to meet local experts, collect information, validate interim results of the research undertaken under the project and to better understand the framework of cement making in China.
2.2 Scope of the studyThe present study has been specifically carried out with a scope focused on the direct CO2 emissions from the cement industry, especially in developing countries. Because of their very limited relevance to the cement industry other greenhouse gases (GHG) have not been taken into account. The system studied is specifically the production of cement. Cement is almost solely used for concrete, mostly in construction. The upstream chains for energy and raw materials have not been detailed. Also, the whole downstream chain, including the use of cement with aggregates to form concrete and the use phase of buildings have not been presented. Generally, the impact of the production of cement on the environment is much broader and more complex than what could be covered by this report. Since the primary focus of this report is climate change, concerns regarding public health and other environmental aspects have not been addressed in detail.

11A blueprint for a climate friendly cement industry
Figure 2.a Past, present and forecasted cement production. (Mt / year produced: records and estimates) [1]
Other developing countries
OECD, other industrial nations and transition economies
China
India
1970 20502040203020202010200019901980
0
1,000
2,000
3,000
4,000
5,000
6,000
Projection
2. Introduction
2.3 Global emission and production scenarios Cement is the key ingredient to the production of concrete. Concrete has been the most important construction material for the 20th century and it is very likely that it will continue to play that role throughout the 21st century. Concrete buildings, bridges, sewers and dams illustrate in an obvious way the connection between concrete and human development. Concrete is a core part of development as it provides improved housing as well as a substantial portion of the necessary infrastructure for all the rest of the economy, and is, very important in the early stage of a country’s development. Cement, which is the key component for the production of concrete, is of special importance for developing countries.
Using newly corrected forecasts from a baseline scenario [7] established by the International Energy Agency (IEA), Figure 2.a has been established to give an overview of the cement demand, based on past records, present trends and forecasts. Figure 2.a shows that the world cement production increased from 1,174 Mt [8] in 1990 to 2,310 Mt [9] in 2005. This represents an annual growth rate of over 6% [1] over the last 15 years. This time span also corresponds to a period of strong economic growth worldwide.
Figure 2.a also illustrates the uneven growth between industrialized and developing countries.
Together, all industrialized countries, accounted for less than 25% of the world cement production in 2005 and their average annual growth rate was well below 2% [10]. The same year, the share of Asian cement production in the world reached 68% [11]. The strongest increase in the demand for cement has been observed in the most populated regions of the world [12]. This has especially been the case in China, which is also one of the fastest growing economies. As the forecast indicates, a similar increase in cement demand is expected in India where a comparably strong economic growth is predicted.
This evolution displays a quite stable demand in countries which have reached a certain level of wealth, while the developing countries show a cement demand reflecting the strong growth of their economy (Figure 2.b).
Based on past data, the relation between GDP per capita and demand for cement can be well described. A common pattern has been observed for countries which are now developed and it is very likely that the same model will be proven right again in the case of developing countries. According to this pattern, the cement demand grows proportionally to the GDP until a certain inflexion point. Below this point, the demand remains stable or even decreases. This de-correlation between GDP and cement demand occurs at $15,000 GDP PPP (purchasing power parity) per inhabitant (expressed in 2005 $) [13].
Accordingly the demand for cement in developed countries is expected to grow very slowly, at a rate which is expected to be of 1.2% through 2030 [14]. Their cumulated global population of about 1.1 billion inhabitants [15] is expected to remain almost stable.

12A blueprint for a climate friendly cement industry
2. Introduction
Figure 2.b The relation between cement demand and GDP PPP per capita
15,000
Time
GDP PPP per capita in 2005 $
Development phase:The cement demand grows
almost proportional to the wealth.
Developed economies:The cement demand is almost stable and varies according to
economic cycles.
Developing countries with large populations are expected to exhibit further growth in both income level and population, especially in Southern Asia. Their GDP is well under the stabilization line for cement demand, which means their demand will further increase. Even if a long-term stabilization of the cement production in developing countries is predicted, as it was the case with industrialized countries, this global stabilization is unlikely to occur before 2050. By then, the output level is expected to be more than twice the current levels. Future stabilization and decrease in the Chinese cement demand would not stabilize the global cement production. Several other developing countries are expected to see a massive expansion of their cement markets, thereby driving the continuous global increase.
Emission scenarios are required to predict the impact of the cement industry on global levels of greenhouse gases emissions. Such forecasts are based on present demographic, economic, sociologic and technologic facts and trends. Nevertheless, since national and international governmental action and the state of the world economy can strongly influence the course of events such projections exhibit significant uncertainties. However, they are helpful to understand what future activities would be like without intervention. Such a conservative scenario is generally called “Baseline Scenario” or “Business As Usual”. This type of scenario assumes, for example, a naturally slow shift to advanced technologies due to their increased availability and affordability. As such, it is different from a scenario with “frozen technology”, which assumes that today’s efficiency level will remain constant in the future. Furthermore the BAU (Business As Usual) scenario relies on the assumption that there is an absence of major technological breakthroughs.
Based on existing literature Figure 2.c on the following page illustrates a simple projection of future cement production until 2030, and a set of scenarios for related CO2 emissions.
Due to its relevance for present and future production, China deserves specific emphasis. China accounted for more than 45% of the world production in 2006, with 1,240 Mt [16] produced, up from 221 Mt [17] in 1990.
Table 2.a Past, present, and forecasted cement production [18]
1990 2002 2010 2020 2030
Cement output (Gt / yr )
Worldwide 1.17 1.80 3.17 4.41 5.00
In China 0.21 0.72 1.48 1.85 1.60
Nevertheless other developing countries in Asia, Latin America and Africa are also expected to experience strong increases in both production and emissions. More than one third of the cement production capacity added between 2000 and 2020 is expected to be in China (+600 Mt / yr). In order to extend their production capacity in developing countries, China and India are going to build a substantial number of new cement plants. Moreover, many of the countries will replace aged plants with modern ones, which feature a higher level of efficiency. In turn, the number of new cement plants to be built will be the sum of the capacity to add and replace. Even in the Business as Usual Scenario, the newly erected cement plants are expected to be more efficient than the ones currently installed. This will be reflected in the emissions factor (Table 2.b). specifying the amount of CO2 released through the production of one tonne of cement.

13A blueprint for a climate friendly cement industry
2. Introduction
Figure 2.c Emission scenarios through 2030 [23] Values expressed in Gt CO2 emitted and Gt cement produced)
Frozen technology
Active Policy (example)
BAU (Business As Usual)
2002 2030202620222018201420102006
0
1.00
2.00
3.00
4.00
5.00
Cement production
Table 2.b Past, present, and forecasted cement emission factors [19]
1990 2002 2010 2020 2030
Cement emission factor (t CO2 / t)
World BAU 0.94 0.89 0.87 0.85 0.81
China BAU 0.95 0.89 0.85 0.78 0.76
Based on the emission factors and production forecasts, the CO2 emissions of the cement sector have been estimated until 2030. Through a decreasing emission factor, the total of 0.6 Gt / yr CO2 equivalents will be avoided worldwide in the BAU scenario [20]. Nevertheless, the whole cement sector would still emit 4.0 Gt / yr in CO2 emissions by 2030. This is more than three times the 1990 value. The cement production contributed to about 8% of global anthropogenic CO2 emissions in 2005 [4] (Table 2.c), [21] or roughly 6% of world total anthropogenic greenhouse gas emissions. Nearly 50% of the cement-related CO2 emissions were emitted in China [22].
Table 2.c Past, present, and forecasted global and cement related CO2 emissions (in Gt) [23]
1990 2002 2010 2020 2030
CO2 emissions (Gt / yr)
World 21.2 24.1 30.4 36.8 43.7
China 2.2 3.3 6.4 8.2 10.7
Cement Worldwide
1.10 1.60 2.76 3.75 4.03
Cement in China 0.20 0.64 1.26 1.44 1.22
The cement sector accounted for about 18% of the CO2 emissions in China in 2006 [24]. The increase of the CO2 emissions due to the cement sector in China is significant. Under BAU (Business As Usual) the CO2 emissions of the Chinese cement industry will have increased by over 100% from 2002 to 2020 and will have added 0.8 Gt CO2 per year by 2020. Between 2002 and 2030, the increase in cement production worldwide would account for 17% in the rise of CO2 emissions.
These figures outline the global importance of the cement sector for present CO2 emissions. They also show the relevance of the CO2 emissions of the cement sector in developing countries. The rapidly increasing contribution of developing countries to the world’s CO2 emissions also becomes obvious in these figures.

14A blueprint for a climate friendly cement industry
2. Introduction
Figure 2.d Past present and forecasted sources of fossil CO2 emissions (in Gt / year) Based on Table 2.c
Cement in China
Rest of the World – other sources
Rest of the World: Cement
China – other sources
0 30252015105
2030
2020
2010
2002
1990
Gt CO2 / year
Figure 2.e Mitigation scenario at 450 ppm vs. future cement emissions (in Gt CO2 / year)
0
5
10
15
20
25
30
35
40
45
1990 205020402030202020102000
Gt CO2 / year
450 ppm mitigation path
Global emissions from the cement sectorunder Business As Usual
2.4 Cement in global mitigation scenarioAs assessed in the Stern Report there is still time to avoid the worst impacts of climate change. Mitigation of climate change to a 2°C temperature increase would require a stabilization of the CO2 concentration in the atmosphere around 450 ppm (parts per) [25]. This can be translated into a worldwide stabilization of CO2 emissions 40% over 1990 levels followed by a significant decrease. At the same time under the present scenario for cement production, 2030 emission levels would be around 330% what they were in 1990. Emissions from the cement sector would then grow until 2050 and reach 4.3 Gt / year [26].
As displayed in Figure 2.e the present emissions scenario for the cement sector under Business As Usual (BAU) contradicts the required path to limit CO2 emissions. As a result, further efforts from the cement sector will be required to help to stabilize or reduce the greenhouse gases emissions. This is especially true for developing countries where the almost complete increase of cement-related emissions will take place. Consequently, the cement sector in developing countries deserves a priority in consideration in order to prevent climate change.
2.5 Evolving climate policy frameworkThe Kyoto Protocol is presently the only international climate agreement which includes a mandatory emissions target for some countries. It will expire in 2012 and negotiations between countries have already started in order to decide on future climate policy [27]. Presently, there is no certainty about the final outcomes of the discussions. In turn, the future of climate action on a global level is still unknown.
Stabilization pathways for the concentration of greenhouse gases like the 450 ppm (cf. Figure 2.e) are aimed to limit the temperature increase to 2°C. In order to achieve this global target it has to be split between individual entities. Each of them needs to be given a clear assignment. Mitigating climate change bears strong advantages which are of global dimension [28] while the perception of the cost for action might be local. This is why the share of the burden is presently one of the main points fueling the debate between countries. This is further complicated by the large disparities in wealth, growth, technology, resources and emissions [29]. A majority of the cement industry production is located in emerging economies. Sharing the burden, partly based on the development status of countries, might therefore have an influence on the sector (Figure 2.d).
Table 2.d Country differentiation
Developing countries: Emerging countries: Developed countries:
< 20% of the world cement production (in 2006)
> 60% of the world cement production (in 2006)
< 20% of the world cement production (in 2006)
• lowGDP/capita
• lowemissions/capita;
• loweraccesstotechnologiesandfinancing to curb their emissions
• averageGDP/capita;fastGDPgrowth
• averageemissions/capita;fastgrowofemissions
• limitedavailabilityoftechnologiesandfinancing to limit climate change
• highGDP/capita
• highemissions/capita
• highavailabilityoftechnologiesandfinancing to limit climate change
• nearlystableemissions

15A blueprint for a climate friendly cement industry
2. Introduction
Figure 2.f Common but Differentiated Convergence (CDC) of countries per capita GHG emissions
Developed countries
Worldwide average GHG emissions per capita
Developing countries
Emerging economies
GHG emissions per capita in:
Time
GHG / capita
Threshold
Figure 2.g Multistage Approach: mitigation steps at levels of development
No commitments
e.g. sustainabledevelopment policies
and measures
e.g. slowing ofemission growth
Absolute reductions
Development leads to a move to the next category
Different concepts have been designed to fairly share the burden between groups of countries, especially in developed, emerging, and developing countries. A concept called CDC (Common but Differentiated Convergence) depicted in Figure 2.g takes the present disparities regarding the level of wealth, growth and emissions per capita into account [30].
In CDC, absolute emission reductions are assigned to developed countries which have the highest per capita emissions [31]. The least developed countries (as it is presently the case in Annex 1) countries do not have emissions targets, since their main goal is still their economic development. Nevertheless, financing from developed countries through carbon markets is likely to help them develop, on a low carbon path. In this scenario, emerging countries have the target to decrease their carbon intensity while pursuing their growth. At a more advanced level of development, their assignment is to stabilize their CO2 emissions. The dynamic of the development has to be considered since several emerging countries are developing at fast rates. Some of them are likely to reach a development level close to the present level of developed countries during certain decades. This leads to the next concept called the Multistage Approach [32] (Figure 2.h).
Under this concept the contribution of countries regarding the mitigation of climate change is differentiated according to their level of development. This differentiation leads to different types of targets, ranging from “no commitments” for the least advanced countries to an “absolute emission reductions”, for the most developed countries. As each category has a different type of target, the countries’ development leads them to the next category with a higher level of commitment. Moreover, it is possible in this concept to set and evaluate the progress of a country in climate protection in a fair way by comparing them with a set of countries at the same level of development [33].
In addition to the country-based sharing of the burden, a sectoral approach [34] could also address energy-intensive industrial sectors and define emission targets as a function of their respective output. For the cement sector, this target could be in t CO2 emitted per tonne of cement or cement clinker produced on a country or regional basis and established through benchmarking. In this approach, risks of competition distortion can be reduced as well as the amount of the problematic burden sharing by country. This is especially achievable since the cement sector in most countries features a limited number of market players. Moreover, the technologies are largely shared worldwide. In turn, a convergence to the best possible technology, the best practices and the best achievable efficiency is possible.
The cement industry is already familiar with the flexible mechanisms of the Kyoto Protocol, which expires in 2012. Discussions regarding a future global climate agreement under the umbrella of the UNFCCC include options under which existing flexible mechanisms are likely to continue to exist, albeit at a greater level of complexity. The successor to the Kyoto Protocol will face the challenge of adapting, combining and enhancing tools such as the Clean Development Mechanism (CDM). Until now, the CDM tool financed investments in solutions which would generate lower emissions than the Business As Usual (BAU) case. In the future, “no-lose” sectoral targets, as developed by the Center for Clean Air Policy (CCAP) [35] might change this scheme (Figure 2.i).

16A blueprint for a climate friendly cement industry
Figure 2.h Simplified sectoral no-lose targets [36]
Time
CO2 intensity (tCO2/t cement)
BAU
Contribution tothe atmosphere
“No lose”sectoral target
Tradable allowances
Real emissions
2. Introduction
According to the CCAP, emissions reduction projects would only qualify if they reduced emissions below the sectoral target. Only the difference between the real emissions and the sectoral target would be tradable. The difference between the BAU scenario and the sectoral target would be an emissions reduction originating from the developing country and would not be tradable as a substitute for an emission reduction in developed countries. The no-lose target (e.g. in t CO2 / t cement for the cement sector) would reflect the CO2 intensity target in key industrial sectors in developing countries.
The present trading periods of the Kyoto Protocol introduced new tools to reduce CO2 emissions of the cement companies. In 2006, the cement sector represented 8% of the CO2 emissions and in 2020 this share will be over 10% [37]. Nevertheless only 4.6% of CDM projects under the Kyoto Protocol have been in the cement sector and generated only 3.1% of all credits [38]. Cement companies generally did not generate CO2 reductions in developing and emerging countries using tools like CDM on the cement sector. Instead, their emissions have been reduced through investments on various other projects. Globally there is a large potential to generate further emission reductions from the cement sector.
Over 80% of all new cement plants will be built in emerging and developing countries in the coming 40 years [39]. For this reason, participation of developing countries and emerging economies in future climate policy is a key element to curb emissions from the cement sector. A possible start for this participation could be in the form of a gradual obligation of performance through intensity targets. This would allow improvement of sector and rewarding of climate efforts regarding technologies and practices in developing countries.
A sufficient linkage to other market segments for global cement companies is nevertheless important. This is because an absolute target might apply to developed countries which are less than 17% of the cement production while the largest potential to decrease emissions is in the developing countries. As such, the removal of this barrier will be a challenge.
The successor to the Kyoto Protocol will have the task to reward pro active climate friendly policies on the part of companies and due to its relevance, a special effort on the cement sector is to be considered. To remove the uncertainty which is a barrier on the market, future climate policy can be designed compatible to the Kyoto Protocol and provide more certainty for the long term investments required.
It is frequently argued in favour of making the shift to a low carbon path as soon as possible since efforts in the future on established or frozen schemes will probably be more difficult or more expensive. In this regard, efforts have to begin even before 2012 since the 2007-2012 period will experience a 30% increase in global cement production [40].

17A blueprint for a climate friendly cement industry
3. Cement production and emission reduction options
3. Cement production and emission reduction options
3.1 Cement productionThe basic manufacturing process of Portland cement consists of the following steps (Figure 3.a):
First, raw materials, (mostly limestone) are extracted at a local quarry (1) or transported to the site from another location. Then, these materials are transported to a crusher which transforms them into smaller particles (4). Following this, the various raw materials are stored on a pile or in a silo to be homogenized (5) in order to avoid unexpected changes in their composition. The mixed raw material is then ground together (6) and from this step forward on called cement.
From there, the cement material temperature progressively increases through different steps until it reaches extreme temperatures of over 1450°C in the kiln (9). At this point the calcinations and sintering reactions take place, creating the clinker. The clinker is then cooled down to 100 to 200°C (10) and stored in a buffer (11). Through the addition of 5% gypsum (12) and sometimes other materials, it then becomes what is called cement. In order to be ready for further usage, the cement goes through a fine finish grinding (13) and is finally either stored or dispatched (14).
The finished cement costs between $40 to $100 per tonne. Due to the transportation cost, inland cement plants generally have a market limited to the 200-300 km surrounding the production site.
Figure 3.b gives an overview of the production of Ordinary Portland Cement.
3.2 CO2 impact of cement productionIt is estimated that the production of one tonne of cement released on average 0.87 tonne of CO2 in 2000 [42]. This value nevertheless ranged from 0.73 to 0.99 t CO2 / t cement between different regions of the world [43]. In 2005, the world average was 0.83 with a range of 0.65 to 0.92 t CO2 / t cement [44].
Among the major producing countries, the highest performance were achieved in Japan and Brazil while the USA had an aged and very CO2 intensive cement industry [45]. Western Europe’s cement-related emissions were 0.84 t CO2 / t cement in 2005 [46]. China, with almost half of the worldwide production capacity, emitted 0.89 t CO2 / t cement in 2002 [47]. In comparison to the best achievable standards, this suggests that there is significant potential for emission reductions with regard to the Japanese and Brazilian cement industries [48].
Different sources of CO2 are associated with the production of one tonne of cement and can make contributions to reduce the CO2 emissions. The largest component of Ordinary Portland Cement (OPC) is clinker which makes up to 95% of the cement. It is produced in the cement kiln and around 5% of gypsum is added to create the desired quality. Other types of cement are comprised of a smaller share of clinker and larger shares of admixtures. Therefore, values expressed per tonne of cement or clinker are not always equivalent and the clinker to cement ratio can be used to explain differences.
Raw Material Preparation
Clinker Making Finishing
Quarrying & Mining Material
Preparing Kiln Fuels
Crushing & Drying Additives (gypsum,
fly ash, etc.)
Grinding & Homogenising
Material
Clinker Production
(Pyro-processing)
Finish Grinding
Bagging and transport
cement
preparedraw materials fuels
Figure 3.a Portland cement dry and wet manufacturing processes [41]
Figure 3.a Portland cement dry and wet manufacturing processes [41]
raw meal
clinker

18A blueprint for a climate friendly cement industry
Figure 3.c Worldwide average CO2 sources in the Ordinary Portland Cement (OPC) production process – process considered: average new dry rotary kiln with preheater / precalciner [49]
Transportation: 5%
Electricity: 5%
Calcination: 50% Thermal energy: 40%
Energy for the calcination
reaction: 22% Heat lossesUnavoidable for OPC
Figure 3.d Comparative thermal energy consumption of different kiln technologies [53, 54]
Average in Japan
Energy intensity (MJ / tonne clinker)Kiln Type Additional information
Best performance (large)
New dry Average (large & medium)
Without precalciner (small)
LongWet process
Lepol
Dry process
Shaft
Dry Hollow
2,950
3,300
4,000
5,000-6,700
6,270-8,360
3,100-6,500
5,000
3,300-5,200
3. Cement production and emission reduction options
The clinker to cement ratio is defined as: CR =Clinker (t)Cement (t)
A major difference between the cement industry and most other industries is that fuel consumption is not the dominating driver of CO2 emissions from cement production. In fact, generally most emitted CO2 does not come from fuel oxidation (Figure 3.c):
Around 50% of the CO2 released during the manufacturing of cement is due to calcinations in which limestone (CaCO3) is transformed into lime (CaO) in following reaction: CaCO3 ➝ CaO + CO2, releasing CO2.
About 40% of the CO2 emitted during cement manufacturing is the result of burning fuel to provide the thermal energy necessary for calcination to occur. Kilns in which the reaction happens are heated to 1,450°C. The reaction requires 1,700 MJ / t [50] which cannot be decreased. Typically energy in the cement industry accounts for 30 to 50% of the production costs [51].
Some 5% of the CO2 emissions are indirect since they are the result of the use of electricity to operate the plant. The consumed electricity is on average 100 to 110 kWh / t cement (in China and OECD Europe) [52]. The share of CO2 emissions from the use of electricity is on average 5%. According to the energy source and the efficiency at which it is used in the local electricity mix, this figure can vary from less than 1% to over 10%.
Some 5% of the CO2 are emitted by diverse needs resulting from quarry mining and transportation.
3.3 Process energy efficiency3.3.1 Kilns
The kiln is the key infrastructure of a cement plant. It is a huge furnace where the cement clinker is made. It is supplied by the raw mix and energy delivered in the form of an intense flame. The flame reaches temperatures above 1,850°C and the raw material of 1,450°C. The efficiency of a kiln is mainly determined by the design of the process. Different kiln technologies exist and have different levels of performance. A kiln has a typical lifetime that can reach 50 years. A large number of kilns in operation were built decades. As a result, the present average kiln efficiency level in a country is not representative of current worldwide best practices; rather, it reflects a country’s industrial and technological history. A set of international best practices and best efficiencies is now largely shared worldwide through the presence of global companies in the field of plant engineering and cement production.
Figure 3.d presents a number of different cement kiln technologies available and provides a comparison of their thermal energy consumption in MJ / tonne clinker.
Under most circumstances new large dry kilns are the most efficient option, consuming on average 2,950 MJ of heat energy per tonne of clinker. For the time being the best possible energy efficiency is at around 2,700 MJ / tonne clinker [55].

19A blueprint for a climate friendly cement industry
Figure 3.e Inside of a new dry kiln [57]
Figure 3.fCompared energy intensity of the cement production for selected regions of the world [53]
Energy intensity (MJ / t clinker)Country Year
China2000
India
2006
Former Soviet Union
United States
2000
2000
2000
Japan
Western Europe
Brazil
2000
2000
2000
4,710
As a comparison: best achievable performance through new dry kiln equipped with preheater / precalciner in 2000
2,950
3,940
4,710
5,520
5,500
3,100
4,040
3,600
3. Cement production and emission reduction options
The size of the kiln plays a role and larger kilns like the ones producing 5,000 tpd (tonnes per day) are more efficient. Not surprisingly, there are limits to the size of the kiln:
Modern kilns have a diameter of 6 m and length up to 100 meters (Figure 3.e). Any larger kiln would bend too much •under its own weight leading to cracks in the brittle refractory material. This means that due to constraints we have already reached technical limits [56].
Transportation of raw materials and to markets are another limit: therefore, the choice of site is very important. Small •kilns are only justified in small and remote local markets (e.g. Himalayan areas) where transportation is difficult and the population density is low.
Use of the most modern kiln technology represents an obvious choice to reduce the energy required by the process. This clearly stresses the need for the adoption of the best possible new dry kilns of large size equipped with preheaters and precalciners. A failure to do so by adopting less advanced technologies increases the environmental pollution, releases more greenhouse gases and is much more energy intensive. In turn the related cost over the complete plant lifetime will by far exceed the short term reduction of investment costs for a cheaper plant.
Nevertheless, not all kilns built recently will reach optimal performance. This is often due to the use of lower-cost domestically produced technologies. The case of refractory materials used to realize the thermal insulation of the kiln perfectly illustrates this problem. Upgrading to a state of the art refractory material can save up to 500 MJ / tonne clinker [58]. Compared to foreign companies, developing countries like China often have less efficient refractory materials. Therefore, industrial cooperation in every possible form should be encouraged and the upgrade to a more efficient material systematically done, since it can be funded by emission reduction projects. Banning the construction of low efficiency kilns is one of the easiest solutions. This can be achieved through permitting procedures or setting minimum standards.
The specific situation for some of the major producer countries (Figure 3.f) can be described [59]:
China recently built several large new kilns at 3,500 to 3,000 MJ / t clinker, however, not all of them achieve the best possible efficiency. Till the mid 1980´s, small and inefficient shaft kilns produced around 80% of the clinker. Most of them are still operating. Due to their very small size they have an average consumption as high as 6,100 MJ / t.
Former Soviet Republics, especially Russia and Ukraine, still produce the majority of the cement with wet processes. This is due to the local specificity that local limestone has very high moisture content.
Japan has the most efficient cement industry, thanks to a vast majority of new dry kilns, 85% of which feature preheaters and precalciners. All other technologies have been phased out. The energy intensity is 3,100 MJ / t clinker.

20A blueprint for a climate friendly cement industry
Figure 3.gHeat consumption at cement plants [60]
Energy for the calcination reaction: 1,700 MJ/t clinker
Heat losses
Other heat losses (heat leaks)
Heat losses in the exhausted hot flue gases (over 300°C)
Heat consumption of 3300 MJ/t clinker
Figure 3.h Multistage preheater at the upper end of a kiln [62]
Figure 3.i Energy losses due to the moisture content entering the kiln.
Q: Energy
T (ºC)
330
100
35
Non-recovered heat from the moisture content: heating up to 100°c+ evaporation+ heating of water steam to 330°C
Recoverable part from the moisture content:cooling down from 1450°C to 330°C
Evaporation
3. Cement production and emission reduction options
Brazil has seen a rapid economical growth in the recent years, which led to the construction of several new plants using very recent technologies.
North America and parts of western Europe had an early industrialization and are home to a large number of aged plants from times when energy efficiency was not a major concern. Improvements done at plants have often shown limited results. These economies are therefore a typical example of what can be called the “lock in” effect.
3.3.2 Preheater and precalciner
Figure 3.g indicates the breakdown of the heat consumption of a cement plant.
Since a large share of the consumed heat goes to losses, improving the heat efficiency and recovery is important. This is accomplished by using preheaters. A preheater (Figure 3.h) is a form of heat exchanger in which raw mix for the cement is heated by the hot exhaust gases leaving the kiln. As a result, less thermal energy is needed in the kiln itself to reach the required 1,450°C. Modern gas suspension preheaters consist of 1 to 6 stages (typically 4) and can precalcine 20% of the feed. Beyond 6 stages, the consumption from fans of this process would be unviable compared to the little gain resulting [61]. It appears that the limit of this technology has been reached.
Precalciners typically burn between 40% and 60% of the fuel at the entrance of the preheater and increase the temperature of the raw mix entering the kiln up to 1,000°C. This raw mix is then precalcinated to more than 90% before it enters the rotary kiln. In turn, the specific daily output for a kiln is increased.
Nowadays, both preheaters and precalciners both equip almost all newly built cement plants. Existing plants can also be upgraded with these technologies to achieve a higher thermal efficiency. It is projected that a shift to preheaters / precalciners will provide 0.6 Gt CO2 reductions by 2030 [63], mostly in China. This means that without further reduction measures, the CO2 intensity will decrease through the use of these more efficient processes.
In order to avoid reducing the amount of moisture which drives up the energy demand of the kiln (Figure 3.i) additional drying of the raw materials is often carried out. This can be done at very low costs using the hot exhaust gases or even solar radiation, which is abundant in most developing countries. Even the air entering the kiln can be condensed and preheated to reduce the moisture content to a minimum.
3.3.3 Grinding and blending
Several steps in cement manufacturing require mechanical energy. In these steps, the material flow is prepared by either grinding or blending processes. The first one is the preparation of untreated material in which limestone and other raw materials from a quarry, and are reduced to powder before entering the kiln. The second one, “blending clinkering and cooling” includes the operation of the kiln as well as the admixing of additives to the clinker. The third one called “finish grinding” occurs after the kiln since the sintering agglomerates the clinker.

21A blueprint for a climate friendly cement industry
Figure 3.j Electricity consumption at Brazilian cement plants: average breakdown [64]
Preparation and grinding untreated material 32%
Blending clinkering kiln and cooling 21%
Finish grinding 41%
Diverse 6%
Figure 3.kSwitch to efficient grinding and blending (efficient technologies [65] compared to strongly outdated technologies [66])
Electrical consumption (kWh / t clinker)Process Technology
Raw material grinding
Center discharge tube mill
Best roller press with static V separator
Finish grinding
Tube mill in close circuit
Efficient roller mill
17-20
-54% power consumed
36.5
22.1
8.6
-40% power consumed
3. Cement production and emission reduction options
The mechanical energy required to grind the limestone, or blend the mix, is supplied by electrical motors. As a result, the CO2 emissions related to the grinding are mostly indirect and related to the use of electricity. Three factors influence the related CO2 emissions:
efficiency of the process•
efficiency of the electrical motors and drive systems•
CO• 2 intensity of the fuel mix used to generate the electricity in a given region.
Nevertheless, the following opportunities have been identified to reduce their carbon-related emissions:
In cooperation with the local electricity supplier, buy and promote the use of cleaner sources of electricity such as •renewable energies.
Manage the grinding by running at maximum capacity during off-peak hours, thus decreasing the electricity demand •of the grinding process, as well as the demand in energy intensive peak power supply. Buffers for the grinded material should be encouraged.
Improved grinding methods such as the EMC (Energetically Modified Method) do not reduce the energy demand at •their own level. Nevertheless the subsequent need for limestone-based clinker is decreased, which in turn results in a decline of CO2 emissions.
Equip new cement plants or retrofit older ones with the most efficient technology presently on the market. •A possibility is to switch to roll ball high efficiency roller mill (see Figure 3.k). If done at the right time, such improvements can even increase the financial viability of a plant.
Grinding is still a very inefficient step with 95% of the energy transformed into waste heat. Advanced grinding technologies using ultrasounds, laser, thermal shocks or cryogenic will need further development [67].
3.3.4 Transportation
Although transportation represents only roughly 5% of cement related emissions (see Figure 3.c), it warrants consideration in integrated greenhouse gas reduction strategies. Sites for new plants could especially be chosen along large rivers which do provide cooling for the waste heat recovery system. Possible bulk shipping would allow for a more practical supply of waste materials contributing both to fuel and clinker substitution. Furthermore, the practicality of shipping would allow a large access to other raw materials needed for the production, not only limestone but also for the diverse 20% remaining. Access to large scale boat shipping also considerably allows for potential market expansion. In turn, a plant supplying a larger market can be designed for larger capacities and will therefore feature increased efficiency. Navigation even allows a straightforward access to alternative raw materials and fuels. Globally, navigation has one of the lowest CO2 impacts [68].
Traditionally, older Chinese kilns have been located close to the users in the cities instead of being close to best suited limestone quarry. In turn, this has contributed to high levels of pollution in cities as well, as local road and railway congestion.

22A blueprint for a climate friendly cement industry
Figure 3.lDifferent carbon intensities according to the electricity mix [73]
Carbon intensity of the electricity mix (kg CO2 / kWh)
China
India
Brazil
0.851
0.942
0.085
Figure 3.mConsumed energy (pro t clinker) e.g. modern plant in a coal intensive country.
86 kWh electricityproduced (consumption + grid losses)
930 MJ primary energy(coal or heavy oil) when generated by fossil fuels
3,300 MJ thermal energy
3,300 MJ primary energy (coal or heavy oil)
80 kWh electricity
3. Cement production and emission reduction options
Transportation-related CO2 emissions at or to the plant site can be improved using conveyor systems. It is also possible to switch to biofuels for the forklifts and trucks that operate for the plant.
3.4 Electricity efficiencyThe cement industry presently consumes around 3% of the world primary energy [69]. It also consumes around 1.5% of the electricity produced worldwide [70]. Compared to the calcination reaction and combustion of fossil fuels in the kiln, the electrical consumption does not generally account for a large share of CO2 emissions related to the cement production, as already seen in Figure 3.c. Moreover, the electrical energy consumed represents only about 12% of the global energy consumption (for an average advanced kiln consuming 3,300 MJ / t clinker). Nevertheless, as already stated, new cement kilns are close to the best achievable thermal efficiency. Optimizations and reductions in the electrical consumption should therefore also be explored, and different strategies proposed.
3.4.1 Electrical consumption
New dry kilns have an average consumption of 100 kWh / t of clinker (or around 80 kWh / t of cement) with some able to achieve 80 kWh / t of clinker [77] or even less. Most of the cement plants buy 100% of their electricity from the grid. Just like coal, electricity accounts for 25 to 30% of the cement production cost [71] which gives a strong incentive to keep its consumption low. The environmental importance of electrical efficiency is not the same everywhere: in Brazil, where 80% of the electricity in the grid is generated through hydro power [72], the electricity related carbon emissions are relatively low (Figure 3.l).
By contrast, South Africa, China, India and several other developing countries heavily rely on coal for electricity generation. Their electrical efficiency is still quite low due to outdated power plants and electrical grids. Their average efficiency is often close to 30% or lower [74] while close to 45% are achievable nowadays. Moreover, the grid losses also account for 5 to 10% of the production. Cement production, which is expected to sharply increase, will add to the demand for coal generated electricity and might strongly increase CO2 emissions.
Consequently, every kWh of electricity consumed in these countries releases a large quantity of CO2 since for every unit of electricity consumed over 3 units of primary energy are used in the case of a fossil fuel generation (Figure 3.m). This also means that every reduction in the electricity consumption has the potential to save a large amount of CO2 emissions. Therefore, electrical efficiency should strongly be encouraged in these countries, since CO2 emitted per kWh is by far higher, not to mention other related pollutions or the benefits for the electrical grid. A special focus should be put on countries which could hugely benefit from reducing or optimizing this electricity consumption.
3.4.2 Waste heat recovery
Modern cement plants have exhaust gas temperatures typically close to 350°C which is not very far from the 550°C in the steam temperature of coal power generation. Potentially, this leaves many possibilities to use this waste heat in thermodynamic cycles [75] known as bottom cycle cogeneration or waste heat recovery (WHR). The recovery can reach 30% with steam turbine cycles and up to 60% using Organic Rankine Cycles (ORC) or Kalina Cycles [76].

23A blueprint for a climate friendly cement industry
3. Cement production and emission reduction options
Current efforts that concentrate on recovering this heat in order to produce electricity mainly focus on large plants (typically 1,000-4,000 tpd with some plants producing over 10,000 tpd). Thanks to scale effects, WHR on large plants is more efficient and has a lower cost per kWh. Between 20 and 45 kWh can be recovered for each tonne of cement produced. This means that globally 68 TWh could have been generated in 2003 from cement plants which is more than 0.4% of the world’s electrical consumption. This could have saved around 70 Mt of CO2 emissions [76]. The installed capacity is still comparatively very small, and has huge potential, which is expected to grow with the demand for cement.
Waste heat can also be used directly by local consumers. Residential areas, offices and diverse buildings can use the waste heat both for heating and cooling purposes. This is already the case in the Danish city of Aalborg where 15% of the city is heated by the local cement plant.
Waste heat can also be applied to industries ranging from food processes, textile and paper processing, greenhouses and aquaculture. It might even be wise to encourage specific industries to settle close to local industrial parks in order for the most suited users to receive local delivery.
Most developing countries are located in subtropical areas. For them, waste heat can also be used to produce chilled water for cooling processes and air conditioning through absorption chillers. The investment can be very low for a highly efficient result, which could reach up to 90%. The corresponding fuel emissions avoided could also be very significant.
Cogeneration strategies can clearly help reduce the environmental impact of cement production. They reduce greenhouse gas emissions and also the dependence on fossil fuels. Within the right framework, respective investments could be financially attractive [77].
3.4.3 Cement and power hybrid plants
The integration of cement and electricity generation plants is a logical result since:
The ashes produced by coal power plants can be used as a clinker substitute.1.
Cement power plants consume electrical power which comes mainly from coal power plants in 2. developing countries.
Suppressing the distance between the electricity consumer (cement plant) and the producer avoids grid 3. transmission losses and decreases grid costs.
The desulphurization of coal flue gases produces gypsum which is added to the clinker to produce cement.4.
The combination of both flue gases in one stack leads to economies of scale for their scrubbing 5. (reduction of dust, mercury, sulfur and nitrous pollutions).
The exhaust gas from the kiln is at around 330°C and can be used at a very low cost and is highly efficient in 6. preheating the water for a coal power plant.

24A blueprint for a climate friendly cement industry
3. Cement production and emission reduction options
Accordingly, new hybrid plants have been developed which benefit from the integration of both processes and are at an advanced research level. It is estimated that the CO2 emissions can be decreased by 5-10%. This is compared to separated power plant and rotary kiln, mostly through the reduction of the waste heat, and, a full use of coal ashes. Ancillary effects include a spectacular reduction of pollutants and dust in the flue gases.
3.4.4 Topping cycles
Topping cycles consist of an on-site generation, which aims at an efficient power generation, while bottom cycles are designed for the use of waste heat.
This generation is achieved by classical fossil power plants. The basic idea is to have the cement factory and the power plant on the same location in order to earn the benefits from the interaction between cement production and electricity generation (as described in 3.4.3). As a result, grid losses to supply the cement plant (which typically consume 30 to 60 MW) are reduced from 5-10% to nearly zero. The stability of the electrical supply is increased, especially in countries where power outages are frequent. This contributes highly to efficiency since restarting the kiln after it has cooled down is very energy intensive. As a result of onsite power, the kiln utilization and efficiency can increase drastically. The ashes from the combustion of coal, which are produced continuously and in large quantities, can be blended to the cement. Their transportation cost is also reduced to nearly zero. This process is particularly interesting for places where the provided coal has a high ash content. A combination of the flue gases from a cement and power plant in one stack is also possible and can also reduce the cost of their scrubbing. Further integrations are possible, especially regarding a common recovery of the low temperature heat or drying and preheating of the fuel.
Compared to ordinary heat recovery, this solution can at first appear as suboptimal from an environmental point of view. Nevertheless, the advantages listed tend to disprove this point of view, and the economical benefits for this process outweigh the realization costs.
Despite the fact that onsite power generation has interesting features which are technologically, economically and financially attractive, it is still not widespread. One of the barriers may be a lack of experience with such projects. Other barriers seem to be the financing, ownership and operation of the power plant, as well as the level of liberalization, independence and transparency of the electrical grid access. Therefore, regulatory shifts to specifically allow such projects are needed. Also facilities could be established to help with the financing of large energy oriented projects as is the case in China.
3.4.5 Comparison of strategies
All the above strategies to improve the electricity efficiency for the cement production should be encouraged as should the use of renewable energies. The entirety of these measures could bring substantial benefits to society and to the environment. Table 3.a summarizes different strategies to increase the electrical efficiency.

25A blueprint for a climate friendly cement industry
3. Cement production and emission reduction options
Table 3.a Compared strategies for cogeneration
Waste heat recovery Onsite power plant Hybrid cement and power plant
Supply of cement plant electricity needs
25-50% >> 100% >>100%
Return on investment 7-8 years Long term Unknown. Probably none for first generation pilot plants.
Need for financing Low High except in partnership Very high – need for carbon credits as prototype project
Additional combination Use of low temperature heat Use of low temperature heat
+ waste heat recovery
Limited
Advancement level Mature technology
(steam cycle)
Advanced technologies (ORC and Kalina Cycles)
Available but not widespread Research and Development
Target countries All countries, especially those with large cement plants and building new ones
Only countries with high carbon intensity in their electricity mix
Countries with high technological level
Future potential Almost all cement plants Cement markets near coal mining areas – countries with need for fossil fuel generation or
unreliable grids
Cement markets near coal mining areas – countries with need for fossil fuel generation
3.5 Fuel type3.5.1 Conventional fossil fuels
The most widely used fuels for the cement industry are coal, coke or heavy oils [78]. These fuels can be found either in, or transported to, almost every region in the world. Other less CO2 intensive fuels such as natural gas are used in Africa, Latin America and the Middle East. The fuel consumption typically accounts for 25-30% of the cement production costs [79].

26A blueprint for a climate friendly cement industry
Figure 3.nFinancial incentive vs. cost of the switch to natural gas as lower emitting fuel: (the figures are only valid for cement kilns)
financial incentive (carbon credit) for one ton CO2 reduction
fuel cost increase for one ton CO2 reduction by switching from an inexpensive carbon intensive fuel (e.g. coal) to natural gas
$40
$0
($40)
($80)
($120)
($160)
3. Cement production and emission reduction options
Table 3.b Fuel prices, calorific value and CO2 related emissions [80]
Energy content Emission intensity Price per GJ (2010 forecasts)
Unit GJ / tonne kg CO2 / GJ $ / GJ
Fuel type Coal 29 92 1.9 ( 20%)
Heavy Oil 53 77.3 7.8 ( 5%)
Natural Gas 51.5 56.1 7.6 ( 5%)
Electricity – Brazil: 23.5
China: 236
India: 261
10-20
Natural gas features significantly lower CO2 related emissions per unit of energy (Table 3.b). It is for example used in some kilns in the Former Soviet Union (FSU). As a result and despite a very low level of kiln efficiency, the CO2 intensity of the cement industry is still reasonable. The question of a fuel switch from coal or coke to natural gas for example has to be considered from an economical point of view. One ought to take into account the future price of both of these fuels in the long term as well as the incentive created by the carbon market. Several studies on future trends in this market assume a price between $20-$30 / t CO2. This means that there is over $20 incentive for every tonne of CO2 emissions abated. At the same time, based on the figures in the table, the fuel price increase corresponding to one tonne CO2e less emitted would be over $140 for a switch from coal to natural gas.
Due to the comparatively low price of coal, there is no economical viability expected in the coming decades for a switch to less CO2 intensive conventional hydrocarbon fossil fuel (oil or natural gas) for burning in the cement kiln.
This is especially true since large cement plant kilns typically are a suited application for lower quality fuel such as coal or coke. The relative low price of a CO2 reduction is caused by the fact that there are several other possibilities to reduce emissions in other applications at a much lower price. Natural gas e.g. can contribute more efficiently to CO2 reductions in other sectors such as in the electricity generation where it decreases capital costs and provides more flexibility.
Electricity from renewable sources is also widely available in Canada and South America at reasonable prices. However, using this high-end energy to generate thermal energy would have a negative global impact on the world’s CO2-balance. Local reduction of CO2 emissions could lead to globally increased emissions elsewhere. This is referred to as negative displacement. Figure 3.f shows that Japan clearly has the lowest CO2 intensity in the cement production despite its exclusive usage of the most CO2 intensive of all cement fuels: coal. This is mainly achieved through the high energy efficiency of its kiln. Furthermore, coal produces a small quantity of ash which becomes part of the cement mix itself, without substantially reducing its quality.
+_
+_
+_

27A blueprint for a climate friendly cement industry
Figure 3.oBalance of waste use in cement kilns
Cement Plant
Fossil fuelsFossil fuels
CO2
SOxNOx
Incineration plant
Wastes Wastes
CO2
SOxNOx
Cement Plant Co-combustion
CO2
SOxNOx
-> reduced capital cost
3. Cement production and emission reduction options
The previous discussion has shown that coal is likely to remain as fuel for the cement industry in the coming decades and is therefore used as the standard fuel for the cement industry in all BAU (Business As Usual) cases throughout the study. As set by the Japanese example, a much lower level of CO2 emissions from the cement industry is possible without switching to natural gas simply by enhancing the energy efficiency. There are several large sectors where the switch from coal to natural gas or oil bears many more advantages additional to emissions reductions than in the cement sector.
3.5.2 Fossil based alternative fuels
Traditional fossil fuels, which are used for cement plants, do not only account for 20 to 30% of the production cost [81], but also emit 40% of the CO2 in the cement manufacturing process (see Figure 3.c). Several alternatives to conventional fossil fuels exist that constitute a category named “alternative fuels”. Their potential to replace conventional fossil fuels in cement kilns has been evaluated as between 6 to 16% [82] with an average of 12% achievable worldwide. It has been estimated [83] that alternative fuels could reduce emissions from the cement sector in 2030 by 0.16 Gt CO2e per year.
Nevertheless, on a local scale, several plants achieve below 50% [84] supply of their energy with alternative fuels. Since alternative fuels can be of fossil or of biological origin, it has been decided to present the two categories separately.
Most fossil based alternative fuels were derived from industrial processes without the intent to be used as fuel. They can either be industrial or domestic waste. The most common industrial wastes which can be used are tires, waste oils and solvents. Other residues from the oil, pulp and paper industries can be used as well. Chemical wastes, plastic, coal slurries and distillations residues, oil shales, packaging wastes etc. are abundant wastes from the industry, and, often have a high calorific value. Even heavy oil spills or heavy oil contaminated land can be used. Domestic waste is available in the form of garbage. Globally, the quantity of available waste is high. For example, 50 million tires are discarded each year. The quantity of waste is especially increasing in fast developing countries.
Waste was not primarily designed to be used as fuel, and consists of industry by-products or products which have reached the end of their lifespan. They can nevertheless be used again as fuel and become a valuable input product for the industry. As such, this application is a reuse that benefits the community. Using waste as fuel reduces the impact of mining, producing, treating transporting and burning standard fossil fuels. In several developing countries, the uninterrupted stream of waste still ends at landfills and requires large surfaces. While some of the produced waste materials are neutral, others pollute both land and groundwater. Industrial waste, for example, is a heavy polluter and its elimination is problematic and expensive. Furthermore, its production puts a burden on society since it affects the environment.
A widely used solution to eliminate waste is represented by incineration, generally without recovering the produced heat. Incinerators are nevertheless expensive plants. Recovering the energy from waste in incinerators is possible but the investment can be around $15,000 / kW [85] compared to $1,000$ / kW for regular coal power plants. Both solutions of either burning waste in incinerators or in cement kilns are compared in the Figures 3.o and 3.p and Table 3.c.

28A blueprint for a climate friendly cement industry
Figure 3.pAlternative fuels compared to coal: [88]
Emission intensity (kg CO2 / GJ)
Energy content (GJ / t)
PlasticsSolventsMixedindustrialwastes
Waste tires
Waste oilCoal
0
20
40
60
80
100
3. Cement production and emission reduction options
It appears that the incinerator solution is suboptimal compared to the use of the waste as an alternative fuel for cement kilns. Indeed, instead of being wasted, the heat provided by combusting the waste can be incorporated to the kiln to create the high temperature needed for the production of concrete. This reduces the amount of fossil fuels by replacing them with waste that would otherwise have been burned, generally without heat recovery. As seen on the picture, the global amount of CO2 emissions is reduced. Other polluting emissions are also decreased significantly.
Using this technique, the demand for landfills and incinerators can be reduced. In turn, the global environmental impact of the waste is also reduced. Fuels costs for the kiln, as well as the capital cost for an incinerator, are scaled down.
Some waste features a mineral content that will not combust. As such, not only energy but also minerals are recovered, which can contribute to the production of clinker. The subsequent increase in cement output by these ashes can generally be done without reducing its quality.
Together with other economic considerations, an important selection criterion for alternative fuels is their heat content.
Table 3.c Alternative fuels compared to coal: [86]
Fuel type Energy content Emission intensity
GJ / t CO2 / GJ
Coal 29 92
Waste oil 38 74
Waste tires 36 85
Mixed industrial wastes 19 83
Solvents 22 [87] 74
Plastics 30 75
Hazardous material can also be incinerated in cement kilns. The high temperatures found in a kiln are sufficient to dissociate most of the stables toxic molecules. The residence time for gases in a kiln is comparable to that found in typical incinerators [89].
Cement kilns have the capability to recover heat from waste. By doing so, they can have an extremely positive impact in the whole waste management chain. Waste fuels may be less expensive than fossil fuels, and may cut the cost of cement production. Domestic waste has a heat content between 9 and 12 MJ / kg [90] and its quality can be improved by sorting them. This applies especially to developing countries where an abundant workforce makes it possible to sort them in order to achieve much higher qualities.

29A blueprint for a climate friendly cement industry
3. Cement production and emission reduction options
For a majority of wastes, the incineration in cement kilns is still suboptimal compared to a recycling process. The waste supply is expected to grow with the level of consumption in developing countries. Nevertheless, a growing part of the waste will progressively be recycled instead.
Moreover, by the time the recovery of fossil based waste, in any form, will be common in all countries, either as fuel or through recycling, it will be considered as a Business As Usual case. Such waste has a fossil origin and is not from a renewable source. In turn, depending on the case, its usage for the reduction of emissions is subject to debate. Not all kilns are suited to combust waste. Shaft kilns for example are not well suited due to their technology while new dry rotary kilns are particularly suited for it. The wastes have to be introduced at the correct point to reach the desired temperature, according to a set of good rules.
A good knowledge of the local industry is important for waste recovery and can ensure a continuous supply of waste of determined origin. The cooperation between the cement industry and the local authority responsible for waste is often crucial. This is even more important for hazardous waste, which represents a risk to safety and public health. Its treatment requires the following frame:
reliable partners at all levels (waste supplier, governmental body, cement company),•
a specialist and responsible person for each plant,•
clear processes including a complete tracking and registering process of the waste, from its source to its final use •(this would include data on the quantity and its composition),
a monitoring of flue gases,•
written guidelines, training and control of the process, and•
a permitting and accreditation system on the part of the relevant governmental body.•
Computerized reporting and existing quality management systems used by major cement producers or even from other industrial sectors could be used as an example. If there is limited number of participants in a given cement market, the conditions and processes under which waste of a certain type is used can be directly negotiated between government bodies and the main actors of the sector.
3.5.3 Biomass
Biomass is considered an alternative fuel, but has the peculiarity to be of biological origin. Biomass available as a fuel for cement kilns can be found among the by-products of agriculture (e.g. Figure 3.q), the food industry, or some urban facilities. Some common examples of available and largely underused biomass are:
• ricehuskash • straw • pulpandpaperresidues• wastewood • foodwastes • watertreatmentsludge
• animalfat • solidwastesofbiogasplants

30A blueprint for a climate friendly cement industry
Figure 3.q Coconut peels used as kiln fuel. [91]
Figure 3.r Biomass fuels compared to coal [92]
Energy content GJ / tFuel type
Emission intensityt CO2 / GJ
Wood 0
Rapeseed
0
Dry
Wet
Corn
Sewer sludge (dry)
0
0
0
Coal
Straw
92
0
20
11
25
15
14
Vegetable oils
Cow dung
Coconut husk
0
0
0
40
11
14
29
15
3. Cement production and emission reduction options
There is nevertheless a growing industry focused on biomass usage with crops specifically grown to be used as fuel. Both categories do not share exactly the same CO2 impact. Biological waste, if unused tends to decay and produce methane (CH4), a gas which has a greenhouse potential 21 times higher than CO2. In turn, the benefit from its usage as a fuel is double, since methane emissions are hindered from their decay, and the consumption of fossil fuels which would have produced CO2 is avoided. The CO2 released from biological waste is not counted as net emissions since an equivalent quantity had been absorbed in the first place by the plants to grow them.
Energy crops used for biomass based fuels do not reduce methane emissions. However, they exhibit nearly zero life cycle emissions as well, (except for transportation and processing) and replace CO2 intensive fossil fuels. Generally, the capacity to recover biomass for kiln processes will be limited in dry regions such as the Middle East or some Chinese Western provinces. At the same time, other regions have favorable natural conditions to grow and to use biomass. Most of them have a tropical climate in the developing world, such as Malaysia or Brazil, which causes rapid growth of vegetation.
One of the most important technical criteria in selecting biomass fuels for a cement kiln is the heat content they provide (Figure 3.r). This is especially important since the production of cement comprises different heat levels from up to 1,450°C in the kiln with a flame temperature close to 2,000 °C. In this regard, it is important to select the form in which a biomass is used most efficiently. Low temperature levels (up to the precalcination) for example can often be achieved by a direct combustion of the biomass. On the contrary the same biomass once turned into biogas, vegetal oil or charcoal can be used more efficiently in the kiln.
Some waste, like wood or paper, has a high calcium content, reducing the need for quarry mining. Not all of these fuels can be used efficiently and the benefits for the cement industry will largely depend, not only on their heat content but also on their moisture content as seen on Figure 3.i. The biomass introduced in the kiln should therefore be dried as much as possible. A solution for using biomass in the most efficient way is to install a preprocessing for this fuel. The required process would be to grind the biomass, press, it in order to reduce the moisture content as much as possible, and finally to use the waste heat to dry it as much as possible. Also, the abundant sun radiation in developing countries can be used to dry the biomass. With such steps, an increase of the kiln thermal efficiency can be expected.
The other major criterion in selecting biomass is the way in which it is produced. Environmental and social sustainability assessment of the biomass sources are a prerequisite [93]. The sourcing and use of biomass with all linked consequences has to be assessed appropriately. Regarding the environmental sustainability, the production of biomass requires a fair balance to other necessary land uses such as food production or natural reservations. Biomass should only be used if it has a clear net positive contribution to reducing greenhouse gas emissions. There are instances where the use of biomass can lead to net negative impacts on the climate. Under specific circumstances, the production of biomass derived fuels for example, could contribute to deforestations which are the cause of almost 20% of all greenhouses released [94]. Also situations could arise in which biomass is no longer available to a local rural population, thus forcing them to turn to high CO2 emitting fossil fuels instead (e.g. coal). In addition, the social consequences of expanded biomass use have to be taken into account, especially regarding the effects on land use, employment, wealth disparity and the local availability of resources (food, fuels, etc.).

31A blueprint for a climate friendly cement industry
Figure 3.sClinker ratio for different countries [97]
Country
Clinker ratio (t clinker / t cement)
Brazil
Philippines
Morocco
0.65
0.85
0.73
Malaysia
E.U.
Japan
0.89
0.78
0.90
India
China
0.85
0.75
Present day share of clinker per tonne of cement (clinker ratio).
Achievable reduction of the clinker ratio by 2020
3. Cement production and emission reduction options
Not all kilns can burn biomass efficiently, and one estimate [95] without retrofit so that they can efficiently co-fire biomass. It is therefore very important to keep track of future plant replacements or improvements so that the improvement can be combined with others at a minimal cost. The cement industry has the opportunity to participate in the protection of tropical forests. In collaboration with a natural conservation group, cement manufacturers could obtain biomass to feed their cement kilns in a non-disruptive way. This would work especially well if complementarities were found with sustainable farming for food where agricultural by-waste would be collected, dried, and burnt into cement kilns to supply material thanks to its high ash-content. Sustainably grown energy crops also can be part of the energy mix.
The potential for biomass in the cement industry varies greatly between the different regions of the world. Nevertheless, with a large developing international market for biomass, even regions with limited resources can be able to reduce their CO2 intensity through import at a reasonable cost of bulk biomass. One of the major requirements for this would be access to navigation for large cargo ships. The use of biomass will certainly depend on the possibility of finding a balanced land use between agriculture, biodiversity and energy crops. Other issues will be related to local policies and financial measures supporting the use of biomass.
3.6 Clinker substitutes and alternative raw materialsBecause calcination reaction accounts for such a high release of CO2 on its own and consumes so much energy, the focus of the industry is to produce a maximum of cement using a minimum of clinker. Reducing the loss of clinker through dust emissions is a possiblity and significantly improves the air quality on a local scale. The solution is nevertheless only viable for new plants with a minimum size which are going to be still operating for enough years to amortize the investment. An example in China [96] displayed a payback time of 8 years for this investment, thanks to the saved money that had been spared on emission rights.
Another solution which already exists consists of replacing a part of the clinker in the cement with other cementitious materials. Ideally such substitutes would not require any further calcination and would be added after the kiln, so that no thermal processing would be necessary. Mixing such materials would spare 40% of the energy necessary for calcination as well as 50% of the CO2 occurring from the reaction. In turn, each tonne of clinker substitute added would reduce the CO2 emissions by 90%.
The ratio between the cement output and the produced limestone clinker is given by the clinker ratio, which can vary considerably between countries (Figure 3.s). A low clinker ratio means that a large part of the cement mass is made by additives or substitutes. In turn, a low clinker ratio means reduced CO2 emissions since less calcination was needed to produce the cement.

32A blueprint for a climate friendly cement industry
3. Cement production and emission reduction options
Some of the available clinker substitutes are:
ashes from coal power plants (depending on the coal ash content)•
blast slag furnaces from the steel industry•
ashes from the combustion of mining waste streams•
pozzolans as by-product from industries like silica fumes•
pozzolans from palm oil fuel ashes•
limestone•
gypsum (up to 5%)•
Moreover, the following alternative raw materials can be used as raw feed:
natural occurring pozzolans like volcanic ashes•
pyrite cinders from iron and steel plants•
used sand from foundries•
ashes from combusted wastes and biomass derived fuels•
It has been demonstrated [98] that a large share of clinker in the cement can be replaced without degrading the performance. Around 30 to 40% of fly ashes can be added to cement to produce fly ash cements, and up to 70% of slag for slag cements. Several countries worldwide achieve a clinker ratio close to 0.7 or even lower [99] which means that 30% of the cement clinker has been substituted. For some special applications like roads in China, the ratio has even been increased to 35-40% on some pilot sites.
Evaluating the future available quantity of substitutes worldwide is difficult since it will mainly result from the growth of the steel industry and coal power generation. Moreover, the possibility to use these ashes will depend on their quality. It has been estimated [100] that the substitutes available worldwide could replace at least 0.6 Gt of clinker per year in 2030, out of the 5.0 Gt cement which will be needed. This would correspond to emissions reduction around 0.5-0.6 Gt CO2e per year. Over the last five years, the global production of clinker grew by 20% while the cement output increased by 22% [101]. The difference between both shows a strong growing share of substitution materials. Not all of the industries providing the clinker substitutes will grow at the same rate as the cement industry through 2030 [102]. According to very recent estimates [103], the quantity of coal ashes might sharply increase by 2030, as a result of a quadrupled coal consumption in Asia. Substitution materials from the steel industry might not grow as fast. The sector expects 5% [104] growth per year as well as a switch to Electrical Arc Furnaces (EAF) which reduce CO2 emissions, and also the quantity of produced ashes which could have been used for the cement industry.

33A blueprint for a climate friendly cement industry
3. Cement production and emission reduction options
In order to increase the efficiency of their cement production, developing countries have the possibility to follow the goal of a clinker ratio slightly below 20%. This objective is in several cases challenging since the recovery rate is already quite high. The price of recovering clinker substitutes greatly varies. Generally, it provides a way to decrease CO2 emissions at a negative cost. Co-firing of biomass also provides carbon neutral fuel residual ashes which can replace clinker. The main criteria for their use should therefore be their ash content.
Obstacles for the use of clinker substitutes still remain in some markets. The legal frameworks in some developing countries require composition-based cement standards, limiting the use of clinker substitutes. Switching to performance based cement categories allows composite cements to develop. This is especially important since composite cements with a low clinker ratio are not inferior in strength, but might have a slower reactivity and a longer setting time. Nevertheless, the increased setting time is a disadvantage in a booming economy where short construction time for buildings is of great importance. Generally, education and training of consumers can greatly enhance the use of cements with lower clinker content. In order to accelerate the process, the use of composite cements should be promoted to large consumers first, where the limited number of participants involved and the large quantities facilitate the shift. Setting up a market for composite cements takes time. Therefore, the changeover made on a large consumer basis should be invisible as would be the case for finished concrete products. Mixing of the substitutes at the plant seems to be the rule to achieve the highest performance. At the same time, their use in ready-mix concrete could constitute a further optimization, keeping their usage easy for the end-user.
Additionally, the proximity of heavy industries can be very favorable to supply clinker substitutes and therefore should be encouraged. Specialists of clinker substitutes could greatly enhance the process in companies as well as in local governments in order to maximize the recovery and optimize the whole industrial flows of the regional economy. Coal ashes with excessive carbon content (5% or more) decrease the cement strength, which is a major problem for quality. On the CO2 balance, unusable coal ashes (5-20%) are equivalent to a power plant of a much lower efficiency (several percents). Older power plants can be upgraded to achieve a more complete combustion. Only new coal fired power plants producing ashes of sufficient quality should be allowed. A set of standards or a permitting system could be set correspondingly.
3.7 Innovative cement based materialSeveral innovative materials could help to reduce CO2 emissions by offering alternatives to Portland cement clinker. They could either substitute parts of the ordinary clinker or replace all of it. The range of applications for which they are suitable ranges from specific niches to almost the complete scope. While some are under development, others are already on the market and are produced on a large scale.

34A blueprint for a climate friendly cement industry
3. Cement production and emission reduction options
Belite-sulfoaluminate cements: [105] Unlike the more conventional approach of belite-rich portland cements, belite-sulfoaluminate (BCSA) cements require raw materials that are slightly different and therefore more expensive than standard portland cement raw materials. However, they can still be manufactured in conventional portland cement plants. BCSA technology was developed to a significant extent in China over the last three decades, and Chinese norms exist for this class of cement. However, it is currently used only in specialized applications due to their high cost relative to OPC. BCSA cements can reach manufacturing CO2 emissions as much as 50% lower than those of OPC, depending on the specific cement composition chosen. For relatively inexpensive “BCSAF” cements (containing ferrite in addition) that are close to OPC in performance, CO2 emissions are estimated to be about 25% lower [106].
Natural occurring pozzolans, like volcanic ashes, can be viable as partial OPC substitutes, and as such, they can strongly reduce overall emissions. They can replace up to about 35% of the clinker, but the resulting cements generally show reduced strengths, especially at early ages. Pozzolanic cements of this type have already been used for many decades in locations where suitable natural pozzolans are found, (such as Italy), and they can be considered the modern-day descendants of Roman cement technology. The cost of making pozzolanic cements varies widely from one location to another because no two natural pozzolan sources are identical [107].
Artificial pozzolans: There are many artificial pozzolans currently available for usage as partial cement substitutes. The most common by far is “fly ash” – the fine residue from pulverized coal combustion. It is nevertheless already widely used as substitution material, and mixed with cement clinker. Another useful artificial pozzolan is “metakaolin” made by heating kaolin-rich clays to about 700 °C. This type of pozzolanic material was used to make the early forms of geopolymers, but can be very expensive due to the shortage of sufficient good-quality kaolin-rich clays.
Magnesium cement: It has been claimed [108] that such cements, also known as “eco-cements” based on reactive MgO, could be manufactured with greatly-reduced CO2 emissions compared to O.P.C., and that concretes made from such cements would absorb atmospheric CO2 faster even than concretes made from O.P.C. However, these claims and the claims about the performance of the cements themselves have not found acceptance [109].
Geopolymers [110] [111] are another class of cements based on pozzolans (natural or man-made). Whereas conventional pozzolanic cements require Portland cement clinker (or lime) to activate the pozzolan, geopolymers instead make use of sodium hydroxide or sodium silicates. Because only small amounts of the energy-intensive activators are usually needed, CO2 emissions may be as low as 10-20% of those of Portland cements, provided the pozzolan itself does not have to be specially produced. A good example is “alkali-activated fly ash” in which the pozzolan is a by-product of pulverized coal combustion (typically from electric power plants) and as such is treated having zero manufacturing CO2 emissions. Pure sodium-activated geopolymers usually have to be thermally activated (at 60 °C or more) to get the best performance and are thus only really suited to precast concrete applications. More complex mixed pozzolanic cements, activated by lime as well as sodium hydroxides or silicates, can be used without thermal activation, but their associated CO2 emissions are also significantly higher. Extremely high strengths can be reached (80 N / mm²) with excellent properties for corrosive or high temperature environments.

35A blueprint for a climate friendly cement industry
3. Cement production and emission reduction options
Moreover, the early strengths can be higher than for regular concrete. The availability of suitable pozzolans might nevertheless be a problem in many locations, and the world supply of the sodium hydroxides or silicates required as activators is currently insufficient to meet the demand if this technology were to be more widely used; many new chemical plants would be required to produce sufficient activators.
Carbon concrete: [112] is a new kind of concrete that is especially attractive for special applications like heavy industrial roads or saltwater applications. It can be created using the heavy by-product of crude oil refinement and sequestrate carbon that is otherwise very difficult to use efficiently. This new product is a thermoplastic binder which combines a strength close to concrete (15-25 N / mm² compressive strength) with an enhanced flexibility and an extremely good resistance to wearing. As such, less material is needed for a similar application. The CO2 savings can be large but are subject to of a very complicated debate, since this form of concrete is a sequestration of carbon fuel by-product. Also NOx and SOx emissions are avoided and no water or specific sand quality is needed for its production.
Ceramicrete: Such materials are 2 to 3 times as strong as regular concretes so builders use far less of it. Their cost is nevertheless two to three times the cost of cement based concretes. They set very quickly (within some hours) and their production does not require high investments [113].
Fiber reinforced concretes: On structures like bridges, concrete does not perform well due to its properties. Therefore, steel is chosen even if it is far more CO2 intensive. New cement-based products developed like the Ductal® have increased properties (enhanced tensile strength) and can therefore substantially reduce the amount of steel needed for the function (reinforcement bars, I-beams). In turn, the CO2 impact is reduced by almost 60% [114].
Future cementitious materials: Further research is currently done for example. The MIT is trying to create a cementitious material at the temperature of only 200°C which would emit by far less CO2 during its processing using nanotechnologies. Nevertheless, no breakthrough is expected for at least 5 years.
All the solutions above display a large range of low CO2 alternatives to OPC clinker. Individually, these products are not able to cover the whole range of applications of the traditional OPC clinker. Together, alternative solutions can cover the full range, and even offer better performance in several sub segments.
A switch to innovative materials would probably mean a shift away from the OPC clinker, which is the widespread, standard and well established solution. Solutions will be local and achieved through the use of the best possible minerals in a given region to produce the lowest CO2 cement. Such a shift to multiple solutions suited for each application requires a higher level of knowledge at the producer and consumer levels in order to use the best product and know how to use it. The ownership of the technology is also a problem since single products do not cover the whole range of applications. As a result, single companies will only be able to provide low CO2 solutions on certain applications. The introduction of such products might also be hindered by existing unsuited standards and well-established and conservative chain of OPC users.

36A blueprint for a climate friendly cement industry
3. Cement production and emission reduction options
Even if the possible decrease of CO2 using innovative cement materials is huge, chances are that without measures to help them emerge, the priority will be given on the short term to conventional abatement measures (energy efficiency, biomass, clinker substitutes, etc.). Nevertheless, innovative cement materials could be interesting for those countries which do not have much potential to decrease their cement CO2 intensity.
Due to the very established chain of OPC cement, any change seems rather difficult and would be a risk under market and technological aspects. Unless a legal constraint is established, such a shift could only be done if substantial advantages could be found. Such an advantage could be enhanced performances of the material on some niches or specific financial intensives. It could also be a financial interest to reduce CO2 emissions. This in turn requires the existence of a strong emission reduction market. Worldwide, the operating income per tonne of cement ranges generally between $5 and $30 per tonne. Incomes from CO2 abatements with such new materials around $20 per tonne CO2 (or $12 per tonne of cement) could be financially very attractive. Further savings could be expected on the fuel side as some of the proposed cementitious materials could be produced using lower temperatures (e.g. 600-800°C). However, it is important to note that the maximum temperature in a thermal treatment process is a very poor indicator of how much fuel would be required per unit mass of product, and how much CO2 would be emitted. In turn, new possibilities to co-generate or use solar concentrators in developing countries would become available.
The introduction of such materials in detail to the market is the subject of the next chapter. There are major obstacles and difficulties for the introduction of such products in mature and established markets. Therefore, their introduction in developing countries has to start soon.
The role of countries, or groups of countries, is very important in this process. First of all, a range of performance based standards is needed to enable such advanced materials. In order to face the related multiplication of products, countries or regions of the world will need to help the end user, and inform them, of the best suited product for their application to reduce their resistance. As an extremely limited number of large applications have been realized with new products, a larger sample of pilot projects needs to be realized to demonstrate the viability of the materials to lower the resistance. This might require some form of institutional help.
Generally, in order to respond to the CO2 problematic in the cement sector, one ought to spread information, help the introduction of new materials and develop market tools to reward reductions. Additionally, a UN CDM fund specially dedicated to the cement sector would be required. It could be almost self-financed by its reduction projects. Tools like programmatic CDM could be used to reward the CO2 reduction from a policy such as the introduction of low CO2 alternative materials.
In different developing countries, technical centers for advanced buildings materials could be established in order to promote the introduction of such materials and accelerate cement specific CDM operations. A special emphasis should be put on disseminating the knowledge on a local level.

37A blueprint for a climate friendly cement industry
3. Cement production and emission reduction options
Figure 3.t Introduction of alternatives to Portland Cement
Size of the projects
Number of users
Small projects:small buildings / bagged concrete
Average size projects:roads, buildings,
average sized industrial users
Large projects:
dams, bridges, tunnels,
airports, harbours, very large buildings
Advanced cementitious
materials (very-low CO2)
Lower CO2 concrete solutions: better
engineering, high strength
concretes
Low CO2 finished
products
3.8 Transition to low CO2 productsAs seen in the previous parts, most of the products required to substantially decrease the CO2 impact of the cement sector and the associated concrete sector are either non-existent or in development.
As explained, one of the major challenges is the introduction of such products. Products of the cement or building material sector are only noticeable when they reach 5 to 10% of the volume and on average, 10 years are required to introduce advanced materials on to established mature markets (developed countries) [115]. Moreover, a product needs to have a strong market share in order to enjoy economies of scale. The multiplication of solutions will require a higher level of information available to the customer. The distribution of information and the education of the consumers is very important.
Until now, other than composite cements (mixed with substitution materials), alternatives to OPC cement have not succeessfully entered the market. The first step of course is to create a legal frame which leads to their allowance. Such a frame is no longer based on the chemical composition but entirely on the mechanical properties (strength, setting times). It is also possible to indicate the related CO2 in order to start to educate the consumers.
The cement market can be divided into different segments as represented in Figure 3.t. On the top of the pyramid, the large projects use considerable quantities of concrete and have a very low number of users. In turn, the number of users to educate is very small and most of them have an advanced knowledge of concrete products and technologies. This segment is probably the easiest to reach with advanced cementitious materials. In turn, specific CO2 goals can be assigned to projects.
The middle part of the pyramid represents the medium-sized users of concrete. Generally, some improvements are still possible in this area through the adoption of advanced engineering and higher quality concretes. This can e.g. avoid the so-called “fat beams” which are oversized and sub-optimal concrete constructions. Producers of concrete pre-cast products can also be addressed with alternative cementitious materials, since the mass production of their products would generate substantial CO2 savings.
On the lowest part of the pyramid, small projects with a large number of users require too much education to realize substantial savings. To improve quality, ready-mix can be encouraged. The easiest way to realize massive CO2 savings is to push finished concrete products (precast beams, concrete blocks, air concrete etc.) on the market, which have been optimized to reduce the CO2 impact on a factory level.
Centers for building materials can act on a very local level in cooperation with cement companies to help the introduction of low-CO2 impact products. The use of carbon credits has to be encouraged, and used as a way to give an incentive for this shift.
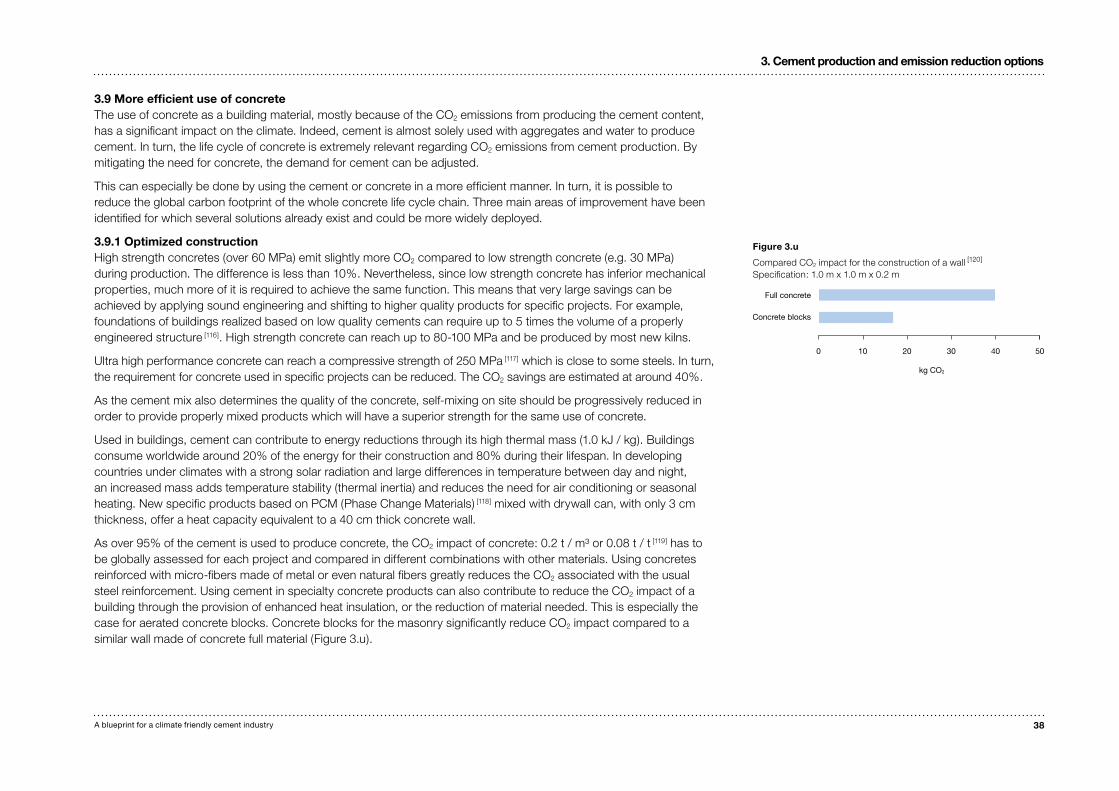
38A blueprint for a climate friendly cement industry
3. Cement production and emission reduction options
Figure 3.u
Compared CO2 impact for the construction of a wall [120] Specification: 1.0 m x 1.0 m x 0.2 m
50
kg CO2
403020100
Concrete blocks
Full concrete
3.9 More efficient use of concreteThe use of concrete as a building material, mostly because of the CO2 emissions from producing the cement content, has a significant impact on the climate. Indeed, cement is almost solely used with aggregates and water to produce cement. In turn, the life cycle of concrete is extremely relevant regarding CO2 emissions from cement production. By mitigating the need for concrete, the demand for cement can be adjusted.
This can especially be done by using the cement or concrete in a more efficient manner. In turn, it is possible to reduce the global carbon footprint of the whole concrete life cycle chain. Three main areas of improvement have been identified for which several solutions already exist and could be more widely deployed.
3.9.1 Optimized constructionHigh strength concretes (over 60 MPa) emit slightly more CO2 compared to low strength concrete (e.g. 30 MPa) during production. The difference is less than 10%. Nevertheless, since low strength concrete has inferior mechanical properties, much more of it is required to achieve the same function. This means that very large savings can be achieved by applying sound engineering and shifting to higher quality products for specific projects. For example, foundations of buildings realized based on low quality cements can require up to 5 times the volume of a properly engineered structure [116]. High strength concrete can reach up to 80-100 MPa and be produced by most new kilns.
Ultra high performance concrete can reach a compressive strength of 250 MPa [117] which is close to some steels. In turn, the requirement for concrete used in specific projects can be reduced. The CO2 savings are estimated at around 40%.
As the cement mix also determines the quality of the concrete, self-mixing on site should be progressively reduced in order to provide properly mixed products which will have a superior strength for the same use of concrete.
Used in buildings, cement can contribute to energy reductions through its high thermal mass (1.0 kJ / kg). Buildings consume worldwide around 20% of the energy for their construction and 80% during their lifespan. In developing countries under climates with a strong solar radiation and large differences in temperature between day and night, an increased mass adds temperature stability (thermal inertia) and reduces the need for air conditioning or seasonal heating. New specific products based on PCM (Phase Change Materials) [118] mixed with drywall can, with only 3 cm thickness, offer a heat capacity equivalent to a 40 cm thick concrete wall.
As over 95% of the cement is used to produce concrete, the CO2 impact of concrete: 0.2 t / m³ or 0.08 t / t [119] has to be globally assessed for each project and compared in different combinations with other materials. Using concretes reinforced with micro-fibers made of metal or even natural fibers greatly reduces the CO2 associated with the usual steel reinforcement. Using cement in specialty concrete products can also contribute to reduce the CO2 impact of a building through the provision of enhanced heat insulation, or the reduction of material needed. This is especially the case for aerated concrete blocks. Concrete blocks for the masonry significantly reduce CO2 impact compared to a similar wall made of concrete full material (Figure 3.u).

39A blueprint for a climate friendly cement industry
3. Cement production and emission reduction options
Their strength is limited to around 15 MPa (compared to up to 80 MPa for high quality concretes) which limits the height of buildings where they can be used for. This is a problem in fast urbanizing developing countries. Encouraging such materials can nevertheless provide substantial decrease of the CO2 emissions. In turn, if no high strength is required, no full concrete material should be used for small buildings.
As exposed, a large number of solutions already exist or are being developed to use less concrete, but in a much more scientific and suited way. As a result of a switch to more engineered products, major companies can keep or improve their profitability while moderating the cement production and decreasing CO2 emissions. By working more efficiently on the whole concrete chain to mitigate the demand, customer requirements can be met at least as well as in the BAU case but this time with lowered emissions.
Unfortunately, tools to reward possible corresponding efforts are still lacking. The recent development and extension of a tool called P-CDM (Programmatic Clean Development Mechanism) could perhaps close this gap since it rewards CO2 reduction as a result of a program or policy.
Major cement companies have the possibility to start a reflection which can ultimately lead to the development of tools and capacity building. This reflection can be associated with the one on innovative cement based materials.
3.9.2 Durability of buildings
As previously discussed, it is possible to reduce CO2 emissions from the production of concrete and reduce the CO2 intensity of constructions by applying the right product and the right design. Each construction project has an initial CO2 impact related to its creation, but this impact relates to a certain number of years of service. In turn, a specific CO2 impact per year of service life can be calculated for structures. This concept is important since doubling of the concrete structure lifetime cuts the long term impact per year of service by half. The lifetime of concrete structures can be increased using a sound development plan which avoids unnecessary replacements and demolitions of buildings due to changes in plan.
The technical lifetime of concrete structures can be sharply increased by applying the right design and there has been proven quality on the whole concrete chain during the construction with virtually no incremental costs. While some concrete structures with poor quality have a service time of only 30 years or less, quality design can lead to a durability over 70 years. Poorly engineered concrete structures lead to a short life cycle. The problems of low quality in concrete which lead to a premature end of life cannot be solved. This in turn might lead to a high demand for concrete after just some decades to replace and refurbish the damaged concrete structures. This is especially a worry in developing countries where this early need for replacement of concrete structures might be superposed with the need for new constructions, leading to unexpected high demand for concrete. In turn, all net gains tracking of concrete quality and usage can play a major role in a long term CO2 mitigation strategy at no additional cost.

40A blueprint for a climate friendly cement industry
3. Cement production and emission reduction options
Figure 3.v Cement chain and the decrease in CO2 emissions: the cement demand
Assumed demand for cement
Minimum demand for cementitious materials
Minimum demand for Portland cement
Minimum demand for OPC clinker
Remaining CO2 emissions:Production of cement clinker (2)
A B C
A – Use of substitution materialB – Introduction of low CO2 cementsC – Optimization on cement and concrete demand side
Figure 3.wCement chain and the decrease in CO2 emissions: the production of cement clinker
calcinationK
E
C
Remaining CO2 from fossil fuels combustion
in the kiln
H
G
F JI
Transportation
Electricity
D – Energy efficient (brought to 3,200 MJ / t)E – Use of 15% of biomass as a fuelF – Electrical consumption brought from 105 kWh / t cement to 85 kWh / tG – Waste heat recovery 30 kWh / t cement on every plantH – Development of renewable power supplyI – Use of biomass based fuelsJ – Efficiency in transportationK – Different form of cogeneration (waste heat for processes etc.)
3.9.3 Disposal and recycling of concrete
The life cycle of concrete usually ends when the structure does not warrant the required strength anymore, mostly because of cracks that appear. The energy invested in the creation of the cement is not recovered. The problem of concrete recycling is largely underestimated since it will not start to be noticeable until the future decades.
Concrete at the end of its lifetime can serve several applications. When crushed near the site, used concrete can be changed into an aggregate which can be employed once again to form concrete. In turn, the disposal is reduced and the extraction and transportation of aggregates to form the new concrete can also be reduced.
A potentially interesting property of concrete is its ability to re-carbonate after its end of life. This means that carbon dioxide is absorbed from the atmosphere, thus reducing the CO2 concentration in the atmosphere. A Danish study showed that up to 57% of the CO2 emitted by the calcination process of limestone [121] can be reabsorbed by the crushed and landfilled concrete over 30 years following the demolition after a service life of 70 years.
3.10 Integrated analysis of potentialThe previous chapters indicate clearly that the reduction of the CO2 emissions can occur at multiple levels. In order to calculate emission reductions, the chain has to be well understood.
A reduction in the specific heat consumption, for example, increases the potential of biomass to contribute as a carbon neutral fuel per tonne of clinker. A decrease in cement demand does not affect the quantity of the recoverable biomass fuels or the availability of substitution material. As such, it is at least equal to the decrease of the CO2 emissions per tonne of clinker produced. On the top of that, a moderated consumption helps to lower the rate of utilization of the plants and if adequate instruments are used, production will become more concentrated on the most efficient plants. Furthermore, replacing cement with advanced cementitious materials has impacts on the rest of the chain downwards. The same is also true for cement when replaced by substitution materials.
As a result, reducing CO2 emissions from the cement sector requires mastering the whole chain of all the participants involved. The right quantifying needs to be developed for reductions on each link of the chain. A summary of this is given in Figures 3.v and 3.w.
By combining the two previous Figures into Figure 3.x, it becomes clear that CO2 reductions realized on the basis of the cement plant for clinker production are necessary, nearly not sufficient enough to stop the increase. In turn, a large collaboration at all levels is recommended and seems to be the only potential path leading to a sufficient decrease of CO2 emissions in the long term global warming mitigation scenario.

41A blueprint for a climate friendly cement industry
3. Cement production and emission reduction options
Figure 3.x Integrated cement chain and the decrease in CO2 emissions
Avoided CO2 emissions
Remaining CO2 emissions
C – Optimization on cement and concrete
demand side+
B – Introduction of Low CO2 cements
3.11 Carbon capture and storageA process presently developed and tested called “Carbon Capture and Storage (CCS)” provides a way to avoid the release of CO2 into the atmosphere also for the cement industry. It consists of a separation of CO2 emissions, which would be released at the stack in the normal case, as well as their sequestration. Several storage solutions are presently being tested. The storage potential has been evaluated worldwide to be 2,000 Gt CO2
[122] in geological formations alone. Further options are being explored at present. This potential is nevertheless unevenly distributed.
Available technologies are able to capture between 85 and 95% of the CO2 emitted. Nevertheless, due to the separation and compression for the CO2, roughly 10-40% more energy might be consumed.
The cement industry has two interesting characteristics which makes it well suited for CCS. The exhaust gas exhibits a high CO2 concentration between 14 and 34%. Modern cement plants are even the ones with the high concentration CO2 (over 30%). Also the quantity of CO2 emitted per site (around 1.3 Mt CO2 / year for a 4,000 tpd plant) is rather large. This means that the CO2 flow at cement plants is more concentrated than is the case in power plants and is almost as large. Costs for this process on large cement plants can be expected to be around e30 per tonne of CO2
[123].
One technology of particular interest to the cement sector is the so-called “oxyfuel combustion”. It consists of the usage of pure oxygen to combust the fossil fuel in the kiln. Through the reduced ballast of N2 the NOx pollution is reduced to almost zero, no deNOx facility is needed, and the thermal efficiency is greatly increased. Nevertheless, the overall energy efficiency of the entire process is reduced by the necessity to produce the oxygen [124]. This could be solved by the use of adsorbtion chillers to provide part of this energy from the waste heat.
As it previously evaluated, it will be very difficult for the cement sector to meet a goal comparable to the global 50% decrease in CO2 by 2050 from the 450 ppm mitigation path. In this regard, CCS could potentially play an important role. Although most elements of the CCS process are mature technologies, there is no fully proven working CCS system yet. Generally, there is a need for the cement industry to further assess the details of how to combine CCS with cement kilns Given the growth of emissions caused by the cement sector, international tests on a cement plant basis on a very short term are highly desirable.

42A blueprint for a climate friendly cement industry
4. Reduction scenarios for selected developing countries
Figure 4.a Production and emission scenario for Brazil
Mt
/ ye
ar
20202005
0
10
20
30
40
50
60
70
80
Cement production (Mt)
Level of emissions under BAU
CO2 Emissions (Mt) using an enhanced policy
4. Reduction scenarios for selected developing countries
Under the collaboration between Lafarge and WWF, data has been collected and simulations established for four developing countries: Morocco, Malaysia, Brazil and the Philippines. Simulations have been developed for these countries regarding the cement production by 2020 and the possibility of limiting the related CO2 emissions using conventional methods such as more efficient plants, the use of clinker substitute and biomass based fuels.
4.1 BrazilIn 2006, Brazil consumed 36 Mt of cement with a clinker ratio which was as low as 0.65 t clinker per t of cement. Similar to several other developing countries, the Brazilian cement industry is fairly modern and the heat consumption in 2006 is already at 3,680 MJ / t clinker. Due to its surface, (5th largest country in the world), its low population density (22 inhabitants / km²) and tropical climate, the country has one of the largest potential for biomass in the world. Biomass fuels already accounted for over 38% of the fuel supply for the cement industry in 2006. As a result of the country’s scale, transportation costs can locally be high. Due to its huge hydro potential, Brazilian electricity has one of the lowest in CO2 intensity with around 0.085 t CO2 / kWh [125]. Globally, the Brazilian cement industry emitted about 19 Mt CO2. Its emission factor of 0.52 t CO2 / t cement is one of the lowest in the world (0.73 in Japan).
The Brazilian cement industry is fairly concentrated, with the five largest companies accounting for over 80% of the production. Moreover, Brazil has a very active policy to promote energy efficiency, clean technologies and renewable energies. The country is also very active in CDM activities, and already accounts for 15% of all registered projects [126].
The Brazilian cement market is expected to grow up to 73 Mt by 2020. At the same time, the share of biomass in the fuel mix will probably reach 50% or more. If both existing plants are retrofitted and new ones constructed according to the current best practices, the thermal efficiency could then reach 3,250 MJ / t clinker. It is also expected that the clinker ratio will be kept at 0.65 thanks to the development of industries which will add sources of clinker substitute combined with the ashes content, which the biomass will provide. As a result (Figure 4.a), the emission factor could be reduced to 0.47 t CO2 / t cement by 2020 and the total CO2 emissions from the sector limited to 34 Mt.
Expectations to decrease the CO2 intensity of the Brazilian cement industry are high for several reasons. The main one is the use of a very high share of biomass. At the present rate of development of biomass based fuels in Brazil, it is expected that a large amount of byproducts with a high ash content will result from their use.
The very abundant solar radiation in Brazil could also be explored as a way to dry the fuel fed into the kiln, especially biomass which usually has a high water content. Also solar preheating of the air supplying the kiln during the day is possible, and could even cut operating costs.
Combined projects involving the acquisition of land for sustainable forestry, sustainable farming and supply of biomass, could provide internal emission reductions through the supply of biomass with strong additionality for local communities and could provide ecological balance. This could especially be done on the fringes of endangered tropical forests where the establishment of such a buffer could stop further deforestation.
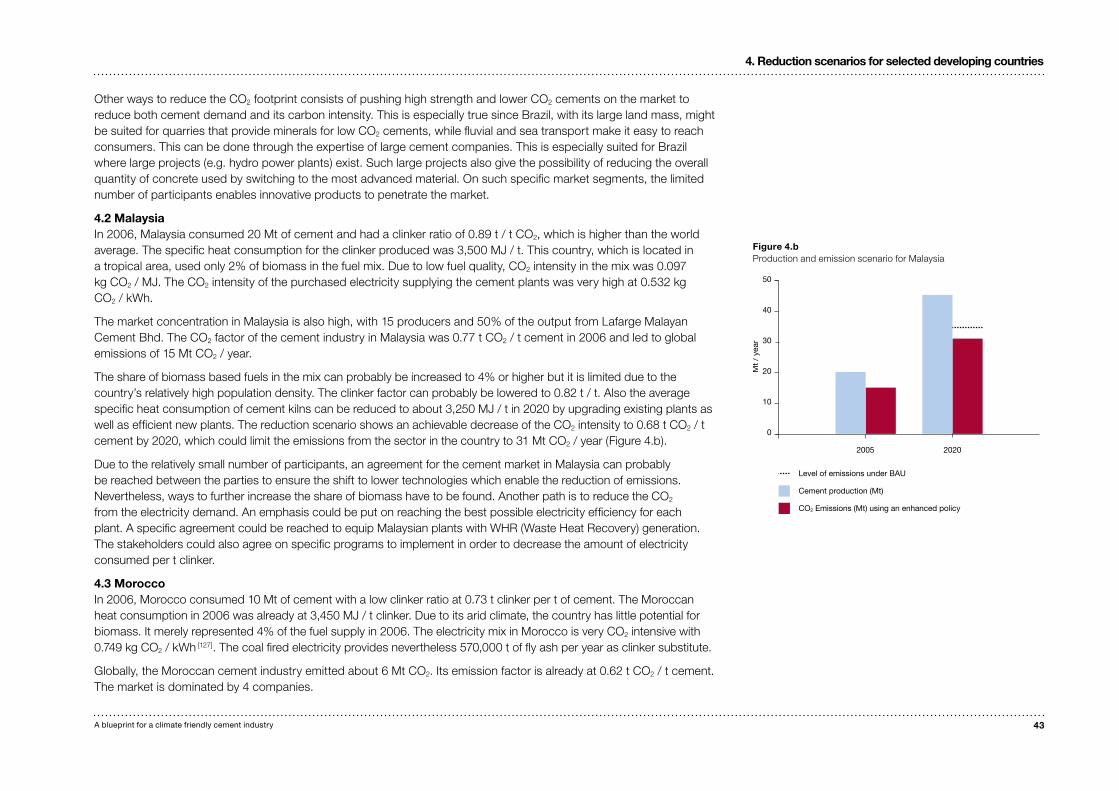
43A blueprint for a climate friendly cement industry
4. Reduction scenarios for selected developing countries
Other ways to reduce the CO2 footprint consists of pushing high strength and lower CO2 cements on the market to reduce both cement demand and its carbon intensity. This is especially true since Brazil, with its large land mass, might be suited for quarries that provide minerals for low CO2 cements, while fluvial and sea transport make it easy to reach consumers. This can be done through the expertise of large cement companies. This is especially suited for Brazil where large projects (e.g. hydro power plants) exist. Such large projects also give the possibility of reducing the overall quantity of concrete used by switching to the most advanced material. On such specific market segments, the limited number of participants enables innovative products to penetrate the market.
4.2 MalaysiaIn 2006, Malaysia consumed 20 Mt of cement and had a clinker ratio of 0.89 t / t CO2, which is higher than the world average. The specific heat consumption for the clinker produced was 3,500 MJ / t. This country, which is located in a tropical area, used only 2% of biomass in the fuel mix. Due to low fuel quality, CO2 intensity in the mix was 0.097 kg CO2 / MJ. The CO2 intensity of the purchased electricity supplying the cement plants was very high at 0.532 kg CO2 / kWh.
The market concentration in Malaysia is also high, with 15 producers and 50% of the output from Lafarge Malayan Cement Bhd. The CO2 factor of the cement industry in Malaysia was 0.77 t CO2 / t cement in 2006 and led to global emissions of 15 Mt CO2 / year.
The share of biomass based fuels in the mix can probably be increased to 4% or higher but it is limited due to the country’s relatively high population density. The clinker factor can probably be lowered to 0.82 t / t. Also the average specific heat consumption of cement kilns can be reduced to about 3,250 MJ / t in 2020 by upgrading existing plants as well as efficient new plants. The reduction scenario shows an achievable decrease of the CO2 intensity to 0.68 t CO2 / t cement by 2020, which could limit the emissions from the sector in the country to 31 Mt CO2 / year (Figure 4.b).
Due to the relatively small number of participants, an agreement for the cement market in Malaysia can probably be reached between the parties to ensure the shift to lower technologies which enable the reduction of emissions. Nevertheless, ways to further increase the share of biomass have to be found. Another path is to reduce the CO2 from the electricity demand. An emphasis could be put on reaching the best possible electricity efficiency for each plant. A specific agreement could be reached to equip Malaysian plants with WHR (Waste Heat Recovery) generation. The stakeholders could also agree on specific programs to implement in order to decrease the amount of electricity consumed per t clinker.
4.3 MoroccoIn 2006, Morocco consumed 10 Mt of cement with a low clinker ratio at 0.73 t clinker per t of cement. The Moroccan heat consumption in 2006 was already at 3,450 MJ / t clinker. Due to its arid climate, the country has little potential for biomass. It merely represented 4% of the fuel supply in 2006. The electricity mix in Morocco is very CO2 intensive with 0.749 kg CO2 / kWh [127]. The coal fired electricity provides nevertheless 570,000 t of fly ash per year as clinker substitute.
Globally, the Moroccan cement industry emitted about 6 Mt CO2. Its emission factor is already at 0.62 t CO2 / t cement. The market is dominated by 4 companies.
Figure 4.b Production and emission scenario for Malaysia
Cement production (Mt)
Level of emissions under BAU
CO2 Emissions (Mt) using an enhanced policy
Mt
/ ye
ar
20202005
0
10
20
30
40
50

44A blueprint for a climate friendly cement industry
4. Reduction scenarios for selected developing countries
Figure 4.c Production and emission scenario for Morocco
Cement production (Mt)
Level of emissions under BAU
CO2 Emissions (Mt) using an enhanced policy
Mt
/ ye
ar
20202005
0
10
20
30
Figure 4.d Production and emission scenario for the Philippines
Mt
/ ye
ar
Cement production (Mt)
Level of emissions under BAU
CO2 Emissions (Mt) using an enhanced policy
20202005
0
10
20
30
40
The cement market in Morocco is expected to grow up to 20 Mt by 2020. At the same time, the share of biomass in the fuel mix might reach 7% or more. The thermal efficiency could also reach 3,250 MJ / t clinker if the required measures are taken to slightly improve existing plants. Additionally, one has to make sure that newly built plants are close to the best achievable level. The clinker ratio can be significantly decreased, and could reach 0.71 thanks to the coal fired power plants and the recovery of steel mill slags. The emissions factor could then be reduced to 0.59 t CO2 / t cement by 2020. This would limit the total CO2 emissions from the sector to a level below 12 Mt CO2 per year (Figure 4.c).
Substantial emissions reductions can be made in the field of electricity demand since Morocco features a very high CO2 intensity of the electricity supply. This can be reached through an enhanced electrical efficiency for existing and future cement plants. The high wind potential gives the possibility to increase the share of renewable energy to be supplied to the plant. Since generation from Waste Heat Recovery can be added with nearly no incremental emissions, it is also a very interesting path to reduce CO2 emissions. Moreover, WHR would add base load generation and stability to the Moroccan grid therefore balancing the effect of the fluctuating generation from wind power. It is therefore thought that retrofitting Moroccan plants with WHR is a very good option.
Morocco is a country where the use of solar thermal energy should be strongly encouraged since solar radiation is strong and reliable. Heat generated by solar concentrators could preheat the air supply for the plant, preheat the raw mill or generate additional heat to increase the electricity output of the WHR during daytime.
4.4 PhilippinesThe Philippines consumed around 14 Mt of cement in 2006 and had a clinker factor of 0.85. The main reason for this high factor was a relatively low presence of heavy industries to supply substitutes, as well as a decreased use of coal in the electricity generation, which resulted in less available ashes. The country is densely populated with over 270 inhabitants / km². Biomass already accounts for more than 6% of the fuel supply for the cement industry. The heat consumption is already under 3,400 MJ / t cement. The electricity mix is quite low in emissions with around 0.457 kg CO2 / kWh. The CO2 intensity of the cement industry was 0.72 t / t in 2006.
The cement market in the Philippines is expected to grow fast and reach 32 Mt by 2020. The share of biomass as fuel for the cement industry could then be above 10% with even more achievable. The thermal efficiency could easily be decreased to below 3,200 MJ / t clinker if the right standards are implemented for all plants built in the future. It will certainly only be possible to decrease the clinker ratio to 0.81 due to a lower share of coal fired power plants and a limited number of steel mills providing slags. The emission factor could then be reduced to 0.65 t CO2 / t cement by 2020 in an optimistic scenario. This would enable to limit the total CO2 emissions of the sector to around 21 Mt / year (Figure 4.d).
The Philippines will see a fast growth of cement consumption and has less room to decrease related emissions. As a volcanic archipelago, the Philippines have the possibility to explore their resources of natural occurring pozzolans as a substitute for parts of its clinker.

45A blueprint for a climate friendly cement industry
4. Reduction scenarios for selected developing countries
4.5 Discussion of commonalities and differencesA first important commonality between the four countries is their relatively small number of participants in the cement market, even in Brazil where the market is as big as Malaysia and the Philippines combined. This opens the possibility of agreements on a national basis to reduce the CO2 emissions from the whole sector.
The clinker factor, which plays a major role in the intensity of the emissions per tonne of cement, greatly varies between countries, where a large amount of substitutes to clinker are recoverable like Brazil or Morocco, (compare Figure 4.e).
All four countries have an efficient industry with low specific heat consumption since most of their cement industry is fairly recent. Thanks to the addition of newer and more advanced plants, the average efficiency is expected to increase even further. It will nevertheless be necessary to ensure the adoption of high standards for new plants.
A major difference is the availability of biomass as a carbon neutral fuel for the cement industry, which will perhaps help to turn Brazil into the lowest CO2 emitting cement industry. It is expected to have a fuel mix with a CO2 intensity as low as 0.062 kg CO2 / MJ achievable in 2020. On the other hand, Morocco, Malaysia and Philippines will almost exclusively use coal as fuel. Furthermore, the objective to achieve a higher electrical efficiency by reducing the consumption or installing waste heat recovery (WHR) generations has a very different level of importance in the different countries considering the present electricity mix and the additional potential they have for renewable generation.
It has to be mentioned that the scenarios depicted in Figure 4.f include only conventional measures such as thermal efficiency, the use of biomass and a use of clinker substitutes. Further measures on the cement chain such as addressing the demand side, producing low CO2 cementitious materials or carbon capture and storage (CCS) have not been taken into account but offer large additional reduction potentials.
Figure 4.e Compared scenarios: share of substitution material in the cement
BrazilPhilipinesMalaysiaMorocco
0
5%
10%
15%
20%
25%
30%
35%
Share of clinker substitutes
2006
2020 (policy scenario)
Figure 4.f Compared scenarios: fuel use in 2020 using an enhanced policy scenario
Decrease in specific fuel consumption through energy efficiency
Remaining fossil fuel energy consumption
Energy supply from biofuels
0
1,000
2,000
3,000
4,000
MJ / t clinker
Strong policy goalto reduce the specific heat consumptionof all countries to3,200 MJ / t clinker
BrazilPhilippinesMalaysiaMorocco

46A blueprint for a climate friendly cement industry
5. Emission reduction scenarios for cement production in China
5. Emission reduction scenarios for cement production in China
5.1 The frameworkThe Chinese cement market is significantly fragmented and controlled by different government institutions:
The NDRC (National Development and Reform Commission)• 1 sets the leading trends for the Chinese economy in a 5 year plan and is quite decentralized with powerful provincial branches. Every project has to receive its approval. The NDRC is one of the most powerful ministries in China. Several of its branches are in control of the energy sector.
The NDRC has some of the major governmental tools to steer the economy in specific sectors through the laws •for investment. They vary greatly according to the priorities of the government and are divided in four categories (see Table 5.a)
The Ministry of Construction.•
Other important participants include the China Building Materials Industry Association which is a partner of the development of industry policies by the NDRC.
All large investments are reviewed by the provincial government or even the central government in the case of the largest ones (Table 5.a). Projects aiming to use inefficient and outdated technologies will be forbidden [128]. Additionally, a new law from 2004 sets strict standards regarding the heat consumption and electricity consumption. The minimum capacity has been set to 4,000 tpd [129].
Table 5.a Official investment categories in China and usual conditions [130]
Investment category Tax situation Examples
strongly encouraged investments with tax incentives very environmental friendly technologies
allowed normal conditions
restricted investment expensive permitting investments in overheated sectors
prohibited fines for companies not complying outdated polluting vertical kilns.
The SEPA (State Environmental Protection Agency) is not a ministry. Nevertheless it can refuse a permit for a plant or shut down an operational plant based on environmental criteria in cooperation with the NDRC.
1. Formerly known as SDPC (State Development Planning Commission)

47A blueprint for a climate friendly cement industry
5. Emission reduction scenarios for cement production in China
The central government’s goals are clearly communicated to local governments. Feedback about the results is collected in order to monitor the progress established. Local governments administrating provinces or districts are the ones that implement the decisions on a local scale and as such are the best partners for projects. They are in charge of reporting the progress achieved and have extended power to reach their goals. This is even more the case now since the industrial ministries were decentralized in 2001 [131]. It is for example possible for them to require the closure of a plant or refuse the permission of operation for a plant.
The enforcement of laws has improved in recent years but is still problematic. The main reasons for the difficulties experienced in implementing policies are their side-effects induced on a local scale, which are a burden for the province or its local government. When an inefficient factory is closed, the advantage for the energy efficiency is national, while the side-effect on the employment is on the local scale [132]. Moreover, local governments are often the owners of local enterprises including cement plants [133]. Therefore, the special interest of provinces has to be taken into account. The local branches of SEPA are financed by the province, which may have other objectives than central SEPA.
Regarding the present market policy, the government is trying to consolidate the cement market with an investment policy to support newer, larger and more efficient plants. Investments in older plants which will not be able to meet standards are already forbidden, and the government has taken substantial steps to close down older kilns which feature a low level of efficiency [134].
CO2 emission projections (see section 5.1.3) predict emissions which are much higher than the cap the Chinese government has set and is strongly committed to comply with. Therefore, additional measures to reach this goal will have to be taken, which will have important consequences for any investment in the sector [135].
There are contrasts and disparities in the Chinese society, which the government is currently working to resolve. A strong emphasis is presently put on balancing the difference of wealth between least and most developed provinces (as depicted on 5.f) as well as between rural and urban areas. Industrialization plays a key role in this process including the cement industry, which is a very central sector for development of infrastructure and the housing sector.
The total lifecycle of energy needed for buildings in China is high compared to international standards for countries with similar climatic conditions. It can be divided into energy needs in two distinct phases:
The energy consumed for the construction and disposal of the building. It has to be spread evenly over the lifetime •per square meter of the building per year. As a result there are two ways to reduce the impact of this energy invested for the creation of the building. The first possible optimization is to limit the energy used for the construction of buildings. The second possible optimization is to increase the service life of the building for the same energy invested in its construction. This is important since a significant share of buildings in China have a lifespan of only 30 years. This means that potentially there could be a high demand for building replacement or refurbishment in China as early as 2030.

48A blueprint for a climate friendly cement industry
5. Emission reduction scenarios for cement production in China
The energy which is consumed during the service life of the building. It strongly depends on the climate, use pattern •as well as technological characteristics of the building. The direct need for energy in the built environment in China already represents 23% of the total energy demand in 2005 and is sharply increasing [136]. In 2010, the building sector might consume one third of the energy used [137]. This is largely due to the average level of technology used to achieve the increased comfort in the built environment. This demand for comfort is a very strong driver of the energy demand, as a growing number of people reach a sufficient level of income.
In the northern part of the country, the increased energy demand results from household heating. Nevertheless, the highest increase results from widespread air conditioning [138] in the southern parts of the country, where the climate is sub-tropical. The demand for air conditioning is increasing with its affordability. It is also driven by local temperature and humidity increases in the most populated areas.
The increased use of energy (e.g. ownership of an air conditioner, a car, a large television screen, etc.) in modern China is associated with a higher purchasing power to cover various needs starting from the basic ones. Nevertheless, there is generally a large room for improvement regarding the supply of energy in the built environment on every level. This is, for example, the case with building design and improvement. It is also the case regarding the distribution, metering and billing of the use energy. Also an increase in environmental consciousness could achieve significant results regarding the mitigation of the energy demand.
The acceptance of new technologies and, new ways of thinking, is high in China, while resistance to progress or necessary sacrifice is much lower than in the classic industrial nations. Nevertheless, the access to all new sustainable technologies can and should be strengthened.
The willingness to cooperate on key topics such as development, climate change and sustainability is high, giving unique opportunities for action. For example, clay bricks, despite being a traditional Chinese construction material, have been officially banned [139] in many urban regions, forcing the switch to hollow concrete blocks which are up to 50% less energy consuming [140].
5.2 Production scenario for China5.2.1 Demographics
The People’s Republic of China is presently the most populated country in the world with an estimated 1.32 billion inhabitants in 2006. Previous studies2 have projected the future population, GDP and cement production for China. The current status quo deviates quite significantly from fairly recent projections of present situation. First, the population is lower than expected and more recent projections indicate an effective cap on population growth. The population is projected to ultimately peak at 1.46 billion by 2030 [141] before decreasing, while the previous forecast was of 1.58 billion in 2035. Therefore, the further population increase (around +10%) will only have a limited impact on the future demand growth.
2. A1 SERS scenarios from the IPCC which assumes the lowest population growth of all 4 proposed scenarios.
Figure 5.a Demographics of China: past and forecasts.
0
400
800
1200
1600
1950 20502030201019901970
Millions inhabitants
Recorded data and IMF forecast
SERS A1 Scenario
Recorded data Forecasts
Figure 5.b Evolution of gross domestic product in China (Measured in USD GDP ppp per capita; records and forecasts) [145]
0
5,000
10,000
15,000
25,000
1990 202520152010 2020200520001995
GDP ppp per capita in China
20,000

49A blueprint for a climate friendly cement industry
5. Emission reduction scenarios for cement production in China
Figure 5.c Relation between population, GDP and cement consumption – Records and forecast for the Chinese cement production (2006) [149].
0
800
1,200
1,600
2,000
Cement production in Mt / yearGDP ppp/ inhabitant adjusted
in current international $
400
0
8,000
12,000
16,000
20,000
4,000
Chinese average GDP ppp in adjusted 1990 $ per inhabitant
Chinese cement production (Mt / year)
Point of expected stabilization of the cement demand around $8,000 GDP ppp per capita (in 1990 $)
1990 202520152010 2020200520001995
Recorded data Forecasts
The most noticeable factor in China´s demography will certainly be the rapid urbanization. This is an important factor since it leads to large changes in lifestyle which has a large impact. It is especially true since the urban population in China has a significantly higher average income than the rural population. This increased purchasing power in turn commonly leads to an increased demand for energy. Around 18% of the Chinese population was urban in 1978 compared to 42% in 2004. This rate is expected to increase to 50% in 2020 [142].
Table 5.b Demographics of China: past and forecasts (ins on inhabitants)
Year Population (ins)
IMF recorded data and IMF forecasts SERS A1 Scenario
1950 562
1960 648
1970 820
1980 984
1990 1,147 1,210
2000 1,267 1,410
2005 1,307 1,478
2010 1,347
2020 1,430 1,549
2030 1,461
2035 1,575
2040 1,454
2050 1,424 1,477

50A blueprint for a climate friendly cement industry
5. Emission reduction scenarios for cement production in China
5.2.2 National economy
Scenarios in earlier studies projected a GDP ppp (in 1990 dollars) of $2,670 per inhabitant in 2005 when in reality $3,087 [143] were achieved, 15% more than the forecast. This difference to the expected scenario is largely due to the Chinese GDP growth which has been very strong and steady during the last 5 years, with an average of 9.5% during the 2000-2006 period. It peaked in 2006 with 11.1% [144], which is one of the highest growth rates achieved in the world. As population, GDP and growth deviated so strongly from previous studies, all following forecasts will be based solely on more recent (2004 to 2007) figures and forecasts.
With continued governmental steering of the Chinese economy and in absence of any major crisis affecting China, forecasts [146] predict an average annual real growth of 8% from 2006 to 2010. Beyond 2010, annual growth is expected to remain stable at around 7% through 2020 [147], then to slowly decrease.
5.2.3 Relation between wealth and cement demand
As mentioned earlier, it is possible to reliably predict that a country’s cement demand stabilizes by reaching a certain level of GDP per capita. Expressed in international U.S. dollars PPP, this inflexion point occurs at $15,000 (expressed in 2005 $) or $8,000 (expressed in 1990 $).
Using projections of the future, Chinese GDP one calculates that China will reach the stabilization point of its cement demand around 2017 (see figure next page).
In 2006, China produced 1,260 Mt of cement representing a 45% share of the world global output of 2,640 Mt [148]. The cement production even turned out to be about 90% higher than the 565 Mt projection for 2005. In turn, older forecasts for cement production are not considered relevant anymore.
Using projections, it is estimated that the demand for cement will probably stabilize at a level between 1,500 Mt / yr and 2,200 Mt / yr with a realistic average of 1,800 Mt / yr. The stabilized demand for cement is then expected to slowly decrease to around 1,300-1,500 Mt / yr until 2030, which would leave an overcapacity for production in the reference scenario.
5.2.4 Scenario for China
As displayed in Figure 5.c the cement demand in China grew at an exceptional rate over the last 10 years. Nevertheless, it is expected to continue to grow at a slower pace in the future and to decrease in the long-term. The following Figures 5.d and 5.e show that economies that have recently become industrialized (e.g. Korea or Spain) still have very high per capita cement consumptions since they still have strong demands for buildings and infrastructure. Once these needs have been met, cement demand tends to quickly decrease.
The total demand for cement will probably start a slow decline after reaching 1,800 Mt / yr, since this would mean an average lasting consumption of 1.27 t / inhabitant per year, compared to 0.54 in Japan and 0.48 in the EU [152]. Consequently, the government will probably try to limit the investment in cement factories in order to avoid locking the country into a lasting over-capacity. An over-capacity would result in cement being sold at low prices which would encourage excessive use, harming alternative products and efficiency.
Figure 5.d Relation between cement demand per capita (in kg / year) and GDP [150]
30,000
• Spain
• South Korea
• Japan
• France Germany • • USA
• UK
Almost stable level of consumption of most OECD countries
0 2,000 4,000 8,0006,000 15,000 20,000 25,000
Cement demand per capita in kg / year
Point of expected stabilization of the cement demand around $8,000
0
200
400
600
800
1,000
1,200
Chinese cement production 1980 – 2007 period
Chinese forecasted cement production below 2007
Proportional increase of the cement demand for the OECD countries till $8,000 (1990 $) GDP ppp and further stable demand below this GDP turn around point.

51A blueprint for a climate friendly cement industry
5. Emission reduction scenarios for cement production in China
The following estimates are based on the best available data and assumption [153]. They have nevertheless to be considered with caution:
The depicted forecast is global for China and does not reflect the developmental difference between coastal •and central provinces. The poorest province has an average GDP per inhabitant 10 times lower than Shanghai (see Figure 5.f). As an average, the 50% most advanced provinces have a GDP per inhabitant that is twice that of the 50% poorest . Therefore, a rather uneven growth in the cement sector can be expected.
Over-investment in some sectors is a lasting problem in China as stated by the government• [154]. As a result, the government tries to avoid the overheating of some industrial sectors and only quality projects able to bring long-term benefits are favored.
Several coastal provinces are already showing signs of stabilization in the cement demand.•
A large part of the demand is still due to major infrastructure projects (30%)• [155] as well as real estate, both regulated by governmental agencies. Therefore the government has the possibility to steer the demand for cement and avoid a future overproduction.
The present scenario does not take into account possible intervention of the Chinese government to steer the market.•
5.2.5 Energy sector in China
Since the cement sector is energy intensive, it is important to understand the situation of the Chinese energy sector and its driving factors.
China’s energy use grows at an annual rate of 5% [157] which is roughly half of its GDP growth. The next 5-year plan aims to reduce the energy intensity by 20% under the 2005 level. The GDP growth over the 2006-2010 period has been estimated to 45%. In turn, it means that during this same period, the growth in energy demand will have to be limited to 4% per year.
China tries to limit its dependency on energy imports. At the same time, sharp increases in oil and natural gas prices internationally reduce their economical viability. In turn, China relies on its large domestic coal resources to face its rapidly increasing energy consumption.
Coal power plants contribute to more than 80% of the energy mix [158], and this share is not expected to decrease in the near future. Moreover, the average efficiency of coal power plants was around 30.5% in 2005 [159] compared to 45% achievable with best current practices [160]. The efficiency is nevertheless increasing fast due to the many new large and more efficient coal power plants.
In the dynamic province of Chongqing, the GDP grew by +12% in 2006 but the energy use by +25%. This makes the goal very challenging on a local level, since there is a large gap between the required decrease of energy intensity per GDP which is aimed at (-20% over 5 years) and the evolution in 2006.
Figure 5.e Cement consumption per capita in different countries and years. [151]
Kor
ea
Sp
ain
Almost stable level of consumption of most OECD countries
Recently developed economies.
Chinese cement demand in 1990, 2000 and forecasted 2015 demand.
0
200
800
600
400
1,000
1,200
1,400
Ktonnes per year
2005
US
2005
Jap
an
2005
Fra
nce
2005
Ger
man
y
2005
UK
Chi
na 1
990
Chi
na 2
005
Chi
na 2
015

52A blueprint for a climate friendly cement industry
5. Emission reduction scenarios for cement production in China
This intensive use of coal resources puts a heavy burden on China’s own environment, and imposes heavy health and environmental costs on the Chinese economy. The present development path of the Chinese economy is carbon intensive. This will have an impact on China for several decades, as infrastructure established, or being subject to investments, are now expected to remain in operation for the long term future (20-50 years). This effect induced by the slow pace at which production infrastructure are changed is called “lock in effect”. In a carbon-constrained world, being locked in a high emission economy is likely to result in a loss of competitiveness.
5.3 The Chinese cement sector: status quo and trendsAs presented above, China is leading the global cement market with about 1,240 Mt produced in 2006 [161]. Furthermore, the Chinese cement market experienced the fastest growth, with an average increase of over 10% per year during the last 6 years. Predictions estimate a future growth of 4.5% per year [162].
The structure of the Chinese market is unique. The main market players are not only private companies. Indeed, in 1999, collective and state-owned companies still represented 80% of the total plant ownership [164]. The number of private companies, foreign owned or joint ventures, has nevertheless increased. This development is encouraged from the side of the government. China has a large number of small companies, but large companies are currently developing fast, and the average production per company is increasing rapidly from 0.1 Mt / year in 2000 to 0.2 Mt / year in 2005 and 0.4 Mt / year planned before 2010 [165]. Mature markets feature larger companies with production in the range of many millions of tonnes of cement per year. Regarding size, technology and practise, only 150 Chinese companies out of over 5,000 can be considered modern. A critical size is often needed to perform well, and further mergers are warranted [166]. Ten companies nevertheless already have an output of over 10 Mt / year in China and the government plans to bring the number of companies down to 3,500. The top 10 major companies on the national level by 2010 are expected to hold a total 30% share of the production and the 50 major companies, around 50% of it.
The number of plants was between 7,000 to 9,000 in 2002. Almost half of all the plants (4,000) are located in rural areas and have an annual output of around 40,000 tonnes compared to at least 1 Mt / year for a modern international facility. By 2020, the government aims to increase the average plant size to 0.6 Mt / year.
Approximately 2,000 plants are either illegal or do not comply with minimum requirements anymore. An elimination of those and other outdated plants was planned in 2005, with an aim to close 4,000 plants altogether. Progressively closing these outdated plants would not cause a major disruption of the production since the smallest 50% of plants only contributed around 250 Mt cement / year [167], which is now less than 20% of the cement production. Moreover, the Chinese market has a slight overcapacity.
A large share of the small plant closures did not take place, despite having the subsidies and incentives to do so. The main reason was the impact closure would have on the local economy in rural areas.
Coastal provinces
Chinese average
Other provinces
Western and central provinces
0 12,00010,0008,0006,0004,0002,000
$8,000: Inflexion pointfor cement demand
Figure 5.f GDP per capita of Chinese provinces (in 1990 $, ppp) [156]

53A blueprint for a climate friendly cement industry
5. Emission reduction scenarios for cement production in China
The technology nevertheless changed rapidly as displayed on the Figure 5.i. New dry cement plants with pre-heaters and precalciners are by far the most efficient type of cement plants. Their specific fuel consumption amounts to 3.3 GJ / t clinker or less which is close to the Japanese performance level (3.1 GJ / t clinker) and a huge improvement compared to the former shaft kiln technology (4.7 to 6.5 GJ / t clinker). In 2002, the Chinese average electricity consumption was 105 kWh / t of clinker for improved vertical shaft kilns, compared to 92 for modern Japanese kilns. Electricity in China is mostly based on coal generation and is much more CO2 intensive than in other countries. Very recent Chinese dry kilns show a performance of only 60 kWh / t clinker.
Nevertheless, the new dry kilns represented only 12% of the Chinese capacity in 2000. Large investments in this technology are currently taking place. In 2005, the technology reached a share of 53% with 450 Mt installed over 5 years. By 2010, new dry kilns will provide over 70% of the total output.
The production in obsolete kilns (most of them based on the vertical shaft technology) declined and the governmental target now is to have them almost totally phased out by 2010. This requires the elimination of 250 Mt obsolete capacity. Increasing capacity, and building or enlarging shaft kilns and other technical obsolete equipment is already prohibited. Trespassing this law can lead to dismantling and punishment but its enforcement is the duty of the local government.
On the other hand, investments in large plants are encouraged and enjoy a favorable tax package. Generally, large groups who have large and modern kilns in their portfolio are much more profitable while the small sized enterprises earn less profit or even make losses.
China is trying to become a leader in the cement plant technology and already holds a 20% share of the international markets. Chinese technology is by far less expensive, and costs amount to only 20% to 50%, compared to imported technology. In the large capacity segment, performance at or close to international advanced levels can be found. China is only lacking performance on specific plant features. Nevertheless, this gap could be filled through cooperation with international companies especially since increased efficiencies can be financed by carbon credits.
Furthermore, it is remarkable that over 90% of the large new cement production lines in China (5,000 tpd) were designed domestically, and that China hosts four of the seven 10,000 tpd lines existing in the world.
The way cement is sold is also changing rapidly. Bulk cement represented only 8% of the market in 2000, but as early as 2010, it is expected to reach a 60% share. On site cement manufacturing is already banned, as it was driving the use of small and inefficient kilns. Ready mix of concrete is encouraged since it supplies an optimized concrete mix while site mixed concrete will probably be forbidden for some applications.
One of the important problems in the Chinese cement market is still the cement quality. Common cement grades range from 30 to 80 MPa compressive strength. While backwards shaft kilns produce low grade cements, new dry kiln allow the production of the highest strength grades. Consequently, shaft kiln cement is not allowed for many major infrastructures, and low strength cements are on the way to being phased out. China is rapidly shifting to higher grades which are also more profitable to produce. It is expected that a set of new legal provisions will further encourage high performance cements, and that for each category a higher minimal strength will be required.
Figure 5.g Total Chinese cement production (In Gt / year):history and forecasts [163]
Gt
/ ye
ar
Rest Of the World (ROW)
China
1990 205020402030202020102000
0
1
2
3
4
5
6

54A blueprint for a climate friendly cement industry
5. Emission reduction scenarios for cement production in China
The demand for concrete in China is also very different from mature markets. While in mature markets, 70% of the demand is used for housing, in China, the largest part is used for building basic infrastructures (generally large projects) with a share of 40%. China also builds roads mainly from concrete and not on an asphalt basis.
In 2004, 40% of the production was still in the more advanced eastern provinces which representing around 27% of the population. Furthermore, ten provinces accounted for 70% [170] of the cement sales in 2002, and a stabilization was observed. On the other side, in the western parts of the country, there is a high increase in demand, as these areas are still far from reaching stabilization (see Figure 5.f ).
Early measures concerning the use of fly ash have already been taken by the Chinese industry and it is estimated that 110 Mt of slag was used in 2004. This is around 80% the quantity produced by domestic steel furnaces. Furthermore, 50 Mt of fly ashes were used. As a result, the Chinese cement addition is already high at 21-23%, leaving limited room for additional improvement. It should be considered that this ratio, and the availability of ashes, will remain stable or even grow since the steel industry and the coal power generations from which they are derived are expected to grow at a rate at least equal to the cement industry.
As explained above, the restructuring of the Chinese cement market is ongoing. The coming decade is expected to bring an almost total elimination of shaft kilns. Large companies, both Chinese and international, will grow and benefit from favourable policies to encourage investment in large plants. They are expected to establish state of the art plants combining Chinese improved and affordable technologies with imported high performance features. Participation in the future market will be by far more difficult due to unequally higher energy and environmental standards. Since cement plants have a life span of 30 to 50 years, these high standards will have to be enforced early in order to avoid a long term handicap to the Chinese economy. No further investment in processes other than new dry line is allowed. Cement quality is improving and will keep shifting to higher grades.
5.4 Potentials and barriers for reduction measuresWith its largely coal generated electricity, China annually produces 350 Mt [171] of fly ash which can partially be used as a substitute to cement clinker. This amount is expected to increase. Furthermore, 2,500 Mt [172] of fly ashes are stockpiled, but their carbon content is often too high for direct use. At present, Chinese law allows the use of fly ash for structural cements and substantial tax cuts are granted for plants with over 30% clinker substitutes in the cement. It is also technically possible to reuse, stored fly ashes by introducing them in new dry kilns near the flame at a rate not exceeding 5% admixing.
Around 200 Mt blast furnace slags are produced in China annually. Large quantities are nevertheless unsuitable due to their chemical composition. Regarding biomass, over 500 Mt are available [173], but their use is limited due to transportation difficulties. Moreover, most of this biomass is already used. Roughly 200 Mt of biomass are used directly, and probably less than 100 Mt could possibly be recovered for the cement sector.
Other alternative fuels like waste and sewage sludge are presently being developed. Barriers on the legal and technological sides remain.
Figure 5.h Size comparison between Chinese outdated plants and international standards (in 2002).
Annual Output (in Mt / year)
Typical Chinese small plant 0.04
New minimum plant output in China (4,000 tpd)
1.5
Largest Chinese plant 4.5
International standard for new plants
1.0
Japanese average plant 2.6

55A blueprint for a climate friendly cement industry
5. Emission reduction scenarios for cement production in China
Regarding the company level, it has to be kept in mind that small cement companies often do not have the economic capacity to realize the new necessary investments into advanced plants. This is particularly difficult as retrofitting an old plant is often less viable than building a new one. The Chinese government has nevertheless set up a strong program to consolidate the market and phase out outdated kilns. Additionally, it has given priority support to the emergence of market leaders.
The cement is presently at a price level of $40 (roughly half the price of most countries) and the quality produced is lower due to the competition of inexpensive and outdated kilns. This in turn gives an incentive to use larger quantities of concrete. New minimum standards for cement categories (based on strength) have been set to limit the low quality concretes which leads to overuse. Since the next large increase in concrete demand will be in the countryside, providing education and advice to the customer side will be crucial.
The Chinese government stated it aims to “build new socialist villages based on cement” and further stated that “there is a need to develop the cement industry fast and scientifically toward efficiency”. As such, the governments discussions with large producers of cement and building materials could help to enhance this development, allowing for a low CO2 impact. This is especially a challenge since the customer basis is largely used to working with OPC (Ordinary Portland Cement). However, there is a special potential in China as Belite clinker has been successfully tested e.g. in the Three Gorges Dam project and research on low CO2 cements is being carried out. Such special cements could be spread at a larger scale.
Regarding the thermal performance of cement plants in China, a rapid elimination of older kilns by 2010, as well as the construction of many new dry kilns which consume considerably less coal per tonne of clinker, are an opportunity to reach the target of under 3.4 MJ per tonne of concrete probably before 2020 as well as decreased electricity consumption. The goal of having 70% of the plant equipped with waste heat recovery by 2010 will help to mitigate the rapidly growing need for coal generated electricity in China. Imported high performance production equipment is taxed quite heavily, and generally much more expensive than Chinese equipment.
Regarding energy economics, the price of coal in China reflects the energy prices on the international level. The coal found in China is of low quality and needs to be washed before being used. The existing tax is presently 33% on profit and 17% VAT. The industrial electricity is sold at real price. This leaves much room for the government to use a shift in taxation towards the energy consumption to enhance the shift to a more efficient industry. At the same time, the government has set up a system of soft loans to improve the financing of energy efficiency projects.
Large necessary shifts like the closure of outdated plants will provide substantial benefits to Chinese society through an enhanced environmental protection.
Figure 5.i Kiln technology in China: past, present [168] and forecasted [169] situation (in Mt / year capacity)
Rotary kilns (mainly new dry kilns)
Old kilns (mainly shaft kilns)
1985
1987
1989
1991
1993
1995
1997
1999
2001
2003
2005
2007
2009
2011
Phase-out ofoutdated kilns
2013
2015
2017
2019
2021
0
2000
1800
1600
1400
1200
1000
800
600
400
200
Available records Forecasts

56A blueprint for a climate friendly cement industry
5. Emission reduction scenarios for cement production in China
Regarding law enforcement in China, the local government holds extended powers. GDP and taxes are still the key performance indicators on a provincial level, which may lead to over-capacity in the mid-term. The consideration of CO2 emissions in relevant sets of official indicators could help to prepare the local governments to limit both energy consumption and emissions. This is already the case in the form of the program which aims to reduce energy intensity by 20% for the 1000 largest energy consuming companies. Another example for improvements in the field of local implementation of national energy policies, is the global energy efficiency 20% energy intensity target. Regarding this plan, each province is already committed to its share of the national target.
5.5 Ancillary effectsClosing outdated cement plants and upgrading the existing ones is a key measure to reduce CO2 emissions in the cement sector. In China the cement industry accounted for 35% of the total dust emissions in 2004 and plants emitted around 13 times more dust than in developed countries. This was due to the small plant and poor plant equipment [174]. Small plants generally are not equipped with filters or scrubbers and have specific emissions from 2 to 20 times higher than modern plants. Other emissions of relevance include nitrous oxide, sulfur oxide, mercury. Furthermore the cement industry contributed for example to 5% of sulfur emissions in China. Locally the impact of the pollution can be very acute especially in the many poorly aerated valleys. According to Chinese own sources, the global annual cost of pollution in China is around 3% of the produced GDP [175] and is responsible for 200,000 premature deaths each year [176].
As a result, there are significant additional advantages to retiring the small and outdated cement kilns in China. Such plants will not be retrofitted as it is less expensive to build whole new plants. Emission laws in China for pollutants are very strict, but can often not be implemented since outdated cement plants do not have the ability to comply. Closing these plants would also pave the road to better enforcement of air quality laws.
Effects on the employment also have to be considered. To modernize the production capacity, only large plants are allowed to be built, generally with a capacity over 4,000 tpd, while a phase out of small outdated kilns is planned. Figures show that in 2005, the Chinese cement industry had a total working staff of 1.4 million in 5,200 companies for an output of 1,064 Mt. With only 46,400 employees in the sector, the European Union produced 247 Mt. When the Chinese industry reaches such a high productivity in the sector, only 200,000 jobs would be left in the cement sector. This would lead to a loss of 1.2 million jobs over the next two decades, especially in rural and remote areas where the smallest kilns are located, and unemployment is already high. An exact quantification of the social impact is nevertheless difficult since some of the vertical shaft kilns are only operated during certain months throughout the year.
It is not unlikely that through the expansion of the service sector in China, former employees of old plants will be able to find new employment. Compensation equal to two years of income (RMB 20,000-30,000) is typically paid if an old plant is closed by a large manufacturer. Nevertheless, the phase out of VSK might harm the rural economy. It will nevertheless save the equivalent of around 15 million tonnes of standard coal annually by means of the reduced energy consumption [177]. VSK kilns are also not able to produce high quality cements but instead produce low quality ones at a low price. As such, they contribute to the spread of poor building practices, and lead to over-use of cement, and impede a more rational use of concrete.

57A blueprint for a climate friendly cement industry
5. Emission reduction scenarios for cement production in China
5.6 Energy in buildingsThe construction of urban buildings is expanding very rapidly in China and accounted for 30% of the cement demand in 2006. The construction of buildings and roads in rural regions dominated by farmers represents 40% of the current demand for cement [178]. The remaining 30% of the cement demand in China is consumed for infrastructure (e.g. roads, airports, dams, bridges, etc.). While the cement demand on the coast side is already stabilizing in eight provinces, the demand is strongly growing in the countryside where the government aims to increase development and reduce the disparities between rural and urban areas.
This building sector is expected to continue to show strong growth, further and consume large quantities of concrete. It is driven by the increase of the Chinese population, the growing urbanization, and the increase of space requirements per capita in urban areas. The housing surface per inhabitant in China was around 20 m² per capita in 2006, leaving a strong margin for increase compared to the 40 m² per capita in developed countries. Around 55 million of new square meters were built in 2005 in the Municipality Chongqing adding around 1.7 m² per capita.
Due to the lack of forests, the possibility of using wooden structures to build houses is very limited in even in the Chinese countryside despite the fact Chinese traditional buildings were made of wood.
The average lifespan of a modern building in China is expected to be around 30 years compared to 100 years in other countries. This might result from the combination of several factors. One factor is the poor concrete quality used based on cement from shaft kilns. Other factors are strong urban growth and transformations. Buildings built in the past are rapidly outdated, not suited for new urban schemes, and need replacing.
The materials used in buildings are changing very fast. The CO2 and material intensive solid clay bricks (red bricks) are being phased out in all provinces. Nevertheless, due to inexpensive labor cost, the red bricks from dismantled buildings are collected and reused providing substantial savings.
The large share of buildings made of full concrete in China also explains the large demand for cement. This is mainly driven by the very low price of cement ($40 per tonne, half average worldwide price) and the need to build fast in a booming sector. As such, concrete is favored, which can be poured very quickly in cast and is suited for high-rise buildings.
The market for new materials is rapidly growing. This is the case for hollow concrete bricks, aircrete or hollow clay bricks. Such materials are used as light filling materials in high rise buildings. They are now also allowed as construction materials and fit well for smaller projects.

58A blueprint for a climate friendly cement industry
5. Emission reduction scenarios for cement production in China
Over 80% of the energy in a building is consumed during its lifetime. Only 20% is related to its construction. In turn, the qualities of the materials are very important for the energy efficiency of the building. The new Chinese building energy standard asks for a 55% energy saving compared to the previous standard. In turn, advanced construction materials with heat insulation properties have a growing role to play. A recent study has shown that at an advanced level of development, like in Shanghai, 40% of the energy in buildings is used for cooling [179]. Direct solar radiation in the most populated areas of China is comparatively low, limiting the current economic potential for the use of solar technology for buildings. The WBCSD is currently undertaking a comprehensive effort to analyze the greenhouse gas reduction potentials over the entire life-cycle of buildings [180]. Concrete and its impact on the overall heating and cooling demands of buildings in different climates is studied as one important building material.
While cement production lies in the responsibility of the NDRC, the use of it under the ministry of construction as well as the responsibility for the energy which is used during a building life-cycle is less defined. Standards are nevertheless improving and supervision is being put in place. A strict licensing system has even been established with legal obligation to pay fines or proceed with upgrades for non-complying buildings. New concrete products and concrete hollow bricks have the potential to save energy substantially. This applies for concrete as well, especially in the countryside, where the demand for construction is expected to grow. This is especially relevant since the countryside has a large workforce for masonry and where there are no deadlines requiring a rapid finalization of the construction. Moreover, with the spread of new rotary kilns, highly compressive strength can be achieved through the use of high-strength cements.
5.7 Greenhouse gas emission mitigation scenario for ChinaThe share of global emissions from developing countries will continue to grow, as their growing populations need to meet their basic social needs. China presented a detailed national plan to address climate change on the 12th of July 2007 [181]. Emissions of CO2 in China were at 4.3 tonne per capita in 2006 [182]. This is equivalent to the world average (4.3 tonne per capita) but still relatively low compared to developed countries (close to 11 tonne per capita in OECD countries in 2004 [183]). Commonly economic and social development and poverty eradication are the first priorities for developing parties.
On the basis of equity, and with respect to the principle of common but differentiated responsibilities and respective capacities, China has set a plan for the period up to 2010 on how to contribute to the mitigation of global warming.
At first, this plan details the observed impacts of climate change in China in the past and at present and secondly continues to list the ones expected in a near future. These impacts are likely to be higher than for most countries in the northern hemisphere [184]. Among them, the change of precipitation patterns would lead to more extreme weather conditions, such as flooding, in the southern provinces. On the contrary, the notorious water scarcity might become more accurate in Northern provinces at the same time. In addition the risk of desertification is important while mountain glaciers are retreating.

59A blueprint for a climate friendly cement industry
5. Emission reduction scenarios for cement production in China
China has started to address the secondary sector through industrial energy efficiency measures. Activities in the tertiary sector are strongly encouraged as they produce wealth at a comparatively low level of energy consumption with low emissions.
The Chinese government aims to further spread energy saving technologies through various ways including efforts in research and development, and the import of energy saving technologies and cooperation.
The Chinese approach comprises the development and extended use of hydropower, nuclear energy, oil, gas, coal-bed and coal mine methane, as well as several sources of renewable energies.
The afforestation in China has already increased the share of forest cover from 14% to 18% between 1990 and 2005 and is planned to grow to 20% in 2010. Also the agricultural sector will contribute through enhanced methods especially with food production.
Regarding its institutions and capacity for policies, China has set up a National Coordination Committee on Climate Change (NCCCC) which is comprised of 17 ministries. The climate change issue will be integrated into other related policies. Capacity building has been strengthened in regard to national policies on climate change. Among others, this will address the transformation of economic growth and create a more active policy in energy conservation and strengthen supervision. The goals are both individual and collective. On an individual level, awareness will be increased, and on the collective level, China’s capacity to promote sustainable development will be enhanced.
Due to its large population, fast development, and a coal dominated energy mix (69% of the primary energy in China in 2005), the expansion of capacities to tackle climate change in China is very challenging. Growing urbanization, industrialization and increased energy consumption are among the barriers. Moreover, the availability of and potential for low carbon energy resources per capita is comparatively low.
Large advancements are possible for the energy efficiency which is significantly lower than in developed countries. Energy intensive products are manufactured with an energy utilization much higher than common on the advanced international level. This leaves much room for improvement.

60A blueprint for a climate friendly cement industry
5. Emission reduction scenarios for cement production in China
Compared to a business as usual reference scenario, the measures in Table 5.c have been quantified by the Chinese government, and are scheduled for implementation:
Table 5.c Measures from the Chinese national plan to limit the Greenhouse Gases emissions by 2010
Type of greenhouse gases emission reduction Reduction (CO2e)
Expand the hydropower generation 500 Mt
Expand the nuclear power generation 50 Mt
Increase the efficiency in thermal power generation 110 Mt
Develop coal-bed methane and coal-mine methane 200 Mt
Promote bio-energy in heat and / or power generation 30 Mt
Promote wind, solar, geothermal and tidal energy 60 Mt
10 Key energy conservation programs:
•UpgradingofLow‑efficiencyCoal‑firedIndustrialBoiler(Kiln),
•DistrictHeatandPowerCogeneration,
•RecoveryofResidualHeatandPressure,
•OilSavingandSubstitution,
•EnergyConservationofMotorSystem,
•OptimizationofEnergySystem,
•EnergyConservationinBuildings,
•GreenLighting,EnergyConservationinGovernmentAgencies,
•BuildingtheEnergyConservationMonitoring
•TechnologicalSupportSystem
550 Mt
Total of all previous abatements compared to Business As Usual: 1,500 Mt
5.8 National and regional policies and measures to realize reduction measuresThe way in which environmental issues are addressed in China is currently undergoing changes. From being an unavoidable and minor side-effect of development, the environmental problems are now considered a major issue. The SEPA (State Environmental Protection Agency) estimated the economical loss due to pollution at 3% [185]. According to statements by Zhu Guangyao, head of the Chinese state environmental protection agency, “Environmental damage is costing the government roughly 10 percent of the country’s gross domestic product” [186]. Several other estimates put the figure at around 7%.

61A blueprint for a climate friendly cement industry
5. Emission reduction scenarios for cement production in China
Despite this fact, environmental protection still only gets an average of 1% of the GDP [185]. This difference between the burden of environmental consequences and the low amount of investment in its prevention still leaves huge opportunities.
In its 11th 5-year plan, the government called for a 20% reduction in energy intensity by 2010. The Chinese government also tried to limit the GDP growth to 8% for this period. If both goals were to be achieved, the increase of energy use could be limited to 17.5% in the 2006-2010 period [187]. Nevertheless, both goals are difficult to achieve. The real GDP growth in 2006 was 11.1%, which is much higher than the 8% aimed. In turn, energy use will also be more sizeable.
This target can be seen as aggressive considering the short time it would take in order to reach it. A program to complete and implement this 20% energy intensity target in the energy intensive sector has been set up. It focuses on the 1000 largest energy consuming plants in China. Their own energy intensity is also intended to decrease by 20% during this timeframe and the assignment has already been split on both provincial and plant levels. Some cement kilns are part of this program.
The Chinese National Development and Reform Commission set the target to “reach or approach the advanced international level of the early 1990s by 2020”. It should be noted that this advanced international level does not correspond to the average state of the cement industry at this period in developed countries. It has to be understood as the values of the most advanced plants installed worldwide during this period combined with the best practices achieved by then.
This would imply the following values for the cement industry:
0.73 to 0.79 kg CO• 2 / kg cement
Clinker ratio of 0.8 or lower•
Energy intensity close to 3.5 MJ / kg clinker•
Electricity use lower than 100 kWh / tonne•
The Chinese policy regarding the use of blending agents (slag and ashes) is very strong since it foresees a total waiver on VAT (around 10%) on the condition that a share of 30% blending agents is reached. As a result, a large number of plants tried to achieve this ambitious goal.
In order to meet this level of performance on the national level, new plants will have to be particularly efficient. Starting from 2006, the minimum capacity for newly built plants will be of 4,000 tpd except for some remote areas where the limit will be 1,000 tpd. As a result, only large plants which generally have a higher efficiency may be built.
For all newly erected plants, the coal consumption should not exceed 105 kgce / t clinker which is equivalent to around 3,080 MJ / t. The electricity consumption is required to be 95 kWh / t clinker or lower. On the other side, minimum efficiency requirements are being set for operating plants. The government has an assistance and guidance program for cleaner cement production and pollution prevention.

62A blueprint for a climate friendly cement industry
5. Emission reduction scenarios for cement production in China
The government furthermore aims to equip large plants (over 1,200 tpd) with waste heat recovery (WHR) every year and intends to reach a share of 70% of the plants equipped with WHR by 2010. Each year, all of the 80 new dry kilns added will be equipped with WHR (Waste Heat Recovery) and 165 plants will be retrofitted with this technology, even without CDM financing [188]. The government will also follow the policy of consolidating the market in order to establish leaders with the capacity to invest in advanced technologies [189].
The implementation of these measures is important. However, bringing the efficiency to an internationally comparable level also requires the closure of outdated plants. In order to compensate these 250 Mt in outdated capacity, several provinces demand for new capacity to be installed. A quota of outdated plants to be phased out has also been released for each province featuring specific goals for 2008 and 2010. In order to retire them, a set of policy instruments is used. Their production license, i.e. the right to produce cement, will not be renewed, their eligibility for tax refunds by blending reduced and the electricity price will be increased by 0.25 RMB / kWh.
Regarding the investment or upgrade in plants, all projects exceeding $1 million have to have the environmental impact assessment (EIA) approval of the SEPA. Projects are reviewed under multiple aspects by the NDRC. All projects exceeding $100 million are reviewed by the central government while smaller projects are reviewed on a local level.
The export of cement clinker represented 36 Mt last year. It previously received a tax rebate, and generated little profit while putting the CO2, energy and pollution burden on China. As a reaction to this, the tax rebate will be recalled [190].
Further measures could accelerate the trend to improve greenhouse gas performance in the Chinese cement industry:
Advanced domestic and foreign companies should be supported in consolidating the market by acquisitions, •mergers, joint-ventures and partnerships, so that most of the plants are operated by larger groups with access to the best available technology and experience while applying and disseminating best practices.
A focused technological partnership for the cement industry should be created between companies, universities, •research institutes and government to specifically address the issue of greenhouse gases emissions, especially CO2 emissions.
The specific CO• 2 emissions of a plant should become an important criterion for operating permits.
Measures like emission trading, fuel tax, carbon tax or a policy could progressively shift the taxation in relation to cement production on environmental aspect emissions.
5.9 International policies and measures: e.g. CDM and activities under AP6As the largest emerging economy, China is an important part of the Kyoto Protocol, where it is listed as non-Annex 1 member. This means that China has no mandatory targets under the Kyoto protocol, either in terms of carbon intensity nor in absolute value. Nevertheless, the protocol has established an opportunity market for carbon abatement. One “CER” (Certified Emission Reduction), which corresponds to the equivalent of a reduction of one tonne of CO2, has an average price of over $16 / t for the 2008-2012 trading period. This is a huge opportunity considering the relative cement price of $40 / t in China where the carbon intensity is of 0.85 t CO2 / t cement.

63A blueprint for a climate friendly cement industry
5. Emission reduction scenarios for cement production in China
Compared to India, China has registered only few CDM projects relating to cement blending and reduction of improvement of the production process. Until now, the registered projects in this field were limited to the heat recovery utilization for power generation [191]. China is believed to still have a huge potential in the generation of CER through CDM projects.
CDM Projects in China are limited by governmental policies. This is due to the particular “additionality” required by any CDM project to qualify. As a result, a majority of the projects will still be undertaken anyway under the framework of the Chinese policy. CDM projects, nevertheless, can also be very interesting for the co-financing of new plants whose performance is well above the BAU scenario.
China is also part of the AP6 group which is an international cooperation on climate issues under the umbrella of the United States. Since it is non-binding, no emission goals have been commonly set, no carbon intensity goals have been decided and action still relies on the countries’ own initiatives. As such it is a weak substitute for participation under the Kyoto Protocol [192] and the emission reductions decided under the frame of the UNFCCC. However, the group remains of certain importance since it represents more than 45% of the world in population, GDP, energy use and CO2 emissions.
This group may be interesting to China (and India) since it focuses on research, exchange and distribution of new, cleaner and more efficient energy technologies. This is important since the two countries have a rapidly growing energy demand. In order to satisfy this demand, and in absence of major alternatives, India and China are going to rely intensively on their large resources of coal.
China acted on its own initiative and set a 20% target in reducing its carbon intensity. Under the AP6 platform, China hopes to obtain access to advanced coal power technologies, enhanced investment in renewable energies, nuclear power, and cooperation with carbon capture and storage.
A large cooperation and capacity building may be required regarding the present Kyoto Protocol tools as well as the successor of the Kyoto Protocol. This includes a dialogue between cement producers and governments on the regional and provincial levels in order to integrate the emission goals to their decisional processes. In order to take advantage of the capacity of international companies to reduce emissions, the carbon credits might need to be easily transferred to a strong group of countries with large mandatory emission reduction commitments.
5.10 Relevance of results from China for other developing countriesThe Chinese cement sector and the driving forces of the Chinese cement market have several peculiarities. The cement consumption per capita is far higher than in most other developing countries.
The structure of the Chinese industry is very particular as it is not dominated by large international leaders as is the case in other countries. The average size of the plant is small, with an output 25 times smaller than the international average. The number of plants is high, and the large use of different kiln technologies (wet kilns and vertical shaft kilns) is quite unique. The market price of cement is also comparatively low at $40 / tonne compared to $80 / tonne on average internationally. This in turn is a higher barrier to the introduction of more advanced materials.

64A blueprint for a climate friendly cement industry
5. Emission reduction scenarios for cement production in China
Compared to the other countries, the availability of biomass is smaller in China while the quantity of recoverable ashes and slags is larger. This is due to a power generation based on coal as well as a large heavy industry. Furthermore, energy resources other than coal are limited.
The Chinese cement market is the largest single cement market on Earth and the output in a single province is as large as those found for some main developing countries. China has the possibility to develop alternatives to Portland cement and bring them on the market as the country is large enough to offer a whole range of products. It is believed by many experts that the Chinese scenario is quite distinct from other developing countries as the driving factors are different.
Similarities with other developing countries can be found in the shared need to reduce the electricity consumption from the cement plants. The Chinese plan to generalize the use of WHR (Waste Heat Recovery) to all plants can be adopted by all countries, and would substantially decrease the CO2 worldwide. It has been estimated that this technology could save around 75 Mt CO2 / year by 2030 [193]. Also, the Chinese legal frame which strongly encourages cement companies to recover a maximum of substitutes by providing a tax break over a very high percentage is applicable to other countries.
Special attention could also be put on India as the market possesses important similarities to China. Since India is at an early stage of its development, more room is left for action.
There is generally a large need for capacity building on a local level, especially regarding climate, energy and resource problems, as well as a need for tools to identify, quantify and reward CO2 reductions. Cooperation between countries, NGOs, companies with experience in CO2 mitigation and other developing countries are essential. In order to ensure the success of any Post-Kyoto agreement, it seems essential to make sure that the local governments across the world have sufficient knowledge as well as appropriate legal and economic instruments to address the problem.

65A blueprint for a climate friendly cement industry
6. Towards an Action Plan
6. Towards an Action Plan
Emissions from cement production in developing countries under a business-as-usual scenario are expected to increase sharply. This is not compatible with a global warming mitigation path aimed at achieving a stabilization of greenhouse gases at a level of 450 ppm, which is in the range of keeping global average temperature increase to a maximum of two degrees. The following section provides an overview of the key types of technical measures available to achieve significant reductions of greenhouse gas emissions.
6.1 Conventional and advanced emission reduction options Currently the production of one ton of cement commonly results in the release of 0.65 to 0.95 tonnes CO2 depending on the efficiency of the process, the fuels used and the specific type of cement product. Considering the scale of worldwide cement production, even a slight decrease in the average global emissions per ton has a large CO2 reduction potential. Every 10% decrease in the cement CO2 intensity by 2050 could save around 0.4 Gt CO2
[194], and substantially contribute to slowing climate change.
Typically, around 55% of the CO2 emissions in the production of cement clinker originate from the conversion of limestone (CaCO3) into lime (CaO). Around 40% of the emissions result from combustion processes needed to yield the thermal energy required for this reaction (1450°C). Through energy efficiency measures, emissions and fuel costs can both be considerably reduced. The use of biomass as substitutes to carbon intensive fuels can contribute substantially to reducing emissions of fossil CO2. It is possible to reduce total emissions by 10% (depending on the local electricity mix) by reducing consumption in individual plants.
Further abatement could originate from the more efficient use of cement and concrete. Even large cement producers cannot significantly influence the demand for building materials. However, they can guide actors in the building sector in their specific choices, especially in cooperation with governments. Similar to energy efficiency, or avoided energy consumption, the avoided or reduced consumption of concrete deserves full consideration.
High strength, specialty concrete, or even ordinary concrete and cement products when used in a more efficient way, can largely decrease the overall quantity of material used to meet the requirements for projects. The extension of specified lifetimes of buildings from only a few decades to at least a century is also a potent long-term reduction measure of cement demand and related emissions.
Further, innovative low CO2 cementitious materials are to be considered as a reduction measure. When using different kinds of advanced products and optimizations, the potential CO2 reduction is significant. In light of the required emission mitigation pathways, they have to obtain large market shares before 2050. These products also require the distribution of information and know-how on all levels, and will require the change of relevant building codes and standards.
The following section provides an overview of the key types of technical measures available to achieve significant reductions of greenhouse gas emissions.

66A blueprint for a climate friendly cement industry
6. Towards an Action Plan
Cement Production
6.1.1 Improve the thermal efficiency of kilns The most efficient solution regarding the production of clinker in new kilns, “new rotary kilns with pre-calciner and suspension pre-heaters”, is widely applied already today, including in China. It is important to ensure that all new plants are built according to the best available technology. The equipment of numerous plants worldwide is still very far from the best achievable efficiency. Energy consumption can reach twice the level of the best available technology and the efficiency of some of these plants can greatly be enhanced through upgrades. Outdated technologies should be phased out because of their low efficiency. Such plants are commonly heavy polluters and the quality of the cement produced is often inferior. This inhibits the switch to good practices and high quality products.
6.1.2 Increase the share of biomassThe use of biomass in cement kilns is still quite low in the developing world, even if close to 40% were achieved in Brazil. Despite a favorable tropical weather which allows a fast growth of the biomass its share as kiln fuel is under 5% in most developing countries. Setting a long term goal of 40% of sustainable biomass in the fuel by 2050 is challenging but achievable. It would require a long term sustainable supply chain for biomass fuels originating from forestry, biological wastes or crops.
6.1.3 Improve the electrical efficiency of plants Large improvements can be achieved regarding electricity consumption and efficiency. Less than 40 kWh are consumed per ton of cement using both WHR (Waste Heat Recovery) and very efficient equipment. This corresponds to a reduction of the current plant electricity consumption by two thirds. This is especially important in countries with a carbon intensive electricity mix. A maximum consumption of electricity in kWh / ton of cement can be agreed between cement companies with developing countries governments for all new plants with WHR (Waste Heat Recovery) as a requirement. At the same time, a goal could be applied for existing plants with increasing targets. This could be done in the frame of a voluntary agreement with all cement companies.
6.1.4 Develop Carbon Capture and Storage (CCS)Reducing the CO2 generated from the cement sector on a scale and in a timeframe compatible with the mitigation scenario is difficult. The sequestration of the CO2 produced can be a solution for a low-carbon future. This technology could cover a majority of the cement emissions by 2050. Only 3,000 cement plants worldwide could supply the 5 Gt cement demand by 2050. In order to be able to recover the CO2 from all plants by then, it is important new plants are designed in a way that would allow an upgrade with CCS. Plants which use biomass and are equipped with CCS would remove carbon from the atmospheric cycle and as such have the potential to reduce CO2 in the atmosphere.

67A blueprint for a climate friendly cement industry
6. Towards an Action Plan
Use of Cement
6.1.5 Use cement more efficiently A focus can first be set on specifically answering the required function of a project rather than simply delivering a certain quantity of material. In several cases, the concrete consumption can be reduced, sometimes by more than 50%, by applying the right design and switching to high quality or special concretes. This requires an enhanced cooperation with the customer as well as improved education, information and training regarding the most advanced alternatives available from cement suppliers. It also requires sound scientific methods and quality controls to be applied throughout the whole life-cycle of cement, from the production to the use.
6.1.6 Expand the use of additives and substitutes to cement clinkerThe use of Ordinary Portland Cement is the established business practice in the building sectors of most industrialized and developing countries. Conventional and advanced alternatives to Portland cement can lead to substantial CO2 reductions ranging from 20 to 80%, depending on the case.
The use of additives and substitutes to Ordinary Portland Cement (OPC) clinker has been one of the most successful measures in decreasing the specific CO2 emissions that have been the result of making cement. A long term clinker ratio as low as 0.75 is desirable. Such a target is still challenging since the availability of additives will not necessarily grow at the same rate as the cement demand.
If new alternatives to Portland Cement can account for 20% of the market by 2030, they would lead to a 10% decrease in CO2 emissions from the sector. The introduction of new alternatives to Portland cement is generally very challenging, and is expected to take a long time. It is therefore advisable to start this process as soon as possible, especially in countries that are still in an earlier stage of development. For this purpose, pilot projects and applications could be developed to “lead by example”. Large projects use large quantities of cement for one single customer. Such projects are ideally suited for the introduction of new alternatives to Portland cement before having the technology spread to a broader customer basis. Strong carbon financing or other incentive tools could greatly help to launch these substitutes until they start to spread on their own.
6.2 The result: a pathway to a low carbon cement industryMost options can be implemented independently. Table 6.a gives an overview of the technical options and shows respective reduction potentials.

68A blueprint for a climate friendly cement industry
6. Towards an Action Plan
Table 6.a Potential greenhouse mitigation measures and respective potentials until 2050 based on a reference “frozen technology” scenario assuming a consumption of 5.7 Gt cement of cement in 2050 with a constant CO2 intensity of 0.89 t CO2 / t cement through 2005-2050 leading to 5.1 Gt CO2 emitted in 2050 from the cement production
Measures Quantification (all figures are given on a per year basis)
Use cement more efficiently; especially cement used for buildings. Reduce the need for concrete and switch to higher qualities with higher added value. Eliminate low quality concrete.
Set a goal for an efficient cement use which would lead to an equivalent of a 15% decrease of cement related CO2 emissions by 2050
15% consumption avoided
= 0.86 Gt cement avoided
= 0.75 Gt CO2 avoided
Remaining quantity of cement to be produced = 4.84 Gt
Remaining CO2 emissions = 4.32 Gt
Further expand the use of additives and substitutes to produce blended cements and promote alternatives to Portland Cement on large projects to “lead by example” and increase their share in the market.
Decrease the clinker ratio to 0.75 worldwide by 2050 (from 0.87 in 2005)
0.88 Gt Gt CO2 avoided
Remaining quantity of clinker to be produced = 3.09 Gt
Remaining CO2 emissions from the clinker production = 3.12 Gt
Improve the thermal efficiency of kilns: to encourage and develop CO2 reductions using the best available technology combined with good practices
Improve the average kiln efficiency from 4.4 GJ / t clinker in 2005 to 3.0 GJ / t in 2050
Energy saved in the kiln
= 0.375 Gt CO2 avoided
Use of 9.27 EJ instead of 13.60 EJ
Energy need reduced by 4.33 EJ
Improve the electrical efficiency of plants on new and existing cement plants through WHR (Waste Heat Recovery) and efficient equipments.
Reduce the net electrical consumption of all cement plants to 40 kWh / t clinker by 2050
Emission savings:
= 0.125 Gt CO2 avoided (based on the displacement of coal)
Increase the share of biomass in the fuel mix
Set a long term goal of 45% of sustainable biomass fuel by 2050 in the fuel mix for cement kilns
The equivalent CO2 saved from the displacement of coal as a fossil fuel is around 0.41 Gt
Resulting CO2 emissions per year Fossil origin: 2.12 Gt
(G) Develop Carbon Capture and Storage (CCS) with the target to reach a high sequestration of CO2 emissions by 2050. Develop new plants which are able to be upgraded with CCS.
Reach a 60% CO2 sequestration share by 2050.
60% of the real CO2 stream sequestrated = 1.54 t CO2 captured per year
Remaining NET CO2 emissions of CO2 in the atmosphere by 2050: 0.6 Gt / year
The resulting global mitigation path as a combination of these measures has been quantified and compared to a “frozen technology scenario” in which the CO2 intensity would remain at the level of 2005 by 2050. Figure 6.a visualizes the quantitative impact of each “reduction wedge” against the reference trend of emissions.

69A blueprint for a climate friendly cement industry
6. Towards an Action Plan
Figure 6.a Impact of different reduction levers on cement related emissions in 2050
6.3 Making it happen – a climate-friendly cement industryIn order to rapidly progress towards a low-carbon cement sector in developing and developed countries, a combination of different measures have to be taken in order to implement the technical options. The following list provides a portfolio of options. A summary overview is given in Table 6.b at the end of this list.
(1) Implement a global sectoral approach for the cement industry
Policy or market instruments guaranteeing a certain minimum efficiency of cement plants can be applied by a country, region, or on an international basis in order to have a rapid convergence worldwide towards the best achievable technology and efficiency. Countries and companies have the possibility to set a minimum standard of efficiency for all new cement plants. Such an approach of a minimum standard in the sector could also be integrated into future climate agreements. Moreover, carbon credits could provide an incentive for plants to achieve a higher performance based on enhanced technologies and the application of best practices.
Specific tools to accelerate the phase-out of bad practices and outdated technologies are currently missing in the international framework. Especially financial incentives for the closure of outdated plants are especially lacking. New approaches to retire a maximum of outdated plants could be established in the framework of the Kyoto Protocol, and its successor, with an agreed target to progressively retire plants according to their fuel consumption. In order to accelerate the movement, governments could reduce taxes on imports for advanced technologies or introduce penalty taxes on cement plants with poor efficiency.
(2) Make CO2 reductions integral part of the business model
Together with building academies, civil engineering companies, and environmental groups, leading cement companies should become leaders in low CO2 construction. Cement companies have the possibility to start strengthening their skills on the CO2 consulting field now to provide customers with solutions which have the lowest impact on the climate.
Cement companies, together with building associations and academies should promote the switch to high strength and low CO2 materials. By switching to high quality cement with high added value, companies can even enhance their profitability while reducing the quantities and still be answering the demand for construction materials as sufficiently as they do today. In many countries, first steps have been taken to progressively reduce the share of low strength cement produced. A gradual ban of the lowest qualities can be envisioned through minimum standards for different applications. The increased use of innovative building materials can play an important role in emission reduction strategies.
Generally, such new kinds of reduction programs could be implemented under the so-called “Programmatic Clean Development Mechanism”, which rewards the result of a program or a policy rather than the result of a single project. The development, spread, and use of this instrument is essential, and could also be part of a future post-Kyoto treaty.
In general, strong measures negotiated with countries could accelerate the market penetration of alternative cementitious materials (like fiber-re-inforced concretes or belite cements) up to a critical scale. As such, a policy rewarded by carbon credits is probably a good instrument to promote these materials.
Gt
CO
2 /
year
1990 20502005
0
1
2
3
4
5
Develop Carbon Capture and Storage (CCS)
Improve the average thermal efficiency of kilns
Increase the share of biomass in the fuel mix
Improve the electrical efficiency of plants
Use cement more efficiently
Further expand the use of alternatives to OPC clinker

70A blueprint for a climate friendly cement industry
6. Towards an Action Plan
(3) Improve the framework for the use of substitution materials
Substitution materials used as binder and mixed with cement already avoid a large amount of CO2 emissions. Their use can be increased to 35% locally in the cement mix. Several developing countries are going to build large numbers of coal power plants in the coming decades. Producing high quality ashes with low carbon content is essential. Used in blended cement, the substitution material provides the same decrease in the CO2 emissions while increasing the efficiency of a power plant by several percent. In turn, standards can be set for the quality of ashes, possibly by using tax and discount instruments. Furthermore, the economics should be assessed as well as the potential positive impact of ashes on the power plant energy balance. For this purpose, operators and technology suppliers of coal power plants need to be involved at an early stage.
(4) Set up goals for a growing share of biomass
Cement companies should set up a long term sustainability goal for the use of biomass. Together with national governments and environmental groups, cement companies could develop a program for the sustainable use of biomass resources. This could lead to a 2050 goal of 50% average use of biomass in the fuel mix worldwide, which is very close to the current technological limit. However, an increase in biomass use must go hand in hand with the assurance of sustainable biomass sources.
(5) Update standards for cements
In order to obtain a large share of the market, blended cements or even advanced alternative cementitious materials require product standards in order to permit a judgment based on their performance (e.g. strength, setting time, CO2 per ton), not on their chemical composition which might be different from ordinary Portland cement. This process should involve cement companies, cement associations, individual governments and national and international standardization bodies.
(6) Create new international policy instruments for the construction sector
All parts of the whole life cycle chain of cement, concrete and final products or construction projects should be taken into consideration for CO2 reductions. This requires the development of proper instruments related to programs, national policies, and carbon markets. Ideally, a large number of these options could be identified, quantified and verified to qualify as emissions reductions, and be rewarded by national policies or carbon markets.
A way to proceed could be to integrate the CO2 factor in the bidding for large projects. Additionally a policy could be set up to lower the quantity of CO2 used per building surface built.
Discussions on the international level should consider these aspects for their integration into a Post-Kyoto agreement.
(7) Establish market based instruments on the national level
Financial instruments could be set up easily to target the fossil fuel consumption of the cement industry. A global “cap and trade” system where the emission permits for the cement sector are limited would deliver financial incentives to decrease the carbon intensity. Such a “cap and trade” system could be implemented in various forms [195].

71A blueprint for a climate friendly cement industry
6. Towards an Action Plan
Putting a carbon price on fuel use or emissions creates an incentive for the most efficient plants to fully use their capacity and restrains the use of the most inefficient ones at the same time. Consequently, this would create a large incentive to recover and use as much biomass fuels as possible. If set up properly, the instruments can encourage new plants to be built using even more efficient technologies and accelerate the phase out of the least efficient.
(8) Extend research for advanced technologies
Compared to other CO2 emitting sectors, the current research activities on CO2 emission reduction options for the cement sector are relatively small considering that the sector is likely to account for more than 10% of total global GHG-emissions in the period 2030-2050. Networks in the research towards a long term low-CO2 cement industry need to be strengthened by means of cooperation between companies, universities and governments with special clusters in specific countries.
The following points have been identified in this report as especially relevant to the cement sector:
In a long term future for cement alternatives requiring lower kiln temperatures (700-800°C) explore the possibility •of using solar via concentrators as a source of energy.
Research advanced cogenerations such as integrated cement and power plants.•
Explore the possibility of CCS (Carbon Capture and Storage) to sequestrate CO• 2 exhaust gases and avoid releasing them into the atmosphere. Using the waste heat through absorption chillers to prepare oxygen for oxygen arc furnaces is a possibility which would increase the thermal efficiency. The resulting CO2, which is nearly pure, could be sequestrated and other Greenhouse Gases like NOx reduced to nearly zero.
(9) Intensify international capacity building
On multiple levels, an essential element for emission reductions in the cement sector in developing countries is capacity building. The transfer of skills, competences, knowledge etc. regarding processes and products is required to efficiently put these CO2 abatement measures into practice. This calls for strong capacity building activities. However, the owners of special knowledge, which providing a competitive advantage over other cement companies, can be expected to resist these processes, or to request fair compensation.
A key part of the capacity building would be to spread the knowledge on emission reduction options and supporting instruments on a regional level. This can be achieved through education and by employing dedicated specialists for waste, biomass recovery and energetic efficiency at existing plants. Best practices can be spread on a plant level.
The introduction of innovative cementitious material strongly needs capacity building to surpass barriers on multiple levels. The capacity building activities should also address the legal framework at national or larger levels in order to achieve widespread emission reduction. New standards for cement could ease the use of blended and alternative cements. Minimum efficiency standards for plants could be set and financial instruments used.

72A blueprint for a climate friendly cement industry
6. Towards an Action Plan
Table 6.b Potential: policies and measures to reach the emissions goals
Potential action Stakeholders Timeframe
(1) Implement a global sectoral approach for the cement industry Cement companies / NGOs
Countries
UNFCC
Short and medium term
(2) Expand the scope of CO2 reductions by starting to integrate a CO2 reduction consulting service in the companies
Cement companies
NGOs
Short term
(3) Improve the framework for the use and the availability of substitution material
Cement companies
Industrial producers of substitution material
Medium term
(4) Set up a goal for a growing share of biomass On the basis of internal goals and / or on a voluntary agreement for specific regions of the world.
Cement companies
Developing countries
NGOs
Medium and long term
(5) Update standards for cements to allow a maximum blending of cements with clinker substitutes in all countries and allow alternative cementitious materials
Cement associations
Cement companies
Countries
Short and medium term
(6) Create new international policy instruments on the construction sector in order to promote a low CO2 path of the construction sector
Cement companies
Producers of substitute an additives for cement
National governments
Long term goal
(7) Establish market based instruments on the national level such as fuel taxes or a cap and trade system.
Countries
Cement companies
Medium and short term
(8) Extend research for advanced technologies for long term CO2 decrease: Solar concentrators, Oxygen arc-furnace with CCS, solar air preheater, advanced cogenerations
Cement companies
Governments
Research institutes
Long term
(9) Intensify international capacity building
Spread the knowledge about possible reduction CO2 opportunities across the cement, concrete and building materials chain, including on a local level (producers, users, etc.).
Provide advisory capacity on improvements on the legal frame.
International institutions
Developing countries
Annex 1 countries
Major cement companies
Short and medium term

73A blueprint for a climate friendly cement industry
7. Acronyms
AP6 Asia-Pacific Partnership on Clean Development and Climate
BAU Business as Usual
CaCO3 Calcium carbonate
CaO Calcium oxide
CO2 Carbon dioxide
CO2e Carbon dioxide equivalent
CCS Carbon Capture and Storage
CDM Clean Development Mechanism
CR Clinker Ratio
EIA Energy Intelligence Agency
EMC Energetically Modified Cement
EU European Union
GDP Gross Domestic Product
GHG Greenhouse Gases
IEA International Energy Agency
IMF International Monetary Fund
IPCC International Panel on Climate Change
NGO Non Governmental Organization
NOx Nitrogen Oxides
OECD Organization for Economical Cooperation and Development
ppm Parts per million
ppp Purchasing Power Parity
PRC People’s Republic of China
PVC Polyvinylchloride
ROW Rest Of the World
SI Systeme International: International System of Units
Sox Sulfur Oxides
UNFCCC United Nations Framework Convention on Climate Change
VAT Value Added Tax
WBCSD World Business Council for Sustainable Development
WRI World Resources Institute

74A blueprint for a climate friendly cement industry
8. Glossary
Alternative fuels: Non-fossil materials or substances that can be used as fuel. Wastes for example can be used as a substitute to provide thermal energy
Biomass: Plants and animal wastes used as a source of fuel or for industrial production
Business as usual: (BAU) Scenario that would happen under current assumption for demographic, economic, sociologic and technologic trends. It describes the current and future course of activities with few or no intervention to steer the market. Therefore it generally refers to a rather conservative scenario.
Capacity Building: creation of an enabling environment with appropriate policy and legal frameworks, institutional development, including community participation (of women in particular), human resources development and strengthening of managerial systems [UNDP Definition].
Carbon intensity: Ratio of the carbon dioxide emissions related to the economic activity. A low carbon intensity indicates a low contribution to the climate change per unit of wealth created.
Cement: binder used in the production of concrete.
Climate change: Variation in the Earth’s global climate over long periods which includes natural climate change. The present climatic change called “global warming” is largely the result of human activities.
Clinker: Solid material produced by a kiln from the raw mix. It is ground in a later stage and makes up to 95% of the cement.
Cogeneration: Combined production of heat and / or power with other valuable processes. The global efficiency is higher than the one that would be obtained from the two separated single processes it replaces. Typical cogenerations are: heat and power, or heat, cold and power. Also the generation of power, heat and cement (chemical energy) can be achieved.
Composite cement: Cement containing large amounts of non-clinker additives such as fly ashes or slag’s resulting. Due to their composition, they often do not comply with the composition required by national or international standards to be classified as Portland cement. This does however not necessarily mean lower strength properties.
Concrete: Stone-like construction material made by the reaction of cement (generally OPC), water and aggregates (usually gravel and sand) and sometimes a mixture.
Electricity mix: Composition of the electricity generation for a specific country or region according to the source of energy and the technology used. Imports and exports have to be considered.
Fly ash: By-product of combustion processes which shows binding properties similar to cement. Typical example are the dust residues from combusted coal.
GDP: The Gross Domestic Product (GDP) is the sum of the added value at every stage of production of all final goods and services produced within a country in period of time (generally given per year). It is therefore a good indicator of a country’s economy.
per capita:• The GDP per capita indicates the added value per inhabitant of a country.
ppp:• The exchange rate of currencies is not sufficient and the same amount of money, once converted will have a different purchasing power in another market. The GDP at purchase power parity (ppp) equalizes the rate exchange of currencies to give each currency exactly the same purchasing power in its own economy. In turn, incomes across different economies can be compared.
90$:• A monetary unit considering the United States dollar in 1990 as a reference. This allows the comparison of monetary values from different years by using a so called “deflator”.
Deflator:• The GDP deflator is a measure of the change in prices to a base year with a variable market basket. It is a necessary factor to compare GDP from different years.
Kiln: Insulated oven in which the raw mix processing for Portland and other types of cement takes place. The added energy in form of heat makes the calcination and sintering possible.
Kyoto Protocol: Protocol to the United Nations Framework Convention on Climate Change (UNFCCC) to limit emissions of greenhouse gases from signatory nations. Under this specific amendment, binding commitments to reduce their GHG emissions have been agreed by Annex 1 parties.
Limestone: Abundant sedimentary rock which is mostly made of calcium carbonate (CaCO3). Limestone is the major component of the raw mix for the production of cement.
Lock in: Constraint of capital intensive investments which can only be amortized over a long period of time. Once an investment has been made, the side effects (for example, related to the use of a certain technology) are very difficult to overcome and will remain for the lifespan of the project. The way out of the lock in can be provided by a major technological breakthrough. Otherwise, the way out of the “lock in” is often very expensive since shutting down a plant earlier often means the invested capital will not be amortized. As investments in CO2 intensive technologies are made for years, they can possibly become a burden for a future in a carbon constrained world.
Ordinary Portland Cement (OPC): Most common type of cement that consist of over 90% ground clinker and a maximum of about 5% gypsum.
Pozzolan: material which, when in Portland cement concrete exhibits strength properties similar to cement.
Preheater: Kiln exhaust heat recovery device from a Kiln plant. The heat flow leaving the kiln is used to preheat the raw mix.
Raw feed: see raw mix
Raw mix: Mixture made from local rocks or a combination of rocks to produce clinker through several steps including grinding, calcination and sintering. The raw mix includes calcium, silicon, aluminum, iron and magnesium oxides. Limestone is the major raw material for the raw mix.
Sustainability: Is the global concept according to which meeting the needs of the present should be done without compromising the ability of future generations to meet their own needs.

75A blueprint for a climate friendly cement industry
9. Units
Mass:
kg kilogram (SI)
t tonne = 103 kg
Mt megatonne = 106 t = 109 kg
Gt megatonne = 109 t = 1012 kg
Energy:
J joule = 1 N∙m SI derived energy unit
MJ megajoule = 106 J
GJ gigajoule = 109 J
kWh kilowatt∙hour = 3.6 x 10⁹ J = 3.6 MJ
kgce kg coal equivalent = 29.31 MJ
Others:
°C degree Celsius
m meter – SI base unit of length
km kilometer = 1,000 m
tpd tonnes per year
ppm parts per (concentration)

76A blueprint for a climate friendly cement industry
10. Annex – Methodology – Chinese cement demand
Evaluating the Chinese future cement production bears a large level of uncertainty. This concerns mainly the yearly output at which the Chinese production will peak, the year at which this peak will occur as well as the future rate at which the production might decrease following this peak of concrete demand. Multiple past forecasts have clearly failed to evaluate correctly this production peak and have already been proven wrong,
Several methods can be used to calculate this peak of production.
A “bottom up approach” is based on a quantification of the structures built, the economical growth of the country •and the further need for constructions (buildings + infrastructures). This would mainly be linked with the Chinese policy to pass from an urban population of 20% in 1978 to an urban population of 60% in 2030-2040. Some Chinese own estimates from the cement association and the governmental bodies are based on this more accurate “bottom up approach”. Such estimates predict a production peak between 2010-2012 at 1,500 Mt produced yearly.
The chosen approach is not based on such a “bottom up approach” but rather on the experience in other •countries. According to this method, the demand for cement is considered as an almost linear function of the GDP until a certain point of inflexion which is at around $15,000 expressed in 2005 international dollars of GDP per capita at purchase power parity. The uncertainties of this method are numerous. The results should therefore be considered with caution. The peculiarities of the Chinese economy cause an uncertainty in the adoption of a model based on other countries. Moreover, the GDP growth in China peaked in 2006 at 11.1% instead of the 8% aim of the government which was set up to control the growth rate. This is clearly a major difference to the GDP projection calculated. The GDP forecast calculated is based on assumptions from several sources, especially Chinese prognosis as well as the IEA among others. All of them assume a linear growth excluding the eventuality of economical crises, which could affect the world and / or China. In addition to that, the present situation which is dominated by large investments in real estate leaving much constructions vacant has not been taken into account. The conversion of the Chinese GDP in US dollars has been done using IMF figures. The accuracy of the method regarding forecasts is also subject to caution. The surprising 17% increase in the production of cement in 2006 according to the US Geological Survey also raises several questions regarding an assumption of a growth in the cement demand at roughly half the GDP (4% for an 8% growth expectation). Following the regular trend of Chinese indicators to exceed economical expectations, it has been arbitrarily decided to calculate the growth in the cement demand based on a +4.5% per year factor. A figure of 4.1% has been calculated by H. Groenberg [196].
A checksum has been calculated in order to verify the likelihood of the peak of cement demand, regarding the quantity •and the timeframe. It basically consists in a comparison with other Asian countries having just achieved the stabilization of their cement demand. The total quantity of concrete structures installed since World War II until this stabilization has been calculated at 19 tonnes / capita. Since the countries selected have high population densities, developed fast and share some patterns with China, it is believed that the model could be accurate. Similar to this checksum, a rate of decrease has been roughly evaluated for countries having passed this production peak at high levels.

77A blueprint for a climate friendly cement industry
10. Annex – Methodology – Chinese cement demand
The calculation model has been detailed in this table:
Table A12 Basis for the future cement forecast
Year GDP PPP in 2005 dollars
Cement production (in Mt)
Integrated installed quantity of cement since World War II (in Gt)
2006 $7,198 1,240 8.1
2007 $8,854 1,296 9.0
2008 $9,562 1,354 10.0
2009 $10,327 1,415 11.0
2010 $11,153 1,479 12.1
2011 $11,934 1,545 13.2
2012 $12,770 1,615 14.3
2013 $13,664 1,688 15.5
2014 $14,620 1,763 16.7
2015 $15,643 1,843 18.0
2030 1,600

78A blueprint for a climate friendly cement industry
11. References
11. References
1 Own estimates based on figures from:
The European Cement Association. (May 2006). Activity report 2006, retrieved from the Cembureau website http://www.cembureau.be/Documents/Publications/Activity%20Report%202006.pdf
US Geological Survey. (January 2007). Mineral Commodity Summaries, retrieved from the USGS website http://minerals.usgs.gov/minerals/pubs/commodity/cement/cemenmcs07.pdf
US Geological Survey. (April 11, 2006). Historical Statistics for Mineral and Material Commodities in the United States, retrieved from the USGS website http://minerals.usgs.gov/ds/2005/140/cement.pdf
Michael Taylor, International Energy Agency. (4-5 September 2006). Energy Efficiency and CO2 Reduction Opportunities in the Global Cement Industry, retrieved from the IEA website http://www.iea.org/Textbase/work/2006/cement/taylor.pdf
2 The European Cement Association. (2000-2007). Retrieved May 2006 the Cembureau website, Keyfacts http://www.cembureau.be/Key_01.asp
3 WRE 450 Emission Scenario from:
UNEP International Panel on Climate Change. (2001). Emissions, concentrations and temperature changes corresponding to different stabilization levels for CO2 concentrations http://www.ipcc.ch/present/graphics/2001syr/large/02.18.jpg
4 Percentage based on the global CO2 emissions and the cement sector CO2 emissions:
Own calculation for the CO2 emissions from the cement industry corrected for 2006 based on:
Vattenfall AB (June 2006) Global Mapping of Industry Greenhouse Gas Abatement Opportunities up to 2030: Industry Sector Deep-dive retrieved on http://www.vattenfall.com/www/ccc/ccc/Gemeinsame_Inhalte/DOCUMENT/567263vattenfall/P0272863.pdf
Lynn Price, Ernest Orlando Lawrence Berkeley National Laboratory & Ernst Worrell, Ecofys. (4-5 September 2006). Global Energy Use, CO2 Emissions and the Potential for Reduction in the Cement Industry internal Ecofys-LBNL source
Global CO2 emissions from:
Netherlands Environmental Assessment Agency MNP, using BP energy data. (BP, 2007). Global CO2 emissions retrieved from the MNP website at:
http://www.mnp.nl/mnc/c-0533-001g-mnc-02-nl-xls.html and http://www.mnp.nl/en/dossiers/Climatechange/moreinfo/Chinanowno1inCO2emissionsUSAinsecondposition.html
5 Own estimates based on the own corrected IEA prognosis from Michael Taylor (2006)
6 Jane Ellis, OECD and Richard Baron, IEA (17 nov 2005) Sectoral Crediting Mechanisms: An Initial Assessment of Electricity and Aluminium, JT00194332

79A blueprint for a climate friendly cement industry
11. References
7 Baseline scenario from:
Michael Taylor, International Energy Agency. (4-5 September 2006). Energy Efficiency and CO2 Reduction Opportunities in the Global Cement Industry, retrieved from the IEA website http://www.iea.org/Textbase/work/2006/cement/taylor.pdf
Data correction for China using the 2006 figures:
Hu Xiulian, Energy Resource Institute ERI. (Interview, April 18 2006).
Hu Xiulian, Energy Resource Institute ERI. (April 18 2006). situation of the cement industry
Data correction for other countries using the 2006 figures:
US Geological Survey. (January 2007). Mineral Commodity Summaries, retrieved from the USGS website http://minerals.usgs.gov/minerals/pubs/commodity/cement/cemenmcs07.pdf
8 US Geological Survey. (April 11, 2006). Historical Statistics for Mineral and Material Commodities in the United States, retrieved from the USGS website http://minerals.usgs.gov/ds/2005/140/cement.pdf
9 Based on several verified sources:
The European Cement Association. (2000-2007). Retrieved May 2006 the Cembureau website, Keyfacts http://www.cembureau.be/Key_13.asp
US Geological Survey. (April 11, 2006). Historical Statistics for Mineral and Material Commodities in the United States, retrieved from the USGS website http://minerals.usgs.gov/ds/2005/140/cement.pdf
10 Own calculation using projections for 2005 based on:
Vattenfall AB. (June 2006). Global Mapping of Industry Greenhouse Gas Abatement Opportunities up to 2030: Industry Sector Deep-dive retrieved on the page 16 from: http://www.vattenfall.com/www/ccc/ccc/Gemeinsame_Inhalte/DOCUMENT/567263vattenfall/P0272863.pdf
The European Cement Association. (May 2006). Activity report 2006, retrieved from the Cembureau website http://www.cembureau.be/Documents/Publications/Activity%20Report%202006.pdf
11 The European Cement Association. (January 2005). 2005 World Cement Production by Region, retrieved from the Cembureau website http://www.cembureau.be/Documents/KeyFacts/STATISTICS/World%20Cement%20Production%20by%20Region.pdf
12 Based on various data set especially:
US Geological Survey. (1990-present). Mineral Commodity Summary: Cement, retrieved from the USGS website http://minerals.usgs.gov/minerals/pubs/commodity/cement/
13 Relation between GDP ppp and cement:
Pierre-Claude Aitcin. (September 2000). Cements of Yesterday and Today, Concrete of Tomorrow.
Hen Humphreys & Maha Mahasenan. World Business Council for Sustainable Development & Battelle. (March 2002). Toward a Sustainable Cement Industry – Substudy 8: Climate Change. Retrieved at: www.wbcsdcement.org/pdf/final_report8.pdf

80A blueprint for a climate friendly cement industry
11. References
14 Vattenfall AB. (June 2006). Global Mapping of Industry Greenhouse Gas Abatement Opportunities up to 2030: Industry Sector Deep-dive retrieved on the page 15 from: http://www.vattenfall.com/www/ccc/ccc/Gemeinsame_Inhalte/DOCUMENT/567263vattenfall/P0272863.pdf
15 Own calculation. Sum of IMF list of developed countries and transition economies (Eastern Europe), including Russia, excluding Turkey based on figures from:
International Monetary Fund IMF Statistical division. (April 2007). World Economical Outlook Database. Data query at: http://www.imf.org/external/pubs/ft/weo/2007/01/data/index.aspx
United Nations Population Division. (2004). World Population to 2030. Available at: http://www.un.org/esa/population/publications/longrange2/WorldPop2300final.pdf
Klaus Heinloth. (February 2003). Die Energiefrage. Page 27. ISBN 3-528-13106-3
16 Kong Xiangzhong, head of the China Cement Association. (Interview, April 16 2007).
(National Development and Reform Comission), Building Material Academy.
17 International Panel on Climate Change IPCC baseline figures for 1990 as found in:
Hen Humphreys & Maha Mahasenan. World Business Council for Sustainable Development & Battelle. (March 2002). Toward a Sustainable Cement Industry – Substudy 8: Climate Change. Retrieved at the page A-6 from: www.wbcsdcement.org/pdf/final_report8.pdf
18 Corrected, combined and discussed figures from different sources:
Vattenfall AB. (June 2006). Global Mapping of Industry Greenhouse Gas Abatement Opportunities up to 2030: Industry Sector Deep-dive retrieved on the page 16 from: http://www.vattenfall.com/www/ccc/ccc/Gemeinsame_Inhalte/DOCUMENT/567263vattenfall/P0272863.pdf
Hen Humphreys & Maha Mahasenan. World Business Council for Sustainable Development & Battelle. (March 2002). Toward a Sustainable Cement Industry – Substudy 8: Climate Change. Retrieved at: www.wbcsdcement.org/pdf/final_report8.pdf
Michael Taylor, International Energy Agency. (4-5 September 2006). Energy Efficiency and CO2 Reduction Opportunities in the Global Cement Industry, retrieved from the IEA website http://www.iea.org/Textbase/work/2006/cement/taylor.pdf
19 Corrected, combined and discussed figures from different sources:
International Energy Agency. (2006) World Energy Outlooks. Retrieved from internal resources.
Cui Yuan-sheng, Institute of Technical Information for Building Materials Industry of China ITIBMIC. (5 6 september 2006). Potential and major strategies for energy saving and CO2 emission reduction in the Chinese cement industry. Retrieved at http://www.iea.org/textbase/work/2006/cement/Cui.pdf
20 Corrected figures with new estimated for the world cement production based on:
Vattenfall AB. (June 2006). Global Mapping of Industry Greenhouse Gas Abatement Opportunities up to 2030: Industry Sector Deep-dive retrieved on the page 15 to 17 from: http://www.vattenfall.com/www/ccc/ccc/Gemeinsame_Inhalte/DOCUMENT/567263vattenfall/P0272863.pdf
21 Howard Klee, IEA (2006) Energy Efficiency and CO2 Emission Reduction Potentials and Policies in the Cement industry: Towards a plan of action. Retrieved at: http://iea.org/Textbase/work/2006/cement/proceedings.pdf

81A blueprint for a climate friendly cement industry
11. References
22 Own estimates based on the Chinese cement CO2 intensity and the cement Output for 2005. Controlled and compared with:
Lynn Price, Ernest Orlando Lawrence Berkeley National Laboratory. (4-5 September 2006). Prospects for Efficiency Improvements in China’s Cement Sector. Retrieved at: http://www.iea.org/Textbase/work/2006/cement/Price.pdf
23 Corrected, combined and discussed figures from various sources:
Vattenfall report on climate mitigation 2006; WBCSD-Batelle reports on sustainability in the cement industry (Lynn Price); own forecasts (see methodic part);
US Department of Energy, Energy intelligence Agency DOE (2006) Energy Related Carbon Emissions http://www.eia.doe.gov/pub/international/iealf/tableh1co2.xls
World Resource Institute (2007) Earthtrends – Total CO2 emissions – Source WRI retrieved at: http://earthtrends.wri.org/searchable_db/index.php?action=select_variable&theme=3
World Resource Institute (2007) Earthtrends – Total CO2 emissions – Source IEA retrieved at: http://earthtrends.wri.org/searchable_db/index.php?action=select_variable&theme=3
Netherlands Environmental Assessment Agency MNP, using BP energy data. (BP, 2007). Global CO2 emissions retrieved from the MNP website at: http://www.mnp.nl/mnc/c-0533-001g-mnc-02-nl-xls.html and http://www.mnp.nl/en/dossiers/Climatechange/moreinfo/Chinanowno1inCO2emissionsUSAinsecondposition.html
International Energy Agency. (2006) World Energy Outlooks. Internal resource.
Mason H. Soule, Jeffrey S. Logan, and Todd A. Stewart. World Business Council for Sustainable Development & Battelle. (March 2002). Trends, Challenges, and pportunities in China’s Cement Industry. Retrieved at http://www.wbcsd.org/DocRoot/QnoY08cZaWF2bRC8m4rv/sub_china.pdf
Jiang Kejun, Energy Research Institute China. (Workshop on Balance Energy, Beijing, December 18 2006). Energy Future and Policies: Recent IPAC Activities and Policy Perspective.
Maximilian Auffhammer & Richard T. Carson, Department of Agricultural & Resource Economics UCB. (2006). Forecasting the Path of China’s CO2 Emissions: Offsetting Kyoto – And Then Some. Paper 971. Retrieved at http://repositories.cdlib.org/are ucb/971
24 Own calculation based on following sources:
Emission factor of 0.86 t CO2/t; Cement production of 1,240 Mt/year; Chinese CO2 emissions at 5,6 Gt/year.
Chinese CO2 emissions from:
Netherlands Environmental Assessment Agency MNP, using BP energy data. (BP, 2007). Global CO2 emissions retrieved from the MNP website at:
http://www.mnp.nl/mnc/c-0533-001g-mnc-02-nl-xls.html and http://www.mnp.nl/en/dossiers/Climatechange/moreinfo/Chinanowno1inCO2emissionsUSAinsecondposition.html
Chinese cement production in 2006 from:
US Geological Survey. (January 2007). Mineral Commodity Summaries, retrieved from the USGS website http://minerals.usgs.gov/minerals/pubs/commodity/cement/cemenmcs07.pdf
Chinese cement CO2 emission factor in 2006 calculated at 0.86 t CO2/t extrapolated from various sources based on past emission factor considering a normal rate of improvement and an enhanced rate for 2006 due to the large capacity of new plants added. Example of emission factors from the literature:
Lynn Price, Ernest Orlando Lawrence Berkeley National Laboratory. (4-5 September 2006). Prospects for Efficiency Improvements in China’s Cement Sector. Retrieved at: http://www.iea.org/Textbase/work/2006/cement/Price.pdf
Niklas Höhne, Ecofys (April 20, 2005) Emission reductions achieved from a sectoral approach
Center for Clean Air Policy Dialogue on Future International Actions to Address Global Climate Change
Ned Helme, President, Center for Clean Air Policy (Conference of Parties, Montreal, Canada November 29, 2005) Sector-Based Approach for “Post-2012”

82A blueprint for a climate friendly cement industry
11. References
25 Niklas Hoehne et al. (2006) SERS Scenarios Stabilization Path CO2 only based on IPCC AR4 Working Group IV Retrieved at www.ipcc.ch
26 Own estimates based on the corrected IEA cement production scenario (according to the latest data) assuming a worldwide average efficiency by 2050 equal to nowadays best achievable practices (0.73 t CO2/t cement).
27 Niklas Höhne et al., Umweltbundestamt/Ecofys. (2006-2007). Future International Action on Climate Change Network FIACC retrieved at http://www.postkyoto.com/
28 Nicholas Stern, former Vice-President of the World Bank. (2007) The STERN REVIEW ON ECONOMICS OF CLIMATE CHANGE, HM Treasury retrieved at http://www.hm-treasury.gov.uk/independent_reviews/stern_review_economics_climate_change/sternreview_index.cfm
29 Niklas Höhne, Christian Ellermann, Wina Graus. Ecofys (2007) Assessment of the Climate Performance of the G8+5 countries. Internal resource.
30 Niklas Höhne, Ecofys. (2007). Comparison Approaches for International Climate Policy Post 2012 Internal resource.
31 Ib.
32 Niklas Höhne, Ecofys. (2007). Sectoral Proposals.
33 Niklas Höhne, Christian Ellermann, Wina Graus. Ecofys (2007) Assessment of the Climate Performance of the G8+5 countries. Internal resource.
34 Various sources from the Carbonexpo trade fair conferences:
Richard Bradley Head of Energy Efficiency and Environment IEA. (Carbonexpo, 2007). Sectoral approaches.
Hugh Porteous, Vice-President, Government Relations Alcan. (Carbonexpo, 2007). Sectoral approaches
Bruno Vanderborght Vice-President, Environmental Strategy Holcim. (Carbonexpo, 2007). Sectoral Benchmarking Approach in CDM
Retrieved at: http://www.mc-cgn.de/km/carbonexpo/conference/download_presentations_2007/friday.html
35 Jake Schmidt, Center for Clean Air Policy CCAP. (2005). Sectoral no-lose targets retrieved at : http://www.ccap.org/international/Sector%20Proposal~4-pager.pdf
http://www.ccap.org/international/future.htm
36 Niklas Höhne, Ecofys. (2007). Sectoral Proposals.
37 Own estimates based on the worldwide total and cement related CO2 emissions.
Source for the 2020 figures: Table 2.c
Source for the 2006 figure:
Howard Klee, IEA (2006) Energy Efficiency and CO2 Emission Reduction Potentials and Policies in the Cement industry: Towards a plan of action. Retrieved at: http://iea.org/Textbase/work/2006/cement/proceedings.pdf

83A blueprint for a climate friendly cement industry
11. References
38 Original source: Lisa Ashford, Ecosecurites Group. (Carbonexpo, May 2007). Latest Developments in CDM and JI
Corrected figures without rejected or withdrawn projects; based on the whole lifetime of proects; including cement related biomass projects and energy efficiency but excluding the power generation for the cement industry: 104 projects out of 2261 accounting for 11.3 Mt CO2e out of 362 Mt CO2e: Sebastian Klaus, Ecofys (July 2007) UNFCCC CDM Database.
Project list and statistics retrieved at: http://cdm.unfccc.int/Statistics/index.html
Own estimate based on an increase of the annual production capacity from 2.0 Gt to 5.0 Gt in developed countries between 2005 and 2045. The assumed increase of the production capacity in OECD and other industrialized countries would be from 500 Mt/year to 700/year over the same period. The replacement rate for plants in developing countries for the presently installed capacity during this period has been evaluated to 1/3 over the 2005-20045 period. For the OECD and other industrialized countries it has been evaluated to ¾.
40 Own projection on the 2007-2012 time period based on following estimation:
Michael Taylor, International Energy Agency. (4-5 September 2006). Energy Efficiency and CO2 Reduction Opportunities in the Global Cement Industry, retrieved from the IEA website http://www.iea.org/Textbase/work/2006/cement/taylor.pdf
– The assumed growth rate for the cement demand in the developing world has been assumed to be around 6%
41 Figure of a new dry process with dry process with suspention preheater provided by Lafarge
42 WBCSD-Batelle. (March 1 2002). The Cement Sustainability Initiative – Substudy 8: Climate Change – Page 2. Retrieved at: http://www.wbcsd.org/web/publications/batelle-full.pdf
43 Based on different sources:.
Hen Humphreys & Maha Mahasenan. World Business Council for Sustainable Development & Battelle. (March 2002). Toward a Sustainable Cement Industry – Substudy 8: Climate Change. Retrieved at: www.wbcsdcement.org/pdf/final_report8.pdf
Lafarge study on emission factors (2006) Blueprint for the future – Brazil. Not published
* A new set of value for 2005
44 International Energy Agency. (2007). Tracking Industrial Energy Efficiency and CO2 Emissions – Executive Summary. Retrieved at http://www.iea.org/Textbase/npsum/tracking2007SUM.pdf
45 WBCSD-Batelle. (March 1 2002). The Cement Sustainability Initiative – Substudy 8: Climate Change – Page 4 – Table 1.2 Cement Industry Unit Based Emissions by Region and Sub Region retrieved at: http://www.wbcsd.org/web/publications/batelle-full.pdf
46 Cembureau (2003) Key Facts corrected with:
Clinton Watson, John Newman, Rt Hon Simon Upton and Petra Hackmann, OECD (June 1-2 2005) Can Transnational Sectoral Agreements help Reduce Greenhouse Gas Emissions? Retrieved at: http://www.oecd.org/dataoecd/14/11/35030013.pdf
47 Vattenfall AB. (June 2006). Global Mapping of Industry Greenhouse Gas Abatement Opportunities up to 2030: Industry Sector Deep-dive retrieved on the page 15 to 17 from: http://www.vattenfall.com/www/ccc/ccc/Gemeinsame_Inhalte/DOCUMENT/567263vattenfall/P0272863.pdf
WBCSD-Batelle Study from 2002 for emission factors of developed countries under the assumption of almost constant values.

84A blueprint for a climate friendly cement industry
11. References
48 Figure for Japan based on the IEA study; Figure for Brazil based on a Lafarge internal resource.
Lafarge study on emission factors (2006) Blueprint for the future – Brazil. Not published.
Michael Taylor, International Energy Agency. (4-5 September 2006). Energy Efficiency and CO2 Reduction Opportunities in the Global Cement Industry, retrieved from the IEA website http://www.iea.org/Textbase/work/2006/cement/taylor.pdf
49 Own calculations for average modern kilns based on several sources including:
WBCSD-Batelle. (March 1 2002). The Cement Sustainability Initiative. Retrieved at: http://www.wbcsd.org/web/publications/batelle-full.pdf
Breakdown of the cement heat losses according to own calculations based on:
Taichiro Kawasi, Energy Conservation Center in Japan. (October 2006) Cement Process and Energy Savings. Retrieved at: http://www.aseanenergy.org/download/projects/promeec/2006-2007/industry/la/ECCJ_CementProcessLecture.pdf
50 Dipl.-Ing. Anja Pauksztat. Chair of Technical Thermodynamics, Aachen University, Germany. (October 15-16 2004) Benchmarking as Basis for a Technical Oriented Allocation Method of CO2-Emissions. Retrieved at: www1.ku-eichstaett.de/WWF/VWF/ICP/9th/pauksztat.ppt
51 World Business Council on Sustainable Development. (December 2005) Cement Sustainability Initiative CSI – Guidelines for the Selection and Use of Fuels and Raw Materials in the Cement Manufacturing Process. Retrieved at: http://www.wbcsd.org/DocRoot/Vjft3qGjo1v6HREH7jM6/tf2-guidelines.pdf
52 Vattenfall AB. (June 2006). Global Mapping of Industry Greenhouse Gas Abatement Opportunities up to 2030: Industry Sector Deep-dive retrieved on the page 15 to 17 from: http://www.vattenfall.com/www/ccc/ccc/Gemeinsame_Inhalte/DOCUMENT/567263vattenfall/P0272863.pdf
53 Own calculated average based on:
Cembureau Contribution. (31 May 2006) Cement & Lime BREF Revision – Specific Energy Consumption
Non disclosed (2006) China Cement Industry – a Survey page 4
WBCSD-Batelle. (March 1 2002). The Cement Sustainability Initiative. Retrieved at: http://www.wbcsd.org/web/publications/batelle-full.pdf
Lynn Price, Ernest Orlando Lawrence Berkeley National Laboratory & Ernst Worrell, Ecofys. (4-5 September 2006). Global Energy Use, CO2 Emissions and the Potential for Reduction in the Cement Industry internal Ecofys-LBNL source
54 Vattenfall AB. (June 2006). Global Mapping of Industry Greenhouse Gas Abatement Opportunities up to 2030: Industry Sector Deep-dive retrieved on 17 (Japan) from: http://www.vattenfall.com/www/ccc/ccc/Gemeinsame_Inhalte/DOCUMENT/567263vattenfall/P0272863.pdf
55 Based on several best achieved performances in 2006 – own estimate for the learning curve for very large new dry kilns with precalciners/suspention preheater based on the Japanese example.
Statements based on: Nick Wood, Michael Sorensen, Alistair Ritchie & Jack Cunningham; Entec UK Ltd. (August 2006). DTI EU Emissions Trading Scheme Phase II Review of New Entrants’ Benchmarks – Cement. Retrieved at: http://www.berr.gov.uk/files/file33261.pdf
56 Own appreciation based on K E Peray, The Rotary Cement Kiln, CHS Press (1998), ISBN 978-0820603674
57 Picture of the inside of a new dry kiln provided by Lafarge

85A blueprint for a climate friendly cement industry
11. References
58 Lynn Price, Ernest Orlando Lawrence Berkeley National Laboratory. (4-5 September 2006). Prospects for Efficiency Improvements in China´s Cement Sector.
59 Own appreciation based on several reports: Figures for China based on Lynn Price & E.Worrel (2004-2006) several WBCSD Sustainable Cement Initiative Reports (2002) Other regions based on the 2002 WBCSD Report “Toward a Sustainable Cement Industry; Vattenfall Substuidy for the cement industry; IEA World Energy Outlooks 2006; IEA, Energy Efficiency and CO2 Reduction Opportunities in the Global Cement Industry (Michael Taylor 4-5 September 2006).
60 Taichiro Kawasi, Energy Conservation Center in Japan. (October 2006) Cement Process and Energy Savings. Retrieved at: http://www.aseanenergy.org/download/projects/promeec/2006-2007/industry/la/ECCJ_CementProcessLecture.pdf
61 Ernst Worrell and Christina Galitsky. (January 2004) Energy Efficiency Improvement opportunities for Cement Making: An ENERGY STAR Guide for Energy and Plant Managers. LBNL54036. Retrieved at: http://ies.lbl.gov/iespubs/54036.pdf
62 Picture of a new dry process kiln with suspention preheater provided by Lafarge
63 Vattenfall AB. (June 2006). Global Mapping of Industry Greenhouse Gas Abatement Opportunities up to 2030: Industry Sector Deep-dive. page 15 to 17 on China.
64 Jeff Bell World Alliance for Decentralized Energy WADE (2007) Concrete Energy Savings page 20.
65 Dr. Eng. ,Mitsuhiro ITO Engineering & Technology Dept. Taiheiyo Cement Corporation Energy Conservation in the Japanese Cement Industry. Retrieved at: http://www.nedo.go.jp/kokusai/kouhou/181206/session03/3-2.pdf
66 Michael Ruth, Ernst Worrell & Lynn Price. (July 2006). Evaluating Clean Development Mechanism Projects in the Cement Industry Using a Process-Step Benchmarking Approach LBNL 45346 page 6. Retrieved at: http://ies.lbl.gov/iespubs/45346.pdf
67 Ernst Worrell and Christina Galitsky Energy Analysis Department LBNL. (January 2004). Energy Efficiency Improvement and Cost Saving Opportunities for Cement Making. Retrieved at: http://www.osti.gov/bridge/servlets/purl/821915-Re2kcK/native/821915.PDF
68 Klaus Heinloth. (February 2003). Die Energiefrage. ISBN 3-528-13106-3 page 63 Tab. 1.16
69 Jeff Bell World Alliance for Decentralized Energy WADE (2007) Concrete Energy Savings
70 Own estimate based on a consumption of 105kWh/t clinker, the 2006 cement and electricity production.
71 Jeff Bell World Alliance for Decentralized Energy WADE (2007) Concrete Energy Savings
72 International Energy Agency IEA (2004) IEA Statistic division. Retrieved at http://www.iea.org/Textbase/stats/electricitydata.asp?COUNTRY_CODE=BR
73 International Energy Agency Data Service (2006) Indirect CO2 Emissions from Purchased Electricity. Retrieved at: http://www.ghgprotocol.org
74 Jane Ellis OECD and Richard Baron IEA. (November 17 2005). Sectorial Crediting Mechanisms: an initial assessments of electricity and aluminum. JT00194332. Retrieved at: http://www.oecd.org/dataoecd/62/39/35798634.pdf

86A blueprint for a climate friendly cement industry
11. References
75 Richard A. Zahoransky. (2004). Energietechnik. ISBN 3-528-13925-0
76 Jeff Bell World Alliance for Decentralized Energy WADE (2007) Concrete Energy Savings
77 Prospects for Efficiency Improvements in China´s Cement Sector/Cement Energy Efficiency Workshop Organized by IEA in cooperation with WBCSD Paris 4-5 September 2006. Lynn Price: EETD LBNL
78 Clinton Watson, John Newman, Rt Hon Simon Upton & Petra Hackmann, Organisation for Economical Cooperation and Development OECD. (June 1-2 2007). Round Table on Sustainable Development – Can transnational sectoral agreements help reduce greenhouse gas emissions? Figure B6 “Fuel Mix for Cement Production” page 66. Retrieved at: http://www.oecd.org/dataoecd/14/11/35030013.pdf
79 Jeff Bell World Alliance for Decentralized Energy WADE. (2007). Concrete Energy Savings. Page 14
80 Compilation of various sources including:
International Energy Agency IEA (2007) World Economical Outlooks, Price forecasts based on the average medium prognosis for different regions of the world.
World Business Council for Sustainable Development. (2006). ghgprotocol – emission factors retrieved at: www.ghgprotocol.com
81 Ib.
82 World Business Council on Sustainable Development. (December 2005). Guidelines for the Selection and Use of Fuels and Raw Materials in the Cement Manufacturing Process Cement Sustainability Initiative CSI. Retrieved at www.wbcsd.org
83 Vattenfall AB. (June 2006). Global Mapping of Industry Greenhouse Gas Abatement Opportunities up to 2030: Industry Sector Deep-dive.
84 World Business Council on Sustainable Development. (December 2005). Guidelines for the Selection and Use of Fuels and Raw Materials in the Cement Manufacturing Process Cement Sustainability Initiative CSI. Retrieved at www.wbcsd.org
Interview with Igor Hensing, Ecofys
85 Klaus Heinloth. (February 2003). Die Energiefrage. ISBN 3-528-13106-3 page 390 Table 12.1
86 World Resource Institure WRI & World Business Council on Sustainable Development. (2006). Cement Sustainability Initiative CO2 Emissions Inventory Protocol, Version 2.0.
World Resource Institure WRI & World Business Council on Sustainable Development. (July 2005). Calculation Tool for Direct Emissions from Stationary Combustion. Retrieved at: http://www.ghgprotocol.org
87 Christian Capello Dipl. Umwelt-Natw. Swiss Federal Institute of Technology ETH. (September 2 1976). Environmental Assessment of Waste-Solvent Treatment in the Swiss Chemical Industry. Retrieved at : http://e-collection.ethbib.ethz.ch/ecol-pool/diss/fulltext/eth16458.pdf
88 World Resource Institure WRI & World Business Council on Sustainable Development. (2006). Cement Sustainability Initiative CO2 Emissions Inventory Protocol, Version 2.0.
World Resource Institure WRI & World Business Council on Sustainable Development. (July 2005). Calculation Tool for Direct Emissions from Stationary Combustion. Retrieved at: http://www.ghgprotocol.org

87A blueprint for a climate friendly cement industry
11. References
89 World Business Council on Sustainable Development. (December 2005). Guidelines for the Selection and Use of Fuels and Raw Materials in the Cement Manufacturing Process Cement Sustainability Initiative CSI. Retrieved at www.wbcsd.org
90 Own estimated range based on several sources for estimates in various countries.
91 Picture of coconut husks used as a biomass based fuel provided by Lafarge
92 World Resource Institure WRI & World Business Council on Sustainable Development. (2006). Cement Sustainability Initiative CO2 Emissions Inventory Protocol, Version 2.0.
World Resource Institure WRI & World Business Council on Sustainable Development. (July 2005). Calculation Tool for Direct Emissions from Stationary Combustion. Retrieved at: http://www.ghgprotocol.org
93 Gareth Jones, Lafarge ESD (April 7 2004) Feasibility of utilising biomass fuels in cement production Internal resource, unpublished study
94 World Resource Institute. (2003). Greenhouse Gases World Flowchart RI GHG protocol retrieved from: http://cait.wri.org/worldflowchart
95 Vattenfall AB. (June 2006). Global Mapping of Industry Greenhouse Gas Abatement Opportunities up to 2030: Industry Sector Deep-dive.
96 Wang Hengchen et al. (October 2004). Cleaner Production and Circular Economy for Cement Industrial Sector in China. Retrieved at http://www.chinacp.com/eng/cppub/cement/Wang2004.pdf
97 Michael Taylor, International Energy Agency. (4-5 September 2006). Energy Efficiency and CO2 Reduction Opportunities in the Global Cement Industry, retrieved from the IEA website at: http://www.iea.org/Textbase/work/2006/cement/taylor_background.pdf
Lynn Price & Christina Galitsky Lawrence Berkeley National Laboratory. (August 2006). Opportunities for Improving Energy and Environmental Performance of China’s Cement Kilns internal Ecofys-LBNL source
98 Based on several sources including:
Vattenfall AB. (June 2006). Global Mapping of Industry Greenhouse Gas Abatement Opportunities up to 2030: Industry Sector Deep-dive. Page 22
Comments from Wang Lan, China Building Materials Academy
99 Michael Taylor, International Energy Agency. (4-5 September 2006). Energy Efficiency and CO2 Reduction Opportunities in the Global Cement Industry, retrieved from the IEA website http://www.iea.org/Textbase/work/2006/cement/taylor.pdf
100 Vattenfall AB. (June 2006). Global Mapping of Industry Greenhouse Gas Abatement Opportunities up to 2030: Industry Sector Deep-dive.
101 Jeff Bell World Alliance for Decentralized Energy WADE. (2007). Concrete Energy Savings
102 Matthew Ogonowski, Mark Houdashelt, Jake Schmidt, Jin Lee & Ned Helme. Center for Clean Air Policy CCAP. (November 2006). Greenhouse Gas Mitigation in Brazil, China and India: Scenarios and Opportunities through 2025 – Conclusions and Recommendations. Retrieved at: http://www.ccap.org/international/Conclusions-Developing%20Country.pdf
103 Pointcarbon. (May 30th 07). Asian energy demand trend seen quadrupling coal use: report. Article based on a report from the US Agency for International Development.

88A blueprint for a climate friendly cement industry
11. References
104 International Energy Agency. (2007). World Energy Outlooks
105 Ellis Gartner, Lafarge Central Research. (September 2006). Approaches to the Development of “Low CO2” Cements. Retrieved at http://www.iea.org/Textbase/work/2006/cement/Gartner.pdf
106 Ellis Gartner, Lafarge (2007) Contribution from Ellis Gartner
107 Ib.
108 John Harrison, developper of Eco-Cement (2007) Tececo Website. Retrieved at: www.tececo.com/
109 Ellis Gartner, Lafarge (June 2007) Correspondence with Ellis Gartner quoting the UK-BRE Study on Ecocements
110 Based on:
Geoplymer Institute (1996-2007) Geopolymer Institute Website. Retrieved at: http://www.geopolymer.org/
Zongjin Li, Zhu Ding, and Yunsheng Zhang. (unknown). Development of Sustainable Cementitious Materials. Retrieved at: http://www.geoswan.com/assets/sustainablecement.pdf
Cordi-Geopolymere (February 2007) Technical Data DAVYA60(™) Cement
111 Estelle Desarnaud, Soichiro Ando,Thibaud Desbarbieux & Yannick Prebay (October 2005). Atelier changement climatique. page 26. Retrieved at: http://www.enpc.fr/fr/formations/ecole_virt/trav eleves/cc/cc0506/ciment.pdf
112 C-fix Shell (2006) Website resources available at http://www.c-fix.com/english/default.htm
113 Argonne National Laboratory, US Department of Energy (2007) Office of Technology Transfer Website. Retrieved at: http://www.anl.gov/techtransfer/Available_Technologies/Material_Science/Ceramicrete/index.html
114 Case study for Ductal material for 30m highway bridge:
Lafarge (July 2004), Intreret d´une Solution Ductal: Pont d´Autoroute. Retrieved at: www.lafarge.com
115 Case study on Heidelberg Cement in:
Hen Humphreys & Maha Mahasenan. World Business Council for Sustainable Development & Battelle. (March 2002). Toward a Sustainable Cement Industry – Substudy 8: Climate Change. Retrieved from: www.wbcsdcement.org/pdf/final_report8.pdf
116 Frederic Vallat Lafarge. (April 2007). Interview with Frederic Vallat.
117 Professor Dr.-Ing. Michael Schmidt, Deutsche Forschungsgesellschaft. (2005). DFG Annual report 2005 SPP1182. Retrieved at: http://www.dfg.de/jahresbericht/Wcba9ba1870ce5.htm
118 Peter Schossig Fraunhofer Institute ISE. (2003) Wax Based Heat Storage for Buildings. Retrieved at: http://www.fraunhofer.de/fhg/archiv/presseinfos/pflege.zv.fhg.de/english/press/pi/pi2003/07/rn_t2.html
89A blueprint for a climate friendly cement industry
11. References
119 Several sources from Ellis Gartner including :
Ellis Gartner, Lafarge Central Research. (September 2006). Approaches to the Development of “Low-CO2” Cements. Retrieved at http://www.iea.org/Textbase/work/2006/cement/Gartner.pdf
120 Own estimates based on:
Nicolas DECOUSSER & Jerome DANIS, CERIB. (2006). Fiche de declaration environmentale et sanitaire du mur en maconnerie de blocs en beton. ISBN 2-85755-193-2
121 K.O. Kjellsen,Norcem; M. Guimaraes, Aalborg Portland; Å. Nilsson, Cementa (December 19, 2005) The CO2 balance of concrete in a Life Cycle perspective. Danish Technological Institute. Retrieved at http://www.danishtechnology.dk/building/18487,6
122 International Panel on Climate Change. (Sept. 2005). Special Report on Carbon Dioxide Capture and Storage Summary for Policy Makers. Retrieved at: http://www.ipcc.ch/pub/reports.htm
123 Based on:
International Panel on Climate Change. (Sept. 2005). Special Report on Carbon Dioxide Capture and Storage Summary for Policy Makers. Retrieved at: http://www.ipcc.ch/pub/reports.htm
Chris Hendriks and Wina Graus, Ecofys & Frank Van Bergen TNO-NTIG. (2004). Global Carbon Dioxide Storage: Potential and Costs. Internal resource
124 Based on several publications from Ellis Gartner, 2006 and:
Pradeep Kumar, General Manager National Council for Cement and Building Materials. (2006). Discussion Paper on Clean Energy Opportunities in the Cement Industry. Retrieved at: http://www.ficci.com/media-room/speeches-presentations/2001/aug/aug3-clean-pradeep.ppt
125 International Energy Agency Data Service (2006) Indirect CO2 Emissions from Purchased Electricity. Retrieved at: http://www.ghgprotocol.org
126 Hans Jürgen Stehr Chair of CDM Executive Board. (Carbonexpo 2007). The State of Play of the CDM. Retrieved at: http://www.mc cgn.de/km/carbonexpo/conference/download_presentations_2007/pdf/wed_17.45-19.15_os_Stehr.pdf
127 International Energy Agency Data Service (2006) Indirect CO2 Emissions from Purchased Electricity. Retrieved at: http://www.ghgprotocol.org
128 Energy Research Institute ERI (2006) China Cement Industry, a Survey page 12-13
129 Wang Hengcheng et al Consultant, WBS 100 China-Canada. (October 2004). CP Project Cleaner Production and Circular Economy for Cement Industrial sector in China, Page 10.
130 Based on various sources including:
China Association of Development Zones (2007) Website. Retrieved at http://www.cadz.org.cn/en/tzzg/part2_3.asp (no longer available)
National Economic and Development Zones (2007) Industries encouraged – prohibited – restricted. Retrieved at http://www.china.org.cn/english/null/75903.htm

90A blueprint for a climate friendly cement industry
11. References
131 Mason H. Soule, Jeffrey S. Logan, and Todd A. Stewart. World Business Council for Sustainable Development & Battelle. (March 2002). Trends, Challenges, and Opportunities in China’s Cement Industry. Retrieved at http://www.wbcsd.org/DocRoot/QnoY08cZaWF2bRC8m4rv/sub_china.pdf
132 Ib.
133 Ib.
134 Mason H. Soule, Jeffrey S. Logan, and Todd A. Stewart. World Business Council for Sustainable Development & Battelle. (March 2002). Trends, Challenges, and Opportunities in China’s Cement Industry. Retrieved at http://www.wbcsd.org/DocRoot/QnoY08cZaWF2bRC8m4rv/sub_china.pdf
135 Based on several sources depicting the economical and environmental situation in China. Official statements from Chinese officials available on: http://www.ccchina.gov.cn/en (Office of National Coordination Committee on Climate Change).
136 Runming Yao, Baizhan Li and Koen Steemers (2005) Energy policy and standard for built environment in China”
137 Ib.
138 Marke Levine, Lawrence Berkeley National Laboratory. (May 23 2006). Take-off of consumer goods highlights the need for efficiency standards. Retrieved at http://chinausclimate.org/downloads/presentations/levinemark.pdf
139 Alicia Robbins, Paul Boardman, Dr. John Perez-Garcia & Rose Braden CINTRAFOR (April 2003). An introduction to the Chinese Residential Construction and Building Material Market, Working paper 94 page 2. Retrieved at: http://www.cintrafor.org/RESEARCH_TAB/links/WP/WP94.htm
140 People’s Daily. (March 17 2004). No more solid clay bricks for contruction. Source: Xinhua. Retrieved at http://english.people.com.cn/200403/17/eng20040317_137777.shtml
141 International Monetary Fund. (2007). World Economical Outlooks database. available at: http://www.imf.org/external/pubs/ft/weo/2006/02/data
142 Based on:
People Daily online. (May 19, 2004.) China´s urbanization process in full scale acceleration. Retrieved at: http://english.peopledaily.com.cn/200405/19/eng20040519_143708.html
Chinanews. (november 18, 2005.) China’s urbanization encounters “urban disease”. Retrieved at: http://www.chinanews.cn/news/2005/2005-11-18/14441.html
143 Own calculations based on the IMF Database, using a conversion of the GDP ppp per capita to 1990 $
144 Growth rate from the Natonal Statistic Bureau (July 11, 2007) NSB bulletin
145 GDP ppp records from IMF Statistical division. Own prognosis based on a combination of achievable growth and governmental target. Based on:
National Development and Reform Commission. (2007). China Mapping out the 11th Five-Year Development Guideline. Documents retrieved from: http://www.china.org.cn/english/features/guideline/156529.htm
146 Own calculated figures as combination of achievable growth and governmental target. See Ib.
91A blueprint for a climate friendly cement industry
11. References
147 Daily People quoting the Development Research Center of China’s State Council:
Daily People article. (March 21 2005). Forecast: China to maintain around 8 percent GDP growth through 2010. Retrieved at: http://english.people.com.cn/200503/21/eng20050321_177555.html
148 Own estimation based on the USGS study corrected by the Chinese national production data
149 Own estimates based on several corrected sources.
150 Combination of literature values & own calculations. Population data from IMF World Economical Outlook Database (2006). Production level from each country from U.S. Geological Survey 2006, Cembureau key data 2005 (for EU countries) and Michael Taylor´s draft version 30/8/2006 of the IEA-WBCSD workshop: Energy Efficiency and CO2 Emission Reduction Potentials and Policies in the Cement Industry, IEA, Paris, 4-5 September 2006
151 Own combination of compared figures from: USGS (United States Geological Survey), IMF (International Monetary Fund), United Nations Statistical division (UNSTAT) and the European Cement Association (Cembureau).
152 Compiled data for the EU and Japan:
EU Data from: The European Cement Association. (2000-2007). Retrieved may 2006 the Cembureau website, Keyfacts http://www.cembureau.be/Key_01.asp
Japanese data from: Organsiation for Economoical Coopertation and Development OECD (2004) 2003 Indicators for OECD countries
153 According to own forecast based on several compared and corrected figures. The sum of the consumed cement by the stabilization point since the post World War Two era would be 19 t per capita. This is a value very closed to the sum observed for very similar Asian countries having achieved their stabilization in cement demand.
154 As stated in different China Daily articles:
Fu Jing, China Daily. (April 26 2005). Over-Investment Urged to be Under Control. Article quoting Cao Yushu, spokesman for the National Development and Reform Commission NDRC. Retrieved at: http://www.chinadaily.com.cn/english/doc/2005-04/26/content_437675.htm
Yi Xianrong, in China Daily. (February 14 2005). More Control Requiered over Investment Zeal. The author is a researcher with the Institute of Finance and Banking at the Chinese Academy of Social Sciences. Retrieved at: http://www.chinadaily.com.cn/english/doc/2005-04/26/content_437675.htm
155 Liu Zuoyi, DigitalCement (April 18 2006) Meeting with Liu Zuoyi
156 Own estimates based on the GDP and population of each province in 2004:
National Bureau of Statistics of China. (2006). China Statistical Yearbook 2005.
157 Own estimates based on several statistics from the 1995-2005 period
158 International Energy Agency. (2007). World Energy Outlooks 2006.
159 Zhang Anhua and Zhao Xingshu (2006) Efficiency Improvement and Energy Conservation in China´s Power Sector. Based on 2005 figures from given provided by the British government: Recovered at http://www.hm-treasury.gov.uk/media/9A0/D9/

92A blueprint for a climate friendly cement industry
11. References
160 Noer Marius & KJÆR Sven, Vestkraft Power Company and ELSAMPROJEKT. (2006) DEVELOPMENT OF ULTRA SUPER CRITICAL PF POWER PLANTS IN DENMARK NOER World Energy Council publication. Retrieved at: http://www.worldenergy.org/wec-geis/publications/default/tech_papers/17th_congress/2_2_02.asp
161 Hu Xiulian, Energy Research Institute (April 2007) Chinese national statistics as indicated during an interview.
162 Own estimate based on several studies.
163 Own calculation based on the corrected figures from Michael Taylor, International Energy Agency, the Chinese national production figures and own forecasts leading to 2030
164 Mason H. Soule, Jeffrey S. Logan, and Todd A. Stewart. World Business Council for Sustainable Development & Battelle. (March 2002). Trends, Challenges, and Opportunities in China’s Cement Industry. Retrieved at http://www.wbcsd.org/DocRoot/QnoY08cZaWF2bRC8m4rv/sub_china.pdf
165 Based on the national Chinese Policy. Source from literature and interviews (April 2006)
166 Wang Hengchen et al. (October 2004). Cleaner Production and Circular Economy for Cement Industrial Sector in China. Retrieved at http://www.chinacp.com/eng/cppub/cement/Wang2004.pdf
167 Figure of the outdated kilns capacity from:
Liu Ming, National Development and Reform Commission NDRC, responsible for the work under the AP6 agreement. (April 16 2006). Interview with WWF/Ecofys.
168 Own estimates based on several sources: Interviews with Chines Officials; Interview with Digital Cement; LBNL Studies
169 Own estimates based on a combination of the Chinese policy and international large cement manufacturer.
170 Wang Hengchen et al. (October 2004). Cleaner Production and Circular Economy for Cement Industrial Sector in China. Retrieved at http://www.chinacp.com/eng/cppub/cement/Wang2004.pdf
171 Figure based on several estimates given by Chinese officials.
172 Wang Lan and Cui Qi, Chinese Building Materials Academy, China Cement Standard Comitte & Jane Zhou, Lafarge (April 17 2007) Meeting with Ecofys/WWF
173 Chen Ying and Zhuang Guiyang, China Academy of Social Science (April 16 2007) Meeting with Chen Ying and Zhuang Guiyang and Ecofys/WWF
174 Wang Hengchen et al. (October 2004). Cleaner Production and Circular Economy for Cement Industrial Sector in China. Retrieved at http://www.chinacp.com/eng/cppub/cement/Wang2004.pdf
175 Statement from the SEPA. Due to the difficulty assess precisely, other sources put the figures up to 7 10% of the GDP.
State Environmental Protection Agency SEPA and National Bureau of Statistic NBS (August 9 2006) China Green National Accounting Study Report 2004 Issued Joint Statement. Retrieved at: http://english.sepa.gov.cn/zwxx/xwfb/200609/t20060908_92580.htm
Daily People (June 6 2006) Pollution Cost Equal to 10% of China´s GDP. Retrieved at: www.chinadaily.com.cn/china/2006-06/06/content_609350.htm

93A blueprint for a climate friendly cement industry
11. References
176 Mason H. Soule, Jeffrey S. Logan, and Todd A. Stewart. World Business Council for Sustainable Development & Battelle. (March 2002). Trends, Challenges, and Opportunities in China’s Cement Industry. Retrieved at http://www.wbcsd.org/DocRoot/QnoY08cZaWF2bRC8m4rv/sub_china.pdf
177 Own estimates based on the VSK fuel overconsumption. Figures from China Cement Industry: A survey
178 Liu Zuoyi, DigitalCement (April 18 2006) Meeting with Liu Zuoyi
179 Bundesagentur für Aussenwirtschaft (2007) as quoted in http://www.co2 handel.de/article306_5062.html
180 WBCSD; Energy Efficiency in Buildings (EEB); Business realities and opportunities; The World Business Council on Sustainable Development, Geneva, 2007.
181 Chinese National Climate Change Program (June 12, 2007) China’s National Climate Change Programm. Retrieved at: http://eg.china-embassy.org/eng/xinwen/t329258.htm
182 CO2 emissions from:
Netherlands Environmental Assessment Agency MNP, using BP energy data. (BP, 2007). Global CO2 emissions retrieved from the MNP website at:
http://www.mnp.nl/mnc/c-0533-001g-mnc-02-nl-xls.html and http://www.mnp.nl/en/dossiers/Climatechange/moreinfo/Chinanowno1inCO2emissionsUSAinsecondposition.html
Chinese population data from:
International Monetary Fund IMF Statistical division. (April 2007). World Economical Outlook Database. Data query at: http://www.imf.org/external/pubs/ft/weo/2007/01/data/index.aspx
183 Jiang Yuxia, Xinhua. (June 4, 2007). China issues national plan to address climate change. Retrieved at: http://news.xinhuanet.com/english/2007-06/04/content_6196302.htm
184 IPCC (International Panel on Climate Change) Working group II: Climate Change: Impact, Adaptation and Vulnerability.
http://www.grida.no/climate/ipcc_tar/wg2/index.htm
185 State Environmental Protection Agency SEPA and National Bureau of Statistic NBS (August 9 2006) China Green National Accounting Study Report 2004 Issued Joint Statement. Retrieved at: http://english.sepa.gov.cn/zwxx/xwfb/200609/t20060908_92580.htm
186 Daily People (June 6 2006) Pollution Cost Equal to 10% of China´s GDP. Retrieved at: www.chinadaily.com.cn/china/2006-06/06/content_609350.htm
187 Ying Chen, Research Center for Sustainable Development. (July 27, 2007) Correspondance with Ying Chen
188 Liu Zuoyi, DigitalCement (April 18 2006) Meeting with Liu Zuoyi
189 Ib.
190 Kong Xiangzhong, head of the China Cement Association (April 16 2006) Meeting with Kong Xiangzhong at the China Building Academy

94A blueprint for a climate friendly cement industry
11. References
191 Registered CDM projects listed at:
United Nations Framework on Climate Change (2007) CDM Project Search Tool. Retrieved at: http://cdm.unfccc.int/Projects/projsearch.html
192 Asia Pacific Partnership on Clean Development. (unknown). Vision Statement of Australia, China, India, Japan, the Republic of Korea, and the United States of America for a New Asia-Pacific Partnership on Clean Development and Climate. Retrieved at: http://www.asiapacificpartnership.org/vision.pdf
193 Own calculations based on the displacement of coal power generation assuming 80% of the world clinker production retrofitted.
194 Own estimates based on the own corrected IEA prognosis from Michael Taylor (2006)
195 Jane Ellis, OECD and Richard Baron, IEA (17 nov 2005) Sectoral Crediting Mechanisms: An Initial Assessment of Electricity and Aluminium, JT00194332
196 Groenberg H. (2005) “Projection of energy-intensive material production for bottom-up scenario building,” Ecological Economics 53 75 – 99

© 1986 P
anda sym
bol W
WF – W
orld W
ide Fund
For Nature (Form
erly World
Wild
life Fund)
® “W
WF” &
“living planet” are W
WF R
egistered Trad
emarksThe complete report can be downloaded at www.panda.org/climatesavers
WWF’s mission is to stop the degradation of the planet’s natural environment and to build a future in which humans live in harmony with nature by:• conserving the world’s biological diversity• ensuring that the use of renewable natural resources is sustainable• promoting the reduction of pollution and wasteful consumption.
WWF InternationalAvenue du Mont-Blanc1196 GlandSwitzerland
Tel: +41 22 364 9111Fax: +41 22 364 5358
www.panda.org