A Bird Community Index for the Mid-Atlantic Piedmont and ... · This project was made possible by a...
52
A Bird Community Index for the Mid-Atlantic Piedmont and Coastal Plain Final Report Submitted to: U. S. Environmental Protection Agency – NCERQA 401 M. Street, SW (8723R) Washington, DC 20460 Report No. 2003-02 Penn State Cooperative Wetlands Center April 2003
Transcript of A Bird Community Index for the Mid-Atlantic Piedmont and ... · This project was made possible by a...
A Bird Community Index for the
Mid-Atlantic Piedmont and Coastal Plain
Final ReportSubmitted to:
U. S. Environmental Protection Agency – NCERQA401 M. Street, SW (8723R)
Washington, DC 20460
Report No. 2003-02Penn State Cooperative Wetlands Center
April 2003
2
United States Environmental Protection Agency
A Bird Community Index for the
Mid-Atlantic Piedmont and Coastal Plain
Final Report
Submitted to:
U. S. Environmental Protection Agency – NCERQA401 M. Street, SW (8723R)
Washington, DC 20460
Report No. 2003-02Penn State Cooperative Wetlands Center
Submitted by:
Timothy O'Connell, Robert Brooks,
Michael Lanzone, and Joseph Bishop
Penn State Cooperative Wetlands Center
301 Forest Resources Laboratory
Pennsylvania State University
University Park, PA 16802April 2003

3
Acknowledgments
This project was made possible by a grant from the U.S. Environmental Protection
Agency (EPA), and we would specifically like to acknowledge the support of Barbara
Levinson. Many thanks are due to the Penn State Environmental Resources Research
Institute, especially Holly Fritchman, and the Penn State Cooperative Wetlands Center
for additional administrative and logistical support. Paul Gledhill made significant
contributions during field work. We would also like to recognize the many private
landowners and public land managers who granted access to their lands, and the
Virginia Department of Conservation and Recreation’s Division of Natural Heritage for
assistance in getting the field season off on a running start. Cover photograph by Mike
Lanzone.
This report should be cited as follows:
O’Connell, T. J., R. P. Brooks, M. J. Lanzone, and J. A. Bishop. 2003. A BirdCommunity Index for the Mid-Atlantic Piedmont and Coastal Plain. Final Reportto the USGS – Patuxent Wildlife Research Center. Report No. 2003-02, PennState Cooperative Wetlands Center, University Park, PA. 45 pp.

4
Executive Summary
At the Penn State Cooperative Wetlands Center, we are pursuing several projects
aimed at developing large-scale ecological assessment tools that feature the ecological
characteristics of breeding songbird assemblages as the primary indicator. Based on
earlier research that produced a bird community-based indicator of ecological condition
in the Appalachians, we expanded to the Mid-Atlantic Piedmont and Coastal Plain
physiographic provinces in 2001. We sampled 81 sites with point counts along 1-km
transects across a broad study region from eastern Pennsylvania to coastal North
Carolina and inland to the Ridge-and-Valley physiographic province. We selected
sample sites to represent a gradient of condition from urban or industrial land cover, to
intensive crop production, to low density residential development, to managed forest for
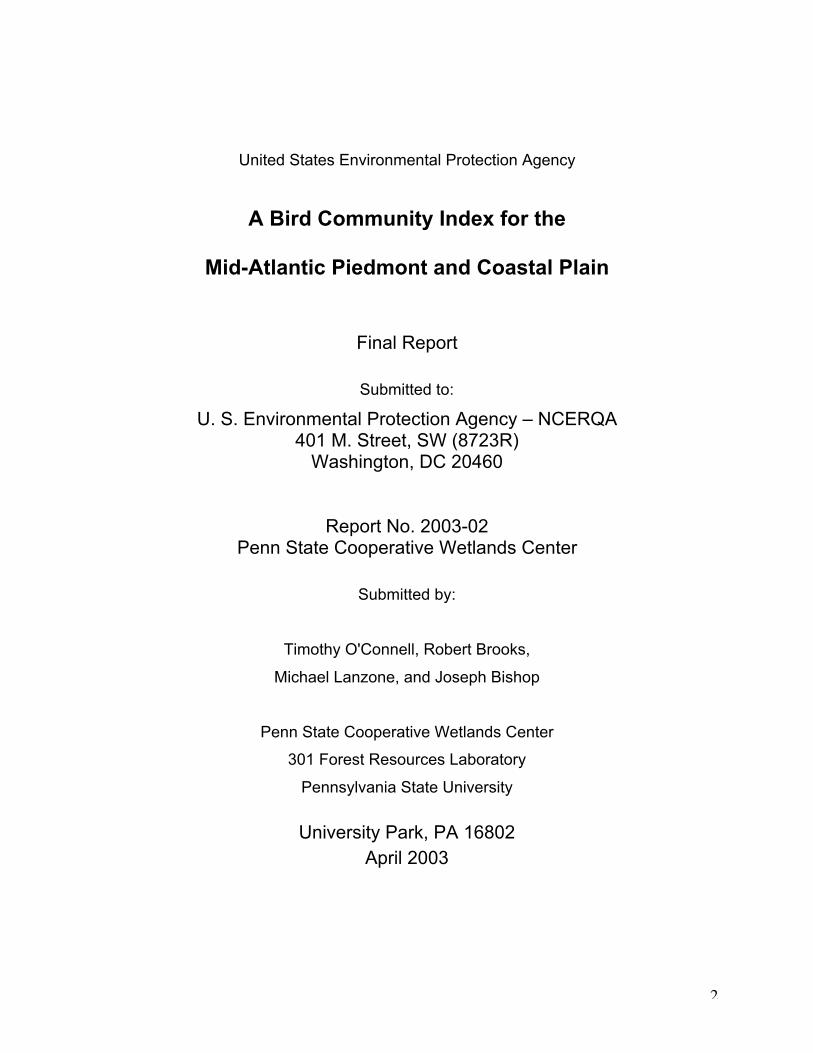
timber and pulpwood, and mature forest. We recognize two distinct states of “natural”
condition at landscape scales in uplands of the study region: a mature, mesic,
broadleafed or mixed forest that is infrequently disturbed by natural forces, and a pine
and oak savanna maintained by frequent low-intensity fires. Like our previous research
in the Appalachians, we found traditional community measures such as richness and
Shannon diversity to be unreliable indicators of anthropogenic disturbances. In contrast,
life history groups such as “ground nesting forest birds” exhibit statistical relationships to
varying degrees of landscape level disturbance. We chronicle herein the development
of a new Piedmont/Coastal Plain Bird Community Index that uses proportions of nine
guilds to assess overall ecological condition.

5
A Bird Community Index for the Mid-Atlantic Piedmont and Coastal Plain
Introduction
Natural resource managers, agency representatives, and others interested in
characterizing the health or condition of a given area frequently rely on ecological
indicators to provide efficient and reliable information on the system under study. Many
indicators have been developed to date, and these range in scale of response from site-
specific indicators of stream water quality (e.g., benthic macroinvertebrates, Karr 1991,
1993; Fore et al. 1996) to landscape scale indicators of entire ecoregions (e.g., Jones et
al. 1997).
The Bird Community Index (BCI) was one of the early attempts to produce a biological
indicator that operates at an ecoregion scale (O’Connell et al. 1998). The BCI is a multi-
metric index that ranks relative proportions of 16 songbird life history guilds on a scale
of ecological condition. Because the BCI was initially modeled on a series of sites at
which multiple taxa (e.g., herbaceous plants, mammals, amphibians) had been
assessed, BCI scores are intended to convey information on overall ecological
condition, rather than just on the condition of the songbird assemblage. Because BCI
scores are significantly associated with elements of land cover, the BCI summarizes

6
biological information at landscape scales and calibrates thresholds of land cover
change with significant biological changes in bird communities (O’Connell et al. 2000).
Ecological indicators that feature data on songbird assemblages are well suited for
generalized assessments of upland condition at large scales for several reasons. First,
with a few noteworthy exceptions (e.g., salt flats, high peaks), there is a relatively
species rich songbird assemblage occurring in every upland environment of temperate
North America. Many species’ distributions are affected by habitat fragmentation or
other habitat structure parameters (Askins and Philbrick 1987, Freemark and Collins
1992, Murray and Stauffer 1995, Wilson et al. 1995, Schmiegelow et al. 1997). Also,
birds commonly occupy high trophic levels and may integrate functional disturbance at
lower levels (Cody 1981, Sample et al. 1993, Pettersson et al. 1995, Rodewald and
James 1996). Bird community composition reflects interspecific dynamics and
population trends (Cody 1981). Thus, a detailed community account of a breeding
songbird assemblage conveys information relating to ecosystem structure, function, and
composition that are relevant to discussions of ecological health or integrity (Noss 1990,
Karr and Chu 1999).
Birds assemblages are also attractive as ecological indicators because, relative to other
taxa, songbird survey techniques have been well studied, and millions of people are
skilled in techniques to sample birds. Also, several large scale monitoring projects are
established across the United States and Canada that are volunteer supported, publicly
7
available, and potentially a source of data to which songbird indicators could be applied.
At least one such program, the North American Breeding Bird Survey, has shown
potential as source data for the BCI (O’Connell et al. 2002). Thus, the implementation of
bird-based models of ecological condition could be rapidly, cheaply, and efficiently
administered across all U. S. ecoregions.
It is important to note, however, that the manner in which bird assemblage data are
compiled bears on the utility of those data to accurately reflect ecological condition.
Simple measures of species richness or Shannon-Weiner diversity can yield
confounding results when these calculations peak at levels of intermediate disturbance.
To eliminate this ambiguous interpretation, we designed the BCI to feature relative
proportions of life history guilds on which breeding bird assemblages are sorted and
ranked (e.g., Verner 1984, Szaro 1986, Brooks and Croonquist 1990). A bird community
that indicates high integrity is dominated by guilds dependent on native system
attributes. This guild-based approach to evaluating biotic integrity results in high BCI
scores for bird communities in which specialists are well represented relative to
generalists (O’Connell et al. 1998, 2000). Because each species belongs
simultaneously to several guild categories, we can iteratively analyze bird species data
to create a multi-metric index. Based on guilds, the index can be calibrated for many
different regions and be relevant regardless of species composition.

8
A network of bird-based indicators, modeled after the BCI, could be developed and
applied across all ecoregions of the coterminous United States and contribute to efforts
to produce national assessments of ecological health and condition. The number of
BCIs required to achieve full coverage for the coterminous U.S. is a function of large
scale potential vegetation cover and major shifts in the breeding bird fauna. For
example, the area to which we are confident in applying the original BCI encompasses
the following ecoregions as identified in Ricketts et al. (1999): Appalachian/Blue Ridge
Forests, Appalachian Mixed Mesophytic Forests, Central U.S. Hardwood Forests,
Allegheny Highlands Forests, Southern Great Lakes Forests, and Eastern Great Lakes
Forests (Figure 1). Throughout all of these ecoregions, broadleaf and mixed forest types
predominate where anthropogenic disturbance is light, and songbird communities are
typified by warblers, vireos, thrushes, and woodpeckers. In contrast, areas disturbed by
urban or agricultural development are characterized by a dearth of warblers, and
conspicuous corvids, blackbirds, and exotic species (O’Connell et al. 2000).
To the south and east of the original “Appalachian” BCI area, a significant shift in
climate and geomorphology creates conditions in which a more xeric oak/pine forest or
fire-influenced pine savanna characterizes areas receiving little anthropogenic
disturbance. This area is identified in Ricketts et al. (1999) as including the Northeastern
Coastal Forests, Atlantic Coastal Pine Barrens, Southeastern Mixed Forests, Middle
Atlantic Coastal Forests, and Southeastern Conifer Forests ecoregions. We refer to this

9
area as the “Piedmont/Coastal Plain,” a title that is inclusive of both Atlantic and Gulf
coastal areas (Figure 1).
Corresponding with differences in potential natural vegetation between Appalachian and
Piedmont/Coastal Plain areas, there is also an important shift in potential bird fauna. At
least 22 species of small land birds, including nine species of warblers, breed in the
Appalachian area but not in the Piedmont/Coastal Plain area. Approximately six
species breed in the Piedmont/Coastal Plain but not in the Appalachian area. Thus, due
to differences in potential vegetation and potential breeding bird fauna, we conclude that
the original “Appalachian” BCI is inappropriate in the Piedmont/Coastal Plain area, and
development of a new BCI for the Piedmont/Coastal Plain is warranted.
Objectives. Our objective in this research was to develop a new Bird Community Index
specific to the Piedmont/Coastal Plain. The intent was not to produce a model for
application at a local scale that would result in a bird-based rating of ecological health at
any given site, e.g., a suburban backyard. Rather, the BCI is a model that is applied to
data from multiple spatially explicit locations for an assessment of the entire region.
Thus, we cannot provide an accurate assessment of ecological health in the
Piedmont/Coastal Plain with the model described herein; the assessment is a second
step featuring the application of our model to other data (e.g., Breeding Bird Survey)
from the region.
10
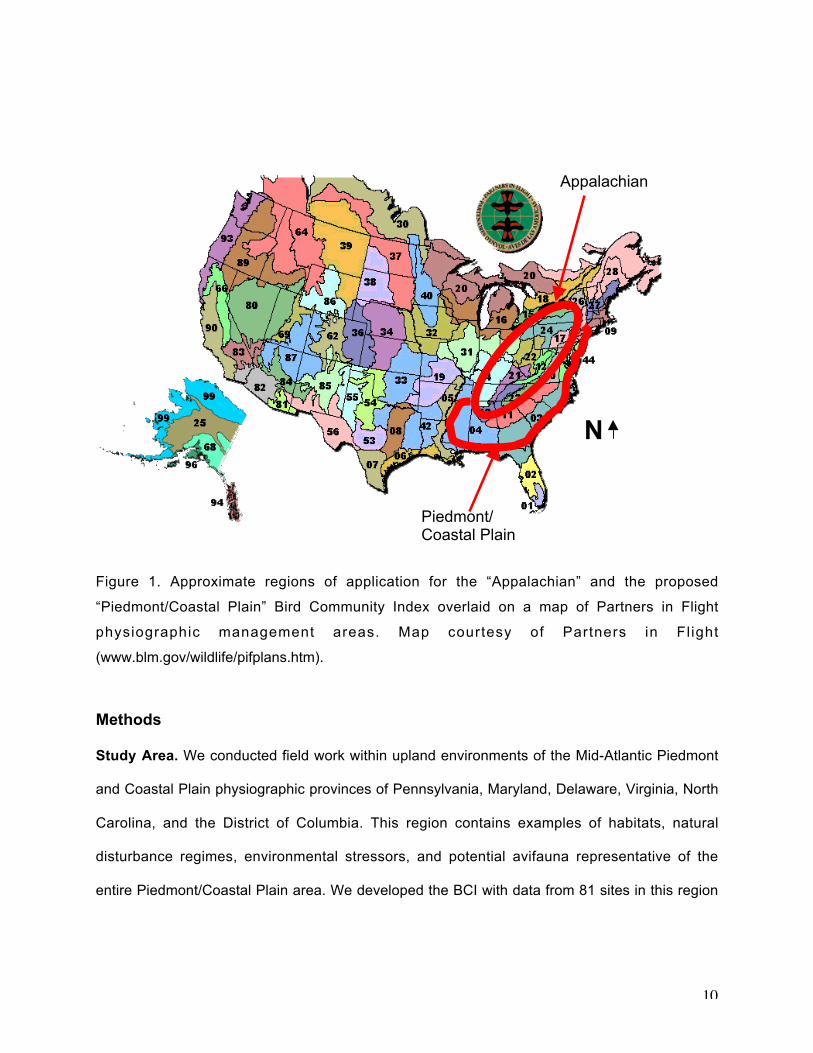
Figure 1. Approximate regions of application for the “Appalachian” and the proposed
“Piedmont/Coastal Plain” Bird Community Index overlaid on a map of Partners in Flight
physiographic management areas. Map courtesy of Partners in Fl ight
(www.blm.gov/wildlife/pifplans.htm).
Methods
Study Area. We conducted field work within upland environments of the Mid-Atlantic Piedmont
and Coastal Plain physiographic provinces of Pennsylvania, Maryland, Delaware, Virginia, North
Carolina, and the District of Columbia. This region contains examples of habitats, natural
disturbance regimes, environmental stressors, and potential avifauna representative of the
entire Piedmont/Coastal Plain area. We developed the BCI with data from 81 sites in this region
Appalachian
Piedmont/Coastal Plain
N
11
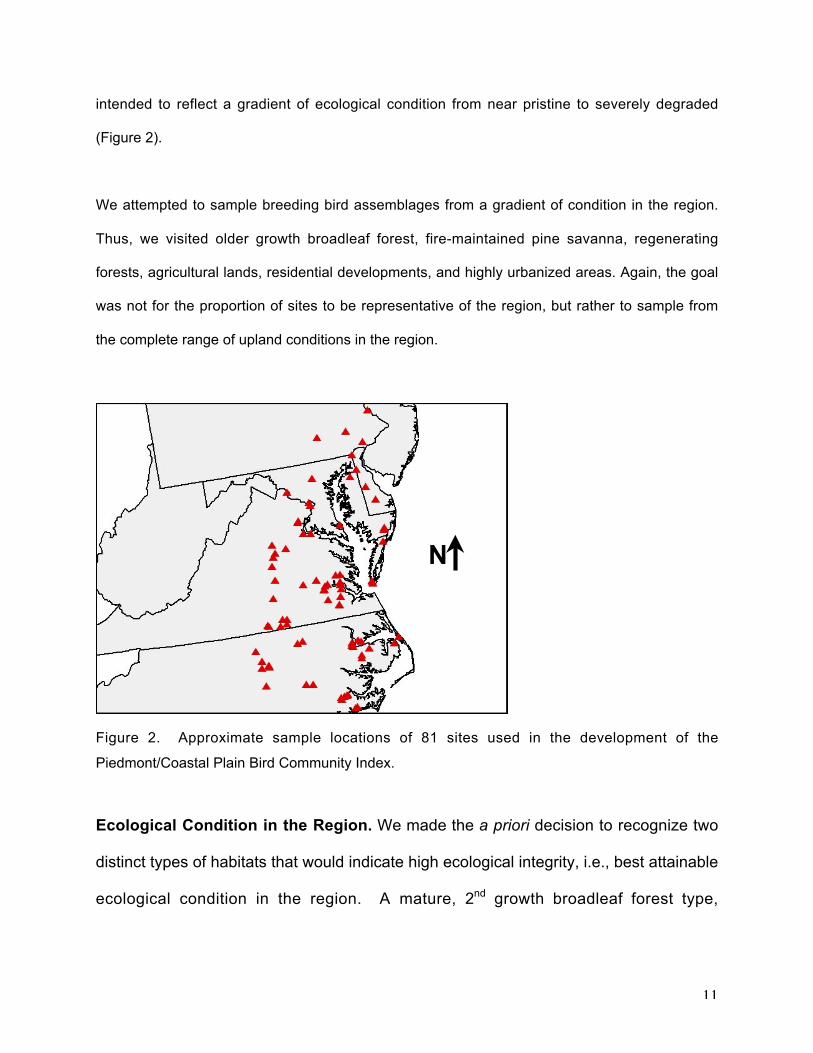
intended to reflect a gradient of ecological condition from near pristine to severely degraded
(Figure 2).
We attempted to sample breeding bird assemblages from a gradient of condition in the region.
Thus, we visited older growth broadleaf forest, fire-maintained pine savanna, regenerating
forests, agricultural lands, residential developments, and highly urbanized areas. Again, the goal
was not for the proportion of sites to be representative of the region, but rather to sample from
the complete range of upland conditions in the region.
Figure 2. Approximate sample locations of 81 sites used in the development of the
Piedmont/Coastal Plain Bird Community Index.
Ecological Condition in the Region. We made the a priori decision to recognize two
distinct types of habitats that would indicate high ecological integrity, i.e., best attainable
ecological condition in the region. A mature, 2nd growth broadleaf forest type,
N
12
dominated by oaks, beech, hickories, and tuliptree occurs in scattered parks and natural
areas in patches big enough to acquire certain older growth characteristics (e.g.,
abundant downed wood, large diameter trees, pit-and-mound topography). Some
examples include Calvert Cliffs State Park in Calvert County, MD, the College Woods
on the campus of the College of William and Mary in Williamsburg, VA, and Medoc
Mountain State Park in Halifax County, NC.
We identified a fire-influenced pine savanna habitat as a second type indicative of high
ecological integrity in the study region. In these habitats, isolated stands of mature pines
are embedded in a matrix of grasses. Oaks (Quercus), sweetgum (Liquidambar) and
Rubus thickets may also be represented in these habitats. In the southern U.S., the
dominant pine in savannas is often longleaf pine (Pinus palustris); in our Mid-Atlantic
study area loblolly pine (Pinus taeda) serves as the dominant pine species. While pine
savannas historically occurred across much of the Piedmont and Coastal Plain, they
typically occur today only where specific management (i.e., prescribed fire) has been
introduced to mimic a natural disturbance regime, or on military bases where explosion
of live ordnance creates frequent low intensity fires in certain areas. The Blackwater
Ecological Preserve in Virginia’s Isle of Wight County and the Croatan National Forest
in Carteret County, NC provide well developed examples of Southeastern pine savanna.
The Mid-Atlantic study area is experiencing rapid growth in commercial and residential
development, and includes several large metropolitan centers, e.g., Philadelphia, PA,

13
Washington, DC, Virginia Beach, VA, and Raleigh-Durham, NC. In addition to the
pressures of urban sprawl in the region, intensive agricultural development for both crop
and livestock production is widespread, and forests frequently persist as small patches
relative to the Appalachian region. Forest management practices that replace mature
hardwood stands to short rotation pulp and paper production also significantly degrade
the quality of the apparent forest habitat revealed by satellite imagery.
Sampling. At each site, we established a 1-km sampling transect with five sample plots
located every 200m along the transect. Where access was granted by land owners, we
established off-road transects through forests, fields, or clearcuts. We also sampled
along roads, utility rights-of-way, or walking paths where we were prohibited from
following an off-road transect (e.g., residential subdivisions) or where there would be no
apparent benefit to leaving the path (e.g., state parks).
At each plot along a transect, we sampled birds with a 10-minute, unlimited-radius point
count between sunrise and 10:00 hrs EDT (Hutto et al. 1986, Manuwal and Carey 1991,
Ralph et al. 1993). We divided detection times into the first three, first five, and last five
minutes of the count period to facilitate comparisons to other sampling methods. We
timed bird sampling to coincide with the peak number of breeding songbirds in the
region and minimize the number of transients in the data. Thus we restricted bird
sampling to the period between 23 May and 3 July, 2001. We initiated field work earlier
14
in the southern portions of the study area, and concluded in July in the northern portion
of the study area.
While we recorded all individuals of any species that we encountered during point
counts, we restricted analysis to a subset of the total species pool that is efficiently
sampled by our methods. Thus, the subjects of this research include all breeding
members of the Passeriformes, Columbiformes, Apodiformes, Piciformes, Cuculiformes,
and the Common Bobwhite (Colinus virginianus).
At each bird sampling plot, we also sampled a suite of vegetation variables to
characterize ground-level habitat. We recorded the percentage cover of graminoids,
forbs, mosses, ferns, leaf litter, downed wood, rock, and impervious surfaces in three, 5-
m radius, circular subplots located 25m from plot center at 120, 240, and 360°. Also in
the subplots, we recorded the percentage cover of shrubs from 0.00-0.50m, 0.51-
2.00m, and 2.01-5.00m, and identified all shrubs to genus. Because we stressed
vertical structure over taxonomic affinity in our vegetation sampling, we applied the term
“shrub” liberally, and considered any leaf cover less than 5m in height to be a
component of the “shrub layer.” We recorded in the 5m subplots the number of downed
trees at least 50cm in diameter, the number of exposed root masses from fallen trees,
the number of trees with fire scars, and applied an Anderson Land Use Code (Anderson
et al. 1976). For sampling overstory trees, we established 11.3m-radius tree plots on the
same center points as the 5m subplots. All live trees within these plots were identified to

15
species and the dbh was recorded for trees and snags. We used a clinometer to
determine canopy height and slope, and a compass to assign aspect to each tree plot.
We determined plot elevation from USGS 7.5-minute topographic maps. All estimates of
percentage cover were made via ocular estimation with direct comparison to a
percentage cover template design.
Because we relied on multiple observers to collect data in the field, we conducted
training sessions for all observers prior to the field season. All observers demonstrated
at least 85% agreement in assessments of percent cover, tree heights, slope
measurements, auditory bird species identification, and abundance of bird species
before any data were collected. We also ran a “spot-check” on bird sampling later in the
field season (22 June) in which all observers conducted simultaneous point counts from
the same location.
For each sample site, we identified the coordinates for the center point of the 1-km
transect on USGS topographic maps using MapTech Terrain Navigator topographic
software (MapTech 2001). We are confident that all center points we mapped in this
way were accurate to within 10m of the actual transect center point. With center points
located, we quantified land cover in the local landscape contained within a circular area
of 500m radius centered on the transect center point. The resulting area is
approximately 79ha on the ground. O’Connell et al. (2000) demonstrated a high

16
correlation between land cover at this local scale and condition of the breeding songbird
community.
Land cover data that were used in this study were produced as part of a cooperative
project between the U.S. Geological Survey (USGS) and the U.S. Environmental
Protection Agency (USEPA) to produce a consistent, land cover data layer for the
conterminous U.S. based on Landsat thematic mapper (TM) data. National Land Cover
Data (NLCD) were developed from TM data acquired by the Multi-resolution Land
Characterization (MRLC) Consortium. The MRLC Consortium is a partnership of federal
agencies that produce or use land cover data (Loveland & Shaw 1996). Spatial
resolution is 30m on a side (900 m2) and the images were preprocessed to correct for
electronic problems and geographic referencing by the MRLC. Images for the mid-
Atlantic region were acquired from dates ranging from 1989 to 1994.
To quantify land cover around our sample sites, we plotted center point locations in
ArcView on the NLCD layer, and clipped out the 79-ha circular area around the points.
We used the program spatial analyst in ArcView to calculate land cover metrics.
Bird Communities in the Study Area. We summarized bird data for each site by
pooling data collected at each of the five point counts. We used abundance data from
the transects to calculate richness and diversity and to sort sites by dominant species.

17
We used species occurrence data only to calculate proportions of life history guilds in
each species assemblage.
We assigned birds to 33 life history guilds based on a literature review (Harrison 1975,
Blake 1983, DeGraaf et al. 1985, Roberts 1987, Ehrlich et al. 1988, Freemark and
Collins 1992, Curson et al. 1994, Byers et al. 1995, Rising 1996, Baicich and Harrison
1997, Gough et al. 1998, O’Connell 1999, Chadwick 2003) (Appendix A). To construct
the Piedmont/Coastal Plain BCI, we iteratively reduced the number of guilds that could
serve as potential metrics in the BCI, aiming for 8-12 metrics in the finished model (Karr
and Chu 1999). We considered several factors (e.g., high correlation with other guilds,
predictable response to land cover change) in determining the final list of guilds to be
included in BCI development.
Because we selected guilds specifically to reflect different aspects of each species’ life
history traits, species belong simultaneously to several guilds. Also, guild assignments
apply only to breeding season life history traits. If a species subsists on fruit during the
winter but is insectivorous during the breeding season, we included that species with
the insectivores. Also, guild assignments were specific to the Piedmont/Coastal Region,
so we considered American Robin (Turdus migratorius) to be a resident even though
this species is highly migratory in more northern portions of its breeding range.

18
We categorized individual guilds as “specialist” or “generalist” based on each guild’s
relationship to specific elements of ecosystem structure, function, and composition.
With this interpretation, a high proportion of a “specialist” guild or a low proportion of a
“generalist” guild at a site both result in high ranks for those guilds at those sites. The
ultimate BCI score is a compilation of individual guild ranks, based on our interpretation
of guild proportions. Because the guilds we used are really life history traits, a single
species may be assigned to both specialist and generalist guilds simultaneously.
To illustrate the interpretation, the Nest Placement guilds relate directly to the
availability of appropriate nesting substrate (a structural element). In our study, obligate
tree-canopy nesters (specialists) indicate high integrity because they are largely
restricted to mature forests native to the region, while shrub nesters (generalists) also
encounter appropriate nesting substrate in regenerating forests, agricultural hedgerows,
and suburban areas (Brauning 1992).
Analysis. To describe the variability in species occurrence and abundance, we applied
a detrended correspondence analysis (DCA) to the raw abundance data from all 81
sites. We then identified regions of ordination plot that shared similar land cover
proportions.
With species assigned to guilds, we summarized the proportional species richness of
each guild at each site to construct a bird community profile. For example, if two of the
19
species at a site containing a total of 10 species are single-brooded, then the bird
assemblage at the site would be summarized with a “0.20” for the single-brooded guild.
We grouped sites according to their similarity in bird community profiles through cluster
analysis, and confirmed statistically separable differences in individual guild proportions
among groups with one way analysis of variance (ANOVA) and Tukey’s multiple
comparisons procedure (Neter et al. 1990).
Prior to analyses, we tested all variables for normality (Anderson-Darling test) and
homogeneity of variance (Levene’s test). Variables that did not meet our assumptions
of normality or homogeneity of variance for parametric statistics were transformed or
omitted from analyses (Neter et al. 1990). All statistical analyses were performed with
the Minitab 10.5 Xtra for the Power MacIntosh statistical software package (Minitab
1995) or Canoco for Windows ordination software.
Steps in Development of the Piedmont/Coastal Plain BCI. With a basic idea of
community structure in the region and a guild profile available for every site, we began
the process of testing guild proportions as potential metrics in the BCI. Again, the
process is iterative, and subsequent steps are based on the results of preceding steps:

20
1. Because we were dealing exclusively with proportional data and we desired to use
normally distributed data for multivariate applications, we ran arcsin transformations
on all guild proportions (Neter et al. 1990).
2. To minimize the potential for multicollinearity to influence multivariate analyses, we
examined correlation matrices to identify a smaller number of guilds that would not
be correlated with any other guild at r > 0.60. Through the analysis of correlation
matrices, transformations, and tests for normality, we reduced the number of guilds
that could be used for multivariate analysis from 33 to 8.
3. We applied cluster analysis to the 81 sites, grouping sites according to arcsin-
transformed proportions of: interior forest birds, forest edge birds, cavity nesters,
shrub nesters, temperate migrants, Partners in Flight (PIF) open country priority
species for the Southeastern U. S., insectivores that primarily forage below 5m, and
aerial sallying insectivores. We used Ward’s linkage and Euclidean distance to
produce this cluster.
4. To determine the maximum number of clusters (i.e., the number of bird communities
in the region), we used ANOVA to identify statistically separable categories of guild
proportions in the groups of sites that clustered together. For example, if the cluster
analysis revealed three distinct groups of sites, we would test individual guild

21
proportions for differences among those clusters using cluster number as the factor
level in the ANOVA model.
5. With five clusters identified, we first tested individual guilds for normality and
homoscedasticity among the five clusters/factor levels. Diversity, richness, and 19
guilds met the requirements of the ANOVA model. While no single guild occurred in
proportions that were mutually statistically distinct among all categories, the ANOVA
results for 18 of 19 guilds provided redundant, statistically significant support for an
interpretation that five bird communities occur in the study area.
6. We next applied ranks (based on the specialist/generalist interpretation) to relative
proportions of 18 guilds at the 81 sites. Because no single guild occurred in five
mutually distinct proportions, even though our analysis pointed to five distinct
communities, we could only rank guilds from one to four. Thus for each of 18 guilds,
a site received a rank of 1-4.
7. To determine a preliminary BCI score for each site, we summed all ranks, divided by
18, and then divided by 4. The division steps normalize BCI scores on a theoretical
absolute scale from 0.25 – 1.00.
22
8. Next we clustered (Ward, Euclidean) sites by two variables: BCI score and rank of
BCI score over all 81 sites. The point of this step was to determine the number of
categories of ecological condition that occur in the study area, based on BCI.
9. With the number of clusters again serving as ANOVA factor levels, we tested for
differences in BCI scores among clusters. Strictly applied, there is circularity in
testing for BCI score differences when BCI scores were used to build the cluster.
Our intent, however, was to apply the ANOVA only to shed light on the cluster
results and determine the number of distinct categories of sites supporting similar
BCI scores. This step confirmed four categories of sites in the region in different
states of ecological condition.
10. To reduce the number of guilds to be included in the final model from 18 to 8-12, we
decided to select three structural, three compositional, and three functional guilds
that exhibited a strong dose response curve (Karr and Chu 1999) on a gradient of
percent forest in the local landscape.
11. To determine if the Bird Community Index relates to actual land cover at local
scales, we used regression and ANOVA to characterize the relationship.
23
Results and Discussion
Birds of the Piedmont/Coastal Plain. We documented 120 species at the 81 sample
sites during point counts in the 2001 breeding season. Species richness ranged from
10 to 49 (mean 27), mean Shannon-Weiner diversity was 17.41. Of the 120 total
species recorded, 30 were species not reliably sampled with our point count methods
(e.g, raptors, herons, shorebirds), and these were omitted from further analysis. The
remaining 90 passerines and allies occurred across a large gradient of abundance and
distribution. For example 12 species were recorded in abundances less than 0.1% of
the total number of individuals sampled. In contrast, nearly 15% (1954) of all individuals
detected were European Starling (Sturnus vulgaris). The top five most abundant
species, amounting to nearly 35% of all 13,204 individuals detected were starling,
Common Grackle, American Crow, Barn Swallow, and Northern Cardinal.
Regarding distribution of 90 breeding songbirds and near passerines, eight species
were detected at a single site, while we recorded American Crow at 84% of sample
sites. Seven species (American Crow, Northern Cardinal, Carolina Wren, Mourning
Dove, Brown-headed Cowbird, Red-eyed Vireo, Tufted Titmouse, and Downy
Woodpecker) occurred at 66% (at least 53) of the 81 sites. Despite the great abundance
of European Starling in the study area, this species was limited in distribution to just 32
(40%) of sample sites.
24
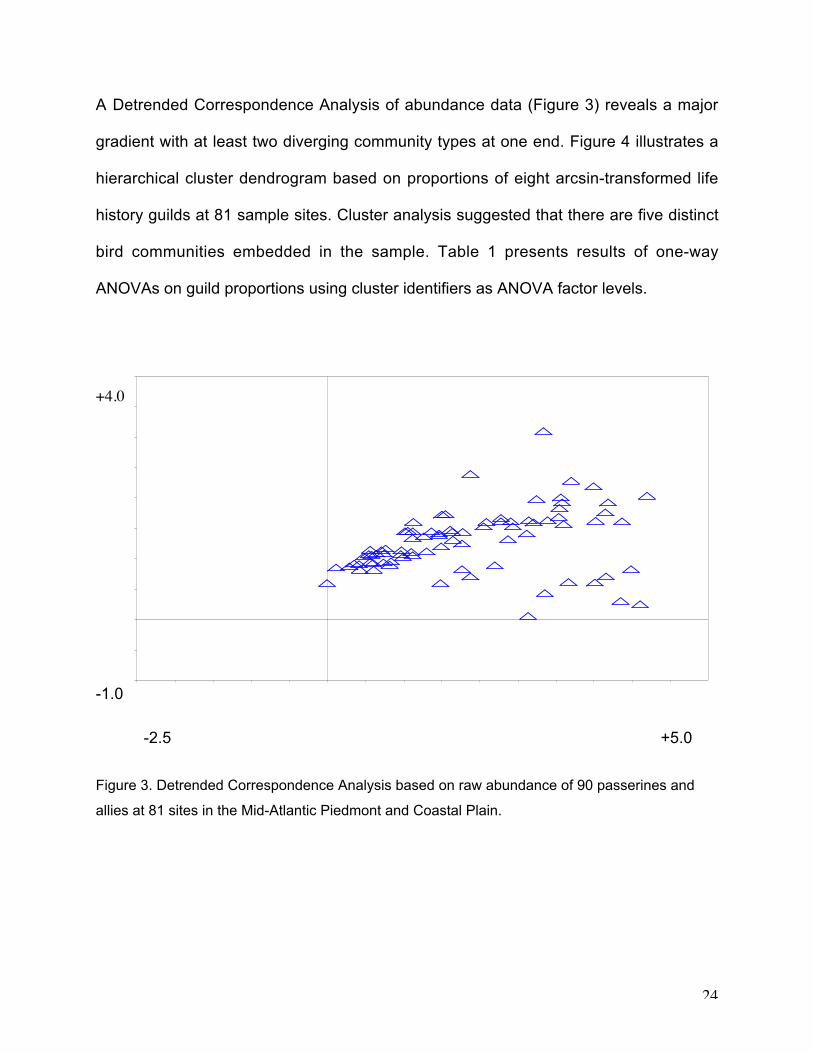
A Detrended Correspondence Analysis of abundance data (Figure 3) reveals a major
gradient with at least two diverging community types at one end. Figure 4 illustrates a
hierarchical cluster dendrogram based on proportions of eight arcsin-transformed life
history guilds at 81 sample sites. Cluster analysis suggested that there are five distinct
bird communities embedded in the sample. Table 1 presents results of one-way
ANOVAs on guild proportions using cluster identifiers as ANOVA factor levels.
+4.0
-1.0
Figure 3. Detrended Correspondence Analysis based on raw abundance of 90 passerines and
allies at 81 sites in the Mid-Atlantic Piedmont and Coastal Plain.
-2.5 +5.0

25
Figure 4. Hierarchical cluster (Ward’s linkage, Euclidean distance) of 81 sites by proportions of
eight life history guilds. Five clusters are indicated.
-408.74
-239.16
-69.58
100.00

26
Table 1. One-way ANOVA results (4,80 df) using cluster memberships from Figure 4 as factor
levels in the ANOVA model. Statistical differences (alpha = 0.05) among clusters were
determined using Tukey’s procedure for multiple comparisons. Letters indicate statistical
significance in mean guild proportions among groups.
Guild F P Cl. 1 Cl. 2 Cl. 3 Cl. 4 Cl. 5
Forest Generalist 18.90 <0.001 A AB BC CD D
Forest Edge 9.33 <0.001 AB BC C C A
Wetland/Riparian 0.34 0.853 6.6 6.4 7.1 7.9 6.6
Savanna/Oldfield 17.61 <0.001 A AB C C BC
Cavity Nester 15.36 <0.001 A B BC BC C
Shrub Nester 32.49 <0.001 A B C BC B
Tree Canopy nester 7.86 <0.001 A AB AB C BC
Resident 7.49 <0.001 A AB A BC C
Temperate Migrant 16.50 <0.001 A A B B A
Tropical Migrant 24.73 <0.001 A A A B B
Single Brooded 40.49 <0.001 A B B C C
Multi-Brooded 17.29 <0.001 A B BC C BC
PIF Priority 6.54 <0.001 A AB C BC ABC
Insectivore 41.21 <0.001 A B B C C
Bark Prober 45.25 <0.001 A B C D D
Ground Gleaner 29.52 <0.001 A B B C C
Upper Canopy Insectivore 18.74 <0.001 A AB BC CD D
Lower Canopy Insectivore 14.95 <0.001 A A B A C
Aerial Sallier 10.56 <0.001 A A A B B
Diversity 9.63 <0.001 A A A AB B
Richness 4.43 0.003 A AB B B A
27
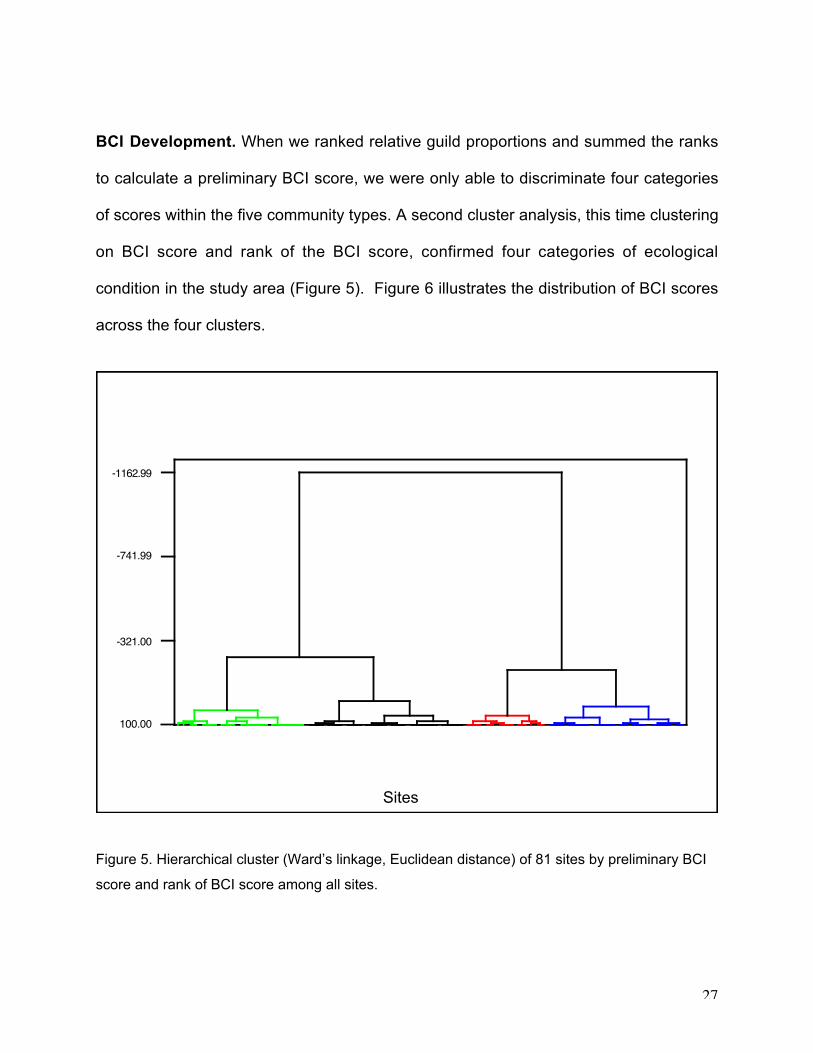
BCI Development. When we ranked relative guild proportions and summed the ranks
to calculate a preliminary BCI score, we were only able to discriminate four categories
of scores within the five community types. A second cluster analysis, this time clustering
on BCI score and rank of the BCI score, confirmed four categories of ecological
condition in the study area (Figure 5). Figure 6 illustrates the distribution of BCI scores
across the four clusters.
Figure 5. Hierarchical cluster (Ward’s linkage, Euclidean distance) of 81 sites by preliminary BCI
score and rank of BCI score among all sites.
100.00
-321.00
-741.99
-1162.99
Sites

28
Figure 6. Mean BCI score in four categories of ecological condition identified in the
cluster analysis illustrated in Figure 5. Values in each category are statistically distinct
(F3, 80 = 347.12, P < 0.001; Tukey C.I.s do not include zero) from adjacent categories.
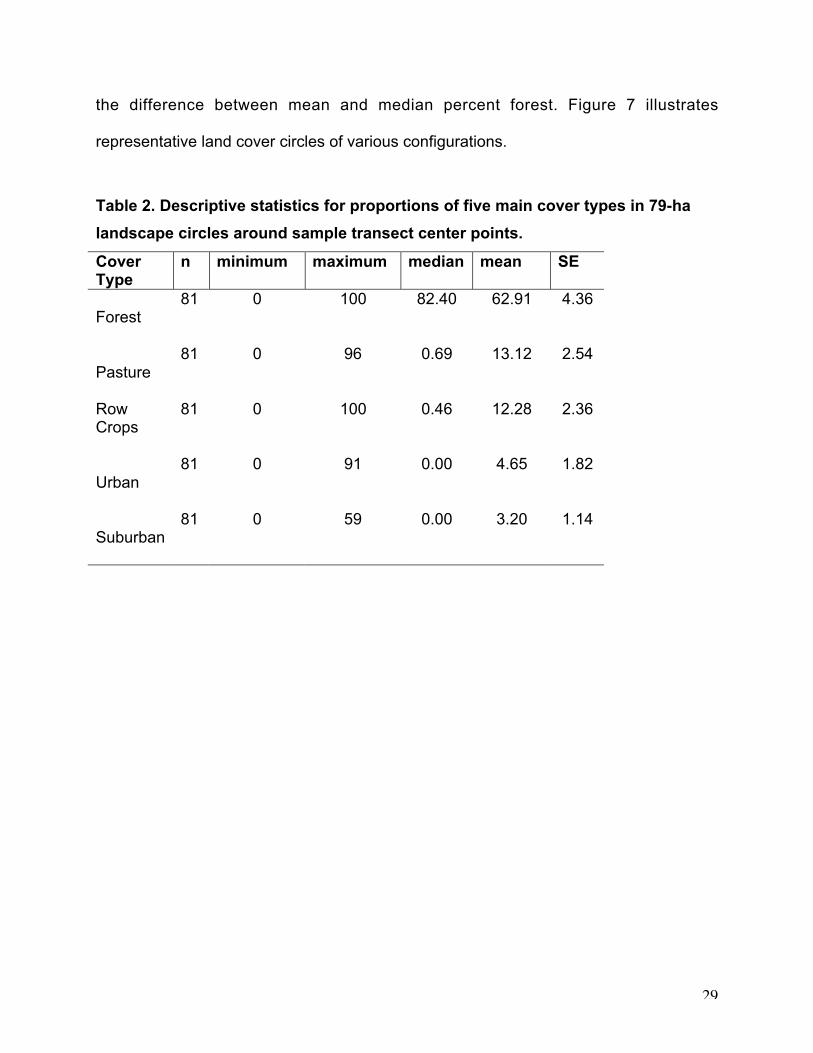
Land Cover Sampling. We sampled sites that ranged from 0 to at least 90% land cover
of forest, pasture, row crop, and urban types in the 79-ha circles around the transect
center points (Table 2). Thus, we sampled from a broad spectrum of ecological
condition in the region. The distributions, however, are highly skewed as evidenced by
1 2 3 4
0.3
0.4
0.5
0.6
0.7
0.8
0.9
Ecological Condition Category
29
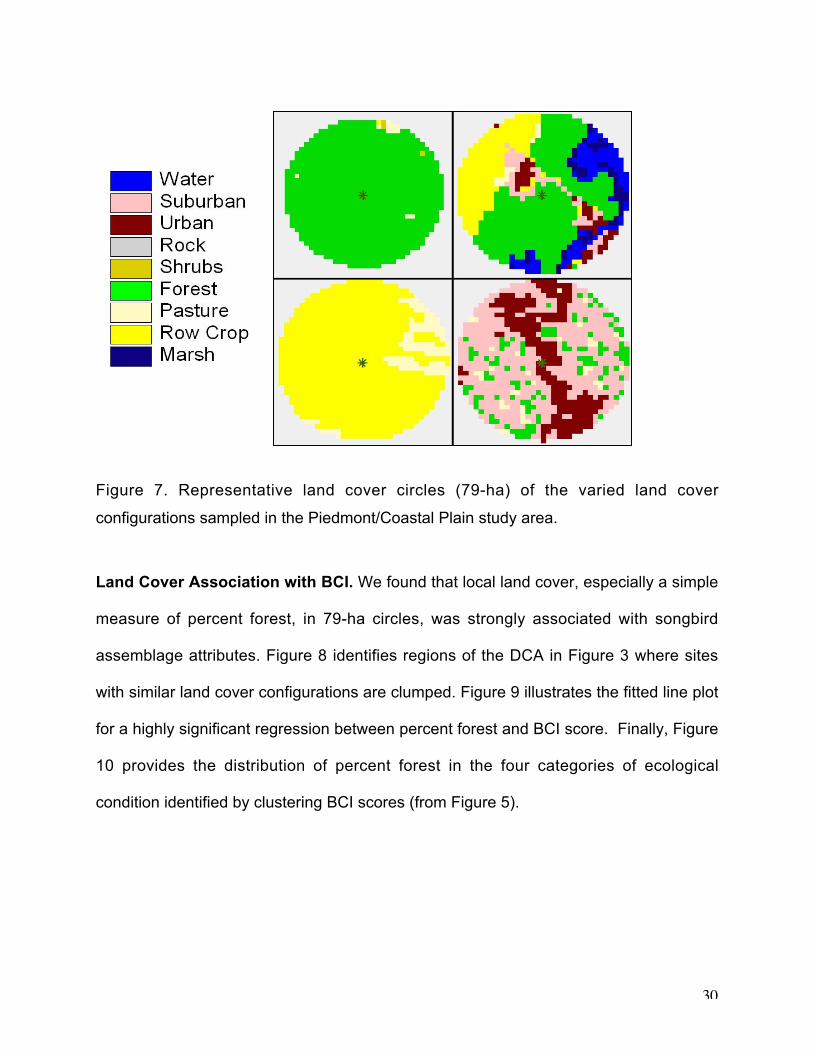
the difference between mean and median percent forest. Figure 7 illustrates
representative land cover circles of various configurations.
Table 2. Descriptive statistics for proportions of five main cover types in 79-ha
landscape circles around sample transect center points.
CoverType
n minimum maximum median mean SE
Forest81 0 100 82.40 62.91 4.36
Pasture81 0 96 0.69 13.12 2.54
RowCrops
81 0 100 0.46 12.28 2.36
Urban81 0 91 0.00 4.65 1.82
Suburban81 0 59 0.00 3.20 1.14
30
Figure 7. Representative land cover circles (79-ha) of the varied land cover
configurations sampled in the Piedmont/Coastal Plain study area.
Land Cover Association with BCI. We found that local land cover, especially a simple
measure of percent forest, in 79-ha circles, was strongly associated with songbird
assemblage attributes. Figure 8 identifies regions of the DCA in Figure 3 where sites
with similar land cover configurations are clumped. Figure 9 illustrates the fitted line plot
for a highly significant regression between percent forest and BCI score. Finally, Figure
10 provides the distribution of percent forest in the four categories of ecological
condition identified by clustering BCI scores (from Figure 5).

31
Figure 8. Regions of a DCA on raw species abundance where sites share common land
cover attributes. The dominant land cover type within each ellipse is indicated. Note that
sites where open pine savannas are managed with prescribed fire are grouped with
sites supporting large blocks of closed canopy, mature, broadleaf forest.
Forest
Pasture/Row Crops
Urban/Suburban
Pine

32
Figure 9. Fitted line regression of BCI score by percent forest (P< 0.001).
0 50 100
0.3
0.4
0.5
0.6
0.7
0.8
0.9
Y = 0.409972 + 3.16E-03XR-Squared = 0.715
Regression
95% PI
1 2
percent forest in 79-ha circle

33
Figure 10. Mean percent forest in four categories of ecological condition identified with
the BCI (F3, 80 = 88.57, P < 0.001; categories 1 and 2 not significantly different).
Piedmont/Coastal Plain BCI. To produce a final version of the Piedmont/Coastal Plain
BCI, we plotted proportions of 18 guilds in Table 1 against percent forest to describe a
dose/response curve. From this exercise, we selected nine guilds that represented the
strongest curves. Figures 11-13 illustrate the proportions of these guilds in four
1 2 3 4
0
50
100
Ecological Condition Category

34
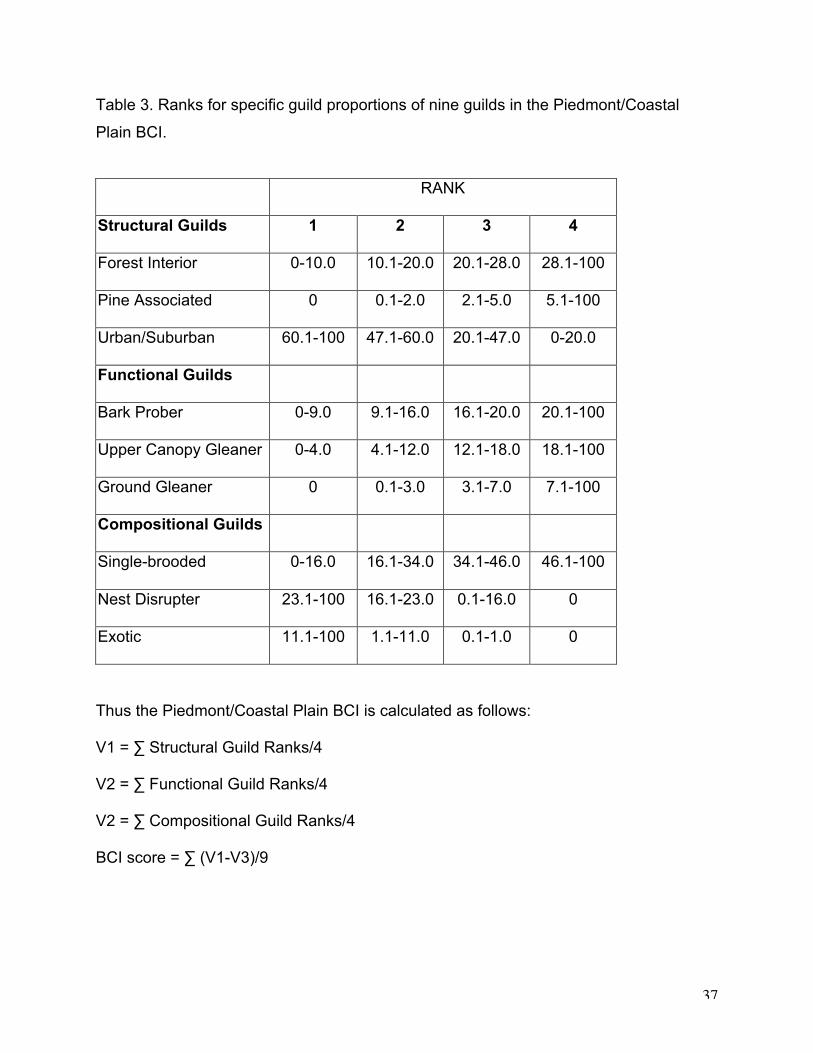
categories of ecological condition identified with the BCI. Table 3 lists the ranks for
specific guild proportions.
Figure 11. Proportions of three structural guilds among four categories of ecological
condition identified with the Bird Community Index.
0
10
20
30
40
50
60
70
80
1 2 3 4
Ecological Condition Category
Forest InteriorPine AssociatedUrban/Suburban

35
Figure 12. Proportions of three functional guilds among four categories of ecological
condition identified with the Bird Community Index.
0
5
10
15
20
25
1 2 3 4
Ecological Condition Category
Bark ProberUpper Canopy GleanerGround Gleaner

36
Figure 13. Proportions of three compositional guilds among four categories of ecological
condition identified with the Bird Community Index.
0
10
20
30
40
50
60
1 2 3 4
Ecological Condition Category
Single-broodedNest DisrupterExotic
37
Table 3. Ranks for specific guild proportions of nine guilds in the Piedmont/Coastal
Plain BCI.
RANK
Structural Guilds 1 2 3 4
Forest Interior 0-10.0 10.1-20.0 20.1-28.0 28.1-100
Pine Associated 0 0.1-2.0 2.1-5.0 5.1-100
Urban/Suburban 60.1-100 47.1-60.0 20.1-47.0 0-20.0
Functional Guilds
Bark Prober 0-9.0 9.1-16.0 16.1-20.0 20.1-100
Upper Canopy Gleaner 0-4.0 4.1-12.0 12.1-18.0 18.1-100
Ground Gleaner 0 0.1-3.0 3.1-7.0 7.1-100
Compositional Guilds
Single-brooded 0-16.0 16.1-34.0 34.1-46.0 46.1-100
Nest Disrupter 23.1-100 16.1-23.0 0.1-16.0 0
Exotic 11.1-100 1.1-11.0 0.1-1.0 0
Thus the Piedmont/Coastal Plain BCI is calculated as follows:
V1 = ∑ Structural Guild Ranks/4
V2 = ∑ Functional Guild Ranks/4
V2 = ∑ Compositional Guild Ranks/4
BCI score = ∑ (V1-V3)/9

38
We recommend the following thresholds of total BCI scores for interpretation of
ecological condition: humanistic (0.250-0.460), moderately disturbed (0.461-0.600),
largely intact (0.601-0.730), and naturalistic (0.731-1.00).
Discussion. With the development of a new BCI for the Piedmont/Coastal Plain study
area described herein, we now have a tool for assessing overall ecological condition
across upland environments from southern New England, south along the Atlantic
Coast, and inland to the Mississippi River floodplain. Together with the original
Appalachian BCI, we have assessment tools capable of summarizing biological
information at landscape scales across most of the eastern United States.
To produce an assessment of ecological condition for the Piedmont/Coastal Plain, the
BCI would need to be applied to spatially explicit data on bird communities from the
region. Those data could be derived from the Breeding Bird Survey, state breeding bird
atlases, or a new sample of sites collected from a probability sampling grid.
The Piedmont/Coastal Plain BCI points to forest cover in the local landscape as crucial
to maintenance of ecological integrity. We recognize that many rare or unusual habitat
types of high conservation value are not forested, and may not score as high as
expected with the BCI. Bird Community Indices are developed and intended for use
across entire reporting regions, i.e., the proportion of sites in a region that fall into
39
different categories of condition defines the utility of the BCI. The BCI is not intended to
be used as a site specific, local scale tool for prioritizing conservation.
Literature cited
Anderson, J. R., E. E. Hardy, J. T. Roach, and R. E. Witmer. 1976. A land use and land
cover classification system for use with remote sensor data. U. S. Geological Survey
Professional Paper 964.
Askins, R. A. and M. J. Philbrick. 1987. Effects of changes in regional forest abundance
on the decline and recovery of a forest bird community. Wilson Bulletin 99: 7-21.
Baichich, P. J. and C. J.O. Harrison. 1997. A Guide to the Nests, Eggs, and Nestlings of
North American Birds, Second Edition. Academic Press. San Diego, CA.
Blake, J. G. 1983. Trophic structure of bird communities in forest patches in east-central
Illinois, Wilson Bulletin 95: 416-430.
Brauning, D. W. (ed.) 1992. Atlas of breeding birds in Pennsylvania. University of
Pittsburgh Press, Pittsburgh, PA.
Brooks, R. P. and M. J. Croonquist. 1990. Wetland, habitat, and trophic response guilds
for wildlife species in Pennsylvania. Journal of the Pennsylvania Academy of
Science 64: 93-102.
Byers, C., J. Curson, and U. Olsson. 1995. Sparrows and Buntings: A guide to the
Sparrows and Buntings of North America and the World. Houghton Mifflin
Company. New York, NY.
Chadwick, A. C. 2003. Wildlife Species Biological Data and Habitat Requirements. In:
U.S. Department of Agriculture, Forest Service, Rocky Mountain Research
Station, Fire Sciences Laboratory, Fire Effects Information System, [Online].
Available at: http://www.fs.fed.us/database/feis/animals/bird/. Verified 6 March
2003.
40
Cody, M. L. 1981. Habitat selection in birds: The roles of vegetation structure,
competitors, and productivity. BioScience 31: 107-113.
Curson, J., D. Quinn and D. Beadle. 1994. Warblers of the Americas, An Identification
Guide. Houghton Mifflin Company. New York, NY.
DeGraaf, R. M., N. G. Tilghman, and S. H. Anderson. 1985. Foraging guilds of North
American birds. Environmental Management 9: 493-536.
Ehrlich, P. R., D. S. Dobkin, and D. Wheye. 1988. The Birder’s Handbook. Simon and
Schuster. New York, NY.
Fore, L. S., J. R. Karr, and R. W. Wisseman. 1996. Assessing invertebrate responses to
human activities: evaluating alternative approaches. Journal of the North American
Benthological Society 15: 212-231.
Freemark, K. and B. Collins. 1992. Landscape ecology of birds breeding in temperate
forest fragments. Pages 443-454 in J. M. Hagan III and D. W. Johnston, editors.
Ecology and conservation of neotropical migrant landbirds. Smithsonian
Institution Press, Washington, D.C.
Gough, G.A., Sauer, J.R., Iliff, M. Patuxent Bird Identification Infocenter. 1998. Version
97.1. Patuxent Wildlife Research Center, Laurel, MD. [Online]. Available at:
http://www.mbr-pwrc.usgs.gov/Infocenter/infocenter.html. Verified 6 March 2003.
Harrison, H. H. 1975. A field guide to the birds’ nests: United States east of the
Mississippi River. Houghton Mifflin Co., Boston, MA.
Hutto, R. L., S. M. Pletschet, and P. Hendricks. 1986. A fixed-radius point count
method for nonbreeding and breeding season use. Auk 103: 593-602.
Jones, K. B., K. H. Riitters, J. D. Wickham, R. D. Tankersley, Jr., R. V. O’Neill, D. J.
Chaloud, E. R. Smith, and A. C. Neale. 1997. An ecological assessment of the
United States Mid-Atlantic region: A landscape atlas. EPA 600-R97-130. U. S.
Environmental Protection Agency, Office of Research and Development,
Washington, DC.

41
Karr, J. R. 1991. Biological integrity: a long-neglected aspect of water resource
management. Ecological Applications 1: 66-84.
Karr, J. R. 1993. Defining and assessing ecological integrity: beyond water quality.
Environmental Toxicology and Chemistry 12: 1521-1531.
Karr, J. R. and E. W. Chu. 1999. Restoring life in running waters: Better biological
monitoring. Island Press, Washington, DC.
Loveland, T.R., and D.M. Shaw. 1996. Multiresolution land characterization: Building
collaborative partnerships. Pages 79-85 in J.M. Scott, T.H. Tear, and F.W. Davis,
editors. Gap Analysis: A Landscape Approach to Biodiversity Planning. American
Society for Photogrammetry and Remote Sensing, Bethesda, Maryland.
Manuwal, D. A. and A. B. Carey. 1991. Methods for measuring populations of small,
diurnal forest birds. Gen. Tech. Rep. PNW-GTR-278. U. S. Department of
Agriculture, Forest Service, Pacific Northwest Research Station, Portland, OR.
Minitab, Inc. 1995. Minitab reference manual: Release 10Xtra. Minitab, Inc., State
College, PA.
Murray, N. L. and D. F. Stauffer. 1995. Nongame bird use of habitat in central
Appalachian riparian forests. Journal of Wildlife Management 59: 78-88.
Neter, J., W. Wasserman, and M. H. Kutner. 1990. Applied linear statistical models.
Richard D. Irwin, Inc., Homewood, IL.
Noss, R. F. 1990. Indicators for monitoring biodiversity: A heirarchical approach.
Conservation Biology 4: 355-364.
O’Connell, T. J. 1999. Bird communities in the Mid-Atlantic Highlands: Relationships to
landscapes and implications for conservation. Ph.D. Dissertation. The
Pennsylvania State University, University Park, PA. 157 pp.
O’Connell, T. J., J. A. Bishop, and R. P. Brooks. 2002. The North American Breeding
Bird Survey as Source Data for Assessments of Ecological Condition with the
Bird Community Index. Final Report to the USGS – Patuxent Wildlife Research
Center. Report No. 2002-03, Penn State Cooperative Wetlands Center,
University Park, PA. 43 pp.
42
O’Connell, T. J., L. E. Jackson, and R. P. Brooks. 1998. A bird community index of
biotic integrity for the Mid-Atlantic Highlands. Environmental Monitoring and
Assessment 51: 145-156.
O’Connell, T. J., L. E. Jackson, and R. P. Brooks. 2000. Bird guilds as indicators of
ecological condition in the central Appalachians. Ecological Applications 10:
1706-1721.
Pettersson, R. P., J. P. Ball, K. Renhorn, P. Esseen, and K. Sjoberg. 1995. Invertebrate
communities in boreal forest canopies as influenced by forestry and lichens with
implications for passerine birds. Biological Conservation 74: 57-63.
Ralph, C. J., G. R. Geupel, P. Pyle, T. E. Martin, and D. F. DeSante. 1993. Handbook of
field methods for monitoring landbirds. Gen. Tech. Rep. PSW-GTR-144. Pacific
Southwest Research Station, Forest Service, U. S. Department of Agriculture,
Albany, CA.
Ricketts, T. H., E. Dinerstein, D. M. Olson, C. L. Loucks, et al. 1999. Terrestrial
Ecoregions of North America: A conservation Assessment. Island Press,
Washington, DC. 485pp.
Rising, J. D. 1996. A Guide to the Identification and Natural History of The Sparrows of
the United States and Canada. Academic Press, San Diego, California.
Roberts, T. H. 1987. Construction of guilds for habitat assessment. Environmental
Management 11: 473-477.
Rodewald, P. G. and R. D. James. 1996. Yellow-throated Vireo (Vireo flavifrons). In The
Birds of North America, No., 247 (A. Poole and F. Gill, eds.). The Academy of
Natural Sciences, Philadelphia, PA, and The American Ornithologists’ Union,
Washington, DC.
Sample, B. E., R. J. Cooper, and R. C. Whitmore. 1993. Dietary shifts among songbirds
from a diflubenzuron-treated forest. The Condor 95: 616-624.
Schmiegelow, F. K. A., C. S. Machtans, and S. J. Hannon. 1997. Are boreal birds
resilient to forest fragmentation? An experimental study of short-term community
responses. Ecology 78: 1914-1932.

43
Szaro, R. 1986. Guild management: An evaluation of avian guilds as a predictive tool.
Environmental Management 10: 681-688.
Verner, J. 1984. The guild concept applied to management of bird populations.
Environmental Management 8: 1-14.
Wilson, C. W., R. E. Masters, and G. A. Bukenhofer. 1995. Breeding bird response to
pine-grassland community restoration for red-cockaded woodpeckers. Journal of
Wildlife Management 59: 56-67.
44
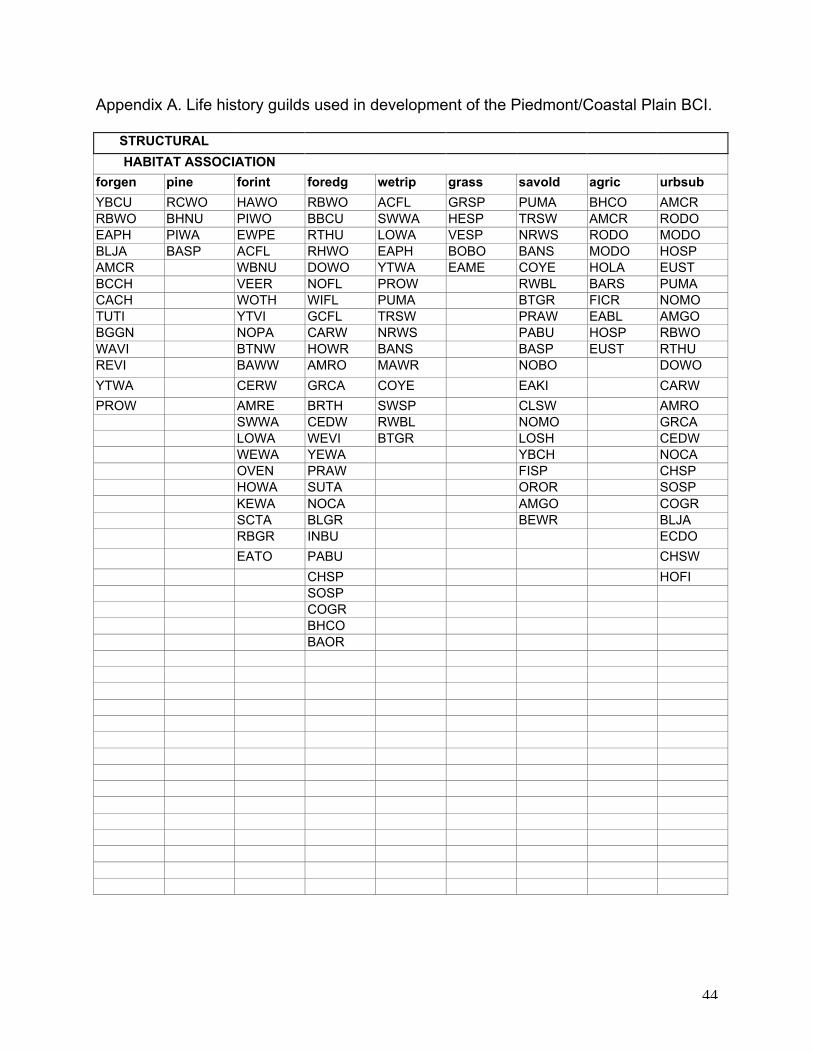
Appendix A. Life history guilds used in development of the Piedmont/Coastal Plain BCI.
STRUCTURAL
HABITAT ASSOCIATION
forgen pine forint foredg wetrip grass savold agric urbsub
YBCU RCWO HAWO RBWO ACFL GRSP PUMA BHCO AMCRRBWO BHNU PIWO BBCU SWWA HESP TRSW AMCR RODOEAPH PIWA EWPE RTHU LOWA VESP NRWS RODO MODOBLJA BASP ACFL RHWO EAPH BOBO BANS MODO HOSPAMCR WBNU DOWO YTWA EAME COYE HOLA EUSTBCCH VEER NOFL PROW RWBL BARS PUMACACH WOTH WIFL PUMA BTGR FICR NOMOTUTI YTVI GCFL TRSW PRAW EABL AMGOBGGN NOPA CARW NRWS PABU HOSP RBWOWAVI BTNW HOWR BANS BASP EUST RTHUREVI BAWW AMRO MAWR NOBO DOWO
YTWA CERW GRCA COYE EAKI CARW
PROW AMRE BRTH SWSP CLSW AMROSWWA CEDW RWBL NOMO GRCALOWA WEVI BTGR LOSH CEDWWEWA YEWA YBCH NOCAOVEN PRAW FISP CHSPHOWA SUTA OROR SOSPKEWA NOCA AMGO COGRSCTA BLGR BEWR BLJARBGR INBU ECDO
EATO PABU CHSW
CHSP HOFISOSPCOGRBHCOBAOR

45
NEST LOCATIONforgro opegro graree cavity shbnes trenes shelfnSWWA BASP RWBL HOSP NOMO CEDW ECDOLOWA HOLA FISP EUST AMGO BLJA AMROVEER NOBO MAWR PUMA GRCA ECDO HOSPWOTH GRSP SWSP RBWO CEDW PRAW HOFIBAWW HESP DOWO NOCA EAKI EUSTWEWA VESP CARW CHSP YEWA PUMAOVEN BOBO EABL SOSP BLGR EABLKEWA EAME TRSW BLJA YTVI TRSWEATO PROW ECDO AMRE RODO
RHWO HOFI WOTH CHSWNOFL COYE AMCR BARSGCFL BTGR MODO NRWSHOWR PRAW RTHU BANSHAWO PABU AMRO CLSWPIWO EAKI COGR EAPHWBNU LOSH FICRRCWO YBCH ACFLBHNU OROR YTWABCCH BBCU SUTACACH WIFL BAORTUTI BRTH EWPEBEWR WEVI NOPA
YEWA BTNWBLGR CERWINBU SCTAYTVI RBGRAMRE PIWAHOWA BGGNYBCU WAVIREVI

46
COMPOSITIONAL
MIGRATORY NUMBER BROODS LIMITING
resid tempmg tropmi single multi prepar
ECDO TRSW PUMA PUMA BARS HOLA LOSH
AMRO EAPH CHSW CHSW BANS RWBL HOSPHOSP GRCA BARS NRWS CLSW FISP EUSTHOFI COYE NRWS PRAW BLGR SWSP BLJAEUST BRTH BANS EAKI RTHU NOBO AMCREABL MAWR CLSW YEWA RBGR GRSP BTGRRODO HESP PRAW YTVI BGGN EAME RBWOCEDW VESP EAKI AMRE WAVI EATO RHWOBLJA BEWR YEWA WOTH PABU BHCO COGRAMCR BLGR ACFL YBCH BEWR FICRMODO YTVI YTWA WEVICOGR AMRE SUTA INBU ORIGIN
FICR WOTH BAOR HOWA exotic
PIWA RTHU EWPE PROW HOSPNOMO ACFL NOPA EAPH EUSTAMGO YTWA BTNW GRCA ECDONOCA SUTA CERW COYE HOFICHSP BAOR SCTA MAWR RODOSOSP EWPE OROR HESPBTGR NOPA BBCU VESPLOSH BTNW WIFL ECDORBWO CERW YBCU AMRO CONSERVATION PRIORITY
DOWO SCTA REVI HOSP confor conopn
CARW RBGR GCFL HOFI CERW PRAWRHWO BGGN BOBO EUST WOTH FISPNOFL WAVI SWWA EABL LOWA NOBOHOWR PABU LOWA RODO KEWA BEWRHAWO YBCH VEER CEDW WEWA PABUPIWO OROR BAWW BLJA SWWA ORORWBNU BBCU WEWA AMCR PROW HESPRCWO WIFL OVEN MODO ACFL GRSPBHNU WEVI KEWA PIWA BTNW RCWOBCCH INBU TRSW NOMO HOWA BASPCACH HOWA BRTH AMGO NOPA BHNUTUTI YBCU COGR NOCABASP REVI FICR CHSPHOLA PROW NOFL SOSPRWBL GCFL HAWO BTGRFISP BOBO PIWO LOSHSWSP SWWA WBNU RBWONOBO LOWA RCWO DOWOGRSP VEER BHNU CARWEAME BAWW BCCH RHWOEATO WEWA CACH HOWR
47
BHCO OVEN TUTIKEWA BASP
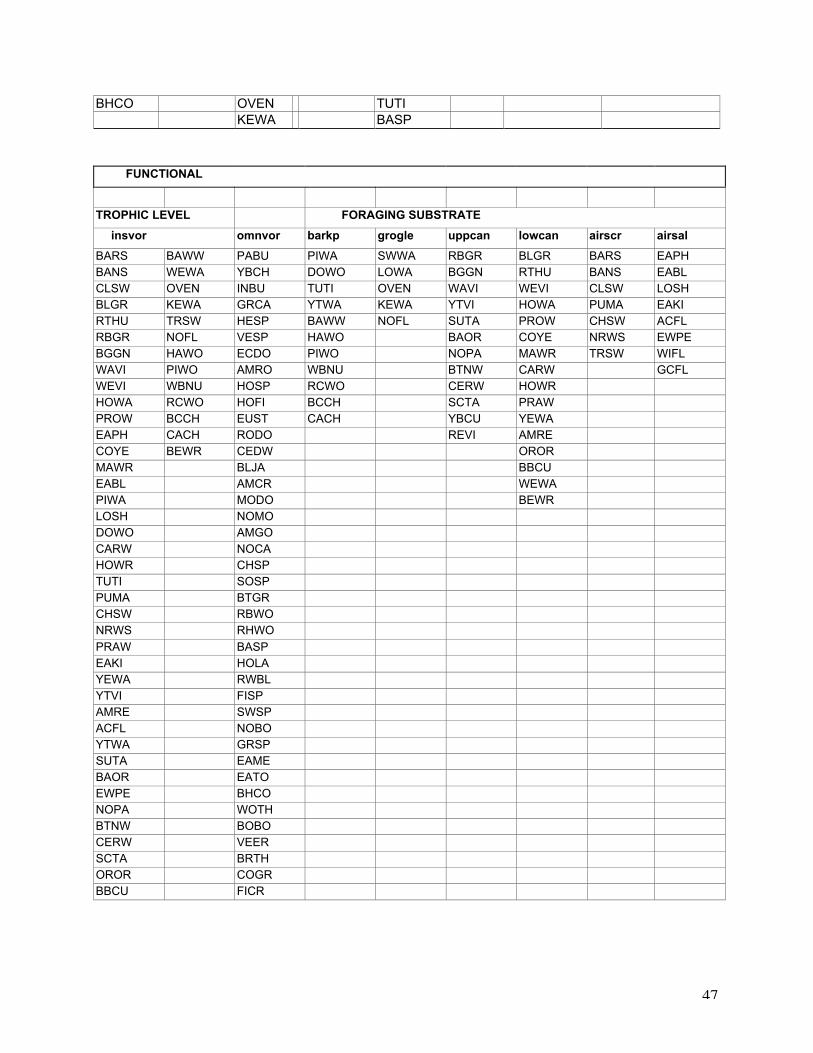
FUNCTIONAL
TROPHIC LEVEL FORAGING SUBSTRATE
insvor omnvor barkp grogle uppcan lowcan airscr airsal
BARS BAWW PABU PIWA SWWA RBGR BLGR BARS EAPHBANS WEWA YBCH DOWO LOWA BGGN RTHU BANS EABLCLSW OVEN INBU TUTI OVEN WAVI WEVI CLSW LOSHBLGR KEWA GRCA YTWA KEWA YTVI HOWA PUMA EAKIRTHU TRSW HESP BAWW NOFL SUTA PROW CHSW ACFLRBGR NOFL VESP HAWO BAOR COYE NRWS EWPEBGGN HAWO ECDO PIWO NOPA MAWR TRSW WIFLWAVI PIWO AMRO WBNU BTNW CARW GCFLWEVI WBNU HOSP RCWO CERW HOWRHOWA RCWO HOFI BCCH SCTA PRAWPROW BCCH EUST CACH YBCU YEWAEAPH CACH RODO REVI AMRECOYE BEWR CEDW ORORMAWR BLJA BBCUEABL AMCR WEWAPIWA MODO BEWRLOSH NOMODOWO AMGOCARW NOCAHOWR CHSPTUTI SOSPPUMA BTGRCHSW RBWONRWS RHWO
PRAW BASPEAKI HOLAYEWA RWBLYTVI FISPAMRE SWSPACFL NOBOYTWA GRSPSUTA EAMEBAOR EATOEWPE BHCONOPA WOTHBTNW BOBOCERW VEERSCTA BRTHOROR COGRBBCU FICR

48
WIFL BHNUYBCUREVIGCFLSWWALOWA
Structural Guilds
Forgen (generalist): occurs in forests, but not area sensitive
Pine (specialist): occurs only in pines
Forint (specialist): interior forest obligate
Foredge (generalist): uses forest edges and shrubby habitats
Wetrip (specialist): wetland and/or riparian species
Grass (specialist): occurs only in grassy fields
Savold (specialist): occurs in early-mid successional fields
Agric (generalist): abundant in farmland
Urbsub (generalist): occurs in human dominated habitats
Forgro (specialist): nests on ground in forests
Opegro (specialist): nests on ground in open fields
Graree (specialist): nests above ground in tall grass or reeds
Cavity (specialist): nests in cavities
Shbnes (generalist): nests in shrubs
Trenes (specialists): nests in high tree canopies
Shelfn (generalist): nests on human structures

49
Compositional
Resid (generalist): non-migratory in the study region
Tempmig (generalist ): leaves breeding ground in autumn, but winters north of 30º
Tropmig (specialist): winters south of 30º
Single (specialist): typically raises one brood/breeding season
Multi (generalist): routinely raises two broods/season
Prepar (generalist): nest predators and brood parasites.
Confor (specialist): Partners in Flight forest priority for the Southeast
Conopn (specialist): Partners in Flight open priority for the Southeast
Exotic (generalist): non-native to the study region
Functional
Insvor (specialist): obligate insectivore
Omnvor (generalist): will take animal or plant material during the breeding season
Barkp (specialist): bark probing insectivore
Grogle (specialist): gleans invertebrates from the ground
Uppcan (specialist): forages for insects in tall canopy trees
Lowcan (specialist): forages for insects generally below 5m
Airscre (specialist): aerial insectivore
Airsal (specialist): flycatches
50
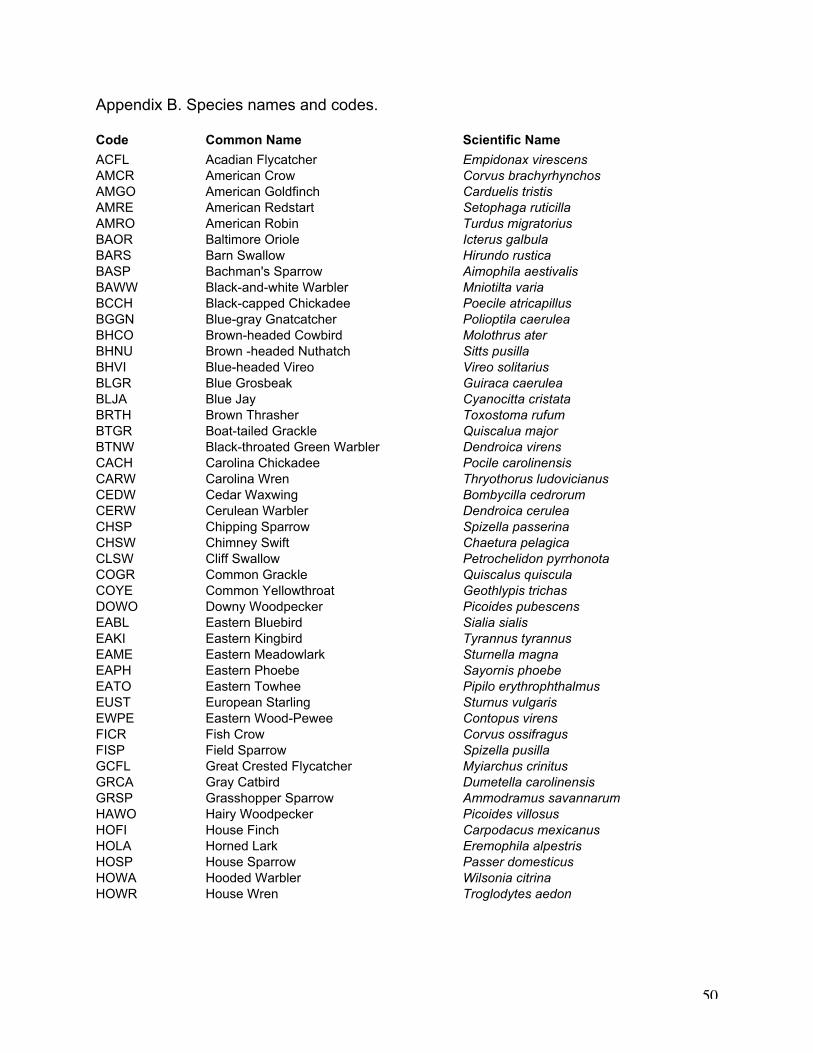
Appendix B. Species names and codes.
Code Common Name Scientific Name
ACFL Acadian Flycatcher Empidonax virescensAMCR American Crow Corvus brachyrhynchosAMGO American Goldfinch Carduelis tristisAMRE American Redstart Setophaga ruticillaAMRO American Robin Turdus migratoriusBAOR Baltimore Oriole Icterus galbulaBARS Barn Swallow Hirundo rusticaBASP Bachman's Sparrow Aimophila aestivalisBAWW Black-and-white Warbler Mniotilta variaBCCH Black-capped Chickadee Poecile atricapillusBGGN Blue-gray Gnatcatcher Polioptila caeruleaBHCO Brown-headed Cowbird Molothrus aterBHNU Brown -headed Nuthatch Sitts pusillaBHVI Blue-headed Vireo Vireo solitariusBLGR Blue Grosbeak Guiraca caeruleaBLJA Blue Jay Cyanocitta cristataBRTH Brown Thrasher Toxostoma rufumBTGR Boat-tailed Grackle Quiscalua majorBTNW Black-throated Green Warbler Dendroica virensCACH Carolina Chickadee Pocile carolinensisCARW Carolina Wren Thryothorus ludovicianusCEDW Cedar Waxwing Bombycilla cedrorumCERW Cerulean Warbler Dendroica ceruleaCHSP Chipping Sparrow Spizella passerinaCHSW Chimney Swift Chaetura pelagicaCLSW Cliff Swallow Petrochelidon pyrrhonotaCOGR Common Grackle Quiscalus quisculaCOYE Common Yellowthroat Geothlypis trichasDOWO Downy Woodpecker Picoides pubescensEABL Eastern Bluebird Sialia sialisEAKI Eastern Kingbird Tyrannus tyrannusEAME Eastern Meadowlark Sturnella magnaEAPH Eastern Phoebe Sayornis phoebeEATO Eastern Towhee Pipilo erythrophthalmusEUST European Starling Sturnus vulgarisEWPE Eastern Wood-Pewee Contopus virensFICR Fish Crow Corvus ossifragusFISP Field Sparrow Spizella pusillaGCFL Great Crested Flycatcher Myiarchus crinitusGRCA Gray Catbird Dumetella carolinensisGRSP Grasshopper Sparrow Ammodramus savannarumHAWO Hairy Woodpecker Picoides villosusHOFI House Finch Carpodacus mexicanusHOLA Horned Lark Eremophila alpestrisHOSP House Sparrow Passer domesticusHOWA Hooded Warbler Wilsonia citrinaHOWR House Wren Troglodytes aedon

51
INBU Indigo Bunting Passerina cyaneaKEWA Kentucky Warbler Oporornis formosusLOSH Loggerhead Shrike Lanius ludovicianusCode Common Name Scientific Name
LOWA Louisiana Waterthrush Seiurus motacillaMODO Mourning Dove Zenaida macrouraNOBO Northern Bobwhite Colinus virginianusNOCA Northern Cardinal Cardinalis cardinalisNOFL Northern Flicker Colaptes auratusNOMO Northern Mockingbird Mimus polyglottosNOPA Northern Parula Parula americanaNRWS Northern Rough-winged Swallow Stelgidopteryx serripennisOROR Orchard Oriole Icterus spuriusOVEN Ovenbird Seiurus aurocapillusPIWA Pine Warbler Dendroica pinusPIWO Pileated Woodpecker Dryocopus pileatusPRAW Prairie Warbler Dendroica discolorPROW Prothonotary Warbler Protonaria citreaPUMA Purple Martin Progne subisRBWO Red-bellied Woodpecker Melanerpes carolinusRCWO Red-cockaded Woodpecker Picoides borealisREVI Red-eyed Vireo Vireo olivaceusRHWO Red-headed Woodpecker Melanerpes erythrocephalusRODO Rock Dove Columba liviaRTHU Ruby-throated Hummingbird Archilocus colubrisRWBL Red-winged Blackbird Agelaius phoeniceusSCTA Scarlet Tanager Piranga olivaceaSOSP Song Sparrow Melospiza melodiaSUTA Summer Tanager Piranga rubraSWWA Swainson's Warbler Limnothlypis swainsoniiTRSW Tree Swallow Tachycineta bicolorTUTI Tufted Titmouse Baeolophus bicolorVEER Veery Catharus fuscenscensVESP Vesper Sparrow Pooecetes gramineusWAVI Warbling Vireo Vireo gilvusWBNU White-breasted Nuthatch Sitta carolinensisWEVI White-eyed vireo Vireo griseusWEWA Worm-eating Warbler Helmitheros vermivorusWOTH Wood Thrush Hylocichla mustelinaYBCH Yellow-breasted Chat Icteria virensYBCU Yellow-billed Cuckoo Coccyzus americanusYEWA Yellow Warbler Dendroica petechiaYTVI Yellow-throated Vireo Vireo flavifronsYTWA Yellow-throated Warbler Dendroica dominica

52