A Biomechanical Analysis of Sprinters vs. Distance Runners ...
71
Brigham Young University Brigham Young University BYU ScholarsArchive BYU ScholarsArchive Theses and Dissertations 2004-12-02 A Biomechanical Analysis of Sprinters vs. Distance Runners at A Biomechanical Analysis of Sprinters vs. Distance Runners at Equal and Maximal Speeds Equal and Maximal Speeds Tyler D. Bushnell Brigham Young University - Provo Follow this and additional works at: https://scholarsarchive.byu.edu/etd Part of the Exercise Science Commons BYU ScholarsArchive Citation BYU ScholarsArchive Citation Bushnell, Tyler D., "A Biomechanical Analysis of Sprinters vs. Distance Runners at Equal and Maximal Speeds" (2004). Theses and Dissertations. 217. https://scholarsarchive.byu.edu/etd/217 This Thesis is brought to you for free and open access by BYU ScholarsArchive. It has been accepted for inclusion in Theses and Dissertations by an authorized administrator of BYU ScholarsArchive. For more information, please contact [email protected], [email protected].
Transcript of A Biomechanical Analysis of Sprinters vs. Distance Runners ...
Brigham Young University Brigham Young University
BYU ScholarsArchive BYU ScholarsArchive
Theses and Dissertations
2004-12-02
A Biomechanical Analysis of Sprinters vs. Distance Runners at A Biomechanical Analysis of Sprinters vs. Distance Runners at
Equal and Maximal Speeds Equal and Maximal Speeds
Tyler D. Bushnell Brigham Young University - Provo
Follow this and additional works at: https://scholarsarchive.byu.edu/etd
Part of the Exercise Science Commons
BYU ScholarsArchive Citation BYU ScholarsArchive Citation Bushnell, Tyler D., "A Biomechanical Analysis of Sprinters vs. Distance Runners at Equal and Maximal Speeds" (2004). Theses and Dissertations. 217. https://scholarsarchive.byu.edu/etd/217
This Thesis is brought to you for free and open access by BYU ScholarsArchive. It has been accepted for inclusion in Theses and Dissertations by an authorized administrator of BYU ScholarsArchive. For more information, please contact [email protected], [email protected].
A BIOMECHANICAL ANALYSIS OF SPRINTERS VS. DISTANCE
RUNNERS AT EQUAL AND MAXIMAL SPEEDS
by
Tyler D. Bushnell
A thesis submitted to the faculty of
Brigham Young University
in partial fulfillment of the requirements for the degree of
Master of Science
Department of Exercise Sciences
Brigham Young University
December 2004
BRIGHAM YOUNG UNIVERSITY
GRADUATE COMMITTEE APPROVAL
of a thesis submitted by
Tyler D. Bushnell
This thesis has been read by each member of the following graduate committee and by a majority vote has been found to be satisfactory. _______________________ ________________________________ Date Iain Hunter, Chair _______________________ ________________________________ Date Ron Hager _______________________ ________________________________ Date Allen Parcell
BRIGHAM YOUNG UNIVERSITY
As chair of the candidate’s graduate committee, I have read the thesis of Tyler D. Bushnell in its final form and have found that (1) its format, citations, and bibliographical style are consistent and acceptable and fulfill university and department style requirements; (2) its illustrative materials including figures, tables, and charts are in place; and (3) the final manuscript is satisfactory to the graduate committee and is ready for submission to the university library. __________________ _________________________________________ Date Iain Hunter Chair, Graduate Committee Accepted for the Department ________________________________________ Ruel Barker Chair, Department of Exercise Sciences Accepted for the College ________________________________________ Gordon B. Lindsay
Associate Dean, College of Health and Human Performance
ABSTRACT
A BIOMECHANICAL ANALYSIS OF SPRINTERS VS. DISTANCE
RUNNERS AT EQUAL AND MAXIMAL SPEEDS
Tyler D. Bushnell
Department of Exercise Sciences
Master of Science
In the sport of track and field, sprinting and distance running represent two major
categories of athletes. Sprinting is associated with power and speed, whereas distance
running focuses on the economy of movement. With distance running there are elements
of sprint technique that overlap. With distance events, there comes a time near the end of
the race where economy gives way to speed. If the distance runners knew how to alter
their technique in a way to become more sprint-like, this process could possibly be more
successful. PURPOSE: This study compared the differences in technique between
sprinters and distance runners while running at equal and maximal speeds. METHODS:
Subjects for the study consisted of 10 Division I collegiate distance runners, 10 Division I
collegiate sprinters, and 10 healthy non-runners. The subjects performed two tests, with
each consisting of a 60 meter run completed on the track. Test 1 was run at a pace of
5.81 m/s (4:37 min/mile), while Test 2 was completed at maximal speed. Video footage
of each trial was collected at 180 Hz, monitoring hip, knee, thigh, and shank positions, as
well as stride length, and contact time. RESULTS: Significant differences (p < .05)
between the sprint and distance groups at maximal speed were found in the following
areas: speed, minimum hip angle, knee extension at toe-off, stride length, contact time,
and the position of the recovery knee at touchdown. Sprinters and distance runners
exhibited a significantly lower minimum knee angle than those in the control group.
Significant differences between the sprint and control group existed at the minimum hip
angle, speed, stride length, contact time, and the position of the recovery knee at
touchdown. Regarding the paced trial, the sprinters and distance runners showed
significant difference concerning the minimum hip angle, center of mass at touchdown,
and recovery knee at touchdown. Sprinters differed significantly from the control group
in contact time, the center of mass at touchdown and the position of the recovery knee at
touchdown. CONCLUSION: As distance runners attempt to sprint, the desired
adaptations do not necessarily occur. The development of economical distance form is a
fairly natural process that occurs with the miles of training. Sprinting, however, is a
separate, learned technique that often requires specific feedback. When attempting
maximal speed, distance runners may benefit by focusing on one characteristic of
technique. If knee extension at toe-off could be trained to become more sprint-like, the
other characteristics unique to sprinters may follow.
ACKNOWLEDGMENTS
Special thanks to Dr. Hunter for his expertise, time, and enthusiasm in the
development and completion of this thesis. I would also like to thank Mark Robison,
Edward Eyestone, Leonard Myles-Mills, and the BYU Men’s Track and Field team
for their assistance and willingness to be a part of this study. Additionally, I would
like to thank my Mom and brother Tanner for their continued interest and support
throughout the entire project. Finally, extra thanks to Sandy Alger and her uncanny
editing ability.
vii
Table of Contents
Page
List of Tables .......................................................................................................... viii List of Figures ............................................................................................................ix A Biomechanical Analysis of Sprinters vs. Distance Runners at Equal and Maximal Speeds
Abstract ...........................................................................................................3 Introduction.....................................................................................................5 Methods...........................................................................................................7 Results.............................................................................................................9 Discussion.....................................................................................................10 Conclusion ....................................................................................................16 References.....................................................................................................18
Appendix A Prospectus.............................................................................................25 Introduction...................................................................................................27 Review of Literature .....................................................................................32 Methods.........................................................................................................44 References.....................................................................................................46 Appendix B Additional Results ................................................................................49
viii
List of Tables
Table Page 1 Maximal Speed Trial Results................................................................................20
2 Pace Trial Results .................................................................................................21
ix
List of Figures
Figure Page 1 Picture Exhibiting Minimum Hip Angle ..............................................................22 2 Picture Exhibiting Minimum Knee Angle ............................................................23 3 Picture Exhibiting Knee Extension at Toe-off......................................................24
A Biomechanical Analysis of Sprinters vs. Distance Runners at
Equal and Maximal Speeds
Tyler D. Bushnell, MS, Exercise Sciences, Brigham Young University Iain Hunter, PhD, Exercise Sciences, Brigham Young University Ron Hager, PhD, Exercise Sciences, Brigham Young University Allen Parcell, PhD, Exercise Sciences, Brigham Young University Correspondence: Tyler D. Bushnell, 1933 Wooded Knolls Dr, Philomath, OR 97370, (541) 929-5032. Email: [email protected]

2
3
Abstract
In the sport of track and field, sprinting and distance running represent two major
categories of athletes. Sprinting is associated with power and speed, whereas distance
running focuses on the economy of movement. With distance running there are elements
of sprint technique that overlap. With distance events, there comes a time near the end of
the race where economy gives way to speed. If the distance runners knew how to alter
their technique in a way to become more sprint-like, this process could possibly be more
successful. PURPOSE: This study compared the differences in technique between
sprinters and distance runners while running at equal and maximal speeds. METHODS:
Subjects for the study consisted of 10 Division I collegiate distance runners, 10 Division I
collegiate sprinters, and 10 healthy non-runners. The subjects performed two tests, with
each consisting of a 60 meter run completed on the track. Test 1 was run at a pace of
5.81 m/s (4:37 min/mile), while Test 2 was completed at maximal speed. Video footage
of each trial was collected at 180 Hz, monitoring hip, knee, thigh, and shank positions, as
well as stride length, and contact time. RESULTS: Significant differences (p < .05)
between the sprint and distance groups at maximal speed were found in the following
areas: speed, minimum hip angle, knee extension at toe-off, stride length, contact time,
and the position of the recovery knee at touchdown. Sprinters and distance runners
exhibited a significantly lower minimum knee angle than those in the control group.
Significant differences between the sprint and control group existed at the minimum hip
angle, speed, stride length, contact time, and the position of the recovery knee at
touchdown. Regarding the paced trial, the sprinters and distance runners showed
4
significant difference concerning the minimum hip angle, center of mass at touchdown,
and recovery knee at touchdown. Sprinters differed significantly from the control group
in contact time, the center of mass at touchdown and the position of the recovery knee at
touchdown. CONCLUSION: As distance runners attempt to sprint, the desired
adaptations do not necessarily occur. The development of economical distance form is a
fairly natural process that occurs with the miles of training. Sprinting, however, is a
separate, learned technique that often requires specific feedback. When attempting
maximal speed, distance runners may benefit by focusing on one characteristic of
technique. If knee extension at toe-off could be trained to become more sprint-like, the
other characteristics unique to sprinters may follow.
5
Introduction
In the sport of track and field, two major categories of athletes are sprinters and
distance runners. As they compete in their respective events, there are many differences
between the two groups. Sprinting is not simply running fast, just as distance running is
not simply running long. There are distinct variations in technique and form that separate
the two styles of running.
Sprinting is associated primarily with power and speed, whereas distance running
is focused on efficiency and smoothness of movement. This major difference is easily
observed at a track meet or practice where both groups are competing. As the distance
team runs lap after lap, their ease of movement and smoothness of stride is apparent.
They appear collected and controlled in their actions, delaying the onset of fatigue with
their methods of minimizing the energy expenditure. The sprinters, on the other hand,
demonstrate high speed and explosive movement. They showcase their power with
quick, forceful motion as they speed down the track.
Distance runners represent efficiency in a way that is rarely seen in sports. Their
form is fluid and economical with little wasted motion. The foot-strike is often near the
heel in an effort to absorb impact, and the feet are lifted no higher than necessary to
complete each stride. Little vertical oscillation is found among distance runners, while
arm motion is primarily for proper counterbalance (Williams and Cavanagh, 1987).
Internally, it is even more dramatic with lungs, muscles, and a heart that are incredibly
adapted to handle long periods of stress (Brandon and Boileau, 1992).
6
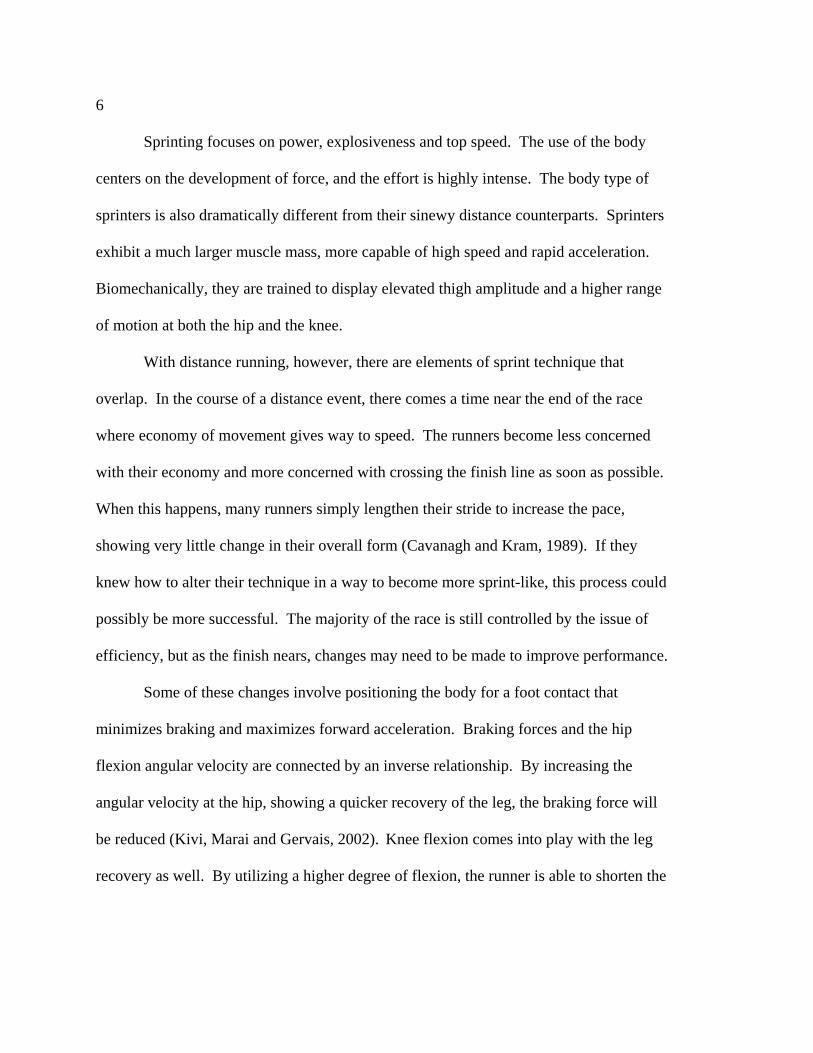
Sprinting focuses on power, explosiveness and top speed. The use of the body
centers on the development of force, and the effort is highly intense. The body type of
sprinters is also dramatically different from their sinewy distance counterparts. Sprinters
exhibit a much larger muscle mass, more capable of high speed and rapid acceleration.
Biomechanically, they are trained to display elevated thigh amplitude and a higher range
of motion at both the hip and the knee.
With distance running, however, there are elements of sprint technique that
overlap. In the course of a distance event, there comes a time near the end of the race
where economy of movement gives way to speed. The runners become less concerned
with their economy and more concerned with crossing the finish line as soon as possible.
When this happens, many runners simply lengthen their stride to increase the pace,
showing very little change in their overall form (Cavanagh and Kram, 1989). If they
knew how to alter their technique in a way to become more sprint-like, this process could
possibly be more successful. The majority of the race is still controlled by the issue of
efficiency, but as the finish nears, changes may need to be made to improve performance.
Some of these changes involve positioning the body for a foot contact that
minimizes braking and maximizes forward acceleration. Braking forces and the hip
flexion angular velocity are connected by an inverse relationship. By increasing the
angular velocity at the hip, showing a quicker recovery of the leg, the braking force will
be reduced (Kivi, Marai and Gervais, 2002). Knee flexion comes into play with the leg
recovery as well. By utilizing a higher degree of flexion, the runner is able to shorten the
7
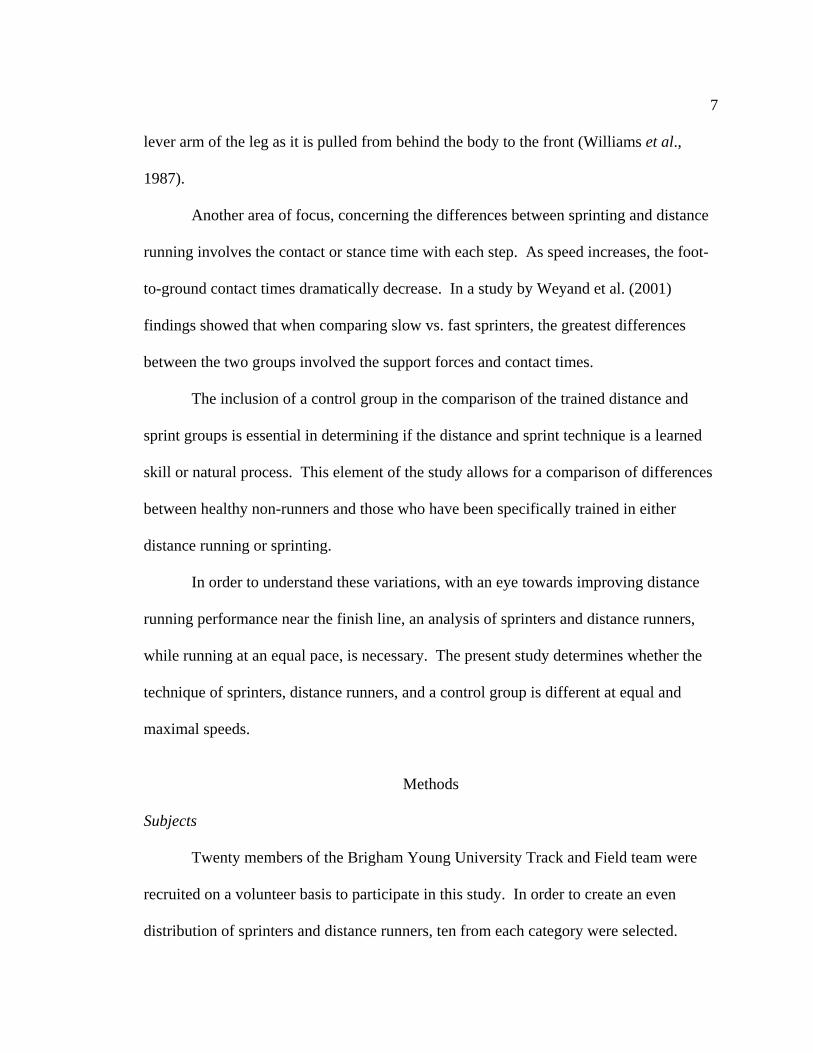
lever arm of the leg as it is pulled from behind the body to the front (Williams et al.,
1987).
Another area of focus, concerning the differences between sprinting and distance
running involves the contact or stance time with each step. As speed increases, the foot-
to-ground contact times dramatically decrease. In a study by Weyand et al. (2001)
findings showed that when comparing slow vs. fast sprinters, the greatest differences
between the two groups involved the support forces and contact times.
The inclusion of a control group in the comparison of the trained distance and
sprint groups is essential in determining if the distance and sprint technique is a learned
skill or natural process. This element of the study allows for a comparison of differences
between healthy non-runners and those who have been specifically trained in either
distance running or sprinting.
In order to understand these variations, with an eye towards improving distance
running performance near the finish line, an analysis of sprinters and distance runners,
while running at an equal pace, is necessary. The present study determines whether the
technique of sprinters, distance runners, and a control group is different at equal and
maximal speeds.
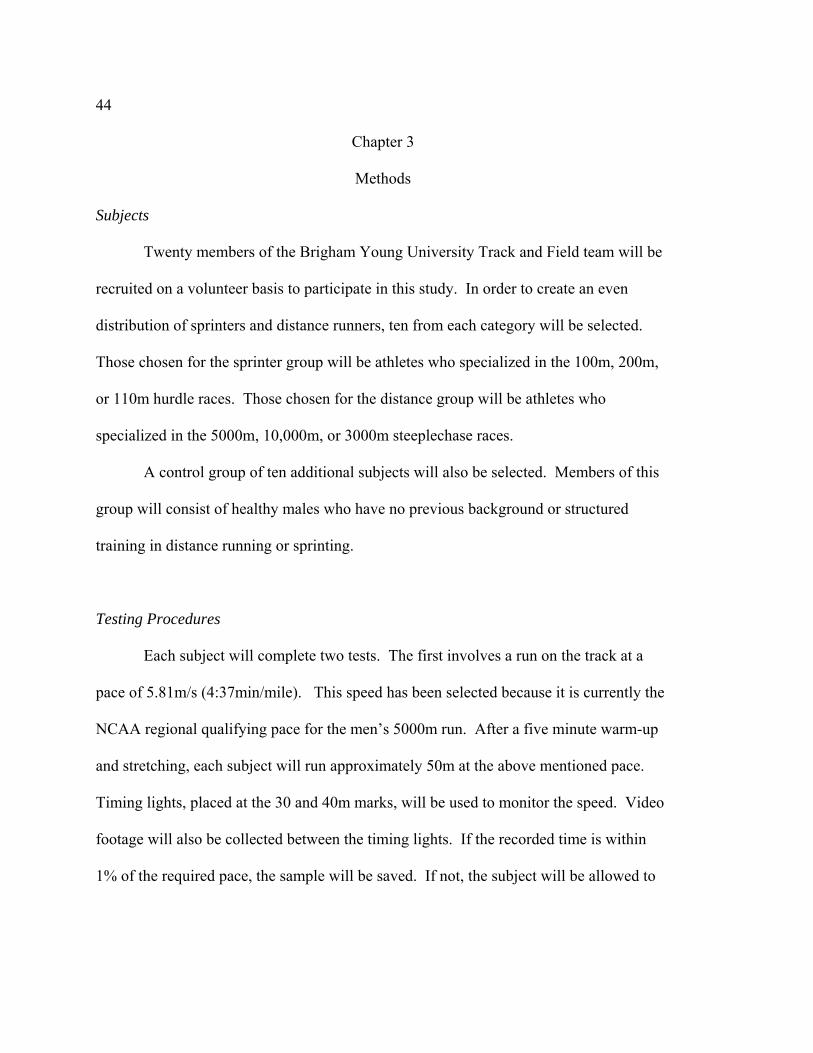
Methods
Subjects
Twenty members of the Brigham Young University Track and Field team were
recruited on a volunteer basis to participate in this study. In order to create an even
distribution of sprinters and distance runners, ten from each category were selected.
8
Those chosen for the sprint group were athletes who specialized in the 100m, 200m, or
110m hurdle races. Those chosen for the distance group were athletes who specialized in
the 10,000 m, 5000 m, or 3000 m steeplechase races, averaging 55-90 miles of running a
week.
A control group of ten additional subjects was selected. Members of this group
consisted of healthy males who had no previous background or structured training in
distance running or sprinting.
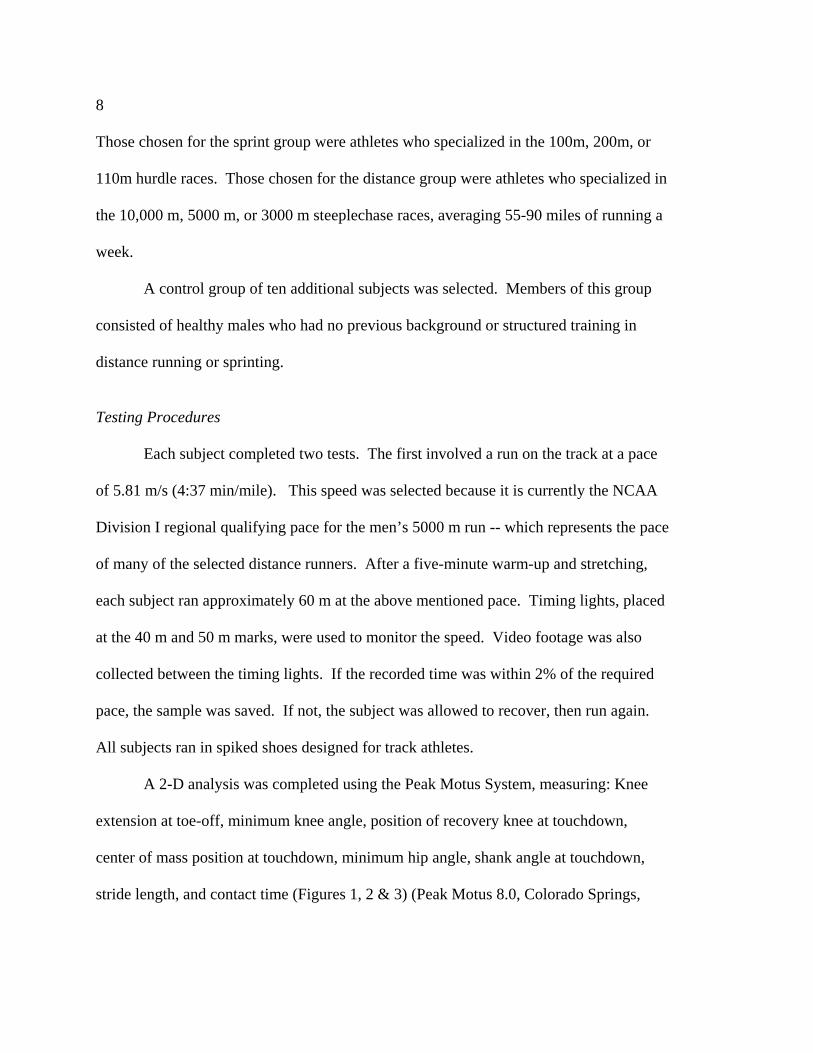
Testing Procedures
Each subject completed two tests. The first involved a run on the track at a pace
of 5.81 m/s (4:37 min/mile). This speed was selected because it is currently the NCAA
Division I regional qualifying pace for the men’s 5000 m run -- which represents the pace
of many of the selected distance runners. After a five-minute warm-up and stretching,
each subject ran approximately 60 m at the above mentioned pace. Timing lights, placed
at the 40 m and 50 m marks, were used to monitor the speed. Video footage was also
collected between the timing lights. If the recorded time was within 2% of the required
pace, the sample was saved. If not, the subject was allowed to recover, then run again.
All subjects ran in spiked shoes designed for track athletes.
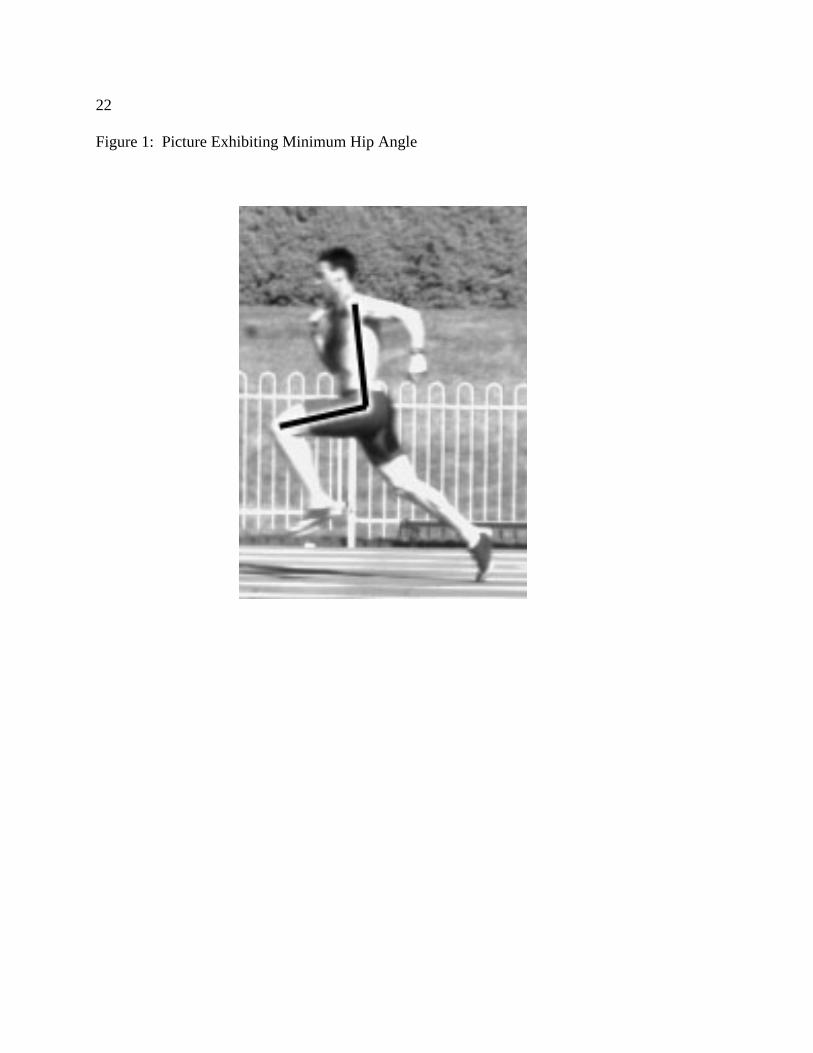
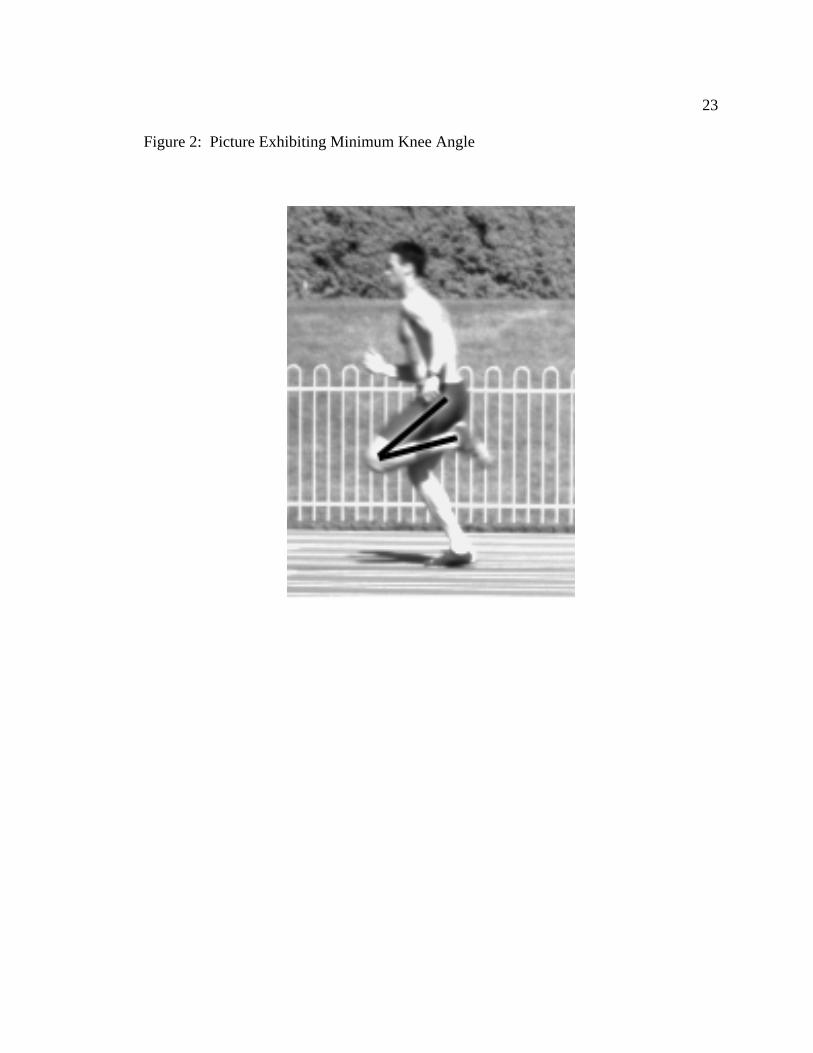
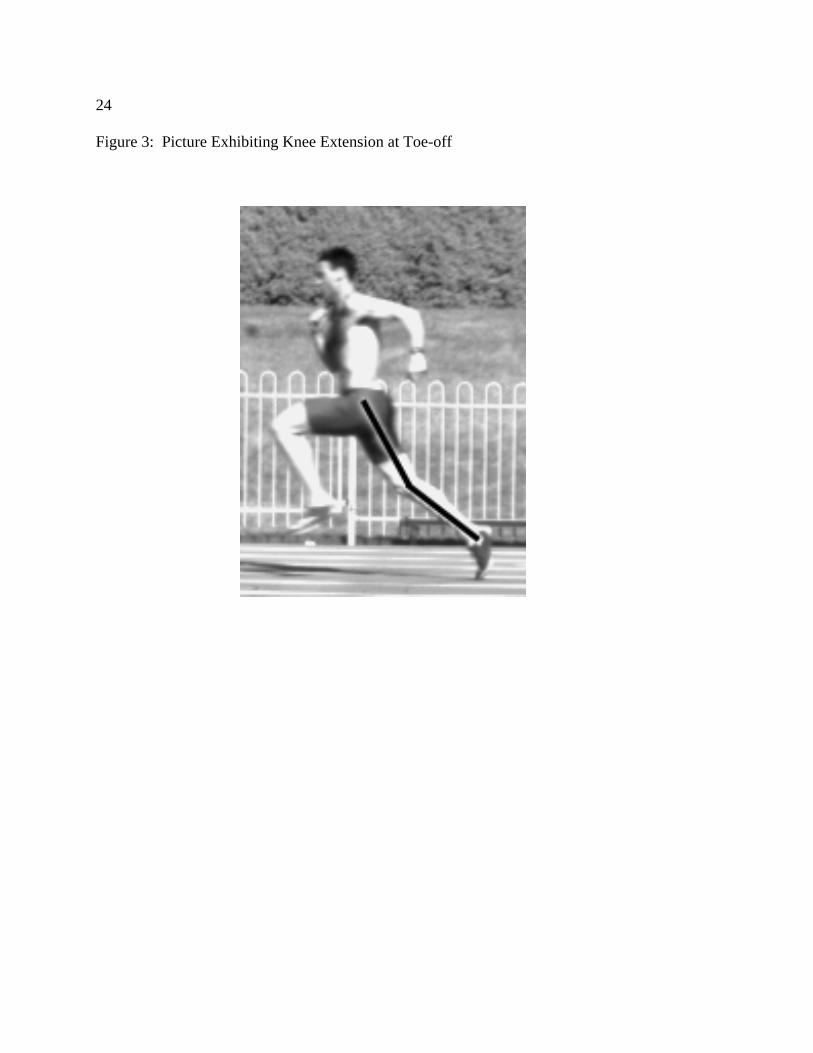
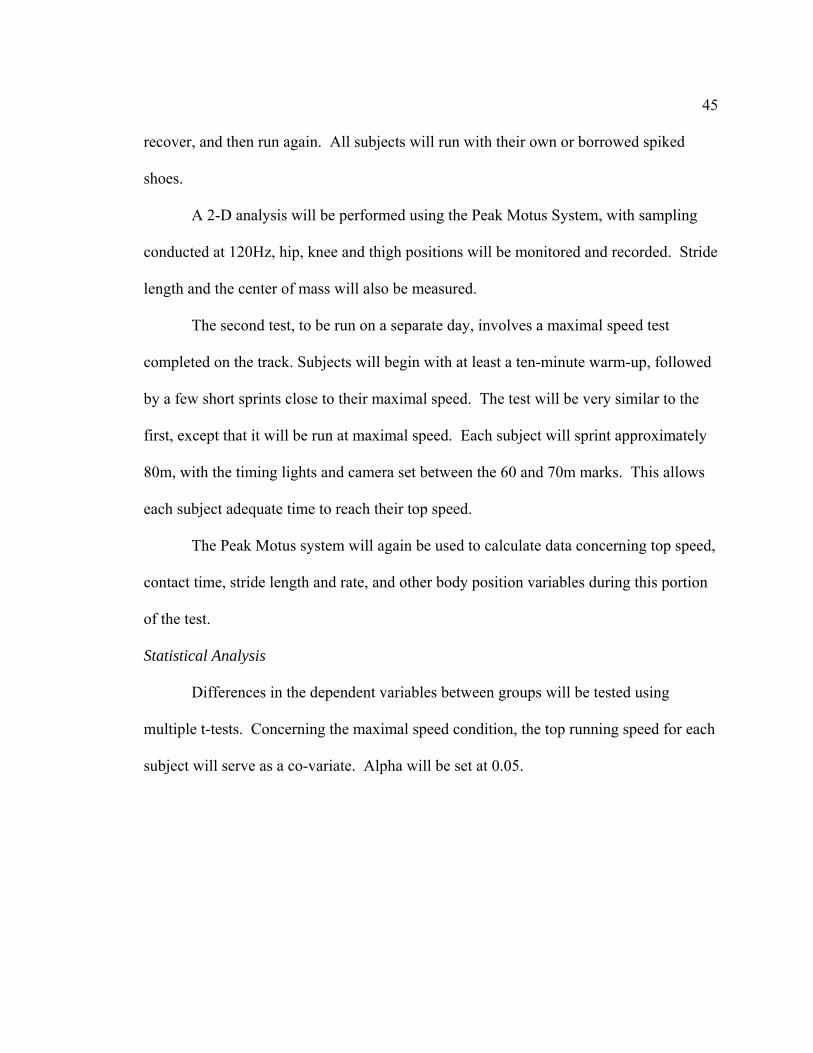
A 2-D analysis was completed using the Peak Motus System, measuring: Knee
extension at toe-off, minimum knee angle, position of recovery knee at touchdown,
center of mass position at touchdown, minimum hip angle, shank angle at touchdown,
stride length, and contact time (Figures 1, 2 & 3) (Peak Motus 8.0, Colorado Springs,
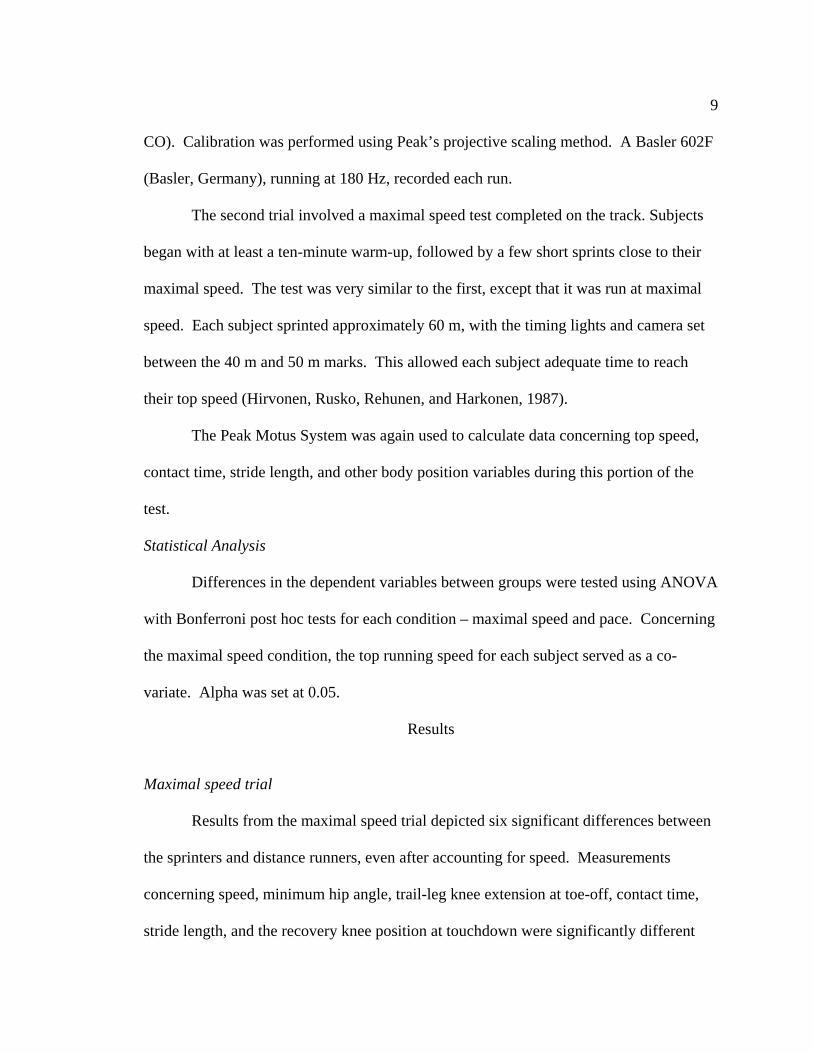
9
CO). Calibration was performed using Peak’s projective scaling method. A Basler 602F
(Basler, Germany), running at 180 Hz, recorded each run.
The second trial involved a maximal speed test completed on the track. Subjects
began with at least a ten-minute warm-up, followed by a few short sprints close to their
maximal speed. The test was very similar to the first, except that it was run at maximal
speed. Each subject sprinted approximately 60 m, with the timing lights and camera set
between the 40 m and 50 m marks. This allowed each subject adequate time to reach
their top speed (Hirvonen, Rusko, Rehunen, and Harkonen, 1987).
The Peak Motus System was again used to calculate data concerning top speed,
contact time, stride length, and other body position variables during this portion of the
test.
Statistical Analysis Differences in the dependent variables between groups were tested using ANOVA
with Bonferroni post hoc tests for each condition – maximal speed and pace. Concerning
the maximal speed condition, the top running speed for each subject served as a co-
variate. Alpha was set at 0.05.
Results
Maximal speed trial
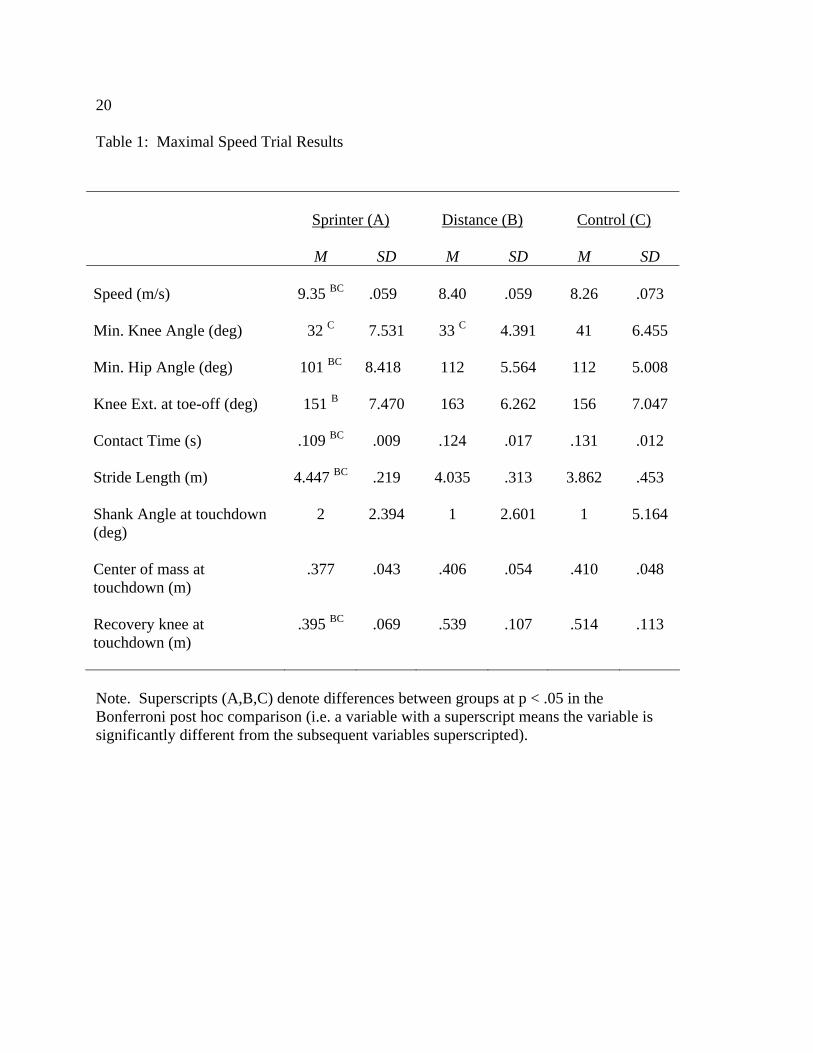
Results from the maximal speed trial depicted six significant differences between
the sprinters and distance runners, even after accounting for speed. Measurements
concerning speed, minimum hip angle, trail-leg knee extension at toe-off, contact time,
stride length, and the recovery knee position at touchdown were significantly different
10
(Table 1). Sprinters and distance runners also exhibited a significantly smaller minimum
knee angle than those in the control group.
The sprinters and control group differed significantly concerning the
measurements for speed, minimum hip angle, stride length, contact time, and the position
of the recovery knee at touchdown (Table 1).
In looking at the location of the center of mass at touchdown, there appears to be
a trend toward significant difference between the sprinters and distance runners (Table 1).
Pace trial
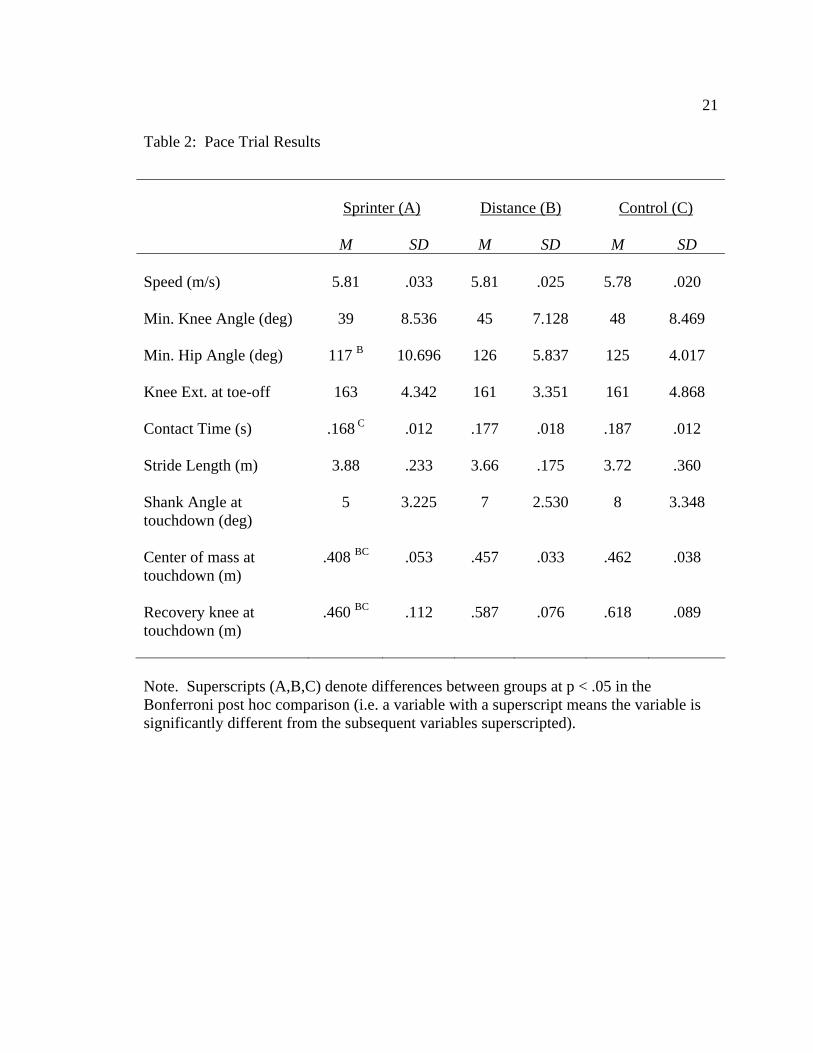
Results from the pace trial depicted three significant differences between the
sprinters and distance runners. Minimum hip angle, center of mass at touchdown, and the
position of the recovery knee at touchdown were all significantly different in comparing
the two groups (Table 2).
Sprinters also differed significantly from the control group concerning contact
time, the center of mass at touchdown and the position of the recovery knee at touchdown
while running at pace (Table 2).
The values for shank angle at touchdown, contact time, and the minimum knee
angle appear to present a trend toward significant difference between the sprint group and
distance runners (p = .06, Table 2).
Discussion This study was designed with the premise that there are distinct variations in
technique and form that separate sprinters from distance runners. Additionally, it was
hypothesized that these differences between the two groups would exist at both equal and
11
maximal speeds. This is to say that even when slowed down, sprinters would still run
with sprint technique, and distance runners, when attempting to sprint, would still run
with distance form. The results in the present study show that many of the measured
aspects of technique differ significantly concerning sprinters and distance runners at both
speeds.
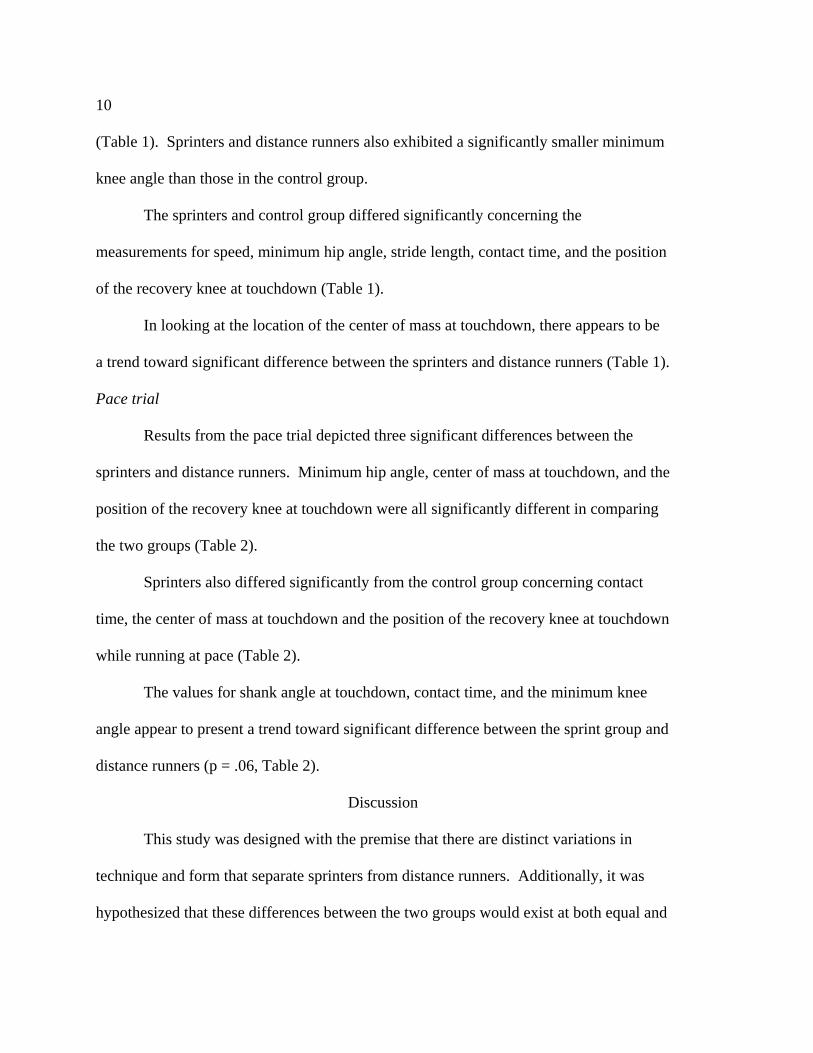
An interesting difference between distance running and sprinting is illustrated at
the hip joint, involving the degree of flexion and extension. When sprinting, most of the
increased motion at the hip involves flexion. Prior research has stated that sprinters
display approximately 10 to 15 degrees more flexion at the hip joint than distance runners
(Mann and Hagy, 1980). The present study supports this, finding that even when the
distance runners attempt to sprint, there is still an 11 degree difference regarding the
minimum hip angle (Table 1). The sprint group displayed significantly more acute hip
angles in both trials. This increased flexion at the hip exhibits a quicker recovery of the
leg, as less time is spent with it behind the body (Mann et al., 1980).
The more acute hip angle is also related to the reduction of the braking forces
during ground contact. When the leg is recovered faster, the athlete is in a better position
to initiate the backward acceleration upon foot-to-ground contact (Kivi et al., 2002)
Higher thigh amplitude, as displayed by the sprint group in this study, is crucial in
making this movement possible. Many distance runners, in an effort to cushion the foot-
strike, develop a rear-foot landing that allows footwear and skeletal structures to absorb
more of the load. This also, however, increases the braking force (Williams et al., 1987).
12
So while this heel-strike may be important when logging high mileage, it is certainly not
beneficial when it comes to sprinting.
The degree of thigh amplitude may also be closely related to stride length. While
running at maximal speed, the sprint group in the present study produced a significantly
longer stride than those of the distance and control groups. In connecting this with the
above described thigh amplitude, one can see that with a higher level of hip flexion the
leg will be positioned further in front of the body, allowing for a longer stride (Mero,
Komi and Gregor, 1992).
Another area of significant difference involved the position of the recovery knee
at touchdown. In both trials, the sprint group, at touchdown, exhibited a more forward
position of the trailing knee, indicating a quicker recovery of the leg. This positioning
can be partially attributed to the degree of knee extension at toe-off, which was also
found to be significantly different between the sprint and distance groups during the
maximal speed trial. Sprinters exhibited a lower degree of extension, allowing a more
powerful push-off with the foot, and a faster turnover of the trail-leg.
This result, regarding the knee extension at toe-off, endorses past research by Kivi
et al. (2002) in which high speed treadmills were used in sprint development. As the
treadmill increased in pace towards 95% of the subject’s maximal speed, knee extension
at the push-off phase decreased. The straighter the leg becomes, the less power it is able
to generate. With a fully extended knee, the push-off phase essentially becomes a flick of
the ankle. Elite sprinters, however, begin the recovery phase before the trail-leg
13
straightens out, allowing the muscle groups of the upper leg to assist in the push-off
process.
The above-described stance regarding the more forward position of the recovery
knee is also highly connected to the knee flexion of the trail leg. During the maximal
speed trial, both the sprint and distance groups exhibited a significantly higher degree of
flexion in comparison to the normal group. The more acute knee angle shortens the lever
arm, allowing a quicker recovery of the trail leg (Williams et al., 1987). With the faster
recovery, it is understandable how the trailing knee, at touchdown, is found more forward
in its positioning.
In comparing the sprint and pace trials for all three groups, a positive relationship
was found to exist between velocity and the range of motion at the hip and knee joints.
As the subjects attempted to sprint, more movement at these joints was observed. This
increase in range allows for longer strides and shorter lever arms – both of which lead to
an increase in speed (Cavanagh and Williams, 1982).
A prior study by Mann et al. (1987) demonstrated that as subjects increased their
speed, from walking to running to sprinting, their stance time decreased dramatically
from one stage to the next. Walking and running registered as .620 s and .220 s,
respectively. When the subjects sprinted, their contact time dropped to .140 s. The
present study reinforces these results by showcasing several areas of significance
concerning contact time. In both the pace and maximal speed trials, the sprint group
exhibited a significantly quicker contact time than the control group. The sprinters also
differed significantly from the distance runners while running at maximal speed.
14
In observing the differences in contact time among the groups, one can see that
sprinters, in the course of their training, develop the ability to spend less time on the
ground with each step. Previous work by Weyand et al. (2001) found that one of the
major differences between average and great sprinters involved the contact time. The
study showed that quicker foot-to-ground contact was more important than even stride
frequency or length.
What is of interest with the contact time results is that even at pace, when the
speeds are completely equalized, sprinters still exhibit a smaller time spent in contact
with the ground. It is understandable to estimate that with all of the high-speed training
they complete, sprinters are ingrained to recover their steps as quickly as possible – even
when the pace is slowed. If distance runners developed this ability, perhaps the final
stage of their race could be more successful.
In the attempt to more accurately measure an event such as contact time, the use
of force plates could provide stronger, more correct results (Weyand et al., 2001) The
high speed camera produces respectable estimates, but it is felt that even at 180 Hz, there
is room for inaccuracy when trying to measure an event of this nature.
A result that created some questions involved the shank angle figures. While
neither trial produced a significant difference between the groups, there appeared to be a
trend towards a difference in the pace runs, separating the sprinters from the distance and
control groups. This motion, in showing the direction of the foot at landing to be more
negative, exhibits a clawing effect upon foot-to-ground contact (Mero et al., 1992). The
hypothesis concerning these figures estimated a difference between the sprint and
15
distance groups in both trials. Additional research regarding this measurement would be
beneficial in the attempt to understand the variety of results obtained in the present study.
The results obtained from the maximal speed test concerning the shank angle
present an interesting connection with stride length. At maximal speed, the sprint group
produced a significantly longer stride length than their distance counterparts, while still
exhibiting an equal shank angle at touchdown. Prior research suggests that an increased
stride length is normally accompanied by a larger shank angle (Challis, 2001). As the
runner over-strides, the lower leg reaches out further in front of the body, leading to a
heel-strike and a high braking effect. The present study, however, reveals that sprint
technique allows the runner to produce a longer stride and still position the shank nearly
vertical upon touchdown.
A possible explanation for this action involves the timing of each stride. As the
sprinter demonstrates a more powerful push-off, followed by a quicker recovery of the
leg, as well as higher thigh amplitude, there is more time to initiate the clawing effect
upon ground contact. Research looking at the velocity of the shank might better explore
this relationship.
Considering the control group, most of the measured aspects of technique were
found to be comparable to those displayed by the distance group. The only result
showing a significant difference between the distance and control groups involved the
minimum knee angle. With this information it is suggested that sprint technique is more
of a learned skill, different in many ways from the natural process of running.
16
Conclusion
Considering the above described variation between distance runners and sprinters
at maximal speeds, specific changes in technique could be made in an effort to improve
performance. Great distance runners are some of the most efficient athletes in all of
sport, rarely showing wasted effort or motion. Near the finish, however, economy of
movement gives way to top speed. There is a transformation that takes place as they
attempt to change from distance runner to sprinter. Results from the present study,
however, indicate that this desired adaptation does not necessarily occur. In several of
the measured areas concerning leg positioning and stride length at maximal speed, the
distance runners exhibited significantly different technique than that of the sprinters. The
distance runners, due to their necessary training that emphasizes high levels of efficiency,
do not truly know how to sprint. The development of economical distance form is a
fairly natural process that occurs with the miles of training. Whatever wasteful motion
the runners may begin with is usually phased out as fatigue sets in (Jerome, 1997).
Sprinting, however, is a separate, learned technique that often requires specific feedback.
With this being understood, it is suggested that the inclusion of biomechanical
intervention into the training programs of both sprinting and competitive distance running
would be beneficial. Both efficiency and sprinting power can be monitored and
evaluated with the help of biomechanical analysis. As great as it would be to possess
elite ability in both the sprints and the distance events, everyone is limited in their range.
Biomechanical analysis can help the long-distance runners develop their sprinting form,
but it will never make them a world-class sprinter. Physiological differences, such as
17
muscle fiber type, limit the overall capacity for speed development. In working with an
eye towards the elite distance runners, however, it is not a matter of making sprinters out
of the milers and 5000 m runners. They are simply looking to slightly adapt their form in
the later stages of the race in order to increase their speed and finish with the competition.
When attempting maximal speed, distance runners may benefit by focusing on
one characteristic of technique. If knee extension at toe-off could be trained to become
more sprint-like, the other characteristics unique to sprinters may follow. To further
explain this example, one can see that a smaller degree of knee extension at toe-off could
lead to a more explosive push-off, followed by a more acute angle of knee flexion during
the recovery phase. With a shorter, quicker lever arm, a more forward position of the
recovery knee at touchdown would be possible. The center of mass would also be more
forwardly positioned, found closer to the point of foot-to-ground contact. From this
stance, the athlete could then produce higher thigh amplitude, leading to a longer stride,
higher support force, and quicker contact time. (Kivi et al., 2002). Whether this type of
flow would actually occur stride after stride is still a question to be answered, but the
connections between each phase of the step are certainly observable.
18
References
Brandon, L.J., and Boileau, R.A. (1992). Influence of metabolic, mechanical and
physique variables on middle distance running. Journal of Sports Medicine
Physical Fitness, 32(1), 1-9.
Cavanagh, P.R., and Kram, R. (1989). Stride length in distance running: velocity, body
dimensions, and added mass effects. Medicine Science Sports Exercise, 21(4),
467-479.
Cavanagh, P.R., and Williams, K.R. (1982). The effect of stride length variation on
oxygen uptake during distance running. Medicine Science Sports Exercise, 14(1),
30-35.
Challis, J.H. (2001). The variability in running gait caused by force plate targeting.
Journal of Applied Biomechanics, 17(1), 47-54.
Hirvonen, J., Rusko, H., Rehunen, S., and Harkonen, M. (1987). Breakdown of high-
energy phosphate compounds and lactate accumulation during short
supramaximal exercise. European Journal of Applied Physiology, 56, 253-259.
Jerome J. (1997). The elements of effort. New York, NY: Simon & Schuster
Inc.Williams, K.R., and Cavanagh, P.R. (1987). Relationship between distance
running mechanics, running economy, and performance. Journal of Applied
Physiology, 63(3), 1236-1245.
Kivi, D.M.R., Marai, B.K., and Gervais, P. (2002). A kinematic analysis of high-speed
treadmill sprinting over a range of velocities. Medicine Science Sports Exercise,
34(4), 662-666.
19
Mann, R.A., and Hagy, J. (1980). Biomechanics of walking, running, and sprinting. The
American Journal of Sports Medicine, 8, 345-350.
Mann, R.A., Moran, G.T., and Dougherty, S.E. (1986). Comparative electromyography
of the lower extremity in jogging, running, and sprinting. The American Journal
of Sports Medicine, 14(6), 501-510.
Mero, A., Komi, P.V., and Gregor, R.J. (1992). Biomechanics of sprint running. A
review. Sports Medicine, 13(6), 276-292.
Weyand, P.G., Sternlight, D.B., Bellizzi, M.J., and Wright, S. (2001). Faster top running
speeds are achieved with greater ground forces not more rapid leg movements.
Journal of Applied Physiology, 89(5), 1991-1999.
Williams K.R., Cavanagh P.R. (1987). Relationship between distance running
mechanics, running economy, and performance. Journal of Applied Physiology,
63(3), 1236-1245.
20
Table 1: Maximal Speed Trial Results
Note. Superscripts (A,B,C) denote differences between groups at p < .05 in the Bonferroni post hoc comparison (i.e. a variable with a superscript means the variable is significantly different from the subsequent variables superscripted).
Sprinter (A)
Distance (B)
Control (C)
M SD M SD M SD Speed (m/s)
9.35 BC
.059
8.40
.059
8.26
.073
Min. Knee Angle (deg)
32 C
7.531
33 C
4.391
41
6.455
Min. Hip Angle (deg)
101 BC
8.418
112
5.564
112
5.008
Knee Ext. at toe-off (deg)
151 B
7.470
163
6.262
156
7.047
Contact Time (s)
.109 BC
.009
.124
.017
.131
.012
Stride Length (m)
4.447 BC
.219
4.035
.313
3.862
.453
Shank Angle at touchdown (deg)
2
2.394
1
2.601
1
5.164
Center of mass at touchdown (m)
.377
.043
.406
.054
.410
.048
Recovery knee at touchdown (m)
.395 BC
.069
.539
.107
.514
.113
21
Table 2: Pace Trial Results
Note. Superscripts (A,B,C) denote differences between groups at p < .05 in the Bonferroni post hoc comparison (i.e. a variable with a superscript means the variable is significantly different from the subsequent variables superscripted).
Sprinter (A)
Distance (B)
Control (C)
M SD M SD M SD Speed (m/s)
5.81
.033
5.81
.025
5.78
.020
Min. Knee Angle (deg)
39
8.536
45
7.128
48
8.469
Min. Hip Angle (deg)
117 B
10.696
126
5.837
125
4.017
Knee Ext. at toe-off
163
4.342
161
3.351
161
4.868
Contact Time (s)
.168 C
.012
.177
.018
.187
.012
Stride Length (m)
3.88
.233
3.66
.175
3.72
.360
Shank Angle at touchdown (deg)
5
3.225
7
2.530
8
3.348
Center of mass at touchdown (m)
.408 BC
.053
.457
.033
.462
.038
Recovery knee at touchdown (m)
.460 BC
.112
.587
.076
.618
.089
22
Figure 1: Picture Exhibiting Minimum Hip Angle
23
Figure 2: Picture Exhibiting Minimum Knee Angle
24
Figure 3: Picture Exhibiting Knee Extension at Toe-off

25

25
Appendix A
Prospectus

26
27
Chapter 1
Introduction In the sport of track and field, two major categories of athletes are sprinters and
distance runners. As they compete in their respective events, there are many differences
between the two groups. Sprinting is not simply running fast, just as distance running is
not just running long. There are distinct variations in technique and form that separate
the two styles of running.
Sprinting is associated primarily with power and speed, whereas distance running
is focused on efficiency and smoothness of movement. This major difference is easily
observed at a track meet or practice where both groups are competing. As the distance
team runs lap after lap, their ease of movement and smoothness of stride is apparent.
They show little wasted movement, and appear collected and controlled in their actions.
The sprinters represent the other end of the spectrum with their high speed and explosive
movement. They showcase their power with quick, violent motion as they speed down
the track.
Within each race, however, there are elements from each that overlap. With
distance events, there comes a time near the end of the race where economy of movement
gives way to speed. The runners become less concerned with their economy and more
concerned with crossing the finish line as soon as possible. When this happens, many
runners simply continue with their same form, attempting to increase the pace. If they
knew how to alter their technique in a way to become more like a sprinter, this process
could possibly be more successful. The majority of the race is still controlled by the
28
issue of efficiency, but as the finish nears, changes may be made to improve
performance.
Some of these changes involve positioning the body for a foot contact that
minimizes braking and maximizes forward acceleration. Braking forces and the hip
flexion angular velocity are connected by an inverse relationship. By increasing the
angular velocity at the hip, showing a quicker recovery of the leg, the braking force will
be reduced.1 Knee flexion comes into play with the leg recovery as well. By showcasing
a higher degree of flexion, the runner is able to shorten the lever arm of the leg as it is
pulled from behind the body to the front.2
Another area of focus, concerning the differences between sprinting and distance
running involves the contact or stance time with each step. As speed increases, the foot-
to-ground contact times dramatically decrease. In a study by Weyand, Sternlight,
Bellizzi, and Wright findings showed that when comparing slow vs. fast sprinters, the
greatest differences between the two groups involved the support forces and contact
times.3
In order to understand these variations, with an eye towards improving distance
running performance near the finish line, an analysis of sprinters and distance runners,
while running at an equal pace, needs to be completed. This study will determine
whether the technique of sprinters and distance runners is different at equal and maximal
speeds.
29
Purpose Statement
The purpose of this study is to compare the differences in technique between
sprinters and distance runners while running at equal and maximal speeds.
Hypotheses
When running at a pace of four minutes per mile, in comparison to distance
runners, sprinters will:
1. exhibit a longer stride length;
2. exhibit a shorter contact time;
3. exhibit a slower stride rate;
4. produce a more acute angle of knee flexion in the recovery leg;
5. position their foot, at touchdown, closer to their center of mass in the A/P
direction;
6. exhibit a smaller angle of knee extension at take-off;
7. produce higher thigh amplitude;
8. exhibit a more forward position of the recovery knee at touchdown; and
9. show the direction of the foot at landing to be more negative.
When running at maximal speed, sprinters will exhibit all of the above, minus the
slower stride rate. At maximal speed, sprinter will produce a faster stride rate than their
distance counterparts.
The measurements of the control group are expected to be similar to the distance
runners, but more variable.
30
Limitations
1. Subjects will be recruited on a volunteer basis, rather than using a random
sample.
2. The majority of the subjects’ racial status will be Caucasian.
3. The subjects involved will be male.
Delimitations
1. The sample will include 20 members of the BYU men’s track and field
team.
2. The subjects will be divided into three categories -- sprinters, distance
runners, and a control group with no prior structured experience in
sprinting or distance running.
Definition of Terms
Step -- Foot contact of one foot until contact of the opposite foot.
Stride -- Two steps in a row. A stride is completed when the feet regain the initial
relative positions.
Stride Index -- The distance from the heel to the center of the pressure point as a
percentage of shoe length, measured at the time that the increasing vertical ground
reaction force curve reaches 10% of maximal vertical force.
Thigh amplitude -- During flight, the minimum angle between the trunk and the
thigh of the lead leg.
31
Significance of Study The significance of this study involves two main areas. The first deals with the
technique differences between the two groups of track athletes. We know that variations
exist between sprinters and distance runners, but do they still exist when everyone is
running at the same speed? If they do, what are the specific differences? Once these
questions are better understood, we can then begin handling the second area of
significance, which involves possible training adaptations for distance runners. At the
end of each distance race, there is a moment when the emphasis changes from economy
of movement to raw speed. The runner is no longer concerned with fluid efficiency, but
rather becomes completely focused on crossing the finish line as fast as possible. It is at
this moment when the distance runner needs to become a sprinter. They need to know
what technique differences they should make in order to create more power and speed.
With the results of this study, we can hopefully provide understanding in this area.
32
Chapter 2
Review of Literature
In comparing sprint vs. distance form, a few basic differences should be
understood. Sprinting focuses on power, explosiveness and top speed. The use of the
body centers on the development of force, and the effort is highly intense. Distance
running is focused more on the economy of movement, with form that is fluid and
efficient, exhibiting little wasted motion. “The body is quiet, the head still, the arms
pump only enough to provide adequate counterbalance. There’s no excessive or violent
motion anywhere, no bobbing up and down, the feet lifted no higher than required to get
the job done. Everything is smooth”.4 As distance runners develop their form through
miles of training, whatever wasteful motion they may begin with is usually fazed out as
fatigue sets in. In studying the two forms of running, they are found at opposite ends of
the spectrum. One is strictly power and speed, whereas the other relies on high levels of
efficiency.
Over the years there have been several methods employed concerning the
examination of different running technique. Electromyographic timing, center of mass
measurements, raw force-plate data, joint movements, and joint powers are just a few of
the means that have been used.5 The impacts of changes in velocity, as well as the
characteristics of the gait cycle are other areas that have been opened up and looked at.
To better understand the present study, an examination of these methods, and their
usefulness, is important.
33
To explore the motion of sprinting vs. running, Mann, Moran, and Dougherty
conducted an electromyographic (EMG) study of the lower extremity muscles that
involved a comparison of jogging, running, and sprinting.6 Results showed that as the
subjects increased their speed, their stance time decreased dramatically from one stage to
the next. Stance time involves the moment in which their foot was on the ground with
each step. For walking, this phase was recorded as 620 msec. Jogging and running
registered as 260 msec and 220 msec, respectively. When the subjects sprinted, their
stance time dropped to 140 msec. This lowered support phase is one factor that separates
sprinting from simply running fast. From the EMG readings, this study also showed that
the primary muscle group associated with the increase of speed is the hip flexor.6 A
separate, yet similar study by Mann and Hagy also showed an increase in quadricep and
hamstring activity with a rise in speed.7
Mann and Hagy also looked at the hip and knee motion of runners and sprinters.
A positive relationship exists between velocity and the range of motion in these two
joints.7 An interesting difference between distance running and sprinting is illustrated at
the hip joint, involving the degree of flexion and extension. When sprinting, most of the
increased motion at the hip involves flexion. The sprinter displays approximately 10 to 15
degrees more flexion at the hip joint than the runner. The degree of extension in the hip,
at sprint speed, is actually decreased slightly in comparison to distance running.7 This
increase in flexion, and decrease in extension yields a quicker recovery of the leg, as less
time is spent with the leg behind the body. In discussing the motion at the knee at sprint
velocity, it is actually similar to the hip in that the degree of flexion rises, while extension
34
slightly drops. This motion, in both the hip and knee, creates a lower center of gravity for
the body.7
Mann and Hagy also touched on the electromyographic activity of the anterior
muscles of the calf.7 With running and sprinting, these muscles experience a concentric
contraction at the time of contact. When the subject is walking, the contraction is
eccentric.7 This is connected with the increased plantar-flexion associated with higher
speeds. As you move from a jog to a sprint, the heel-strike will disappear. Elite sprinters
are striking with their fore-foot, leading quickly to the explosive concentric contraction of
the calf muscles, and plantar flexion of the foot.
As high-speed treadmills have progressed in quality, they have become more
popular as tools for speed development. Specific training programs can be followed, and
all conditions can be closely monitored. A recent study included a biomechanical
analysis of six elite sprinters as they completed four trials on a treadmill at differing
intensities.1 The emphasis was on sprinting, as the participants ran at 70%, 80%, 90%,
and 95% of their individual maximum velocity. Camera footage was collected as each
trial lasted 3-5 seconds, enough to analyze three successive strides. Stride frequency,
stance time, and flight time were all recorded, as well as hip and knee kinematics. As
speed increased, stance time and flight time both decreased. The stride frequency
increased with the higher velocities.1 This is to be expected as one sprints. Their legs
move more rapidly, and their feet spend less time on the ground with each step. The
kinematic analysis of the knee measured flexion, extension, and the angular velocity of
both flexion and extension. As the speed increased towards 95%, knee extension at the
35
push-off phase decreased. The straighter the leg is at this point in time, the less power it
is able to generate. With the lower degree of extension, higher speeds are possible. The
angular velocities at the knee, in both flexion and extension, showed significantly higher
values at the 95% trial in comparison to the 70% trial. The importance of this increase
from a sprinter’s point of view is explained in the following statement. “Knee extension
angular velocity is important in allowing the lower leg enough time to be able to produce
sufficient knee flexion angular velocity at touchdown, which will reduce the forward
braking force during the initial portion of ground contact.”1 Additionally, the values
obtained from the kinematic analysis of the hip show that flexion at the hip increases
significantly as the velocity mounts; and the same goes for the hip flexion angular
velocity. This leads us to understand that the “ability of a sprinter to reduce braking
forces during ground contact may be related to the ability to recover the leg forward. If
the leg is recovered faster, the athlete will be in a better position to initiate the backward
acceleration of the leg to ground contact.”1 Other observed differences involved the
increase in hip extension angular velocity. One of the acknowledged advantages of
treadmill sprint training is that this extension velocity is dramatically increased due to the
help provided from the moving belt.
Kivi, Marai, and Gervais, in showing the differences that occur at each stage of
velocity, have helped in exploring some key variations between runners and sprinters.1
With the above information concerning hip and knee angles, as well as the angular
velocities of both, one can see how they differ as speed increases. Sprinters, since they
regularly train at high speeds, are likely to produce more acute angles at the hip and knee.
36
Their overall higher speed also leads to the regular production of an increased angular
velocity at the hip. Whether this still occurs, compared to distance runners, when they
are running slower has yet to be looked at.
Elite sprinters, as discussed earlier, strike fore-foot first, which leads to a
shortened stance time. Past research has established that contact or stance time is
negatively related to running speed.8 A rear foot strike, as exhibited by many distance
runners, will certainly lengthen the phase of contact at each step. Weyand, Sternlight,
Bellizzi, and Wright conducted a study that explored what influences the top sprint
speeds in human runners.3 Their hypothesis suggested that top speed is more heavily
effected by the amount of force applied to the ground rather than how quickly our legs
are repositioned in the air. Their research fought against the more common idea that
stride length and frequency are most responsible for greater forward velocity. As part of
the study, their subjects completed several rounds of short, increasingly faster sprints on a
high-speed treadmill. Perpendicular forces applied to the running surface, as well as
contact times for each step, were recorded throughout the test. Stride length, frequency,
and contact length were also collected. As speed increased, so did the support forces
applied to the running surface. Additionally, the foot-ground contact times were
dramatically reduced.3 When comparing slow vs. fast runners, Weyand found that the
greatest differences between the two groups involved the support forces and contact
times. Utilizing stride frequency for top speed was found to be somewhat limited in that
the slowest subject, with a top speed of only 6.2 m/s, exhibited a nearly equal time of
repositioning the leg for the next step as the fastest 100m sprinter in the world.3 This
37
subject is running half as fast as the world record holder, yet the stride frequency is
nearly the same. This concept exhibits once again how sprinting differs from running
fast.
The research discussed above should not discount earlier studies focusing on the
issue of stride frequency. If one moves his legs faster, and maintains his stride length, he
will increase his speed. That is not debatable. What Weyand, Sternlight, Bellizzi and
Wright added to the discussion is the comparison between a recreational runner, and a
highly trained sprinter.3 When this is looked at, and you are able to evaluate their support
force and contact time, stride frequency is not going to be the answer for the difference in
speed. Stride frequency, when increased, will certainly contribute to a higher velocity,
but the differences between a fast and slow runner are going to come primarily from the
increase in support force and the decrease in contact time.
One aspect this study hopes to explore is whether this difference in contact time
between sprinters and runners is present when they are both running at the same velocity.
Are the sprinters, who train at higher speeds and possess more fast-twitch muscle fibers,
programmed to consistently produce higher ground force and lower contact time even
when running at slower speeds? We aim to answer this.
A previous study approached a portion of the above topic by examining the
differences found between knee extensor and flexor muscles with sprint vs. endurance
training.9 After an eight week training program of either sprint work or distance running,
the subjects involved completed a number of tests concerning their knee extension and
flexion strength. Endurance, concerning these muscle groups, was also measured. The
38
results were interesting in that the sprint group showed an increase in extensor
capabilities, and a slight decrease in flexor torque. The endurance group also exhibited
an increase in extensor strength, but showed no change in flexor torque. Further analysis
involving the flexor/extensor ratio showed that sprint training can possibly encourage a
greater difference in strength between the knee flexors and extensors in comparison with
the distance runners.9 A focus of the study involved how this imbalance between the two
muscle groups may possibly lead to higher levels of injury. It also, however, showcases
some additional variation between sprinters and distance runners, and how their different
training and techique produces different adaptations.
When examining a sprint in three separate stages, we look at the start or
acceleration phase, the constant-speed phase, and the braking phase. To begin with, fast
sprinting speeds are achieved by those who are able to produce the greatest amount of
force and power possible. The sprinter is looking to create the highest velocity as soon as
he can. From that acceleration, the sprinter then moves into the constant-speed phase
where the focus shifts towards maintaining that high velocity to the finish. Once across
the line, the sprinter moves into the braking phase, which involves a biomechanical shift
that slows the body down.
In order to enhance the acceleration and constant-speed phases, Mero, Komi, and
Gregor have stated that, “efficient sprint running requires an optimal combination
between the examined biomechanical variables and external factors such as footwear,
ground and air resistance.”10 These factors, along with the continued study of the nervous
39
system, muscle force, and power production will allow for continued progress in the
future concerning the most favorable form of sprinting.
As discussed earlier, distance running focuses on economy. In thinking
mechanically, angles, attachment points and lines of force come together to aid in the
understanding of economy of movement. John Jerome explains it in the following way:
“The more economical you can make your stride, the farther, faster, and safer you can
run. A deeper understanding of the mechanics of running can improve your
performance.”4 A study conducted by Williams and Cavanagh looks into the realm of
distance running efficiency.2 Biomechanical measures were recorded as the subjects
completed runs on the track and the treadmill. Stride length, velocity, and the angles of
several joints were analyzed. The 55 subjects involved in the study were all
accomplished runners, and were broken into three groups based on their VO2submax
values. The more skillful runners made up the low VO2submax group, while the medium
and high groups were slightly less proficient. The test was run at 3.57 m/s; therefore,
distance form was the primary variable of interest. The results obtained concerning the
joint angles showed interesting differences between those exhibiting a high level of
economy vs. those who did not. Many of them differed significantly from one
VO2submax group to the next. The shank angle, described as the angle of the lower leg
as you step forward, showed further extension for those in the low VO2submax group.
They also exhibited more of a forward lean with the trunk – 5.9º for the low VO2submax
group compared to 2.4º for the high VO2submax group.2 Arm and wrist movement was
also quite different between the two categories. Those with the higher VO2submax had a
40
much less efficient motion concerning their arm carry. Another difference was observed
with the amount of vertical oscillation during the run trials. Those who are more efficient
in their running will show less up and down movement. This was seen in the study with
the low VO2submax group exhibiting 9.1 cm of oscillation, compared to the high
VO2submax group, who registered at 9.6 cm.
In looking at the knee flexion of the trail leg, Williams and Cavanagh again found
a difference between the high and low VO2submax groups.2 A more efficient runner will
shorten the lever arm by showing more flexion at the knee as the hip flexors pull the leg
forward from behind the body to the front. This was observed in the study as those who
ran more economically produced a higher knee flexion during this support phase – 43.1º
for the low VO2submax group, compared to 39.4º for the high VO2submax group.2
Although there are numerous variations in stride kinematics, analysis such as the
above described study has shown that subtle changes can lower the metabolic energy
costs. For example, those in the low VO2submax group “showed a lower stride index,
longer contact time, a lower maximal vertical force peak, and a more extended lower leg
at foot strike, all characteristics of a foot strike back toward the heel. Lower energy costs
might be related to the cushioning that takes place immediately following contact.”2
Whatever portion of the body you decide to analyze, from the heel to the hip to the trunk,
it is theoretically possible that by tweaking a certain aspect of a runner’s style, a lowered
VO2submax could result.
Having stated the above, it should also be noted that other studies have showed
most distance runners self-select their optimal stride length to minimize oxygen uptake.11
41
Therefore, concerning economy, one should be careful in looking to alter the length of
their stride.
In further discussion of stride length, a study by Cavanagh and Kram produced
results which showed a linear relationship between stride length and velocity.12 Stride
frequency, on the other hand, was found to remain fairly constant. During the testing
portion of the study, which involved a treadmill run, as the speed increased from 3.15
m·ֿ1 to 4.12 m·ֿ1 the subjects increased their stride frequency by only 4% while
lengthening their stride length by 28%.12
When looking back at our analysis of a sprinter, we can see the components of
economical running differing greatly from those of sprinters. Therefore, why would we
even look to incorporate the two at the conclusion of a distance race? Great milers are
some of the most efficiently smooth runners in the world. As they progress through their
race, there is rarely a wasted effort or motion. Near the finish, however, economy of
movement gives way to top speed. There is a transformation that takes place as they
attempt to change from distance runner to sprinter. It is believed by some that the U.S.
distance track team has struggled with this adaptation. Now, rather than leaving this
process to self-optimization, biomechanical observation is attempting to intervene with
feed back and the fine-tuning of certain movement.2
A study conducted by Brandon and Boileau looked at the differences among three
groups of middle distance runners – 800m, 1500m, and 3000m.13 The variables of
VO2max, stride length, anaerobic capacity, peak velocity, thigh length, and percent body
fat were all examined among the three distance categories.13 The results showed that
42
there were strong differences between the preferable type of training for one running the
1500m or 3000m, and one running the 800m. The data showed that 800m runners would
benefit from an emphasis on anaerobic speed work, aerobic conditioning, and
maintaining muscle mass. Those who race the 1500m or 3000m are better suited to train
for the enhancement of VO2max, stride length, and a large anaerobic capacity.13
With the results of this study being known and understood, it is also suggested
that biomechanical intervention be added to the training regimen, as well. As explained
through much of the above-described experiments, both efficiency and sprinting power
can be monitored and evaluated with the help of biomechanical analysis. As great as it
would be to possess elite ability in both the sprints and the distance events, everyone is
limited in their range. Biomechanical analysis can help the long-distance runners
develop their sprinting form, but it will never make them a world-class sprinter.
Physiological differences, such as muscle fiber type, limit the overall capacity for speed
development. In working with an eye towards the U.S. distance team, however, it is not a
matter of making sprinters out of the milers and 5000m runners. They are simply looking
to slightly adapt their form in the later stages of the race in order to increase their speed
and race with the competition.
Due to past research concerning over-ground vs. treadmill running, it is
understood that there are consistent biomechanical differences in the running form of the
two methods.14 The significant differences are most commonly found in the support
phase of each step. One such distinction involves an over-extension of the landing leg in
the treadmill mode of running. This leads to a higher braking force, as well as a center of
43
mass that is further back from the touchdown position of the foot in comparison to over-
ground running. Another difference in the support phase involves a greater range of
angular motion concerning the supporting leg. Research attributes these differences to
the moving treadmill belt, and its ability to bring the supporting foot back under the body
on its own.14 Due to the biomechanical variations between the two modes of running, this
study will conduct all tests on the track.
In discussing what we expect to find through our testing, we feel that several
differences between the sprinters and distance runners will be discovered and more fully
understood. One such distinction involves the contact time. Even as we equalize the
pace, we feel that sprinters, due to their training and increased ability for speed, will
exhibit a shorter contact time than the distance runners. We also expect them to produce
a more acute angle of knee flexion and thigh amplitude when compared to their distance
counterparts. We feel this will lead to a more forward position of the recovery knee, and
a more negative direction of the lead foot, at touchdown. Finally, due to their technique
and form development, we feel the sprinters will also showcase a longer stride length
than the distance runners.
44
Chapter 3
Methods Subjects
Twenty members of the Brigham Young University Track and Field team will be
recruited on a volunteer basis to participate in this study. In order to create an even
distribution of sprinters and distance runners, ten from each category will be selected.
Those chosen for the sprinter group will be athletes who specialized in the 100m, 200m,
or 110m hurdle races. Those chosen for the distance group will be athletes who
specialized in the 5000m, 10,000m, or 3000m steeplechase races.
A control group of ten additional subjects will also be selected. Members of this
group will consist of healthy males who have no previous background or structured
training in distance running or sprinting.
Testing Procedures
Each subject will complete two tests. The first involves a run on the track at a
pace of 5.81m/s (4:37min/mile). This speed has been selected because it is currently the
NCAA regional qualifying pace for the men’s 5000m run. After a five minute warm-up
and stretching, each subject will run approximately 50m at the above mentioned pace.
Timing lights, placed at the 30 and 40m marks, will be used to monitor the speed. Video
footage will also be collected between the timing lights. If the recorded time is within
1% of the required pace, the sample will be saved. If not, the subject will be allowed to
45
recover, and then run again. All subjects will run with their own or borrowed spiked
shoes.
A 2-D analysis will be performed using the Peak Motus System, with sampling
conducted at 120Hz, hip, knee and thigh positions will be monitored and recorded. Stride
length and the center of mass will also be measured.
The second test, to be run on a separate day, involves a maximal speed test
completed on the track. Subjects will begin with at least a ten-minute warm-up, followed
by a few short sprints close to their maximal speed. The test will be very similar to the
first, except that it will be run at maximal speed. Each subject will sprint approximately
80m, with the timing lights and camera set between the 60 and 70m marks. This allows
each subject adequate time to reach their top speed.
The Peak Motus system will again be used to calculate data concerning top speed,
contact time, stride length and rate, and other body position variables during this portion
of the test.
Statistical Analysis Differences in the dependent variables between groups will be tested using
multiple t-tests. Concerning the maximal speed condition, the top running speed for each
subject will serve as a co-variate. Alpha will be set at 0.05.
46
References
1. Kivi DMR, Marai BK, Gervais P. A kinematic analysis of high-speed treadmill
sprinting over a range of velocities. Med Sci Sports Exerc. 2002; 34(4): 662-66.
2. Williams KR, Cavanagh PR. Relationship between distance running mechanics,
running economy, and performance. J Appl Physiol. 1987; 63(3): 1236-45.
3. Weyand PG, Sternlight DB, Bellizzi MJ, Wright S. Faster top running speeds are
achieved with greater ground forces not more rapid leg movements. J Appl
Physiol. 200l; 89(5): 1991-9.
4. Jerome J. The elements of effort. New York, NY: Simon & Schuster Inc.; 1997.
5. Novacheck TF. The biomechanics of running. Gait Posture. 1998; 7(1): 77-95.
6. Mann RA, Moran GT, Dougherty SE. Comparative electromyography of the
lower extremity in jogging, running, and sprinting. Am J of Sports Med. 1986;
14(6): 501-510.
7. Mann RA, Hagy J. Biomechanics of walking, running, and sprinting. Am J
Sports Med. 1980; 8:345-50.
8. Munro CF, Miller DI, Fuglevand AJ. Ground reaction forces in running: a
reexamination. J Biomech. 1987; 20(2):147-55.
9. Shealy MJ, Callister R, Dudley GA, Fleck SJ. Human Torque velocity
adaptations to sprint, endurance, or combined modes of training. Am J Sports
Med. 1992; 20(5): 581-86.
10. Mero A, Komi PV, Gregor RJ. Biomechanics of sprint running. A review.
Sports Medicine. 1992; 13(6): 276-292.
47
11. Cavanagh PR, Williams KR. The effect of stride length variation on oxygen
uptake during distance running. Med Sci Sports Exerc. 1982; 14(1): 30-35.
12. Cavanagh PR, Kram R. Stride length in distance running: velocity, body
dimensions, and added mass effects. Med Sci Sports Exerc. 1989; 21(4): 467-79.
13. Brandon LJ, Boileau RA. Influence of metabolic, mechanical and physique
variables on middle distance running. J Sports Med Phys Fitness. 1992; 32(1):1-9.
14. Frishberg BA. An analysis of overground and treadmill sprinting. Med Sci
Sports Exerc. 1983; 15(6): 478-485.

48

49
Appendix B
Additional Results

50

51
Category: Sprinter Max Trial Pace Trial Subject 1 Speed (m/s) 9.52 5.95 Minimum Knee Angle (deg) 38 44 Minimum Hip Angle (deg) 96 116 Knee Extension at toe-off (deg) 149 158 Contact Time (s) 0.106 0.167 Stride Length (m) 4.313 3.74 Shank Angle at touchdown (deg) 0 0 Center of Mass at touchdown (m) 0.328 0.361 Recovery Knee at touchdown (m) 0.269 0.437 Subject 2 Speed (m/s) 9.52 5.95 Minimum Knee Angle (deg) 40 41 Minimum Hip Angle (deg) 100 92 Knee Extension at toe-off (deg) 160 157 Contact Time (s) 0.104 0.144 Stride Length (m) 4.116 3.303 Shank Angle at touchdown (deg) 0 6 Center of Mass at touchdown (m) 0.377 0.321 Recovery Knee at touchdown (m) 0.365 0.172 Subject 3 Speed (m/s) 8.7 5.81 Minimum Knee Angle (deg) 25 38 Minimum Hip Angle (deg) 101 110 Knee Extension at toe-off (deg) 158 167 Contact Time (s) 0.12 0.172 Stride Length (m) 4.725 4.04 Shank Angle at touchdown (deg) 4 6 Center of Mass at touchdown (m) 0.438 0.371 Recovery Knee at touchdown (m) 0.436 0.446 Subject 4 Speed (m/s) 9.26 5.92 Minimum Knee Angle (deg) 32 38 Minimum Hip Angle (deg) 111 117 Knee Extension at toe-off (deg) 146 168 Contact Time (s) 0.1 0.16 Stride Length (m) 4.352 4.069 Shank Angle at touchdown (deg) 2 5 Center of Mass at touchdown (m) 0.353 0.427 Recovery Knee at touchdown (m) 0.372 0.532
52
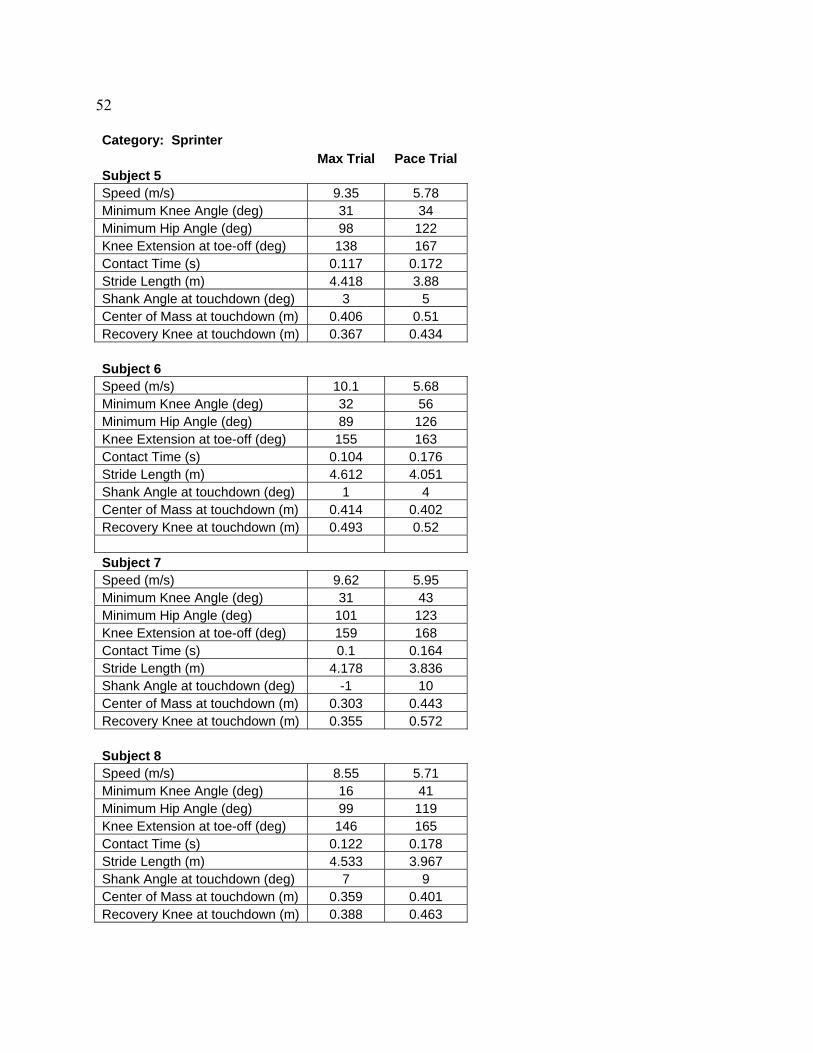
Category: Sprinter Max Trial Pace Trial Subject 5 Speed (m/s) 9.35 5.78 Minimum Knee Angle (deg) 31 34 Minimum Hip Angle (deg) 98 122 Knee Extension at toe-off (deg) 138 167 Contact Time (s) 0.117 0.172 Stride Length (m) 4.418 3.88 Shank Angle at touchdown (deg) 3 5 Center of Mass at touchdown (m) 0.406 0.51 Recovery Knee at touchdown (m) 0.367 0.434 Subject 6 Speed (m/s) 10.1 5.68 Minimum Knee Angle (deg) 32 56 Minimum Hip Angle (deg) 89 126 Knee Extension at toe-off (deg) 155 163 Contact Time (s) 0.104 0.176 Stride Length (m) 4.612 4.051 Shank Angle at touchdown (deg) 1 4 Center of Mass at touchdown (m) 0.414 0.402 Recovery Knee at touchdown (m) 0.493 0.52 Subject 7 Speed (m/s) 9.62 5.95 Minimum Knee Angle (deg) 31 43 Minimum Hip Angle (deg) 101 123 Knee Extension at toe-off (deg) 159 168 Contact Time (s) 0.1 0.164 Stride Length (m) 4.178 3.836 Shank Angle at touchdown (deg) -1 10 Center of Mass at touchdown (m) 0.303 0.443 Recovery Knee at touchdown (m) 0.355 0.572 Subject 8 Speed (m/s) 8.55 5.71 Minimum Knee Angle (deg) 16 41 Minimum Hip Angle (deg) 99 119 Knee Extension at toe-off (deg) 146 165 Contact Time (s) 0.122 0.178 Stride Length (m) 4.533 3.967 Shank Angle at touchdown (deg) 7 9 Center of Mass at touchdown (m) 0.359 0.401 Recovery Knee at touchdown (m) 0.388 0.463
53
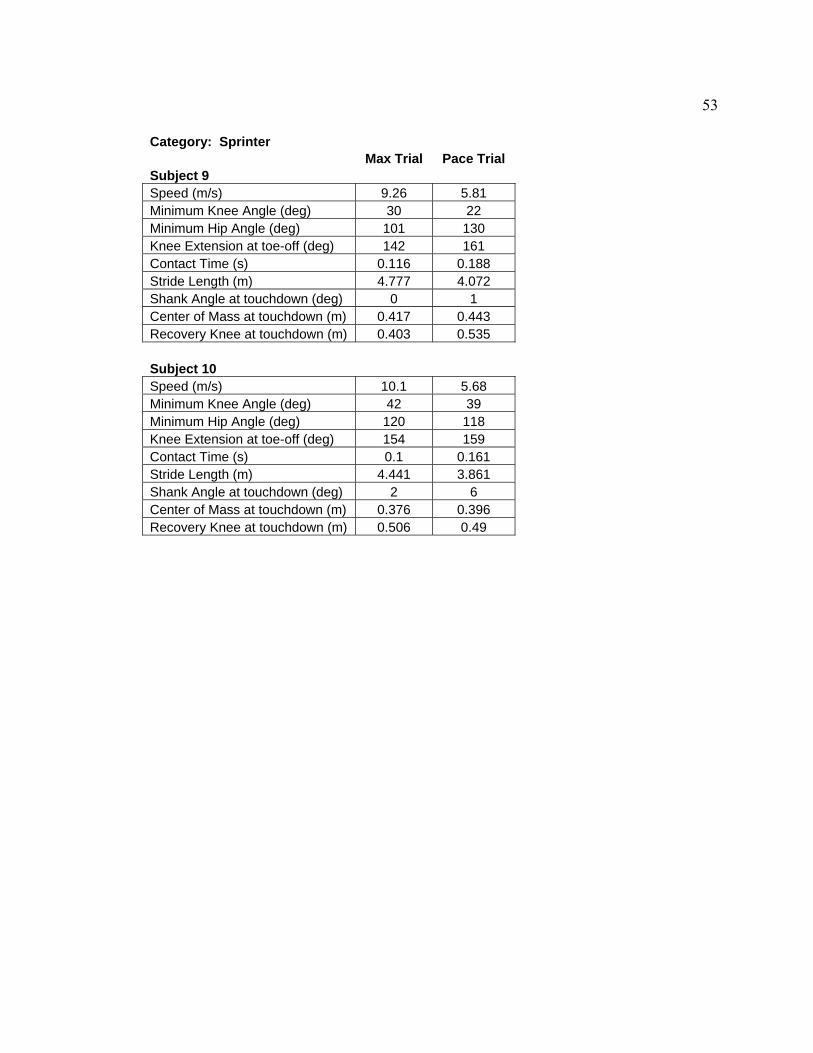
Category: Sprinter Max Trial Pace Trial Subject 9 Speed (m/s) 9.26 5.81 Minimum Knee Angle (deg) 30 22 Minimum Hip Angle (deg) 101 130 Knee Extension at toe-off (deg) 142 161 Contact Time (s) 0.116 0.188 Stride Length (m) 4.777 4.072 Shank Angle at touchdown (deg) 0 1 Center of Mass at touchdown (m) 0.417 0.443 Recovery Knee at touchdown (m) 0.403 0.535 Subject 10 Speed (m/s) 10.1 5.68 Minimum Knee Angle (deg) 42 39 Minimum Hip Angle (deg) 120 118 Knee Extension at toe-off (deg) 154 159 Contact Time (s) 0.1 0.161 Stride Length (m) 4.441 3.861 Shank Angle at touchdown (deg) 2 6 Center of Mass at touchdown (m) 0.376 0.396 Recovery Knee at touchdown (m) 0.506 0.49
54
Category: Distance Max Trial Pace Trial Subject 11 Speed (m/s) 8.7 5.78 Minimum Knee Angle (deg) 40 46 Minimum Hip Angle (deg) 115 124 Knee Extension at toe-off (deg) 166 161 Contact Time (s) 0.111 0.172 Stride Length (m) 4.025 3.545 Shank Angle at touchdown (deg) -1 8 Center of Mass at touchdown (m) 0.414 0.437 Recovery Knee at touchdown (m) 0.605 0.507 Subject 12 Speed (m/s) 8.62 5.92 Minimum Knee Angle (deg) 35 48 Minimum Hip Angle (deg) 103 128 Knee Extension at toe-off (deg) 154 156 Contact Time (s) 0.124 0.18 Stride Length (m) 4.206 3.816 Shank Angle at touchdown (deg) -2 4 Center of Mass at touchdown (m) 0.427 0.464 Recovery Knee at touchdown (m) 0.525 567 Subject 13 Speed (m/s) 8.55 5.75 Minimum Knee Angle (deg) 38 43 Minimum Hip Angle (deg) 120 133 Knee Extension at toe-off (deg) 159 164 Contact Time (s) 0.132 0.18 Stride Length (m) 3.953 3.866 Shank Angle at touchdown (deg) -1 7 Center of Mass at touchdown (m) 0.384 0.488 Recovery Knee at touchdown (m) 0.521 0.721 Subject 14 Speed (m/s) 8.62 5.78 Minimum Knee Angle (deg) 30.4 42 Minimum Hip Angle (deg) 113 116 Knee Extension at toe-off (deg) 161 160 Contact Time (s) 0.111 0.161 Stride Length (m) 4.145 3.574 Shank Angle at touchdown (deg) 0 4 Center of Mass at touchdown (m) 0.367 0.4 Recovery Knee at touchdown (m) 0.401 0.504
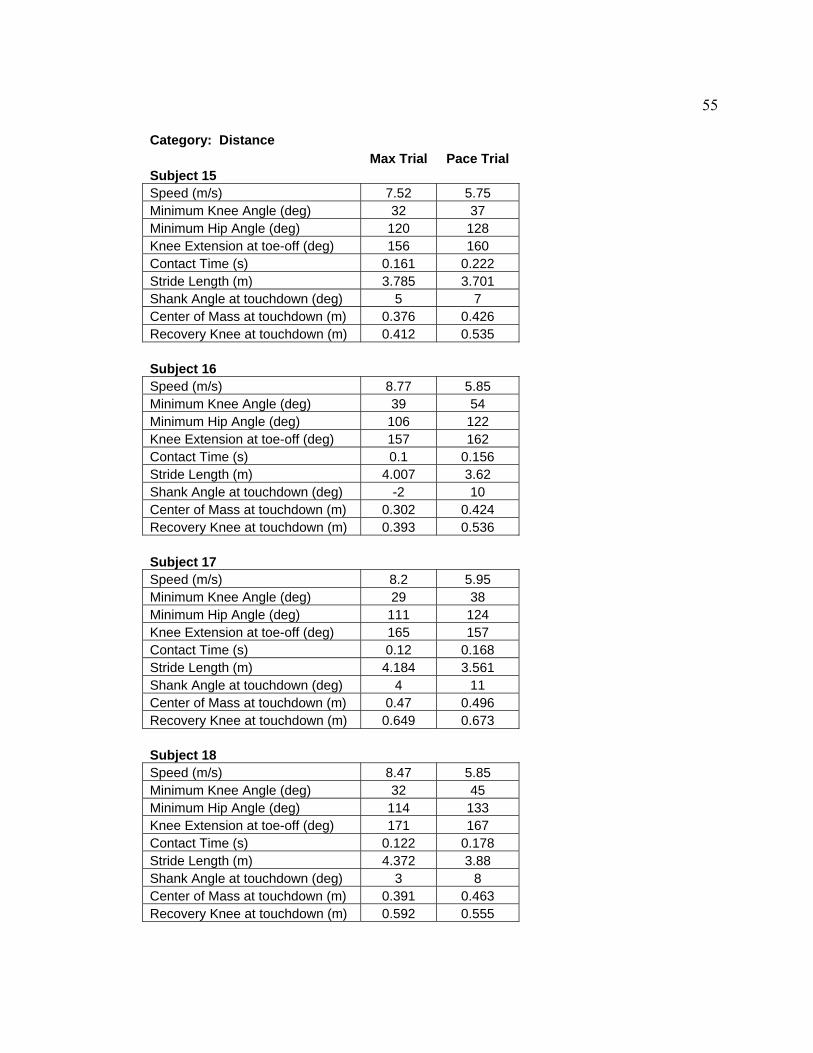
55
Category: Distance Max Trial Pace Trial Subject 15 Speed (m/s) 7.52 5.75 Minimum Knee Angle (deg) 32 37 Minimum Hip Angle (deg) 120 128 Knee Extension at toe-off (deg) 156 160 Contact Time (s) 0.161 0.222 Stride Length (m) 3.785 3.701 Shank Angle at touchdown (deg) 5 7 Center of Mass at touchdown (m) 0.376 0.426 Recovery Knee at touchdown (m) 0.412 0.535 Subject 16 Speed (m/s) 8.77 5.85 Minimum Knee Angle (deg) 39 54 Minimum Hip Angle (deg) 106 122 Knee Extension at toe-off (deg) 157 162 Contact Time (s) 0.1 0.156 Stride Length (m) 4.007 3.62 Shank Angle at touchdown (deg) -2 10 Center of Mass at touchdown (m) 0.302 0.424 Recovery Knee at touchdown (m) 0.393 0.536 Subject 17 Speed (m/s) 8.2 5.95 Minimum Knee Angle (deg) 29 38 Minimum Hip Angle (deg) 111 124 Knee Extension at toe-off (deg) 165 157 Contact Time (s) 0.12 0.168 Stride Length (m) 4.184 3.561 Shank Angle at touchdown (deg) 4 11 Center of Mass at touchdown (m) 0.47 0.496 Recovery Knee at touchdown (m) 0.649 0.673 Subject 18 Speed (m/s) 8.47 5.85 Minimum Knee Angle (deg) 32 45 Minimum Hip Angle (deg) 114 133 Knee Extension at toe-off (deg) 171 167 Contact Time (s) 0.122 0.178 Stride Length (m) 4.372 3.88 Shank Angle at touchdown (deg) 3 8 Center of Mass at touchdown (m) 0.391 0.463 Recovery Knee at touchdown (m) 0.592 0.555
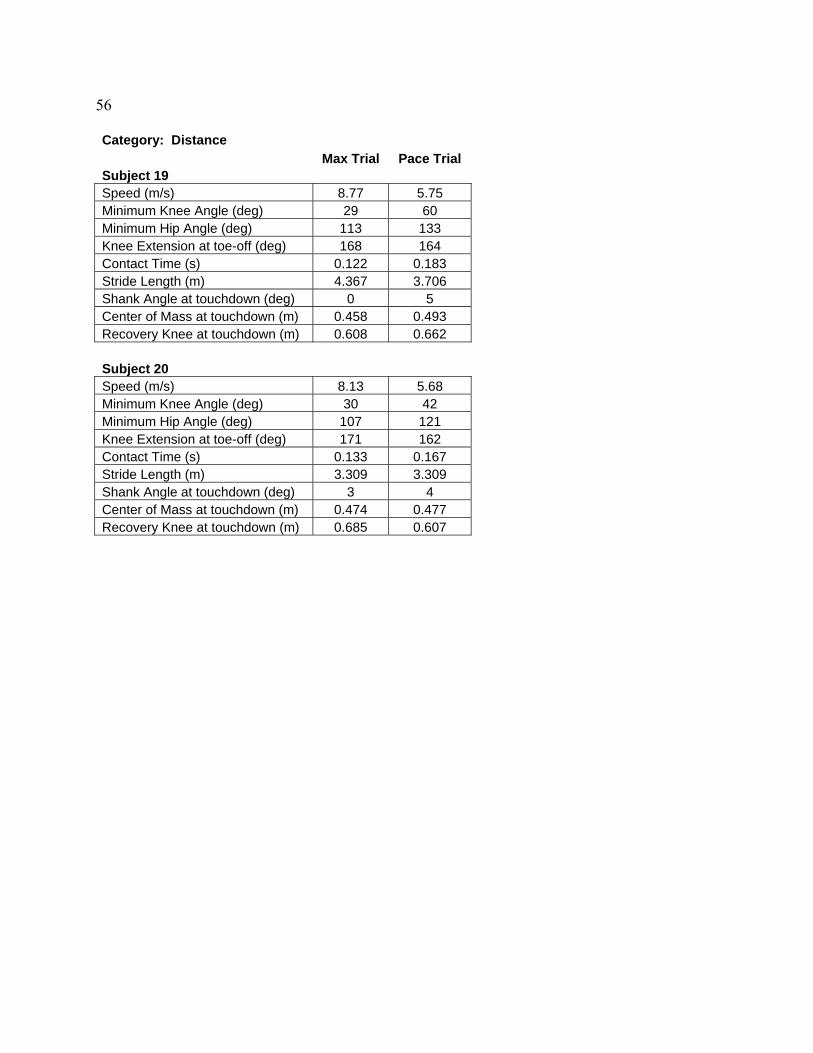
56
Category: Distance Max Trial Pace Trial Subject 19 Speed (m/s) 8.77 5.75 Minimum Knee Angle (deg) 29 60 Minimum Hip Angle (deg) 113 133 Knee Extension at toe-off (deg) 168 164 Contact Time (s) 0.122 0.183 Stride Length (m) 4.367 3.706 Shank Angle at touchdown (deg) 0 5 Center of Mass at touchdown (m) 0.458 0.493 Recovery Knee at touchdown (m) 0.608 0.662 Subject 20 Speed (m/s) 8.13 5.68 Minimum Knee Angle (deg) 30 42 Minimum Hip Angle (deg) 107 121 Knee Extension at toe-off (deg) 171 162 Contact Time (s) 0.133 0.167 Stride Length (m) 3.309 3.309 Shank Angle at touchdown (deg) 3 4 Center of Mass at touchdown (m) 0.474 0.477 Recovery Knee at touchdown (m) 0.685 0.607
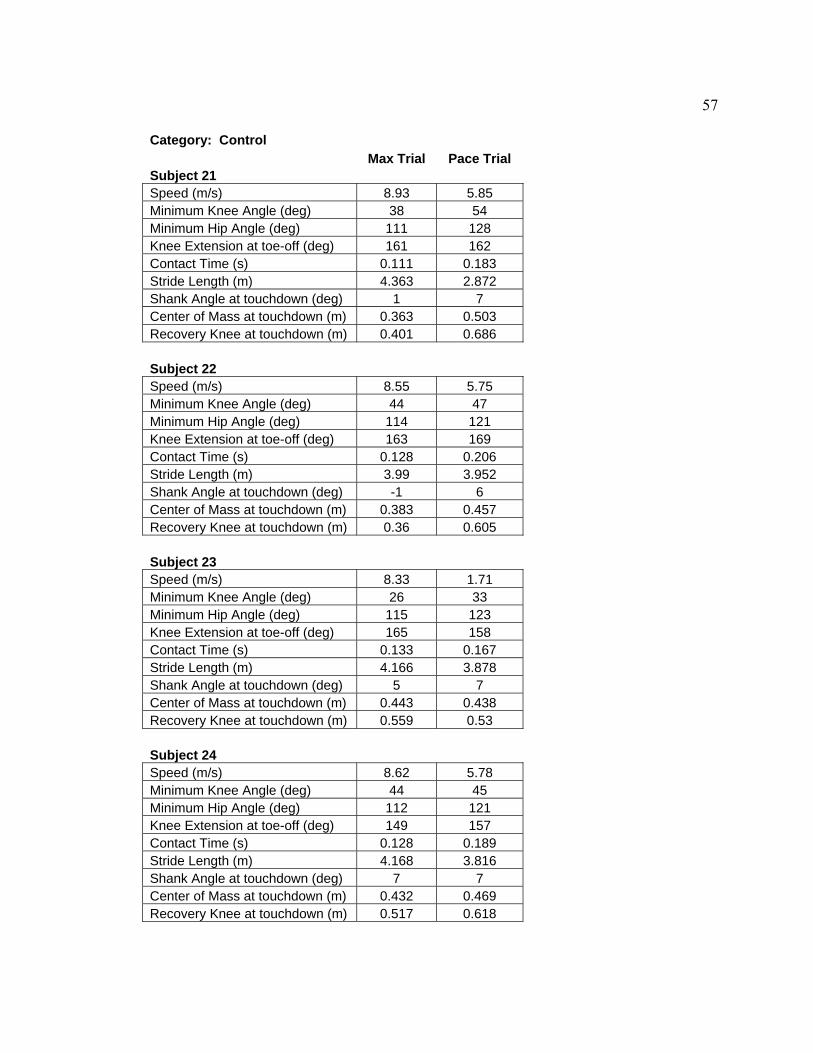
57
Category: Control Max Trial Pace Trial Subject 21 Speed (m/s) 8.93 5.85 Minimum Knee Angle (deg) 38 54 Minimum Hip Angle (deg) 111 128 Knee Extension at toe-off (deg) 161 162 Contact Time (s) 0.111 0.183 Stride Length (m) 4.363 2.872 Shank Angle at touchdown (deg) 1 7 Center of Mass at touchdown (m) 0.363 0.503 Recovery Knee at touchdown (m) 0.401 0.686 Subject 22 Speed (m/s) 8.55 5.75 Minimum Knee Angle (deg) 44 47 Minimum Hip Angle (deg) 114 121 Knee Extension at toe-off (deg) 163 169 Contact Time (s) 0.128 0.206 Stride Length (m) 3.99 3.952 Shank Angle at touchdown (deg) -1 6 Center of Mass at touchdown (m) 0.383 0.457 Recovery Knee at touchdown (m) 0.36 0.605 Subject 23 Speed (m/s) 8.33 1.71 Minimum Knee Angle (deg) 26 33 Minimum Hip Angle (deg) 115 123 Knee Extension at toe-off (deg) 165 158 Contact Time (s) 0.133 0.167 Stride Length (m) 4.166 3.878 Shank Angle at touchdown (deg) 5 7 Center of Mass at touchdown (m) 0.443 0.438 Recovery Knee at touchdown (m) 0.559 0.53 Subject 24 Speed (m/s) 8.62 5.78 Minimum Knee Angle (deg) 44 45 Minimum Hip Angle (deg) 112 121 Knee Extension at toe-off (deg) 149 157 Contact Time (s) 0.128 0.189 Stride Length (m) 4.168 3.816 Shank Angle at touchdown (deg) 7 7 Center of Mass at touchdown (m) 0.432 0.469 Recovery Knee at touchdown (m) 0.517 0.618
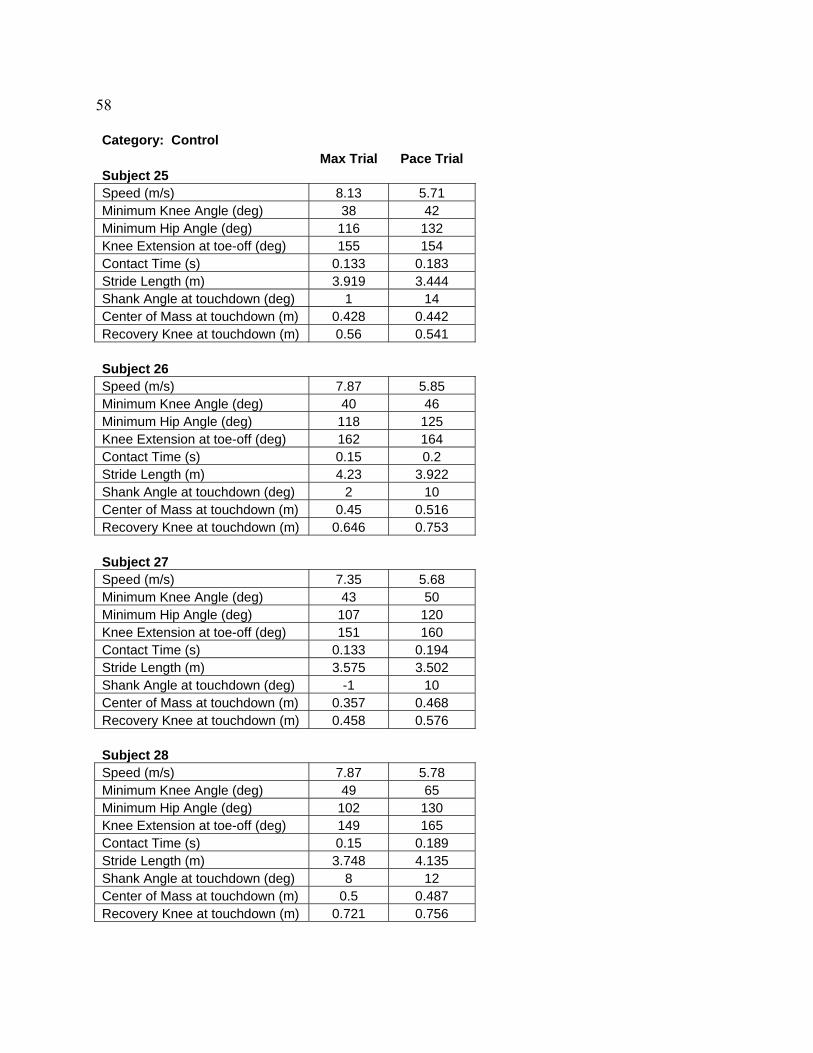
58
Category: Control Max Trial Pace Trial Subject 25 Speed (m/s) 8.13 5.71 Minimum Knee Angle (deg) 38 42 Minimum Hip Angle (deg) 116 132 Knee Extension at toe-off (deg) 155 154 Contact Time (s) 0.133 0.183 Stride Length (m) 3.919 3.444 Shank Angle at touchdown (deg) 1 14 Center of Mass at touchdown (m) 0.428 0.442 Recovery Knee at touchdown (m) 0.56 0.541 Subject 26 Speed (m/s) 7.87 5.85 Minimum Knee Angle (deg) 40 46 Minimum Hip Angle (deg) 118 125 Knee Extension at toe-off (deg) 162 164 Contact Time (s) 0.15 0.2 Stride Length (m) 4.23 3.922 Shank Angle at touchdown (deg) 2 10 Center of Mass at touchdown (m) 0.45 0.516 Recovery Knee at touchdown (m) 0.646 0.753 Subject 27 Speed (m/s) 7.35 5.68 Minimum Knee Angle (deg) 43 50 Minimum Hip Angle (deg) 107 120 Knee Extension at toe-off (deg) 151 160 Contact Time (s) 0.133 0.194 Stride Length (m) 3.575 3.502 Shank Angle at touchdown (deg) -1 10 Center of Mass at touchdown (m) 0.357 0.468 Recovery Knee at touchdown (m) 0.458 0.576 Subject 28 Speed (m/s) 7.87 5.78 Minimum Knee Angle (deg) 49 65 Minimum Hip Angle (deg) 102 130 Knee Extension at toe-off (deg) 149 165 Contact Time (s) 0.15 0.189 Stride Length (m) 3.748 4.135 Shank Angle at touchdown (deg) 8 12 Center of Mass at touchdown (m) 0.5 0.487 Recovery Knee at touchdown (m) 0.721 0.756
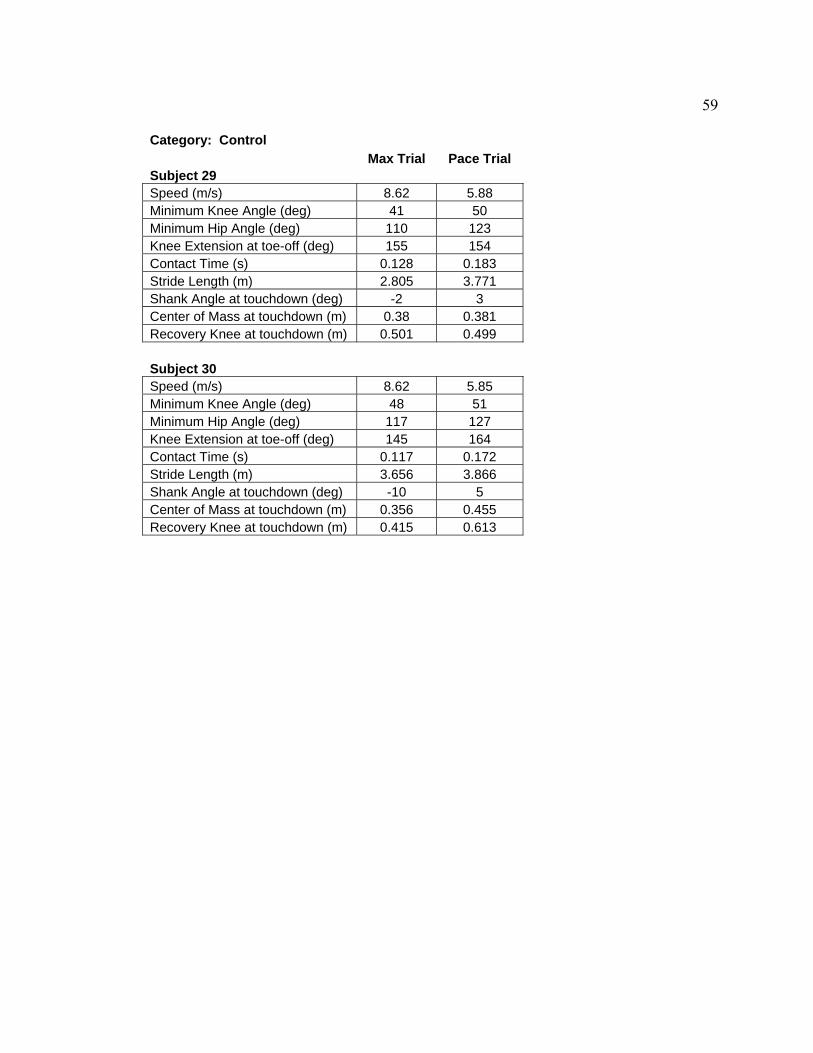
59
Category: Control Max Trial Pace Trial Subject 29 Speed (m/s) 8.62 5.88 Minimum Knee Angle (deg) 41 50 Minimum Hip Angle (deg) 110 123 Knee Extension at toe-off (deg) 155 154 Contact Time (s) 0.128 0.183 Stride Length (m) 2.805 3.771 Shank Angle at touchdown (deg) -2 3 Center of Mass at touchdown (m) 0.38 0.381 Recovery Knee at touchdown (m) 0.501 0.499 Subject 30 Speed (m/s) 8.62 5.85 Minimum Knee Angle (deg) 48 51 Minimum Hip Angle (deg) 117 127 Knee Extension at toe-off (deg) 145 164 Contact Time (s) 0.117 0.172 Stride Length (m) 3.656 3.866 Shank Angle at touchdown (deg) -10 5 Center of Mass at touchdown (m) 0.356 0.455 Recovery Knee at touchdown (m) 0.415 0.613

60