A bending fluctuation-based mechanism for particle ...
7
PHYSICS A bending fluctuation-based mechanism for particle detection by ciliated structures Jean-Baptiste Thomazo a,b , Benjamin Le R ´ ev ´ erend c , Lea-Laetitia Pontani a , Alexis M. Prevost a,1 , and Elie Wandersman a,1 a Laboratoire Jean Perrin, Institut de Biologie Paris-Seine, Sorbonne Universit ´ e, CNRS, F-75005 Paris, France; b Nestl ´ e Development Centre Lisieux, F-14100 Lisieux, France; and c Nestl ´ e Research, CH-1000 Lausanne, Switzerland Edited by Howard A. Stone, Princeton University, Princeton, NJ, and approved June 27, 2021 (received for review December 9, 2020) To mimic the mechanical response of passive biological cilia in complex fluids, we study the bending dynamics of an anchored elastic fiber submitted to a dilute granular suspension under shear. We show that the bending fluctuations of the fiber accu- rately encode minute variations of the granular suspension con- centration. Indeed, besides the stationary bending induced by the continuous phase flow, the passage of each single particle induces an additional deflection. We demonstrate that the dominant par- ticle/fiber interaction arises from contacts of the particles with the fiber, and we propose a simple elastohydrodynamics model to predict their amplitude. Our results provide a mechanistic and statistical framework to describe particle detection by biological ciliated systems. cilia | biomimetism | texture perception L iving organisms can probe the mechanical features of their immediate environment with exquisite precision and rapid- ity. Humans, for instance, are able to discriminate micrometric variations of the roughness of a solid surface in less than a sec- ond, by rubbing their fingertips across it (1). Rodents use their long facial whiskers as tactile organs and have a comparable tac- tile accuracy for object detection and texture discrimination (2, 3). Regardless of the specific features of the tactile organ, the early steps of texture detection processes can be sketched into two phases. The first one is mechanical: Upon contact and slid- ing of the tactile organ, the solid texture elicits mechanical stress fluctuations which are propagated through the tactile organ. The second phase is biological: Mechanosensitive cells embedded in the tactile organ encode the mechanical signal in series of action potentials (4–6). During the first phase, the geometrical and mechanical characteristics of the tactile organ, such as its microstructure and its resonance properties, participate in the texture encoding, by filtering and amplifying rapid fluctuations of the texture induced stress signals (7–11). However, many living organisms live in aquatic environments. Their tactile detection is thus not mediated by solid friction but rather by hydrodynamic interactions. In many cases, aquatic animals and microorganisms use myriads of high aspect ratio hair-like or ciliated structures as tactile organs. Their bending in the liquid can trigger the neural response of mechanosensitive cells embedded at their proximity. Fish, for instance, use their lateral line, a sensory organ made of neuromasts (12, 13), con- sisting of receptive hair cells that bend under flow and allow fish to detect predators, flow magnitude, and direction (12, 14). In vertebrates and mammals, the upper surface of the tongue is almost entirely covered with soft slender structures called fili- form papillae that can bend when submitted to hydrodynamic flows and trigger the response of mechanosensitive channels at their base (15). Filiform papillae are thus likely involved in in- mouth tactile perception (16, 17). Because of cilia’s ubiquity in nature, numerous works have studied the deformation of such cilia under given mechanical stresses, in both in vivo (18) and artificial systems (13, 17, 19). For instance, the bending equilib- rium of an elastic fiber in a simple steady viscous flow has been well characterized and accurately modeled at zero Reynolds number using elastohydrodynamics theories (16, 20). Natural biological environments are, however, more complex, often consisting of unsteady flows of heterogeneous media (com- posed of numerous macromolecules, colloids, granular particles, and even other cells). For instance, liquid food products are usually made of oil in water emulsions, and can also contain protein aggregates and solid particles. Yet, humans can discrim- inate minute variations of such liquid food texture in the oral cavity. They are able, for instance, to detect the presence of micrometric particles in fluids, even at very low concentrations (21, 22). The implication of filiform papillae in food texture perception is highly suspected, but unraveling the precise encod- ing of food texture by such ciliated structures requires further investigations. As for solid texture perception, one can wonder how cili- ated structures do encode the texture of a liquid, that one can define a minima as the viscosity of the carrier fluid and the typ- ical size and concentration of the surrounding particles. This question remains largely unexplored. In this work, we address it with the use of a minimal biomimetic approach that consists in submitting an anchored elastic cylindrical fiber to a granular suspension flow. We establish, both experimentally and theoret- ically, how the fiber bending fluctuations encode the presence of particles in the carrier fluid, as well as their number and their size. We also estimate the typical stresses elicited by par- ticle/fiber interactions in living systems for which the neural responses to mechanical stimuli have been well characterized, Significance For most animals and microorganisms, elongated cell protru- sions known as cilia are key players in the senses of hearing, olfaction, and touch. In homogenous liquid flows, cilia bend and provide a direct measurement of the liquid viscosity. Could cilia be used to detect the presence, concentration, and size of particles in natural heterogeneous environments? Here, we address this question using an anchored artificial cilium submitted to sheared granular suspensions. Combin- ing imaging experiments and modeling, we show that the concentration of particles is encoded within the positional fluctuations of the cilia’s tip and that these mainly result from particle/cilium contacts. Our results suggest that cilia could detect particles as small as their diameter. Author contributions: B.L.R., A.M.P., and E.W. designed research; J.-B.T., A.M.P., and E.W. performed research; J.-B.T., L.-L.P., A.M.P., and E.W. analyzed data; and B.L.R., L.-L.P., A.M.P., and E.W. wrote the paper.y The authors declare no competing interest.y This article is a PNAS Direct Submission.y Published under the PNAS license.y 1 To whom correspondence may be addressed. Email: alexis.prevost@sorbonne- universite.fr or [email protected].y This article contains supporting information online at https://www.pnas.org/lookup/suppl/ doi:10.1073/pnas.2020402118/-/DCSupplemental.y Published July 29, 2021. PNAS 2021 Vol. 118 No. 31 e2020402118 https://doi.org/10.1073/pnas.2020402118 | 1 of 7 Downloaded at INIST CNRS on July 30, 2021
Transcript of A bending fluctuation-based mechanism for particle ...
PHYS
ICS
A bending fluctuation-based mechanism for particledetection by ciliated structuresJean-Baptiste Thomazoa,b, Benjamin Le Reverendc, Lea-Laetitia Pontania , Alexis M. Prevosta,1 ,and Elie Wandersmana,1
aLaboratoire Jean Perrin, Institut de Biologie Paris-Seine, Sorbonne Universite, CNRS, F-75005 Paris, France; bNestle Development Centre Lisieux, F-14100Lisieux, France; and cNestle Research, CH-1000 Lausanne, Switzerland
Edited by Howard A. Stone, Princeton University, Princeton, NJ, and approved June 27, 2021 (received for review December 9, 2020)
To mimic the mechanical response of passive biological cilia incomplex fluids, we study the bending dynamics of an anchoredelastic fiber submitted to a dilute granular suspension undershear. We show that the bending fluctuations of the fiber accu-rately encode minute variations of the granular suspension con-centration. Indeed, besides the stationary bending induced by thecontinuous phase flow, the passage of each single particle inducesan additional deflection. We demonstrate that the dominant par-ticle/fiber interaction arises from contacts of the particles withthe fiber, and we propose a simple elastohydrodynamics modelto predict their amplitude. Our results provide a mechanistic andstatistical framework to describe particle detection by biologicalciliated systems.
cilia | biomimetism | texture perception
L iving organisms can probe the mechanical features of theirimmediate environment with exquisite precision and rapid-
ity. Humans, for instance, are able to discriminate micrometricvariations of the roughness of a solid surface in less than a sec-ond, by rubbing their fingertips across it (1). Rodents use theirlong facial whiskers as tactile organs and have a comparable tac-tile accuracy for object detection and texture discrimination (2,3). Regardless of the specific features of the tactile organ, theearly steps of texture detection processes can be sketched intotwo phases. The first one is mechanical: Upon contact and slid-ing of the tactile organ, the solid texture elicits mechanical stressfluctuations which are propagated through the tactile organ. Thesecond phase is biological: Mechanosensitive cells embeddedin the tactile organ encode the mechanical signal in series ofaction potentials (4–6). During the first phase, the geometricaland mechanical characteristics of the tactile organ, such as itsmicrostructure and its resonance properties, participate in thetexture encoding, by filtering and amplifying rapid fluctuationsof the texture induced stress signals (7–11).
However, many living organisms live in aquatic environments.Their tactile detection is thus not mediated by solid frictionbut rather by hydrodynamic interactions. In many cases, aquaticanimals and microorganisms use myriads of high aspect ratiohair-like or ciliated structures as tactile organs. Their bendingin the liquid can trigger the neural response of mechanosensitivecells embedded at their proximity. Fish, for instance, use theirlateral line, a sensory organ made of neuromasts (12, 13), con-sisting of receptive hair cells that bend under flow and allow fishto detect predators, flow magnitude, and direction (12, 14). Invertebrates and mammals, the upper surface of the tongue isalmost entirely covered with soft slender structures called fili-form papillae that can bend when submitted to hydrodynamicflows and trigger the response of mechanosensitive channels attheir base (15). Filiform papillae are thus likely involved in in-mouth tactile perception (16, 17). Because of cilia’s ubiquity innature, numerous works have studied the deformation of suchcilia under given mechanical stresses, in both in vivo (18) andartificial systems (13, 17, 19). For instance, the bending equilib-rium of an elastic fiber in a simple steady viscous flow has been
well characterized and accurately modeled at zero Reynoldsnumber using elastohydrodynamics theories (16, 20).
Natural biological environments are, however, more complex,often consisting of unsteady flows of heterogeneous media (com-posed of numerous macromolecules, colloids, granular particles,and even other cells). For instance, liquid food products areusually made of oil in water emulsions, and can also containprotein aggregates and solid particles. Yet, humans can discrim-inate minute variations of such liquid food texture in the oralcavity. They are able, for instance, to detect the presence ofmicrometric particles in fluids, even at very low concentrations(21, 22). The implication of filiform papillae in food textureperception is highly suspected, but unraveling the precise encod-ing of food texture by such ciliated structures requires furtherinvestigations.
As for solid texture perception, one can wonder how cili-ated structures do encode the texture of a liquid, that one candefine a minima as the viscosity of the carrier fluid and the typ-ical size and concentration of the surrounding particles. Thisquestion remains largely unexplored. In this work, we addressit with the use of a minimal biomimetic approach that consistsin submitting an anchored elastic cylindrical fiber to a granularsuspension flow. We establish, both experimentally and theoret-ically, how the fiber bending fluctuations encode the presenceof particles in the carrier fluid, as well as their number andtheir size. We also estimate the typical stresses elicited by par-ticle/fiber interactions in living systems for which the neuralresponses to mechanical stimuli have been well characterized,
Significance
For most animals and microorganisms, elongated cell protru-sions known as cilia are key players in the senses of hearing,olfaction, and touch. In homogenous liquid flows, cilia bendand provide a direct measurement of the liquid viscosity.Could cilia be used to detect the presence, concentration,and size of particles in natural heterogeneous environments?Here, we address this question using an anchored artificialcilium submitted to sheared granular suspensions. Combin-ing imaging experiments and modeling, we show that theconcentration of particles is encoded within the positionalfluctuations of the cilia’s tip and that these mainly result fromparticle/cilium contacts. Our results suggest that cilia coulddetect particles as small as their diameter.
Author contributions: B.L.R., A.M.P., and E.W. designed research; J.-B.T., A.M.P., and E.W.performed research; J.-B.T., L.-L.P., A.M.P., and E.W. analyzed data; and B.L.R., L.-L.P.,A.M.P., and E.W. wrote the paper.y
The authors declare no competing interest.y
This article is a PNAS Direct Submission.y
Published under the PNAS license.y1 To whom correspondence may be addressed. Email: [email protected] or [email protected]
This article contains supporting information online at https://www.pnas.org/lookup/suppl/doi:10.1073/pnas.2020402118/-/DCSupplemental.y
Published July 29, 2021.
PNAS 2021 Vol. 118 No. 31 e2020402118 https://doi.org/10.1073/pnas.2020402118 | 1 of 7
Dow
nloa
ded
at IN
IST
CN
RS
on
July
30,
202
1

such as fish neuromasts (23, 24) and the sense of hearing haircells (25).
ResultsFiber Displacement. We monitor, optically, the deflection of thetip of an elastic cylindrical fiber (radius a , height L) made of elas-tomer (Young’s modulus E ; SI Appendix, Material and Methodsand Fig. S1). The base of the elastic fiber is anchored to the bot-tom of a circular pool made of the same elastomer. The pool isfilled with a density-matched granular suspension consisting of adispersion of polystyrene spherical particles (radius R0 = 20, 40,and 70 µm) with a particle volume fraction φ (from 0 to 2%)in a polyethylene glycol (PEG) aqueous solution of viscosity η0(SI Appendix, Material and Methods and Fig. S2B). The suspen-sion is sheared in a rheometer, using a planar circular tool as anupper plate, that rotates at a constant rotation rate ω. Epifluores-cence microscopy is used to measure the modulus δ of the fibertip displacement over time at 100 frames per s (fps). Our resultsare all presented in the steady flow regime. The local shear rateof the flow is γ= rω/H , where r is the radial position of thefiber with respect to the rotation axis of the rheometer cell andH is the gap distance from the base of the pool to the lower sur-face of the rotating plate (Fig. 1A, Top; SI Appendix, Material andMethods for the flow parameters values). The Reynolds numbersassociated with the fiber and with the particles are both small,on the order of 10−3. The typical relaxation time of the elas-tic fiber in the viscous flow is teh = 4πη0L
4/EI (ln (2L/a) + 1/2)with I =πa4/4 as the area moment of inertia of the cylin-drical fiber. Its value (here about 1 ms) is small with respectto the flow timescale (teh� γ−1) so that the fiber can besafely modeled in the quasi-static limit (16, 26). Biological ciliain natural environments are usually evolving in similar flowregimes (16, 24, 27).
An experiment consists of a 1-min-long sequence of shear.Each experiment is repeated many times (n = 5 to 20) to have asignificant estimate of the variance of δ. Without particles (φ=0),the tip deflection is induced by viscous stresses of the continuousphase flow, which has a Newtonian rheology (SI Appendix, Fig.S2B). As we have shown previously in ref. 17, for an anchoredfiber sheared in a Newtonian fluid in the steady flow regime,
its tip deflection δ0 is proportional to the local shear stressδ0 =K0L
5/a4η0γ/E . The prefactor K0 has to be determinedexperimentally, as performed in ref. 17. Due to the variationsof the fiber length L and the Young’s modulus E from fiber tofiber, its value has to be systematically measured and lies typi-cally between one and five. When a granular suspension (φ 6= 0)is sheared in the system, δ(t) displays discrete spikes, whosenumber in a given time interval increases with the particle vol-ume fraction φ (Fig. 1B). The following focuses on the statisticalproperties of the noise of the displacement measurements andits physical origin.
Bending Statistics in Granular Suspensions. When a granular sus-pension is sheared, the signal δ(t) resembles that of a train ofspikes. In the low particle volume fraction limit explored here,each particle passage induces a spike due to the tip displacementof the fiber. Typically, δ(t) has a baseline signal of amplitude δmp
on the top of which discrete spikes are overlapped, due to theseparticle/fiber interactions. Experimentally, we extract δmp as thedisplacement corresponding to the maximum of the probabilitydensity function p(δ) (SI Appendix, Fig. S3). We find that thevalue of δmp is, within experimental error bars, identical to thedeflection due to the continuous phase δ0 (SI Appendix, Fig. S3,Insets). Spikes have an amplitude Aδ , whose physical origin andvalue will be discussed in depth farther down, and have a typicaltime duration τd that we resolve experimentally (Fig. 1C). Sincethe dispersion of particles is spatially homogeneous, the signalis not time correlated, and the autocorrelation of δ(t) typicallydecays to zero on a timescale of the order of τd (SI Appendix, Fig.S4A). The power spectrum of δ(t) is flat up to a cutoff frequencyof order 1/τd (SI Appendix, Fig. S4 B and C), beyond which itabruptly decays. We have checked, both theoretically and exper-imentally, that shear-induced migration of the particles did notoccur on the timescale of the experiments (SI Appendix, Materialand Methods).
We have first measured the variation of the normalized aver-aged deflection 〈δ〉 / 〈δ0〉 as a function of the particle volumefraction (Fig. 2, Inset), where brackets denote an average overtime and over the n repetitions of the experiments, includ-ing different fibers and different suspensions. In this range of
Hy Rotating plater
5x
A
55xxxxxxxx
Granularsuspension B C
t (s)
(µm
)(µ
m)
t (s) t (s)
t (s) t (s)t (s) t (s)
(µm
)
kk 1 k + 1
k
k
k
0 0.5 1 1.5 2 2.5
5.6
5.4
5.2
5
4.8L
2a
Fig. 1. (A) (Top) Sketch of the experimental setup. A circular pool made of elastomer, the bottom of which is decorated with cylindrical fibers, is filledwith a granular suspension and placed at the static bottom of a rheometer. The rotating tool of the rheometer is rotated to shear the granular suspension.An epifluorescence microscope, whose objective is placed underneath, images the displacements of fluorescent microparticles embedded at the tip ofthe fiber. (Middle) Typical fluorescence images of the tip of the fiber, in the absence of flow (Left) and in steady flow (Right). (Bottom) Sketch of thegeometrical properties of the fiber at rest (Left) and deformed in a steady flow (Right). (B) Typical time traces of the fiber tip displacements for a particlesize R0 = 40 µm with φ= 0 (Left, blue curve), φ= 0.5% (Middle, red curve) and φ= 2% (Right, yellow curve). For each trace, a zoom in time (shadedregion) is shown just below to highlight a few spike events induced by a particle/fiber interaction. (C) Three different spikes labeled k− 1, k, and k + 1.The spike k has an amplitude Ak
δ and a duration τkd . The waiting time between spike k and k + 1 is τk
w . The most probable value of the deflection,δmp, is shown with the dashed line. The solid line is a fit of the k + 1th event with a symmetric double exponential pulse whose full expression is givenin SI Appendix.
2 of 7 | PNAShttps://doi.org/10.1073/pnas.2020402118
Thomazo et al.A bending fluctuation-based mechanism for particle detection by ciliated structures
Dow
nloa
ded
at IN
IST
CN
RS
on
July
30,
202
1
PHYS
ICS
10-1 100
(%)
10-4
10-3
10-2
10-1
100
2 -
02 [
m2]
R0 = 20 m
R0 = 40 m
R0 = 70 m
10-1 1000.5
1
1.5
0
(%)
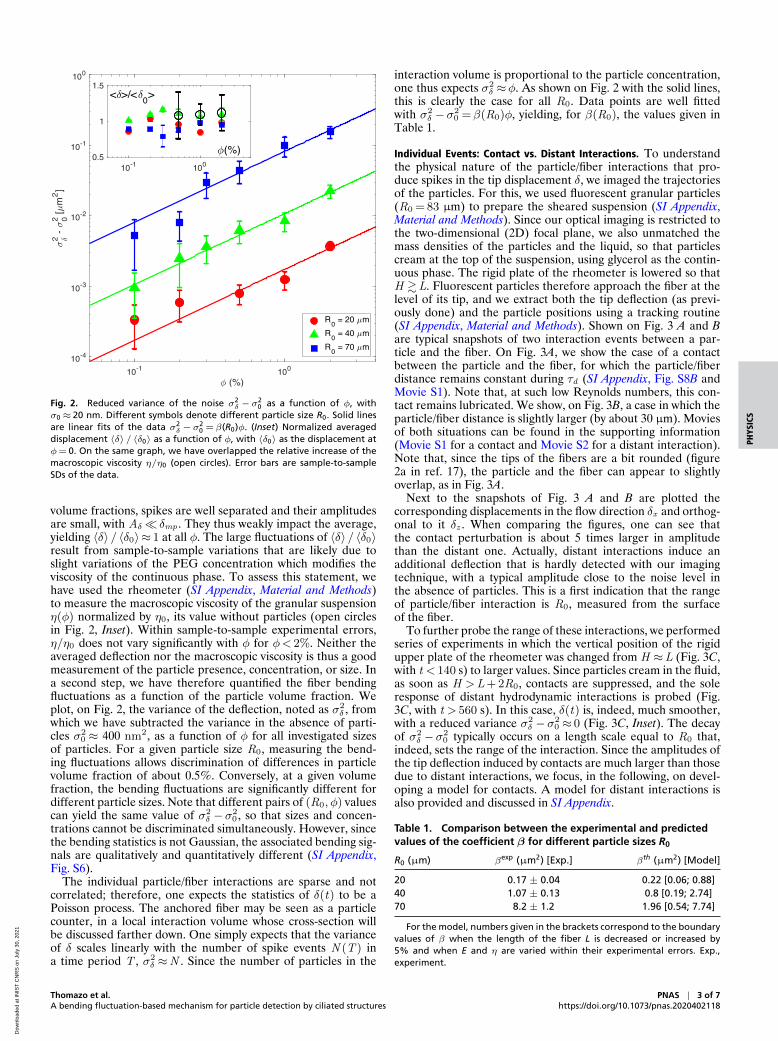
Fig. 2. Reduced variance of the noise σ2δ −σ
20 as a function of φ, with
σ0≈ 20 nm. Different symbols denote different particle size R0. Solid linesare linear fits of the data σ2
δ −σ20 = β(R0)φ. (Inset) Normalized averaged
displacement 〈δ〉 / 〈δ0〉 as a function of φ, with 〈δ0〉 as the displacement atφ= 0. On the same graph, we have overlapped the relative increase of themacroscopic viscosity η/η0 (open circles). Error bars are sample-to-sampleSDs of the data.
volume fractions, spikes are well separated and their amplitudesare small, with Aδ� δmp . They thus weakly impact the average,yielding 〈δ〉 / 〈δ0〉≈ 1 at all φ. The large fluctuations of 〈δ〉 / 〈δ0〉result from sample-to-sample variations that are likely due toslight variations of the PEG concentration which modifies theviscosity of the continuous phase. To assess this statement, wehave used the rheometer (SI Appendix, Material and Methods)to measure the macroscopic viscosity of the granular suspensionη(φ) normalized by η0, its value without particles (open circlesin Fig. 2, Inset). Within sample-to-sample experimental errors,η/η0 does not vary significantly with φ for φ< 2%. Neither theaveraged deflection nor the macroscopic viscosity is thus a goodmeasurement of the particle presence, concentration, or size. Ina second step, we have therefore quantified the fiber bendingfluctuations as a function of the particle volume fraction. Weplot, on Fig. 2, the variance of the deflection, noted as σ2
δ , fromwhich we have subtracted the variance in the absence of parti-cles σ2
0 ≈ 400 nm2, as a function of φ for all investigated sizesof particles. For a given particle size R0, measuring the bend-ing fluctuations allows discrimination of differences in particlevolume fraction of about 0.5%. Conversely, at a given volumefraction, the bending fluctuations are significantly different fordifferent particle sizes. Note that different pairs of (R0,φ) valuescan yield the same value of σ2
δ −σ20 , so that sizes and concen-
trations cannot be discriminated simultaneously. However, sincethe bending statistics is not Gaussian, the associated bending sig-nals are qualitatively and quantitatively different (SI Appendix,Fig. S6).
The individual particle/fiber interactions are sparse and notcorrelated; therefore, one expects the statistics of δ(t) to be aPoisson process. The anchored fiber may be seen as a particlecounter, in a local interaction volume whose cross-section willbe discussed farther down. One simply expects that the varianceof δ scales linearly with the number of spike events N (T ) ina time period T , σ2
δ ≈N . Since the number of particles in the
interaction volume is proportional to the particle concentration,one thus expects σ2
δ ≈φ. As shown on Fig. 2 with the solid lines,this is clearly the case for all R0. Data points are well fittedwith σ2
δ −σ20 =β(R0)φ, yielding, for β(R0), the values given in
Table 1.
Individual Events: Contact vs. Distant Interactions. To understandthe physical nature of the particle/fiber interactions that pro-duce spikes in the tip displacement δ, we imaged the trajectoriesof the particles. For this, we used fluorescent granular particles(R0 = 83 µm) to prepare the sheared suspension (SI Appendix,Material and Methods). Since our optical imaging is restricted tothe two-dimensional (2D) focal plane, we also unmatched themass densities of the particles and the liquid, so that particlescream at the top of the suspension, using glycerol as the contin-uous phase. The rigid plate of the rheometer is lowered so thatH &L. Fluorescent particles therefore approach the fiber at thelevel of its tip, and we extract both the tip deflection (as previ-ously done) and the particle positions using a tracking routine(SI Appendix, Material and Methods). Shown on Fig. 3 A and Bare typical snapshots of two interaction events between a par-ticle and the fiber. On Fig. 3A, we show the case of a contactbetween the particle and the fiber, for which the particle/fiberdistance remains constant during τd (SI Appendix, Fig. S8B andMovie S1). Note that, at such low Reynolds numbers, this con-tact remains lubricated. We show, on Fig. 3B, a case in which theparticle/fiber distance is slightly larger (by about 30 µm). Moviesof both situations can be found in the supporting information(Movie S1 for a contact and Movie S2 for a distant interaction).Note that, since the tips of the fibers are a bit rounded (figure2a in ref. 17), the particle and the fiber can appear to slightlyoverlap, as in Fig. 3A.
Next to the snapshots of Fig. 3 A and B are plotted thecorresponding displacements in the flow direction δx and orthog-onal to it δz . When comparing the figures, one can see thatthe contact perturbation is about 5 times larger in amplitudethan the distant one. Actually, distant interactions induce anadditional deflection that is hardly detected with our imagingtechnique, with a typical amplitude close to the noise level inthe absence of particles. This is a first indication that the rangeof particle/fiber interaction is R0, measured from the surfaceof the fiber.
To further probe the range of these interactions, we performedseries of experiments in which the vertical position of the rigidupper plate of the rheometer was changed from H ≈L (Fig. 3C,with t < 140 s) to larger values. Since particles cream in the fluid,as soon as H >L+ 2R0, contacts are suppressed, and the soleresponse of distant hydrodynamic interactions is probed (Fig.3C, with t > 560 s). In this case, δ(t) is, indeed, much smoother,with a reduced variance σ2
δ −σ20 ≈ 0 (Fig. 3C, Inset). The decay
of σ2δ −σ2
0 typically occurs on a length scale equal to R0 that,indeed, sets the range of the interaction. Since the amplitudes ofthe tip deflection induced by contacts are much larger than thosedue to distant interactions, we focus, in the following, on devel-oping a model for contacts. A model for distant interactions isalso provided and discussed in SI Appendix.
Table 1. Comparison between the experimental and predictedvalues of the coefficient β for different particle sizes R0
R0 (µm) βexp (µm2) [Exp.] βth (µm2) [Model]
20 0.17 ± 0.04 0.22 [0.06; 0.88]40 1.07 ± 0.13 0.8 [0.19; 2.74]70 8.2 ± 1.2 1.96 [0.54; 7.74]
For the model, numbers given in the brackets correspond to the boundaryvalues of β when the length of the fiber L is decreased or increased by5% and when E and η are varied within their experimental errors. Exp.,experiment.
Thomazo et al.A bending fluctuation-based mechanism for particle detection by ciliated structures
PNAS | 3 of 7https://doi.org/10.1073/pnas.2020402118
Dow
nloa
ded
at IN
IST
CN
RS
on
July
30,
202
1

0 200 400 600 800 1000t (s)
0
5
10
15
20
25
30
35
40
Longitudinal
Transverse
A
B
x
z
CH
Longitudinal
Transverse
H-L
= 2
R0
0
1
2
0 0.5 1 1.5 2 2.5t (s)
-2
-1
0
1
0
0.1
0.2
0 0.5 1 1.5 2 2.5t (s)
-0.3
0
0.3
Fig. 3. A particle interacting with the artificial cilium. (A) (Left) Snapshots of a typical contact interaction between a fluorescent particle (R0 = 83 µm,circled in orange at different times) and the fiber (circled in red at its steady-state position, prior to contact). The trajectory of the particle is shown with theorange dashed line. The white bar is 200 µm long. (Right) The corresponding reduced displacements δ− δmp of the tip versus time t in both the directionof the flow x (Top) and in the z direction, orthogonal to the flow (Bottom). (B) (Left) A typical hydrodynamic distant interaction between a fluorescentparticle (circled in blue) and the fiber (circled in red). (Right) As in A, the corresponding displacements δ− δmp of the tip in both the x (Top) and z (Bottom)directions. (C) |δ| versus time t for 10 increasing values of the gap H− L, varying from 10 µm to 280 µm in increments of 30 µm. For these experiments,the nonfluorescent particles with the average radius R0 = 70 µm were used. (Inset) Reduced variance σ2
δ −σ20 as a function of the gap H− L. Error bars
correspond to the mean SD of σ2δ −σ
20 obtained on five successive experiments performed in the same conditions. The vertical dashed line corresponds to
H− L = 2R0. Colors are the same as in the main panel.
Theoretical ModelingStatistical Modeling of the Spike Train. The statistical propertiesof a train of random spikes have been described by Garcia andcoworkers (28, 29). Following their work, for a duration T , δ(t)can be written as the discrete sum of N (T ) random successivespikes as
δ(t) = δmp +
N (T)∑k=1
Akδ(y , z )Π
(t − tk
τd
), [1]
where Akδ(y , z ) is the random amplitude of the k th spike, and
Π(x ) is a function describing the shape of the spike (taken hereas a symmetric double exponential pulse; see Fig. 1C and its fullexpression in SI Appendix), centered on the time tk of a givenspike, and denoting τd as its duration (Fig. 1C). Note that theuse of a symmetric double exponential pulse was simply cho-sen because it fits the experimental spike shape and allows fora simple computation of the normalization integral I2 of Eq. 2defined farther down. This choice is not supported by any phys-ical model. Both the spike duration τd and its amplitude Ak
δ arerandom variables that depend on the random (y0, z0) coordi-nates of the granular particles that interact with the fiber (seethe sketch of Fig. 4A). Denoting 〈τw 〉 as the average waiting timebetween spikes, the variance of δ can be derived, by computingthe long time averaging of the square of Eq. 1, under assump-tions both that the spikes are independent and that they are wellseparated τd� τw . One obtains
σ2δ =
⟨A2
δτd⟩
〈τw 〉I2, [2]
where the average is taken on the particle coordinates disorder,and I2 =
∫∞−∞Π2(x )dx = 1/2 is a shape normalization integral.
The average waiting time between spikes 〈τw 〉 can be estimatedfrom the flux of particles that effectively interact with the fiber,
τw =Vp/(φL2γb) with Vp = 4/3πR3
0 as the particle volume andb = a +R0 as the characteristic impact parameter length of theparticle/fiber interaction. We now provide a physical estimate of⟨A2
δτd⟩
for contact interactions.
Model for the Particle/Fiber Contact. In the case of a contact, weassume that the fiber experiences an enhanced drag force dueto the presence of the particle in its immediate vicinity, respon-sible for the additional bending of the fiber. We model thisforce as a simple Stokes drag F(y0, z0) =−6πη0R0u, where uis taken as the local fluid velocity around a cylindrical obsta-cle (SI Appendix) and where y0 (respectively, z0) is the vertical(respectively, lateral) coordinate of the particle (see the sketchof Fig. 4A). Since the elastohydrodynamic relaxation time of thefiber (teh ≈ 1 ms) is much smaller than the interaction dura-tion (τd ≈ 0.1 s), the bending dynamics is not governed by therelaxation timescale of the fiber, and the additional deflectioncan be modeled in the quasi-static limit. For the sake of sim-plicity, we only keep the radial component of the force, alongthe particle/fiber center-to-center direction. Using linear elas-ticity theory, the fiber profile δ(y) can be solved, writing thatδ′′
(y) =F (y0, z0)/EI (y0− y), where the prime symbol standsfor a spatial y derivative and I =πa4/4 is the area moment ofinertia of the fiber. Considering the boundary conditions (fiberclamped at its base so that δ(0) = 0, and δ′(0) = 0, pinned atthe contact point so that δ′(y−0 ) = δ′(y+
0 ) and free at its tip sothat δ
′′(y > y0) = 0), we obtain the following expression for the
amplitude Aδ:
Aδ =4ηγ
E
(1− a2
(a +R0)2
)R0y
30 (3L− y0)
a4
√1−
(z0
R0 + a
)2.
[3]
Looking at the experiments with fluorescent granular particles,we observe that, during a contact event, the particle encounters
4 of 7 | PNAShttps://doi.org/10.1073/pnas.2020402118
Thomazo et al.A bending fluctuation-based mechanism for particle detection by ciliated structures
Dow
nloa
ded
at IN
IST
CN
RS
on
July
30,
202
1

PHYS
ICS
z
y
x
z0
y0
U∞(y)
r0
A
B
z
x
U∞(y0)
F(y0,z0)
3D view Plane y = y0
R0 / L10-3 10-2 10-1 100
10-8
10-7
10-6
10-5
10-4
10-3
Fig. 4. (A) Sketch of the physical situation for a particle/fiber contact inter-action. (Left) The 3D view. (Right) Top view in the plane y = y0. U∞ denotesthe flow magnitude far away from the fiber. (B) Red disks correspond tothe experimental values of β (Table 1) divided by L2 as a function of thenormalized particle size R0/L .The solid line corresponds to the theoreti-cal predictions of the contact model, with a = 50 µm, L = 435 µm, E = 2.7MPa, and η= 119.7 mPa·s. The dashed lines estimate the model predictionlimits taking ±5% variations in L and variations of E and η within theirexperimental errors.
the fiber at a lateral position z0, which is a random variable. Inthe fiber frame, it corresponds to an angular coordinate θi (SIAppendix, Fig. S8A). The particle detaches from the fiber at anangle θf . Experimentally, we found that θf weakly depends onθi , with <θf > = 108± 4◦ (SI Appendix, Fig. S8C). We makethe crude assumption that the particle travels a distance (a +R0)(θf − θi), at the unperturbed flow velocity γy0, yielding τd =θf (a +R0)− z0/γy0. We can thus average out A2
δτd over space,taking into account a uniform distribution for the (y0, z0) par-ticle coordinates. After all computations have been made, one
finally gets (see the full calculation in SI Appendix, TheoreticalModeling)(σδ
L
)2=
4θfπ
(ηγ
E
)2(L
a
)8(R0 + 2a
R0 + a
)2×P2(R0/L)×φ, [4]
with P2(x ) = 43/56x + 4x2 + 8x3 + 7x4 + 5/4x5− 2x6−5/2x7 + x8.
Comparison of this model’s predictions with the experimen-tal data was done in the following way. First, we looked atan individual contact event with the fluorescent particles dataand compared the model prediction for Aδ(y0≈L, z0), as pro-vided by Eq. 3, to the experiments. For moderate deflections(Aδ <δmp), we find that our model is in reasonable agreementwith the data for both Aδ and τd (SI Appendix, Fig. S8D). Wethen confronted our model with the dataset of different parti-cle concentrations and sizes (density-matched suspensions). Aswe mentioned above, the signal δ(t) is that of a particle counter,which explains the scaling σ2
δ ≈φ with the particle concentrationφ. The SD σδ is also expected to scale linearly with the strainrate, in agreement with the experimental data (SI Appendix, Fig.S7B). We have also compared the experimental values of β/L2
(Fig. 2) to its predicted ones as obtained from Eq. 4 and given inTable 1. As shown on Fig. 4B, within experimental error bars, andwithout any adjustable parameters, our model describes well thevariation of β with the particle size R0. Averaging over the threeparticle sizes, we find
⟨βexp/βth
⟩≈ 2.1, which is in the range of
the measured values of the calibration factor K0 in a shear flowwithout particles.
DiscussionSeveral conclusions can be drawn from our results. On a phys-ical side, the increase of particle volume fraction leads, at themacroscopic scale, to an increase of the shear viscosity, accordingto Einstein’s law for suspensions: η/η0 = 1 + 5/2φ+ o(φ2). Thisrelationship has been verified experimentally using standard rhe-ological methods (30, 31), but mostly at particle volume fractionslarger than a few percent. Detecting a particle volume fractionof particles lower than 1% using a viscosity measurement would,indeed, require a relative error on η better than ∼ 2%. Such asmall error is beyond current rheometry experimental errors, dueto rheological artifacts such as gap detection (32) or the presenceof a rim at the edge of the sample (33), which both lead, typically,to relative errors on the order of 10%.
Actually, to discriminate the macroscopic viscosities of thesuspensions, the biomimetic cilium is not more efficient than arheometer, since it does not capture the “mean field” increaseof the macroscopic viscosity. Within our experimental error bars,the average deflection does not vary significantly with the particlevolume fraction φ. However, the biomimetic cilium is very sen-sitive to the local environment heterogeneity through repeatedparticle/fiber interactions. The interaction between an anchoredelastic fiber and granular particles has already been explored, butmostly with active ciliated assemblies adhering to particles in sus-pensions (34, 35), to mimic the beating of some biological cilia,for instance, in the context of mucus cleaning in the lungs. Inref. 36, the authors show that, by varying the adhesion strength,particles can be either released, propelled, or trapped by cilia.Surprisingly, the apparently simpler case of a nonadhesive par-ticle interacting with a passive and isolated cilium has been lessinvestigated. Nonadhesive particle/cilia interactions were probedin ref. 37 but in the limit R0� a . Severe deformations of thepillar assemblies are observed that could lead to the rupture ofthe cilia. Our work contrasts with these results by focusing onthe case of nonadhesive particles with R0≈ a , interacting withan isolated cilium.
In living systems, mechanoreceptors are usually located atthe base of the cilia, and one can question whether these
Thomazo et al.A bending fluctuation-based mechanism for particle detection by ciliated structures
PNAS | 5 of 7https://doi.org/10.1073/pnas.2020402118
Dow
nloa
ded
at IN
IST
CN
RS
on
July
30,
202
1

individual particle/cilium interactions induce sufficient mechani-cal signals to trigger a neural and behavioral response. Humansare capable of detecting, with their tongues, the presence ofrigid particles in fluids with sizes as low as 2 µm and concen-trations as low as 5% (21). This detection was experimentallyfound to depend on the size of the particles, their concentration,and the carrier liquid viscosity (22). These behavioral experi-ments tend to show that particles do induce a neural response,even though it has not been explicitly measured. Usually, theneural response threshold of ciliated structures is obtained byindenting the tip of the cilia while recording the activity ofbasal mechanoreceptors. This response threshold correspondsto a torque, at the base of the cilium, that has to be com-pared here with the typical torque induced by a cilium/particlecontact.
In the case of a contact between a single particle and a cilium,the base torque Mb can be deduced from the cilium base cur-vature and is given by Mb =EI δ
′′(y = 0) =Fy0, where F is the
Stokes viscous force mentioned above. For multiple interactions,an average torque 〈Mb〉 can be computed by averaging over allpossible particle positions (see the full derivation in SI Appendix).Assuming a uniform flow of velocity U∞ and for particles of sizeR0≈ a , one finds that
〈Mb〉≈9
16π2ηU∞a(L+ 2a). [5]
Measurements of base torques in ciliated living systems arerather scarce. One of the most thoroughly studied ciliated sys-tems is the lateral line of the Zebrafish larvae, which is composedof superficial neuromasts. These can be assimilated to slen-der cylindrical structures of typical length L≈ 40 µm and basediameter 2a ≈ 8 µm. Using either laser interferometry or directmicrofiber indentation, a typical bending base torque of about3.10−15 N·m was estimated (23, 24). How does this value com-pare to the mean base torque induced by particle/neuromastsinteractions? For a larvae swimming in water (viscosity η≈ 1mPa·s) with a typical velocity U∞≈ 10−2 m/s (38), Eq. 5 yields〈Mb〉≈ 10−14 N·m, a value that compares well with the aboveestimation. Could such a base torque value be sufficient to inducea neural response from the neuromast afferent fibers? To thebest of our knowledge, on Zebrafish larvae, no measurementsthat combine torque estimates together with electrophysiologymeasurements were actually provided. Such combined measure-ments have, in fact, been performed by Hudspeth and coworkersin another, yet closely related system, the hair bundle of theBullfrog saccular hair cell (25) that has similar sizes and compli-ance to the neuromast. In their work, Hudspeth and coworkersshow that the onset of the neural response is triggered forforces acting on the bundle F ≈ 10−11 N. Since the bundlehas a typical height of 10 µm, this force yields a thresholdbase torque Mb ≈ 10−16 N·m that is smaller than our predictedvalue.
This strongly suggests that a single contact interaction betweenthe cilium and micrometer-sized particles could therefore bedetectable by the lateral line of fish or any comparable hair cellstructures. It is known, for instance, that cilia are involved in theleft/right symmetry breaking during embryogenesis, possibly viathe detection of morphogens’ filled vesicles (39). For a ciliatedbiological system to measure particle concentrations, a statisticalmeasurement over time of several of these individual events isrequired. Our results show that the variance of the bending sig-nal could be used by biological systems to discriminate sizes or
concentrations. In biological systems, it is well known that sen-sory systems also encode stimuli with the precise timing of theevents (1). Encoding, simultaneously, both sizes and concentra-tions therefore calls for a more refined statistical analysis and adirect confrontation with biological systems. For instance, onecould image the fluctuating deflections of a cilium under theflow of a colloidal suspension at various concentrations and per-form, at the same time, electrophysiological measurements of itsafferent neurons.
Materials and MethodsFiber Fabrication. Elastic fibers were obtained using micromilling and mold-ing techniques fully described in ref. 17 and recalled in SI Appendix, Materialand Methods. They are made of a polydimethylsiloxane elastomer (PDMS;Sylgard 184, Dow Corning; cross-linking ratio 10:1, Young’s modulus E≈2.7± 0.8 MPa) and consist of cylinders (height L=435±20 µm, radius a=50µm) whose base is anchored to a circular pool made of the same elastomer.To image their displacements with fluorescence microscopy, their tips wereseeded with fluorescent microspheres (diameter≈ 5 µm) using the protocoldescribed in ref. 17.
Granular Suspensions. Two types of granular suspensions were used. Thefirst one consisted of a suspension of polystyrene spherical particles (TS-40,TS-80, and TS-140 of mean radius R0 = 20, 40 and 70 µm, respectively [SIAppendix, Fig. S2A ], mass density 1.05 g/cm3, Dynoseeds, Microbeads) dis-persed in a dilute solution of PEG (Mw = 8.103 g·mol−1, Sigma Aldrich) witha particle volume fraction φ ranging from 0 to 2%. For these suspensions, aPEG mass concentration of 30% wt/wt was used. This allowed having a solu-tion with a rheology that is still Newtonian (dynamic viscosity η≈ 130 mPa·s;SI Appendix, Fig. S2B) and with a mass density that closely matches that ofthe particles, thus limiting their sedimentation or creaming. The second typeof suspension consisted of green fluorescent polyethylene particles (meanradius R0=83 µm, UVPMS-BG-1.025, mass density 1.025 g/cm3, λem = 414nm, Cospheric) dispersed in pure glycerol (mass density 1.26 g/cm3, SigmaAldrich) with φ� 1 %. In this case, the fluorescent particles did cream inthe granular suspension.
Rheological and Optical Setup. The PDMS circular pool was placed at thebottom static part of a commercial rheometer (MCR 302, Anton Parr). Theplanar rotating tool of the rheometer (PP40 Anton Paar, diameter 40 mm)was positioned at a height H=1 mm above the base of the fiber and rotatedat a constant rotation rate (yielding γ=10 Hz for all experiments withnonfluorescent particles) to induce a shear flow (Fig. 1A). For fluorescentparticles experiments, the rheometer tool was positioned at a height H=540µm above the base, and the constant shear rate was in the range [−2; 2] Hz.A fluorescence microscope equipped with a 5×magnification objective waspositioned underneath the pool. Images of the tip position were recordedat 100 fps as the granular suspension was sheared with a sensitive camera(Blackfly S BFS-U3-51S5M-C, FLIR).
Fiber Deflections Measurements. We used an image correlation routine writ-ten in Matlab (Mathworks) to compute the displacement of the fiber tip δx
(in the flow direction) and δz (orthogonal to the flow). Subpixel accuracy isobtained by interpolating the correlation function as fully described in ref.17, yielding a typical measurement noise σ0 = 20 nm.
Data Availability. All study data are included in the article and SI Appendix.
ACKNOWLEDGMENTS We acknowledge financial support from Centrede Recherche et Developpement Nestle S.A.S., Marne la Vallee, France,and Societe des Produits Nestle SA, Vevey, Switzerland. We also thankIsabelle Barbotteau and Giulia Marchesini (Nestle Development CentreLisieux, France) for their careful reading of the manuscript and support.We acknowledge, as well, the continuous support of Christopher J. Pipe(Nestle Research, Switzerland). Finally, we thank Eric Lauga (Department ofApplied Mathematics and Theoretical Physics, Cambridge University, UnitedKingdom), Georges Debregeas (Laboratoire Jean Perrin, Paris, France) andChristian Fretigny (Laboratoire Sciences et Ingenierie de la Matiere Molle,Paris, France) for fruitful discussions.
1. R. S. Johansson, J. R. Flanagan, Coding and use of tactile signals from the fingertipsin object manipulation tasks. Nat. Rev. Neurosci. 10, 345–359 (2009).
2. E. Arabzadeh, M. von Heimendahl, M. Diamond, “Vibrissal texture decoding” inScholarpedia of Touch, T. Prescott, E. Ahissar, E. Izhikevich, Eds. (Springer, 2016), pp.737–749.
3. T. Morita, H. Kang, J. Wolfe, S. P. Jadhav, D. E. Feldman, Psychometric curve andbehavioral strategies for whisker-based texture discrimination in rats. PLoS One 6,e20437 (2011).
4. B. A. Jenkins, E. A. Lumpkin, Developing a sense of touch. Development 144, 4078–4090 (2017).
6 of 7 | PNAShttps://doi.org/10.1073/pnas.2020402118
Thomazo et al.A bending fluctuation-based mechanism for particle detection by ciliated structures
Dow
nloa
ded
at IN
IST
CN
RS
on
July
30,
202
1

PHYS
ICS
5. A. B. Vallbo, R. S. Johansson, Properties of cutaneous mechanoreceptors in the humanhand related to touch sensation. Hum. Neurobiol. 3, 3–14 (1984).
6. S. C. Leiser, K. A. Moxon, Responses of trigeminal ganglion neurons during naturalwhisking behaviors in the awake rat. Neuron 53, 117–133 (2007).
7. J. Scheibert, S. Leurent, A. Prevost, G. Debregeas, The role of fingerprints in the cod-ing of tactile information probed with a biomimetic sensor. Science 323, 1503–1506(2009).
8. E. Wandersman, R. Candelier, G. Debregeas, A. Prevost, Texture-induced modulationsof friction force: The fingerprint effect. Phys. Rev. Lett. 107, 164301 (2011).
9. A. I. Weber et al., Spatial and temporal codes mediate the tactile perception ofnatural textures. Proc. Natl. Acad. Sci. U.S.A. 110, 17107–17112 (2013).
10. Y. Boubenec, L. N. Claverie, D. E. Shulz, G. Debregeas, An amplitude modula-tion/demodulation scheme for whisker-based texture perception. J. Neurosci. 34,10832–10843 (2014).
11. L. N. Claverie, Y. Boubenec, G. Debregeas, A. M. Prevost, E. Wandersman, Whiskercontact detection of rodents based on slow and fast mechanical inputs. Front. Behav.Neurosci. 10, 251 (2017).
12. J. C. Montgomery, C. F. Baker, A. G. Carton, The lateral line can mediate rheotaxis infish. Nature 389, 960−963 (1997).
13. B. P. Chagnaud, C. Brucker, M. H. Hofmann, H. Bleckmann, Measuring flow velocityand flow direction by spatial and temporal analysis of flow fluctuations. J. Neurosci.28, 4479–4487 (2008).
14. P. Oteiza, I. Odstrcil, G. Lauder, R. Portugues, F. Engert, A novel mechanismfor mechanosensory-based rheotaxis in larval zebrafish. Nature 547, 445–448(2017).
15. Y. Moayedi, L. F. Duenas-Bianchi, E. A. Lumpkin, Somatosensory innervation of theoral mucosa of adult and aging mice. Sci. Rep. 8, 9975 (2018).
16. E. Lauga, C. J. Pipe, B. Le Reverend, Sensing in the mouth: A model for filiformpapillae as strain amplifiers. Front. Phys. 4, 35 (2016).
17. J. B. Thomazo et al., Probing in-mouth texture perception with a biomimetic tongue.J. R. Soc. Interface 16, 20190362 (2019).
18. P. Venier, A. C. Maggs, M. F. Carlier, D. Pantaloni, Analysis of microtubule rigidityusing hydrodynamic flow and thermal fluctuations. J. Biol. Chem. 269, 13353–13360(1994).
19. J. S. Wexler et al., Bending of elastic fibres in viscous flows: The influence ofconfinement. J. Fluid Mech. 720, 517–544 (2013).
20. O. Du Roure, A. Lindner, E. N. Nazockdast, M. J. Shelley, Dynamics of flexible fibers inviscous flows and fluids. Annu. Rev. Fluid Mech. 51, 539–572 (2019).
21. L. Engelen et al., Relating particles and texture perception. Physiol. Behav. 86, 111–117 (2005).
22. E. Imai et al., Perception of grittiness in an oil-in-water emulsion. J. Texture Stud. 28,257–272 (1997).
23. S. M. van Netten, A. B. Kroese, Laser interferometric measurements on the dynamicbehaviour of the cupula in the fish lateral line. Hear. Res. 29, 55–61 (1987).
24. M. J. McHenry, S. M. van Netten, The flexural stiffness of superficial neuromasts inthe zebrafish (Danio rerio) lateral line. J. Exp. Biol. 210, 4244–4253 (2007).
25. J. Howard, A. J. Hudspeth, Compliance of the hair bundle associated with gating ofmechanoelectrical transduction channels in the bullfrog’s saccular hair cell. Neuron 1,189–199 (1988).
26. Y. N. Young, M. J. Shelley, Stretch-coil transition and transport of fibers in cellularflows. Phys. Rev. Lett. 99, 058303 (2007).
27. A. Suli, G. M. Watson, E. W. Rubel, D. W. Raible, Rheotaxis in larval zebrafish ismediated by lateral line mechanosensory hair cells. PLoS One 7, e29727 (2012).
28. O. E. Garcia, A. Theodorsen, Auto-correlation function and frequency spectrum dueto a super-position of uncorrelated exponential pulses. Phys. Plasmas 24, 032309(2017).
29. O. E. Garcia, Stochastic modeling of intermittent scrape-off layer plasma fluctuations.Phys. Rev. Lett. 108, 265001 (2012).
30. J. G. Brodnyan, The dependence of synthetic latex viscosity on particle size and sizedistribution. Trans. Soc. Rheol. 12, 357–362 (1968).
31. J. Chong, E. Christiansen, A. Baer, Rheology of concentrated suspensions. J. Appl.Polym. Sci. 15, 2007–2021 (1971).
32. G. A. Davies, J. R. Stokes, On the gap error in parallel plate rheometry that arises fromthe presence of air when zeroing the gap. J. Rheol. (N.Y.N.Y.) 49, 919–922 (2005).
33. R. Cardinaels, N. K. Reddy, C. Clasen, Quantifying the errors due to overfilling forNewtonian fluids in rotational rheometry. Rheol. Acta 58, 525–538 (2019).
34. A. R. Shields et al., Biomimetic cilia arrays generate simultaneous pumping andmixing regimes. Proc. Natl. Acad. Sci. U.S.A. 107, 15670–15675 (2010).
35. S. Zhang, Y. Wang, P. R. Onck, J. M. den Toonder, Removal of microparticles by ciliatedsurfaces—An experimental study. Adv. Funct. Mater. 29, 1806434 (2019).
36. A. Bhattacharya, G. A. Buxton, O. B. Usta, A. C. Balazs, Propulsion and trapping ofmicroparticles by active cilia arrays. Langmuir 28, 3217–3226 (2012).
37. V. Mikulich, B. Nassauer, M. Kuna, C. Brucker, Experimental and numerical study ofinteraction between particle loaded fluid and a rough wall with micropillars. Tribol.Int. 83, 42–50 (2015).
38. G. Rajan, “Divergence of exploratory locomotion and the underlying neuronal cir-cuitry in two closely related vertabrate species,” PhD thesis, Universite PSL, Paris,France (2020).
39. M. Daems, H. M. Peacock, E. A. V. Jones, Fluid flow as a driver of embryonicmorphogenesis. Development 147, dev185579 (2020).
Thomazo et al.A bending fluctuation-based mechanism for particle detection by ciliated structures
PNAS | 7 of 7https://doi.org/10.1073/pnas.2020402118
Dow
nloa
ded
at IN
IST
CN
RS
on
July
30,
202
1