A benchmark of transposon insertion detection tools using ...
19
METHODOLOGY Open Access A benchmark of transposon insertion detection tools using real data Pol Vendrell-Mir 1 , Fabio Barteri 1 , Miriam Merenciano 2 , Josefa González 2 , Josep M. Casacuberta 1* and Raúl Castanera 1* Abstract Background: Transposable elements (TEs) are an important source of genomic variability in eukaryotic genomes. Their activity impacts genome architecture and gene expression and can lead to drastic phenotypic changes. Therefore, identifying TE polymorphisms is key to better understand the link between genotype and phenotype. However, most genotype-to-phenotype analyses have concentrated on single nucleotide polymorphisms as they are easier to reliable detect using short-read data. Many bioinformatic tools have been developed to identify transposon insertions from resequencing data using short reads. Nevertheless, the performance of most of these tools has been tested using simulated insertions, which do not accurately reproduce the complexity of natural insertions. Results: We have overcome this limitation by building a dataset of insertions from the comparison of two high- quality rice genomes, followed by extensive manual curation. This dataset contains validated insertions of two very different types of TEs, LTR-retrotransposons and MITEs. Using this dataset, we have benchmarked the sensitivity and precision of 12 commonly used tools, and our results suggest that in general their sensitivity was previously overestimated when using simulated data. Our results also show that, increasing coverage leads to a better sensitivity but with a cost in precision. Moreover, we found important differences in tool performance, with some tools performing better on a specific type of TEs. We have also used two sets of experimentally validated insertions in Drosophila and humans and show that this trend is maintained in genomes of different size and complexity. Conclusions: We discuss the possible choice of tools depending on the goals of the study and show that the appropriate combination of tools could be an option for most approaches, increasing the sensitivity while maintaining a good precision. Keywords: Benchmark, Transposable elements, Polymorphism, Transposon insertion, Resequencing Background Transposable elements (TEs) constitute a very important fraction of eukaryotic genomes, and their ability to trans- pose, excise and produce complex genomic rearrangements make them a key source of genomic diversity. Previous work done over the last decades has uncovered their enor- mous potential as gene regulators, a role that TEs play through a variety of genetic and epigenetic mechanisms [12, 43]. Certain TEs, such as Long Terminal repeat (LTR)- retrotransposon carry their own promoters, and their insertion close to genes can generate new gene expression patterns. In addition, TEs, and in particular LTR- retrotransposons and MITEs (Miniature Inverted Trans- posable Elements), have been shown to contain transcrip- tion factor binding sites, which can be mobilized by transposition rewiring new genes into pre-existing tran- scriptional networks [5, 12, 20]. As a consequence, TEs have the potentiality to generate important genomic and transcriptional variability, and the interest in these elements has drastically increased in the last years. Due to their repetitive nature and their sequence diversity, the annotation of TEs is more complex than that of protein coding genes. Nevertheless, thanks to the development of tools such as Repeatmasker (http:// www.repeatmasker.org) and sophisticated pipelines such © The Author(s). 2019 Open Access This article is distributed under the terms of the Creative Commons Attribution 4.0 International License (http://creativecommons.org/licenses/by/4.0/), which permits unrestricted use, distribution, and reproduction in any medium, provided you give appropriate credit to the original author(s) and the source, provide a link to the Creative Commons license, and indicate if changes were made. The Creative Commons Public Domain Dedication waiver (http://creativecommons.org/publicdomain/zero/1.0/) applies to the data made available in this article, unless otherwise stated. * Correspondence: [email protected]; [email protected] 1 Centre for Research in Agricultural Genomics CSIC-IRTA-UAB-UB, Campus UAB, Edifici CRAG, Bellaterra, 08193 Barcelona, Spain Full list of author information is available at the end of the article Vendrell-Mir et al. Mobile DNA (2019) 10:53 https://doi.org/10.1186/s13100-019-0197-9
Transcript of A benchmark of transposon insertion detection tools using ...

METHODOLOGY Open Access
A benchmark of transposon insertiondetection tools using real dataPol Vendrell-Mir1, Fabio Barteri1, Miriam Merenciano2, Josefa González2, Josep M. Casacuberta1* andRaúl Castanera1*
Abstract
Background: Transposable elements (TEs) are an important source of genomic variability in eukaryotic genomes.Their activity impacts genome architecture and gene expression and can lead to drastic phenotypic changes.Therefore, identifying TE polymorphisms is key to better understand the link between genotype and phenotype.However, most genotype-to-phenotype analyses have concentrated on single nucleotide polymorphisms as theyare easier to reliable detect using short-read data. Many bioinformatic tools have been developed to identifytransposon insertions from resequencing data using short reads. Nevertheless, the performance of most of thesetools has been tested using simulated insertions, which do not accurately reproduce the complexity of naturalinsertions.
Results: We have overcome this limitation by building a dataset of insertions from the comparison of two high-quality rice genomes, followed by extensive manual curation. This dataset contains validated insertions of twovery different types of TEs, LTR-retrotransposons and MITEs. Using this dataset, we have benchmarked the sensitivityand precision of 12 commonly used tools, and our results suggest that in general their sensitivity was previouslyoverestimated when using simulated data. Our results also show that, increasing coverage leads to a bettersensitivity but with a cost in precision. Moreover, we found important differences in tool performance, with sometools performing better on a specific type of TEs. We have also used two sets of experimentally validated insertionsin Drosophila and humans and show that this trend is maintained in genomes of different size and complexity.
Conclusions: We discuss the possible choice of tools depending on the goals of the study and show that theappropriate combination of tools could be an option for most approaches, increasing the sensitivity whilemaintaining a good precision.
Keywords: Benchmark, Transposable elements, Polymorphism, Transposon insertion, Resequencing
BackgroundTransposable elements (TEs) constitute a very importantfraction of eukaryotic genomes, and their ability to trans-pose, excise and produce complex genomic rearrangementsmake them a key source of genomic diversity. Previouswork done over the last decades has uncovered their enor-mous potential as gene regulators, a role that TEs playthrough a variety of genetic and epigenetic mechanisms[12, 43]. Certain TEs, such as Long Terminal repeat (LTR)-retrotransposon carry their own promoters, and their
insertion close to genes can generate new gene expressionpatterns. In addition, TEs, and in particular LTR-retrotransposons and MITEs (Miniature Inverted Trans-posable Elements), have been shown to contain transcrip-tion factor binding sites, which can be mobilized bytransposition rewiring new genes into pre-existing tran-scriptional networks [5, 12, 20]. As a consequence, TEshave the potentiality to generate important genomic andtranscriptional variability, and the interest in these elementshas drastically increased in the last years.Due to their repetitive nature and their sequence
diversity, the annotation of TEs is more complex thanthat of protein coding genes. Nevertheless, thanks to thedevelopment of tools such as Repeatmasker (http://www.repeatmasker.org) and sophisticated pipelines such
© The Author(s). 2019 Open Access This article is distributed under the terms of the Creative Commons Attribution 4.0International License (http://creativecommons.org/licenses/by/4.0/), which permits unrestricted use, distribution, andreproduction in any medium, provided you give appropriate credit to the original author(s) and the source, provide a link tothe Creative Commons license, and indicate if changes were made. The Creative Commons Public Domain Dedication waiver(http://creativecommons.org/publicdomain/zero/1.0/) applies to the data made available in this article, unless otherwise stated.
* Correspondence: [email protected];[email protected] for Research in Agricultural Genomics CSIC-IRTA-UAB-UB, CampusUAB, Edifici CRAG, Bellaterra, 08193 Barcelona, SpainFull list of author information is available at the end of the article
Vendrell-Mir et al. Mobile DNA (2019) 10:53 https://doi.org/10.1186/s13100-019-0197-9

as REPET [16], methodologies of TE detection and an-notation in assembled genomes are today robust. Theavailability of high-quality reference genomes coupledwith the exponential increment of resequencing data hasboosted our capacity to evaluate intraspecific variability.By obtaining accurate maps of genetic variation, charac-terizing the genetic basis of phenotypic variance is nowpossible at a genome-wide scale thanks to associationstudies (GWAS). Until now, most of the efforts have beenfocused on analyzing the variability at the nucleotide level(SNPs, single nucleotide polymorphisms), as there are ro-bust algorithms to perform variant calling. However, TEsgenerate an important part of the genetic variabilitypresent in a particular species. Moreover, the timing of oc-currence of TE and SNP mutations is different, as theformer can amplify in bursts generating a great amount ofdiversity in short periods of time, whereas SNP mutationrates are more constant in time. Therefore, the identifica-tion of Transposon Insertion Polymorphisms (TIPs) is ofhigh interest. Nevertheless, our capacity to accuratelyidentify TIPs using re-sequencing data is hampered by thestructural complexity of TEs.In the last few years, many laboratories have developed
bioinformatic tools to look for TIPs and have started toanalyze their impact in intra-species variability, includingcrop plants [7, 10, 42]. There are two main approachesthat can be used to detect TIPs in whole-genome se-quence data: i) inference from discordant read-pair map-pings, and ii) clustering of ‘split’ reads sharing commonalignment junctions [2, 15]. Most of the recently devel-oped tools incorporate both methodologies, and in somecases TIPs have been experimentally validated [27].Moreover, in some cases the authors have evaluatedtheir sensitivity and precision (also known as positivepredictive value) [11, 24]. However, in most cases theseevaluations were performed by generating simulated in-sertions that are randomly placed in the genome, andthen used to compare with tool predictions. Simulatedinsertions are far from representing the complexity of“natural” TIPs, as many of their features are difficult orimpossible to mimic accurately (i.e.: element degener-ation, nested insertions, insertion preferences, etc.). As aconsequence, the benchmarks done with simulated datatend to overestimate performance of the tools analyzed[21]. An example of such benchmarks is the one re-ported by the developers of McClintock, a pipeline thatintegrates six tools [36] (Table 1). In their study, the au-thors provided a detailed comparison of their compo-nent’s performance in sensitivity and positional accuracybased on simulated LTR-retrotransposon insertions,which also includes some real resequencing data, in theyeast Saccharomyces cerevisiae. In spite of the interest ofsuch comparative analysis, the direct translation of theseresults to other eukaryotic models with bigger and more
repetitive genomes is uncertain. This is especially rele-vant as S. cerevisiae contains only 51 full LTR-retrotransposons in the whole genome [8], whereas inmost plant and animal genomes the LTR-retrotransposon load is several orders of magnitudehigher. Also, a recent study focused on simulated butalso real human AluY, L1 and SVA families revealedhuge differences in the ability of seven tools to detectTIPs [41]. In spite of the importance of these familiesfor human research, they do not represent the diversityof the TE landscape of other animals and plants, whichis far more complex, with many families from differentorders being potentially active, and where the amount oftruncated non-autonomous elements greatly outnum-bers the active copies.In plants, TEs are at the origin of important agronomic
traits, such as apical dominance in maize [45], the skinand flesh colors in grape [28] and blood oranges [4]. Dif-ferent efforts have been made recently to identify TIPsthat could be responsible for important variability inplants. Carpentier et. al [7] screened the presence of 32rice LTR-retrotransposon families in the 3000-rice gen-ome dataset and uncovered more than 50,000 TIPs, mostof them occurring at a very low frequency, which is indi-cative of recent activity. Besides LTR-retrotransposons,MITEs are probably the most prevalent group of transpo-sons in plants, including rice, where they have experiencedrecent massive amplification bursts [10, 35]. MITEs arestructurally very different from LTR-retrotransposons, asthey are non-autonomous, usually non-coding, and rela-tively small. They are of particular interest because theytend to integrate close to genes and may carry regulatorydomains [20], having the potential to create or rewireregulatory networks [12]. In the present study, we havetaken advantage of the existence of several high-quality as-sembled genomes of different rice varieties to create a vali-dated dataset of natural LTR-retrotransposon and MITEinsertions obtained by direct comparison between the as-sembled genomes (Nipponbare and MH63), that we haveused to benchmark the performance of 12 TIP callingtools. Moreover, we have also analyzed the sensitivity ofthe best performing tools to detect experimentally vali-dated TIPs in Drosophila and humans. Our results evi-dence that tool performance is in general lower thanestimated by previous simulations, and highly variable de-pending on sequencing coverage and TE type. Also, weshow that an appropriate combination of tools can in-crease the sensitivity of predictions while maintaining highprecision levels.
ResultsTools selected for benchmarkingWe selected 12 of the most widely used tools for the de-tection of TIPs (Table 1). Among them, four were
Vendrell-Mir et al. Mobile DNA (2019) 10:53 Page 2 of 19
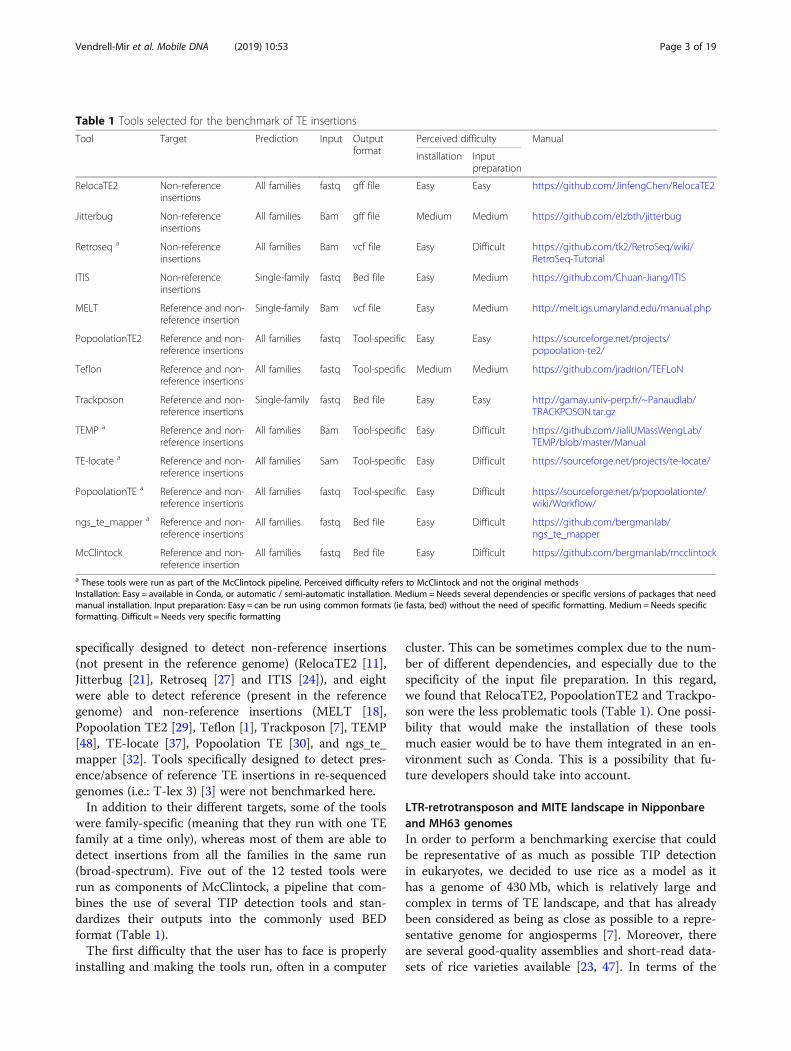
specifically designed to detect non-reference insertions(not present in the reference genome) (RelocaTE2 [11],Jitterbug [21], Retroseq [27] and ITIS [24]), and eightwere able to detect reference (present in the referencegenome) and non-reference insertions (MELT [18],Popoolation TE2 [29], Teflon [1], Trackposon [7], TEMP[48], TE-locate [37], Popoolation TE [30], and ngs_te_mapper [32]. Tools specifically designed to detect pres-ence/absence of reference TE insertions in re-sequencedgenomes (i.e.: T-lex 3) [3] were not benchmarked here.In addition to their different targets, some of the tools
were family-specific (meaning that they run with one TEfamily at a time only), whereas most of them are able todetect insertions from all the families in the same run(broad-spectrum). Five out of the 12 tested tools wererun as components of McClintock, a pipeline that com-bines the use of several TIP detection tools and stan-dardizes their outputs into the commonly used BEDformat (Table 1).The first difficulty that the user has to face is properly
installing and making the tools run, often in a computer
cluster. This can be sometimes complex due to the num-ber of different dependencies, and especially due to thespecificity of the input file preparation. In this regard,we found that RelocaTE2, PopoolationTE2 and Trackpo-son were the less problematic tools (Table 1). One possi-bility that would make the installation of these toolsmuch easier would be to have them integrated in an en-vironment such as Conda. This is a possibility that fu-ture developers should take into account.
LTR-retrotransposon and MITE landscape in Nipponbareand MH63 genomesIn order to perform a benchmarking exercise that couldbe representative of as much as possible TIP detectionin eukaryotes, we decided to use rice as a model as ithas a genome of 430Mb, which is relatively large andcomplex in terms of TE landscape, and that has alreadybeen considered as being as close as possible to a repre-sentative genome for angiosperms [7]. Moreover, thereare several good-quality assemblies and short-read data-sets of rice varieties available [23, 47]. In terms of the
Table 1 Tools selected for the benchmark of TE insertions
Tool Target Prediction Input Outputformat
Perceived difficulty Manual
Installation Inputpreparation
RelocaTE2 Non-referenceinsertions
All families fastq gff file Easy Easy https://github.com/JinfengChen/RelocaTE2
Jitterbug Non-referenceinsertions
All families Bam gff file Medium Medium https://github.com/elzbth/jitterbug
Retroseq a Non-referenceinsertions
All families Bam vcf file Easy Difficult https://github.com/tk2/RetroSeq/wiki/RetroSeq-Tutorial
ITIS Non-referenceinsertions
Single-family fastq Bed file Easy Medium https://github.com/Chuan-Jiang/ITIS
MELT Reference and non-reference insertion
Single-family Bam vcf file Easy Medium http://melt.igs.umaryland.edu/manual.php
PopoolationTE2 Reference and non-reference insertions
All families fastq Tool-specific Easy Easy https://sourceforge.net/projects/popoolation-te2/
Teflon Reference and non-reference insertions
All families fastq Tool-specific Medium Medium https://github.com/jradrion/TEFLoN
Trackposon Reference and non-reference insertions
Single-family fastq Bed file Easy Easy http://gamay.univ-perp.fr/~Panaudlab/TRACKPOSON.tar.gz
TEMP a Reference and non-reference insertions
All families Bam Tool-specific Easy Difficult https://github.com/JialiUMassWengLab/TEMP/blob/master/Manual
TE-locate a Reference and non-reference insertions
All families Sam Tool-specific Easy Difficult https://sourceforge.net/projects/te-locate/
PopoolationTE a Reference and non-reference insertions
All families fastq Tool-specific Easy Difficult https://sourceforge.net/p/popoolationte/wiki/Workflow/
ngs_te_mapper a Reference and non-reference insertions
All families fastq Bed file Easy Difficult https://github.com/bergmanlab/ngs_te_mapper
McClintock Reference and non-reference insertion
All families fastq Bed file Easy Difficult https://github.com/bergmanlab/mcclintock
a These tools were run as part of the McClintock pipeline. Perceived difficulty refers to McClintock and not the original methodsInstallation: Easy = available in Conda, or automatic / semi-automatic installation. Medium = Needs several dependencies or specific versions of packages that needmanual installation. Input preparation: Easy = can be run using common formats (ie fasta, bed) without the need of specific formatting. Medium = Needs specificformatting. Difficult = Needs very specific formatting
Vendrell-Mir et al. Mobile DNA (2019) 10:53 Page 3 of 19
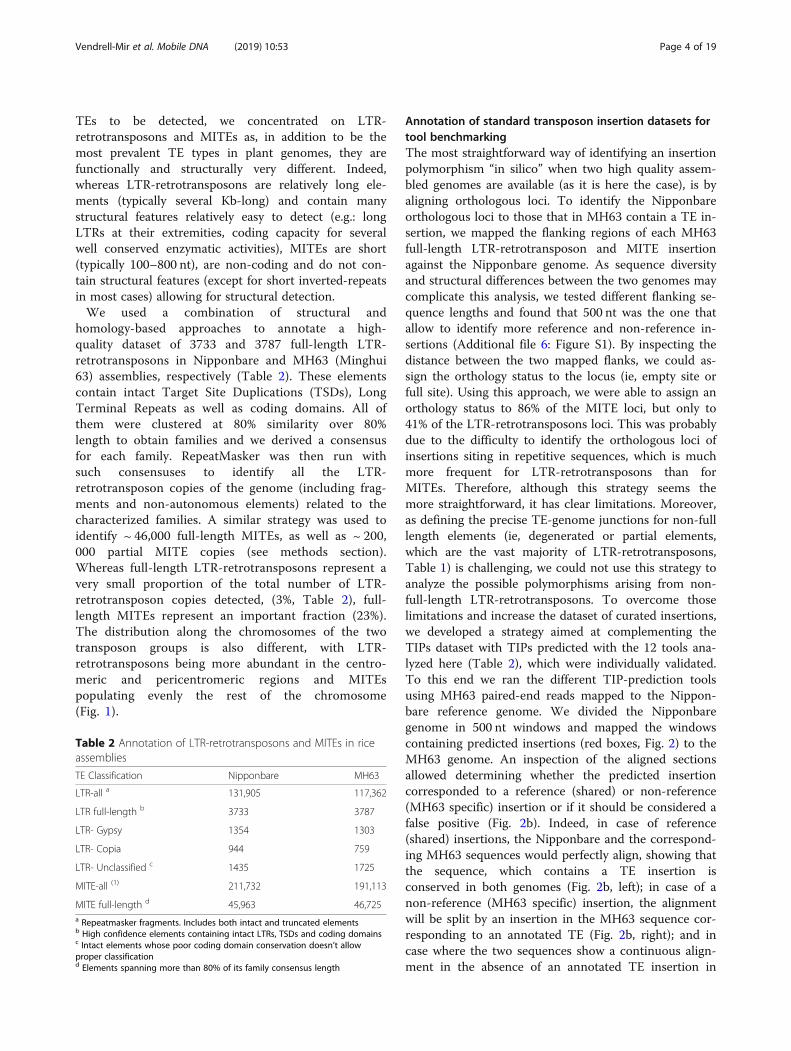
TEs to be detected, we concentrated on LTR-retrotransposons and MITEs as, in addition to be themost prevalent TE types in plant genomes, they arefunctionally and structurally very different. Indeed,whereas LTR-retrotransposons are relatively long ele-ments (typically several Kb-long) and contain manystructural features relatively easy to detect (e.g.: longLTRs at their extremities, coding capacity for severalwell conserved enzymatic activities), MITEs are short(typically 100–800 nt), are non-coding and do not con-tain structural features (except for short inverted-repeatsin most cases) allowing for structural detection.We used a combination of structural and
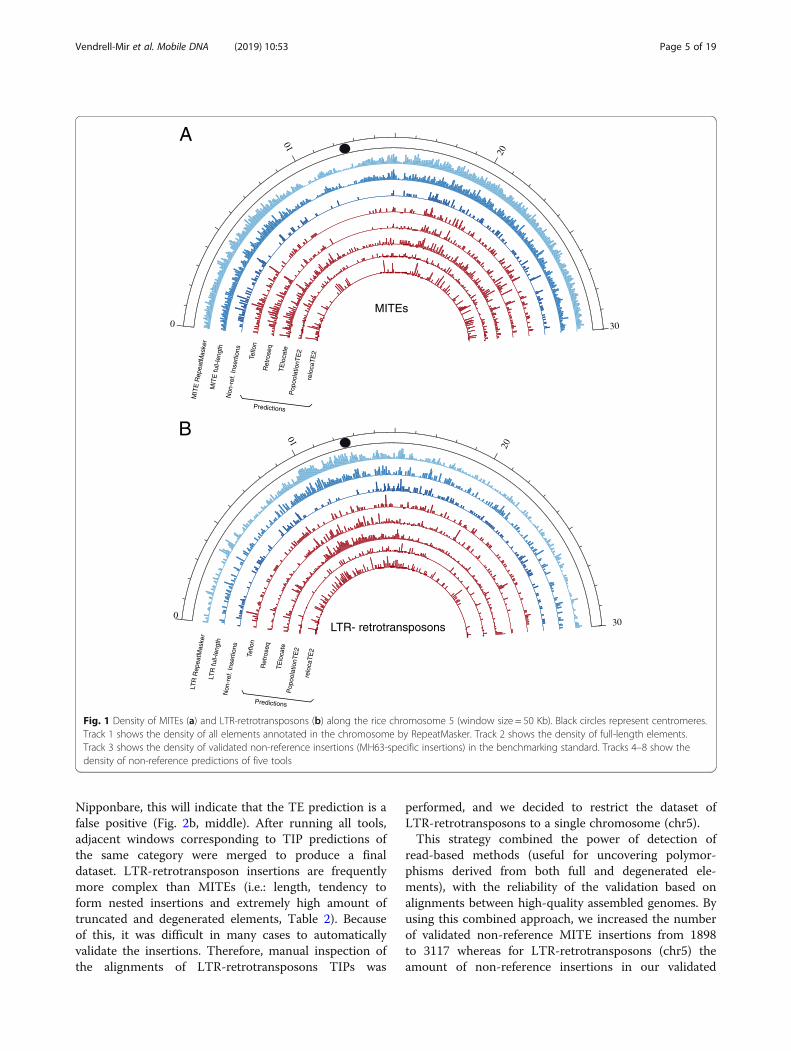
homology-based approaches to annotate a high-quality dataset of 3733 and 3787 full-length LTR-retrotransposons in Nipponbare and MH63 (Minghui63) assemblies, respectively (Table 2). These elementscontain intact Target Site Duplications (TSDs), LongTerminal Repeats as well as coding domains. All ofthem were clustered at 80% similarity over 80%length to obtain families and we derived a consensusfor each family. RepeatMasker was then run withsuch consensuses to identify all the LTR-retrotransposon copies of the genome (including frag-ments and non-autonomous elements) related to thecharacterized families. A similar strategy was used toidentify ~ 46,000 full-length MITEs, as well as ~ 200,000 partial MITE copies (see methods section).Whereas full-length LTR-retrotransposons represent avery small proportion of the total number of LTR-retrotransposon copies detected, (3%, Table 2), full-length MITEs represent an important fraction (23%).The distribution along the chromosomes of the twotransposon groups is also different, with LTR-retrotransposons being more abundant in the centro-meric and pericentromeric regions and MITEspopulating evenly the rest of the chromosome(Fig. 1).
Annotation of standard transposon insertion datasets fortool benchmarkingThe most straightforward way of identifying an insertionpolymorphism “in silico” when two high quality assem-bled genomes are available (as it is here the case), is byaligning orthologous loci. To identify the Nipponbareorthologous loci to those that in MH63 contain a TE in-sertion, we mapped the flanking regions of each MH63full-length LTR-retrotransposon and MITE insertionagainst the Nipponbare genome. As sequence diversityand structural differences between the two genomes maycomplicate this analysis, we tested different flanking se-quence lengths and found that 500 nt was the one thatallow to identify more reference and non-reference in-sertions (Additional file 6: Figure S1). By inspecting thedistance between the two mapped flanks, we could as-sign the orthology status to the locus (ie, empty site orfull site). Using this approach, we were able to assign anorthology status to 86% of the MITE loci, but only to41% of the LTR-retrotransposons loci. This was probablydue to the difficulty to identify the orthologous loci ofinsertions siting in repetitive sequences, which is muchmore frequent for LTR-retrotransposons than forMITEs. Therefore, although this strategy seems themore straightforward, it has clear limitations. Moreover,as defining the precise TE-genome junctions for non-fulllength elements (ie, degenerated or partial elements,which are the vast majority of LTR-retrotransposons,Table 1) is challenging, we could not use this strategy toanalyze the possible polymorphisms arising from non-full-length LTR-retrotransposons. To overcome thoselimitations and increase the dataset of curated insertions,we developed a strategy aimed at complementing theTIPs dataset with TIPs predicted with the 12 tools ana-lyzed here (Table 2), which were individually validated.To this end we ran the different TIP-prediction toolsusing MH63 paired-end reads mapped to the Nippon-bare reference genome. We divided the Nipponbaregenome in 500 nt windows and mapped the windowscontaining predicted insertions (red boxes, Fig. 2) to theMH63 genome. An inspection of the aligned sectionsallowed determining whether the predicted insertioncorresponded to a reference (shared) or non-reference(MH63 specific) insertion or if it should be considered afalse positive (Fig. 2b). Indeed, in case of reference(shared) insertions, the Nipponbare and the correspond-ing MH63 sequences would perfectly align, showing thatthe sequence, which contains a TE insertion isconserved in both genomes (Fig. 2b, left); in case of anon-reference (MH63 specific) insertion, the alignmentwill be split by an insertion in the MH63 sequence cor-responding to an annotated TE (Fig. 2b, right); and incase where the two sequences show a continuous align-ment in the absence of an annotated TE insertion in
Table 2 Annotation of LTR-retrotransposons and MITEs in riceassemblies
TE Classification Nipponbare MH63
LTR-all a 131,905 117,362
LTR full-length b 3733 3787
LTR- Gypsy 1354 1303
LTR- Copia 944 759
LTR- Unclassified c 1435 1725
MITE-all (1) 211,732 191,113
MITE full-length d 45,963 46,725a Repeatmasker fragments. Includes both intact and truncated elementsb High confidence elements containing intact LTRs, TSDs and coding domainsc Intact elements whose poor coding domain conservation doesn’t allowproper classificationd Elements spanning more than 80% of its family consensus length
Vendrell-Mir et al. Mobile DNA (2019) 10:53 Page 4 of 19
Nipponbare, this will indicate that the TE prediction is afalse positive (Fig. 2b, middle). After running all tools,adjacent windows corresponding to TIP predictions ofthe same category were merged to produce a finaldataset. LTR-retrotransposon insertions are frequentlymore complex than MITEs (i.e.: length, tendency toform nested insertions and extremely high amount oftruncated and degenerated elements, Table 2). Becauseof this, it was difficult in many cases to automaticallyvalidate the insertions. Therefore, manual inspection ofthe alignments of LTR-retrotransposons TIPs was
performed, and we decided to restrict the dataset ofLTR-retrotransposons to a single chromosome (chr5).This strategy combined the power of detection of
read-based methods (useful for uncovering polymor-phisms derived from both full and degenerated ele-ments), with the reliability of the validation based onalignments between high-quality assembled genomes. Byusing this combined approach, we increased the numberof validated non-reference MITE insertions from 1898to 3117 whereas for LTR-retrotransposons (chr5) theamount of non-reference insertions in our validated
20
0
1010
30
0
20
30
MITEs
LTR- retrotransposons
MIT
E fu
ll-le
ngth
MIT
E R
epea
tMas
ker
Teflo
n
Ret
rose
q
TE
loca
teP
opoo
latio
nTE
2
relo
caT
E2
Non
-ref
. Ins
ertio
ns
LTR
full-
leng
th
LTR
Rep
eatM
aske
r
Teflo
n
Ret
rose
q
TE
loca
teP
opoo
latio
nTE
2
relo
caT
E2
Non
-ref
. Ins
ertio
ns
Predictions
Predictions
A
B
Fig. 1 Density of MITEs (a) and LTR-retrotransposons (b) along the rice chromosome 5 (window size = 50 Kb). Black circles represent centromeres.Track 1 shows the density of all elements annotated in the chromosome by RepeatMasker. Track 2 shows the density of full-length elements.Track 3 shows the density of validated non-reference insertions (MH63-specific insertions) in the benchmarking standard. Tracks 4–8 show thedensity of non-reference predictions of five tools
Vendrell-Mir et al. Mobile DNA (2019) 10:53 Page 5 of 19

dataset increased from 22 to 239 (Additional file 2: TableS1). The result was a high-quality dataset of TruePositive (TP) and False Positive (FP) reference and non-reference insertions (Additional file 2: Table S1). Inaddition, there were predicted insertions that did notmatch neither with TP nor FP (i.e.: cases that did not fitin the scenarios described in Fig. 2b). We analyzed thespecific cases of unclassified non-reference insertionsand found that 86% of these LTR-retrotransposon pre-dicted TIPs and 92% of such MITE TIPs overlappedwith other transposons annotated in the reference.These cases were not used for downstream analyses, asmost tools specifically indicate in their manuals that theycannot properly detect nested insertions. In order toevaluate the performance of each tool, we intersectedthe windows corresponding to the TE insertions pre-dicted by the tool (both reference and non-reference TEinsertions) with those of the curated dataset to identifyTP and FP (Fig. 2b). Insertions present in the curated
dataset of TE insertions that were not detected by theevaluated tool were counted as False Negatives (FN).Most of the tools analyzed here are able to detect
insertions from all the families in the same run (broad-spectrum). Some of these tools are able to detect refer-ence and non-reference insertions, whereas others onlydetect non-reference insertions. The programs use dif-ferent strategies to identify these two types of insertions,and consequently we analyzed their performanceseparately.
Detection of reference insertions by broad-spectrum toolsWe observed that whereas the precision detecting MITEand LTR-retrotransposon reference insertions was veryhigh for both types of elements, the sensitivity levels ofmost of the tools were much higher for MITEs (Fig. 3).For MITEs, the sensitivity of most tools increased withcoverage and tended to stabilize at 20-40X coverage(Fig. 3a). Teflon had consistently the best sensitivity andoverall performance (F1-score) in the detection of refer-ence MITE insertions even at low coverage, reaching asensitivity of 74% at 10X with an almost 100% precision(Fig. 3a). All tools showed precision levels higher than99% at all coverages, and all tools except ngs_te_mapperyielded a sensitivity higher than 60% at 40X (Fig. 3a,Additional file 3: Table S2). By contrast, the sensitivity at5X was low in general, with Teflon being the only toolreaching more than 50% (Fig. 3a).Regarding the detection of reference LTR-
retrotransposons, the general tool performance wasmuch lower than for MITEs (Fig. 3b). In this case, TE-locate reached the maximum sensitivity followed byTeflon and was only slightly higher than 50% (Fig. 3b),and the other tools remained below 40% sensitivity. Thesensitivity of TE-locate was higher than 50% in all thecoverages, whereas in Teflon, PopoolationTE2 and Popoo-lationTE it increased with coverage (Fig. 3b). When wefocused only on the detection of full-length LTR-retrotransposons, the performance of all tools increasedconsiderably, reaching a maximum sensitivity of 85.4%(Fig. 3c). TE-locate was again the best performer showinga sensitivity over 80% for all the coverages. We excludedthe predictions of TEMP for reference insertions, as thistool is based on the detection of absences assuming thepresence as default, which leads to an overestimation ofthe number of insertions, especially at a very lowcoverage.
Detection of non-reference insertions by broad-spectrumtoolsAll the benchmarked tools are able to detect non-reference insertions, a task that is more challenging thandetecting reference insertions, as the former are notpresent in the reference genome to which the reads are
Fig. 2 Individual validation of predicted insertions. Black boxesrepresent TE annotations in Nipponbare IRGSP (green rectangle) andMH63 (blue rectangle) assembled genomes. Examples of shared(reference) and MH63-specific (non-reference) insertions are shownin a. Insertions predicted by each tool (shown as arrows in b) wereintersected with windows of 500 bp spanning the entire NipponbareIRGSP genome, and windows having an intersection (red boxes, b)were aligned to MH63 genome. True positive reference insertions(TP ref.) were those having full-length alignments with an MH63region where a MITE or LTR-retrotransposon was annotated. Falsepositives (FP) have high-quality alignments (MAQ > 30) to regionswere no MITE or LTR-retrotransposon was present. True positivenon-reference insertions (TP non-ref) alignments were those havinga spliced alignment in which the two hits were separated by aregion that overlaps with a MITE or LTR-retrotransposon annotatedin MH63
Vendrell-Mir et al. Mobile DNA (2019) 10:53 Page 6 of 19

Fig. 3 Performance of broad-spectrum tools in the detection of reference insertions of MITEs (a), all LTR-retrotransposons (b) and full-lengthLTR-retrotransposons (c)
Vendrell-Mir et al. Mobile DNA (2019) 10:53 Page 7 of 19

mapped. In this case sensitivity was strongly dependenton coverage (Fig. 4). Precision was very different forMITE and LTR-retrotransposon predictions, showing atendency to decrease at high coverage (Fig. 4). RegardingMITEs, Teflon was the best performer followed byPoPoolationTE2 and Retroseq (Fig. 4a). These toolsreached a sensitivity close to 75% (up to 75.6% in 40Xcoverage for Teflon), whereas the rest of the tools had amuch lower sensitivity (Fig. 4a). The precision was veryhigh (> 95%) for most tools with the exception of TE-locate, which dropped from 92.5% in 5X to 75.6% in40X. All the tools improved their performance when thecoverage increased (except Jitterbug, which performedthe best at 20X), with PopoolationTE2 and Retroseqshowing the steepest increase, especially between 5X and20X (Fig. 4a).Regarding LTR-retrotransposons, PopoolationTE2
achieved the highest sensitivity, reaching a maximum of88.5% at 40X (Fig. 4b). Nevertheless, these tools yielded
a high number of false positives, which translates intolow precision levels (Fig. 4b). In general, the precisiondetecting LTR-retrotransposons with respect to MITEswas much lower for all tools. Jitterbug was the only pro-gram with a moderate precision (> 75%) across all cover-age levels, although its sensitivity was low (maximum of32.7% at 40X) (Fig. 4b). According to the F1-score,PopoolationTE2 and Teflon were the best performers atlow coverages (5X-10X), whereas at higher coveragesPopoolationTE2 and Jitterbug showed the best balancebetween sensitivity and precision (Fig. 4b). Differently towhat we previously did for reference insertions, we didnot compute the performance of the tools using onlyfull-length LTR-retrotransposons because they representonly a small fraction of the non-reference annotatedinsertions.The output of most tools contains information that
can be used for filtering the putative insertions toachieve more precise detection levels. We checked
Fig. 4 Performance of broad-spectrum tools in the detection of non-reference insertions of MITEs (a) and LTR-retrotransposons (b). Relocate2 onLTR-retrotransposons at 40X was killed after 5 days running with 8 CPUs and 64GB of RAM
Vendrell-Mir et al. Mobile DNA (2019) 10:53 Page 8 of 19
different filters for each program looking for gains inprecision with a low cost in sensitivity. In some cases,such as Jitterbug, the precision was already very high,and the filtering was not needed. In others, the cost insensitivity was too high and the filtering was not consid-ered useful. For the two best-performing tools, Popoola-tionTE2 and Teflon, filtering did result in significativegains in precision without an excessive cost in sensitiv-ity. For PopoolationTE2 we applied a zygosity filter of0.7 (based on the fraction of reads supporting the inser-tion) which led to a drop of sensitivity for both MITEs(from 76 to 63%) and LTR-retrotransposons detection(from 88 to 65%, Additional file 7: Figure S2), but withan increase of precision, which was particularly strikingfor LTR-retrotransposons (from 28.9 to 91.9% at 40X).For Teflon, a zygosity filter of 1 resulted in a drop ofsensitivity for MITEs (from 78 to 61.5%) and LTR-retrotransposons (from 57.7 to 44.2%) but with import-ant gain in precision for LTR-retrotransposons (from15.2 to 70.8%), which was not significative for MITEs(98.4 to 98.5%) (not shown). In summary, based on theF1-score, filtering by zygosity greatly improved the over-all performance of PopoolationTE2 and Teflon for LTR-retrotransposon detection, whereas the effect of this fil-ter on MITEs detection was much less pronounced dueto the already high precision of the unfiltered results.
Detection of non-reference insertions by family-specifictoolsSome tools have been designed to look only for TIPs ofa single TE family instead of all families at the same time(i.e., ITIS, MELT and Trackposon). In order to analyzethe performance of such tools, we used the largest MITEand LTR-retrotransposon families, which contain 194(whole genome) and 22 (chr5) MH63-specific insertions,respectively (Additional file 7: Table S1). The analysis ofMITE TIPs showed that ITIS and MELT did not per-form well and displayed low sensitivity and overall F1-score levels (Fig. 5a). By contrast, Trackposon performedwell, displaying up to 72.8% sensitivity with 93.1 preci-sion at 40X coverage. In line with the results found forbroad-spectrum tools, sensitivity in the detection ofLTR-retrotransposons was strongly dependent on thecoverage. Trackposon and MELT showed moderate sen-sitivity levels at 40X (58.6 and 55.2%, respectively)whereas ITIS reached a maximum of sensitivity of13.8%. Regarding precision, Trackposon was the bestperformer with values ranging between 76.9 and 100%(Fig. 5b).
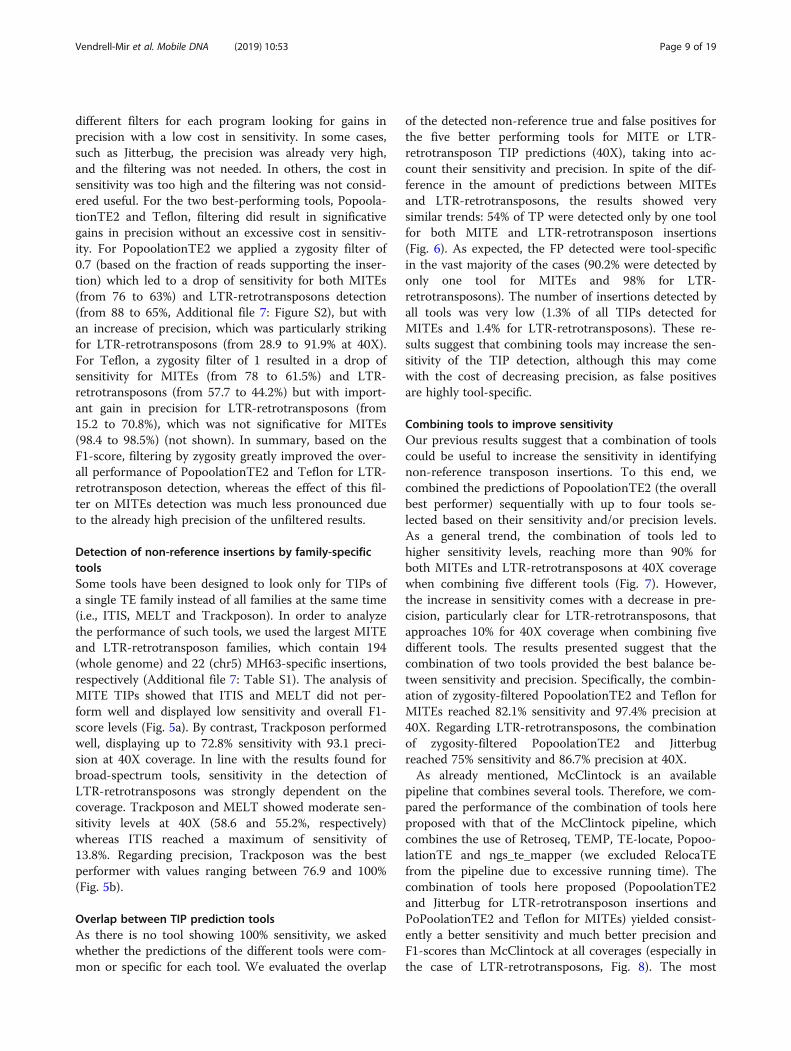
Overlap between TIP prediction toolsAs there is no tool showing 100% sensitivity, we askedwhether the predictions of the different tools were com-mon or specific for each tool. We evaluated the overlap
of the detected non-reference true and false positives forthe five better performing tools for MITE or LTR-retrotransposon TIP predictions (40X), taking into ac-count their sensitivity and precision. In spite of the dif-ference in the amount of predictions between MITEsand LTR-retrotransposons, the results showed verysimilar trends: 54% of TP were detected only by one toolfor both MITE and LTR-retrotransposon insertions(Fig. 6). As expected, the FP detected were tool-specificin the vast majority of the cases (90.2% were detected byonly one tool for MITEs and 98% for LTR-retrotransposons). The number of insertions detected byall tools was very low (1.3% of all TIPs detected forMITEs and 1.4% for LTR-retrotransposons). These re-sults suggest that combining tools may increase the sen-sitivity of the TIP detection, although this may comewith the cost of decreasing precision, as false positivesare highly tool-specific.
Combining tools to improve sensitivityOur previous results suggest that a combination of toolscould be useful to increase the sensitivity in identifyingnon-reference transposon insertions. To this end, wecombined the predictions of PopoolationTE2 (the overallbest performer) sequentially with up to four tools se-lected based on their sensitivity and/or precision levels.As a general trend, the combination of tools led tohigher sensitivity levels, reaching more than 90% forboth MITEs and LTR-retrotransposons at 40X coveragewhen combining five different tools (Fig. 7). However,the increase in sensitivity comes with a decrease in pre-cision, particularly clear for LTR-retrotransposons, thatapproaches 10% for 40X coverage when combining fivedifferent tools. The results presented suggest that thecombination of two tools provided the best balance be-tween sensitivity and precision. Specifically, the combin-ation of zygosity-filtered PopoolationTE2 and Teflon forMITEs reached 82.1% sensitivity and 97.4% precision at40X. Regarding LTR-retrotransposons, the combinationof zygosity-filtered PopoolationTE2 and Jitterbugreached 75% sensitivity and 86.7% precision at 40X.As already mentioned, McClintock is an available
pipeline that combines several tools. Therefore, we com-pared the performance of the combination of tools hereproposed with that of the McClintock pipeline, whichcombines the use of Retroseq, TEMP, TE-locate, Popoo-lationTE and ngs_te_mapper (we excluded RelocaTEfrom the pipeline due to excessive running time). Thecombination of tools here proposed (PopoolationTE2and Jitterbug for LTR-retrotransposon insertions andPoPoolationTE2 and Teflon for MITEs) yielded consist-ently a better sensitivity and much better precision andF1-scores than McClintock at all coverages (especially inthe case of LTR-retrotransposons, Fig. 8). The most
Vendrell-Mir et al. Mobile DNA (2019) 10:53 Page 9 of 19

important differences were found in precision at inter-mediate and high coverages. As an example, for MITEsat 40X PopoolationTE2-Teflon had 97.4% precisionwhereas McClintock had 83.8% (Fig. 8a). RegardingLTR-retrotransposons at 40X, PoPoolationTE2-Jitterbugprecision was 86.7%, whereas that of McClintockdropped to 9% (Fig. 8b).
Evaluation of best-performing tools using Drosophila andhuman datasetsIn order to evaluate whether the benchmarking resultsusing rice data could be extrapolated to data obtainedfrom other species, we benchmarked the best performingtools (PoPoolationTE2, Teflon and Jitterbug) using PCR-validated TIPs from Drosophila and humans. The Dros-ophila dataset consisted of 81 TIPs from ten Drosophilalines sequenced at an average coverage of 42X [22]. This
dataset contained TIPs from 12 different transposon fam-ilies, including retrotransposons (LTR and LINE) and cut-and-paste DNA transposons (TIR) experimentally vali-dated by Lerat et al. [31] Merenciano et al. [33] and Ullas-tres et al. [46] (Additional file 4: Table S3). The humandataset consisted of 148 TIPs obtained from one humanindividual at a coverage of 20X [44]. This dataset consistedof TIPs related to ALU, SVA and LINE-1 retroelements.In the analysis of human insertions, we also includedMELT, as it is the best-established tool for the detectionof human TE polymorphisms. The detection levels ofPoPoolationTE2 and Teflon in Drosophila were moder-ately high (69.1% of the insertions, Table 3 and Additionalfile 5: Table S4), and substantially higher than Jitterbug(44.4% of the insertions). Using the combination of thethree tools, we were able to detect 81.5% of the insertions.These results are in high concordance with the sensitivity
Fig. 5 Performance of family-specific tools in the detection of non-reference insertions of MITEs (a) and LTR-retrotransposons (b). Trackposon wasrun on 10 kb for LTR-retrotransposons windows as described in [7]
Vendrell-Mir et al. Mobile DNA (2019) 10:53 Page 10 of 19
levels found using rice data with LTR-retrotransposonsand MITEs, where PoPoolationTE2 and Teflon showedsuperior detection levels to Jitterbug (Fig. 4). Regardingthe human sample, MELT was the best tool identifyinghomozygous insertions (97.8%, Table 4), whereas PoPoo-lationTE2 was the best detecting heterozygous insertions(88.2%). Taking into account both kind of insertions,PoPoolationTE2 outperformed MELT, displaying an aver-age detection level of 90.5%. The detection rate of thesetwo programs was higher on human data than in Drosoph-ila or rice, where sensitivity levels rarely exceeded 70%using 20X coverage (Fig. 4). The detection levels of Jitter-bug were similar to those found using Drosophila and rice,ranging from 47.8 to 51%. Teflon was unable to completethe task and the process was killed after five running days.Using the combination of tools, the detection rate in-creased only 3.4% for the human dataset, reaching up to93.9% (Table 4).
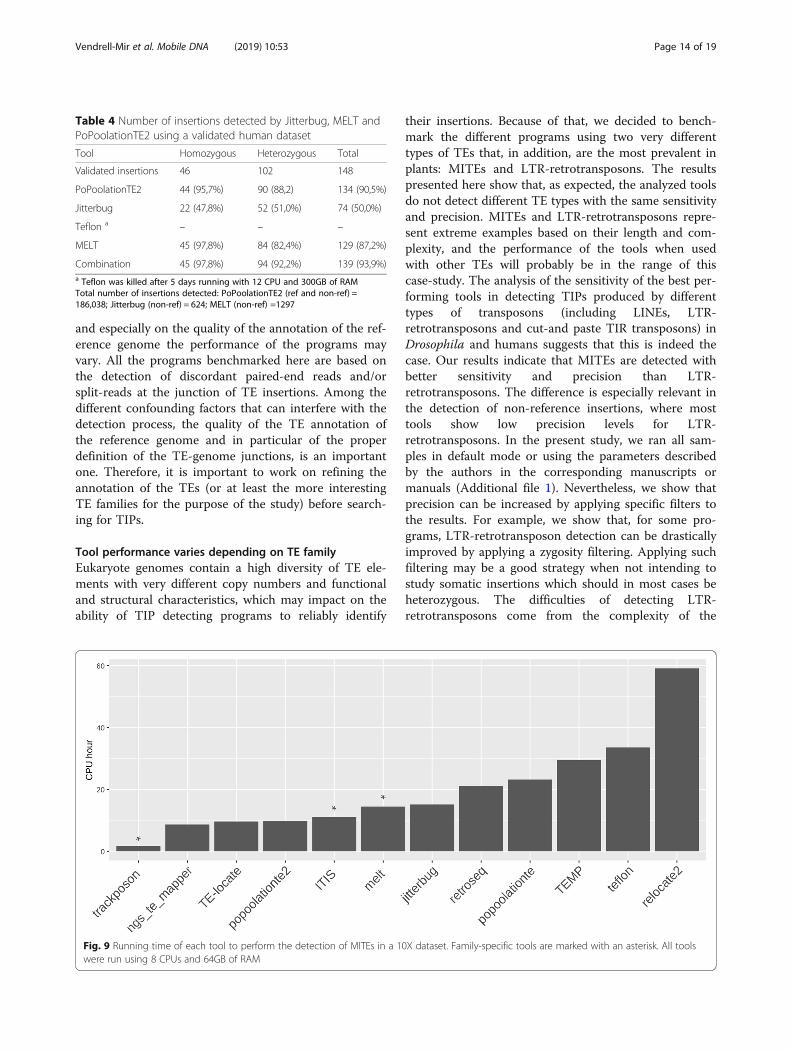
Running timeComputation time is a limiting factor when running TIPdetection tools in large datasets. Therefore, it is an im-portant criterion to take into consideration for selectingthe most appropriate tool for a specific experiment. Wetested the time needed by the tools to finish the predic-tion with a 10X dataset and 432 MITE families as input.It is important to mention that three tools (Trackposon,ITIS and MELT) work on a per-family basis. In thesecases, the reported time was that needed to finish theprediction for a single family. By contrast, the remainingtools work with all the annotated TE families at thesame time. According to our results, Trackposon wasthe fastest tool, with only 1.7 CPU hours needed to fin-ish (Fig. 9). Among the general tools, ngs_te_mapper,TE-locate and PoPoolationTE2 were the fastest tools,with 8.6, 9.6 and 9.7 CPU hours needed to finish theprediction for the 432 families. RelocaTE2 took the
Fig. 6 Venn diagrams representing the detection overlap in non-reference true positives and false positives for MITEs and LTR-retrotransposons
Vendrell-Mir et al. Mobile DNA (2019) 10:53 Page 11 of 19

largest amount of time to finish the prediction (59.1CPU hours) (Fig. 9).
DiscussionThe use of real data is essential for an accuratebenchmarking of TE insertion detection toolsThere are several tools available to detect TIPs fromshort-read resequencing data, and some efforts havebeen made to validate the performance of such tools [36,41]. However, their benchmarking has been essentiallybased on simulated TE insertions and simulated shortreads. It is challenging to perfectly simulate sequencingerrors, local coverage variations, biases due to GC con-tent or other genome specific biases that real short-readdatasets contain. Similarly, the heterogeneity of real
transposon insertions, with polymorphic truncated ordegenerated elements and elements inserted in highlyrepetitive regions, among other confounding effects, arealso difficult to simulate. As a consequence, the bench-marking using simulated data may be overestimating theperformance of the TIP prediction tools. Indeed, our re-sults show that, most of the tools here analyzed have alower sensitivity than previously reported. For example,RelocaTE2 and TEMP were previously benchmarked onsimulated rice data, and the sensitivity of both tools wasestimated to be higher than 99% at 10X [11]. On thecontrary, our results using a dataset of real insertionsand real short-read data show that both programs per-form very different, with TEMP having a maximum sen-sitivity of only 13.3% for MITE detection and
Fig. 7 Performance of tool combinations in the detection of non-reference insertions in MITEs (a) and LTR-retrotransposons (b)
Vendrell-Mir et al. Mobile DNA (2019) 10:53 Page 12 of 19

RelocateTE2 showing a 35.6% sensitivity. Similarly, wepreviously reported a sensitivity of close to 90% for Jit-terbug, a program developed in our laboratory, usingreal short reads on simulated TE insertions [21]. Our re-sults now show that for the dataset analyzed (real TIPsand real short reads) the maximal sensitivity is of 32.7%(Fig. 4, LTR-retrotransposons), although it does so witha relatively high precision. Therefore, our results suggest
that the sensitivity and precision previously reported forTIPs detection tools, determined using simulated data,are probably overestimated and that the real perform-ance of these tools is probably lower. We think that theperformance levels of the different tools presented hereare a much better estimation of their detection ability onreal datasets. It is important to note, however, that de-pending on the genome to be analyzed, parameters used
Table 3 Number of insertions detected by PoPoolationTE2, Jitterbug and Teflon using a validated Drosophila melanogaster dataset
RAL-737 RAL-40 RAL-801 RAL-802 RAL-850 RAL-502 RAL-508 RAL-491 RAL-235 RAL-21 TOTAL %
Validated insertions 17 16 9 7 4 5 7 5 4 7 81
PoPoolationTE2 12 5 9 5 3 3 6 5 3 5 56 69,1
Jitterbug 11 2 3 5 2 2 4 2 3 2 36 44,4
Teflon 12 6 9 4 3 4 5 4 4 5 56 69,1
Combination 15 6 9 7 3 4 7 5 4 6 66 81,5
Total number of insertions detected by each tool on each line is provided in Additional file 5: Table S4
Fig. 8 Performance comparison between McClintock pipeline and our proposed tool combinations for MITEs (a) and LTR-retrotransposons (b).PoPoolationTE2 and Teflon are filtered by zygosity as explained in the text (cutoffs of 0.7 and 1, respectively)
Vendrell-Mir et al. Mobile DNA (2019) 10:53 Page 13 of 19
and especially on the quality of the annotation of the ref-erence genome the performance of the programs mayvary. All the programs benchmarked here are based onthe detection of discordant paired-end reads and/orsplit-reads at the junction of TE insertions. Among thedifferent confounding factors that can interfere with thedetection process, the quality of the TE annotation ofthe reference genome and in particular of the properdefinition of the TE-genome junctions, is an importantone. Therefore, it is important to work on refining theannotation of the TEs (or at least the more interestingTE families for the purpose of the study) before search-ing for TIPs.
Tool performance varies depending on TE familyEukaryote genomes contain a high diversity of TE ele-ments with very different copy numbers and functionaland structural characteristics, which may impact on theability of TIP detecting programs to reliably identify
their insertions. Because of that, we decided to bench-mark the different programs using two very differenttypes of TEs that, in addition, are the most prevalent inplants: MITEs and LTR-retrotransposons. The resultspresented here show that, as expected, the analyzed toolsdo not detect different TE types with the same sensitivityand precision. MITEs and LTR-retrotransposons repre-sent extreme examples based on their length and com-plexity, and the performance of the tools when usedwith other TEs will probably be in the range of thiscase-study. The analysis of the sensitivity of the best per-forming tools in detecting TIPs produced by differenttypes of transposons (including LINEs, LTR-retrotransposons and cut-and paste TIR transposons) inDrosophila and humans suggests that this is indeed thecase. Our results indicate that MITEs are detected withbetter sensitivity and precision than LTR-retrotransposons. The difference is especially relevant inthe detection of non-reference insertions, where mosttools show low precision levels for LTR-retrotransposons. In the present study, we ran all sam-ples in default mode or using the parameters describedby the authors in the corresponding manuscripts ormanuals (Additional file 1). Nevertheless, we show thatprecision can be increased by applying specific filters tothe results. For example, we show that, for some pro-grams, LTR-retrotransposon detection can be drasticallyimproved by applying a zygosity filtering. Applying suchfiltering may be a good strategy when not intending tostudy somatic insertions which should in most cases beheterozygous. The difficulties of detecting LTR-retrotransposons come from the complexity of the
Fig. 9 Running time of each tool to perform the detection of MITEs in a 10X dataset. Family-specific tools are marked with an asterisk. All toolswere run using 8 CPUs and 64GB of RAM
Table 4 Number of insertions detected by Jitterbug, MELT andPoPoolationTE2 using a validated human dataset
Tool Homozygous Heterozygous Total
Validated insertions 46 102 148
PoPoolationTE2 44 (95,7%) 90 (88,2) 134 (90,5%)
Jitterbug 22 (47,8%) 52 (51,0%) 74 (50,0%)
Teflon a – – –
MELT 45 (97,8%) 84 (82,4%) 129 (87,2%)
Combination 45 (97,8%) 94 (92,2%) 139 (93,9%)a Teflon was killed after 5 days running with 12 CPU and 300GB of RAMTotal number of insertions detected: PoPoolationTE2 (ref and non-ref) =186,038; Jitterbug (non-ref) = 624; MELT (non-ref) =1297
Vendrell-Mir et al. Mobile DNA (2019) 10:53 Page 14 of 19
elements and from the local regions where they insert. Itis known that LTR-retrotransposons (especially those ofthe Gypsy superfamily) tend to integrate in heterochro-matic regions enriched in other TEs. These repetitive re-gions are likely a source of false positives that affects allthe programs tested. These repetitive regions are, in fact,difficult to annotate and polymorphisms within these re-gions may be challenging to detect even using long-readdata or when aligning good-quality assemblies. By con-trast, MITEs tend to integrate close to genes [25] andtheir flanking regions are more likely to be unique in thegenome. The presence of non-repetitive TE flanksgreatly simplifies the detection of TIPs, as the probabilityof finding multimapping reads in these regions isminimal.Another important consideration related to the differ-
ent TE families is the quality of the annotation. MITEsare easy to annotate and usually have well definedboundaries. By contrast, LTR-retrotransposons formnested insertions and are often degenerated. This makesvery difficult to accurately define their boundaries, andas a consequence many chimeric elements are usuallyannotated. As already mentioned, an accurate TE anno-tation is essential to increase the capacity of the tools toidentify TE insertions based on short-read data. In thiscontext, it could be a good strategy to identify and re-move chimeric transposons from the annotation prior tousing any of these tools (ie, when working with consen-suses or with the actual annotation). A chimeric ornested transposon, for example an LTR-retrotransposonwith a MITE inserted inside, will be targeted by readsarising from the two elements, and other MITE inser-tions of the same family present elsewhere in the gen-ome could be wrongly identified as LTR-retrotransposons insertions by the TIP detection tools.
Influence of the type of genome on the performance ofthe toolsThe ability of any of the tools to detect TIPs depend onthe nature of the transposon insertion itself and itsflanking genome sequence, and none of them can detectnew transposon insertions in repetitive regions. There-fore, in addition to the type of transposon generating theTIP, as already discussed, the performance of the toolsmay depend on the genome under study. For this reason,we have analyzed the sensitivity of the tools that per-formed the best using rice data on Drosophila and hu-man data and compared their performance on thedifferent datasets. The sensitivity of the different pro-grams analyzed in Drosophila was very similar to theone obtained in rice. As the genomes of rice and Dros-ophila are relatively different, the former being muchbigger (430Mb vs 175Mb) and with a higher content ofrepetitive sequences (37% vs 20%), this suggests that the
performance of the tools is relatively independent of thegenome used, and that the benchmarking here presentedcould be of use for TIP analysis in many differentsystems.This analysis also showed that the tools that per-
formed best on rice had an even better sensitivity on hu-man data. The difference of sensitivity was particularlyclear for PoPoolationTE2 and MELT. Although thiscould indicate a difference of the performance of thesetools in the two genomes, it could also be due to theparticular nature of the human dataset. Indeed, the data-set of validated TIPs in humans contains insertions fromTE families (LINE-1, ALU, SVA) that were detected inthe first place using only one method, based on split-read and read-pair information [44] and therefore thesensitivity of the programs on this dataset could be over-estimated. It is worth mentioning that the PCR-validatedDrosophila and human insertions have been predictedusing a small number of tools in the original publica-tions, and therefore it includes only a subset of all theinsertions present in these genomes. Moreover, the hu-man and Drosophila datasets were validated by PCR,which could have introduced a bias in the TEs that wereincluded in these datasets. However, note that the num-ber of families included in the human and Drosophilavalidation datasets are similar or bigger than the ones in-cluded in the rice dataset and contain both full-lengthand truncated TEs.
Sequencing coverage critically impacts TIP detectionIndependently of the different performance found be-tween TE families, we found that coverage has a majorimpact on tool performance for all the TE familiestested. In general sensitivity increases with increasingcoverage. Therefore, homogenization of sample coverageis essential when using TIPs prediction tools to quantita-tively compare the transposition rates between organ-isms or populations. Some tools like PopoolationTE2have internal steps to carry out this task. Nevertheless,for qualitative studies coverage homogenization is dis-couraged as down-sampling high-coverage datasets leadsto a smaller number of detected insertions. It is import-ant to note that the increase of sensitivity with increas-ing coverage comes, in most cases, with a decrease inprecision. Therefore, depending on the goals of the studya different level of coverage may be suitable. From thedata presented here it seems that a coverage below 20Xis probably not suited for most analyses, as the probabil-ity of missing true insertions is very high.
Strategies to increase tool performanceThe fact that an important fraction of the insertions de-tected by the different tools are not shared supports thefact that combining different tools may increase the
Vendrell-Mir et al. Mobile DNA (2019) 10:53 Page 15 of 19

quality of the results [36]. However, simply increasingthe number of tools does not necessarily increase thequality of predictions, due to the accumulation of tool-specific false positives (ie, the combination of five toolsyielded 95% of sensitivity but only 11.8% precision innon-ref LTR-retrotransposon detection, Fig. 7). This isdue to the fact that whereas many true insertions are de-tected by several tools, most false positives are tool-specific (Fig. 6). Combining a limited number of well-performing tools may be the best approach. Indeed, ourresults show that with the dataset used, the combinationof PoPoolationTE2 and Jitterbug to detect LTR-retrotransposon insertions, or PoPoolationTE2 and Tef-lon to detect MITEs yielded superior TIP annotations(better F1-score) than the tools alone. Also, the perform-ance of these tool combinations was better than that ofthe McClintock pipeline, especially regarding LTR-retrotransposons. In this sense, we recommend combin-ing tools based on their high precision and not only ontheir high sensitivity (ie, PoPoolationTE2 and Jitterbug).Nevertheless, there can be situations in which sensitivityhas a priority over precision (ie, re-sequencing of a sin-gle individual, or interest only on a few families). In suchcases, running more tools can be an alternative andmanual curation should be considered.
Selecting the appropriate tools for detecting TE insertionsin resequencing dataDepending on the objective of the analysis, a family-specific tool could be more interesting than a broad-spectrum tool. For example, when tracking the effect ofcertain treatment in a concrete set of elements. Anotherimportant consideration is that the amount of storageneeded is smaller in comparison to broad-spectrumtools, due to the smaller size of the alignment files. Forsuch cases, a tool such as Trackposon could be a goodoption due to its fast speed, moderate sensitivity andhigh precision. Nevertheless, as a drawback, Trackposondoes not report the exact insertion point and, whichcould be a limitation for some studies. In those cases,MELT can be an interesting alternative, although it re-quires adjusting family-specific parameters to producehigh-quality results. This might be indeed the cause whyMELT did not perform well on the detection of riceMITEs. In general, it is possible that the tools analyzedhere, which were not specifically designed for MITEsand LTR-retrotransposons, may work better for othertypes of TEs or with modifications in the parametersused. Based on our results, if the objective of the study isto analyze insertions of more than one family, and thestorage space is not a major limitation, using some ofthe top broad-spectrum tools such as PoPoolationTE2 isprobably a better option as those programs can also be
relatively fast and show high sensitivity and precision in-dependently of the species and TE type analyzed.
ConclusionsBesides the important efforts of tool developers, our re-sults suggest that the identification of TIPs is still chal-lenging. We propose here a number of approaches, suchas combining tools, which can be followed depending onthe purpose of the study and the TE families to be ana-lyzed, that can provide good results. However, it is im-portant to note that in the best scenario (combiningoptimal tools at best coverage, Fig. 7) and having a goodTE annotation of the reference genome, the sensitivitycould be around 70% with a precision of 80–90% fornon-reference insertions. These numbers may be enoughfor most studies, but it is important to keep in mind thatsome insertions will be missed, especially when estimat-ing insertion frequencies or when using TIPs for GWAS,for example. There are major limitations like the lengthof the reads that can be resolved with current technolo-gies (ie long-read sequencing) and will certainly improvein the following years. But there is still the need to de-velop new algorithms specifically designed to identifyTIPs from long reads, to generate highly curated TE an-notations of reference genomes and also more independ-ent benchmarks on real data to evaluate theperformance of tools under different conditions.
MethodsSequence data usedWe used the available data for the japonica Nipponbare(GCA_000005425.2) and the indica MH63 (GCA_001623365.1) assemblies, and the short-read resequen-cing of MH63 (SRX1639978), which were used to gener-ate the original assembly.
MITE annotationMITE-hunter [19] was run on Nipponbare and MH63assemblies to detect MITEs families, which were thencombined with the high-quality predictions available inPMITE database [9] (only families carrying TSD). Clus-tering at 90% was performed to remove redundancyusing cd-hit [17] and produce a final library. RepeatMas-ker (http://www.repeatmasker.org/) was run to annotateall regions having significant homology with any of theMITE families. The annotations were further screenedto discriminate full-length elements (consensus length ±20%) from truncated hits.
LTR-retrotransposon annotationLTR-retrotransposons were identified by runningLTRharvest [14] on IRGSP and MH63 assemblies withdefault parameters. The internal conserved domains ofthese elements were obtained running hmmscan [13],
Vendrell-Mir et al. Mobile DNA (2019) 10:53 Page 16 of 19

and only coding elements were retained for further ana-lyses. The identified elements were clustered with Silix[34] according to the 80–80 rule. All the elements ineach family were aligned with Mafft [26] and trimmedwith Trimal [6]. Consensus sequences were built fromthe alignments using the EMBOSS package [40].
Determination of benchmarking standardsWe took advantage of the availability of two high qualityrice genome assemblies (IRGSP and MH63, the formerused as reference) in order to obtain a curated dataset ofreal “reference” (orthologous) and “non-reference” (spe-cific to MH63) insertions as explained in Fig. 2. Mappingof reference and non-reference windows to MH63 gen-ome was performed using BBmap (https://sourceforge.net/projects/bbmap/). Intersections between annotationswere done with BEDtools [38].
Drosophila and human benchmarking datasetsThe Drosophila dataset consisted of 81 TIPs from tenDrosophila lines sequenced at an average coverage of42X [22], and validated by PCR by Lerat et al. [31], Mer-enciano et al. [33] and Ullastres et al. [46] (Additionalfile 4: Table S3). In Lerat et al. [31], TIPs were predictedusing TIDAL [39] and PoPoolationTE2 [29] using 14European D. melanogaster pooled populations (averagecoverage of 90X). Briefly, validated TIPs were present inthe DGRP population and at least in one Europeanpopulation at > 10% frequency, not present in the Ychromosome, and with a predicted length of < 6 kb toavoid problems with PCR amplification. In Ullastreset al. [46], TIPs were predicted by TIDAL in the DGRPpopulation [39]. Validated TIPs were inserted in regionswith recombination rates > 0, and present in at least 15DGRP strains. Finally, in Merenciano et al. [33] TIPswere also predicted by TIDAL in the DGRP population[39] and all belonged to the roo family. Both full-lengthand truncated copies were validated, as no TE length fil-ter was applied.The human dataset consisted of 148 TIPs obtained
from a human individual (NA12891, SRA accessionSRX207113) [44]. Original sequencing coverage of thehuman genome was down sampled to 20X.
TIP predictionPredictions of transposon insertions were done using the12 tools shown in Table 2 using the default parametersand / or following the recommendations of the authors.The scripts used for running each of the tools are shownin Additional file 1.
Evaluation parametersWe used the following parameters for evaluating theability of each tool to detect MITEs and LTR-
retrotransposons: True positives (TP): Insertions de-tected by any tool matching with our curated dataset ofTPs. False positives (FP): Insertions detected by any toolmatching with our curated dataset of FPs. False nega-tives (FN): Insertions present in our curated dataset ofTPs, not detected by the evaluated tool. These primaryparameters were used for calculating the final bench-marking ratios that have been previously used for asses-sing the performance of similar tools [41].
Sensitivity = TP/ (TP+ FN).Precision = TP/ (TP + FP)F1-score = 2 x [(Precision x Sensitivity) / (Precision
+ Sensitivity)]
Supplementary informationSupplementary information accompanies this paper at https://doi.org/10.1186/s13100-019-0197-9.
Additional file 1. Scripts used to run all TIP detection tools. (.sh) (SH 13 kb)
Additional file 2 : Table S1. Insertion dataset used for benchmarking.Contains all the TP reference and non-reference windows, as well as allFP windows. (.xlsx)
Additional file 3 : Table S2. Numerical benchmark results. (.xlsx)
Additional file 4 : Table S3. Drosophila melanogaster TE insertionsvalidated by PCR. TE names are provided in the table when authors gavenames to the non-reference insertions. All insertions were validatedbased on PCR band sizes. Validated insertion sites are provided when au-thors sequenced PCR bands evidencing the presence of a particular inser-tion. ND: not determined. (xlsx)
Additional file 5 : Table S4. Total number of insertions detected byPoPoolationTE2, Jitterbug and Teflon in ten Drosophila lines. (xlsx)
Additional file 6 : Figure S1. Number of MH63 reference and non-reference insertions detected by direct comparison of 1000 LTR-retrotransposon flanking sites of different sizes from MH63 and Nippon-bare genomes. (.pdf)
Additional file 7 : Figure S2. Application of zygosity filtering toPoPoolationTE2. PoPoolationTE2-F means that it was run and filtered atzygosity 0.7. PopoolationTE2-R corresponds to the raw results. (.png)
AcknowledgementsNot applicable.
Authors’ contributionsFB ran Jitterbug, MELT and produced the LTR-retrotransposon annotation. PVran all TIP detection tools and analyzed the data. RC produced the MITE an-notation and the final dataset of TE insertions and analyzed the data to-gether with PV. MM and JG participated in the benchmarking usingDrosophila and human datasets. JMC and RC conceived the study and wrotethe manuscript. All the authors reviewed the final manuscript. All authorsread and approved the final manuscript.
FundingThis work was supported in part by grants from the Ministerio de Economiay Competitividad (AGL2016–78992-R). Fabio Barteri and Pol Vendrell hold aFPI (Formación de Personal Investigador) fellowship from the SpanishMinisterio de Economia y Competitividad. Raúl Castanera holds a Juan de laCierva Postdoctoral fellowship from the Spanish Ministerio de Economia yCompetitividad. JG is funded by the European Commission (H2020-ERC-2014-CoG-647900) and the Spanish Ministerio de Ciencia, Innovación yUniversidades/AEI/FEDER, EU (BFU2017–82937-P).
Vendrell-Mir et al. Mobile DNA (2019) 10:53 Page 17 of 19

Availability of data and materialsThe datasets analyzed during the current study are available in the NCBIrepository:- Nipponbare Assembly: GCA_000005425.2- MH63 assembly: GCA_001623365.1- Short-read resequencing data of MH63: SRX1639978- Human resequencing reads: SRX207113- Drosophila resequencing reads: PRJNA36679
Ethics approval and consent to participateNot applicable.
Consent for publicationNot applicable.
Competing interestsThe authors declare that they have no competing interests.
Author details1Centre for Research in Agricultural Genomics CSIC-IRTA-UAB-UB, CampusUAB, Edifici CRAG, Bellaterra, 08193 Barcelona, Spain. 2Institute ofEvolutionary Biology (CSIC-Universitat Pompeu Fabra), Passeig MaritimBarceloneta 37-49, 08003 Barcelona, Spain.
Received: 28 June 2019 Accepted: 17 December 2019
References1. Adrion JR, Song MJ, Schrider DR, Hahn MW, Schaack S. Genome-wide
estimates of transposable element insertion and deletion rates inDrosophila melanogaster. Genome Biol Evol. 2017;9(5):1329–40.
2. Alkan C, Coe BP, Eichler EE. Genome structural variation discovery andgenotyping. Nat Rev Genet. 2011;12(5):363–76.
3. Bogaerts-Márquez M, Barrón MG, Fiston-Lavier A-S, et al. T-lex3: an accuratetool to genotype and estimate population frequencies of transposableelements using the latest short-read whole genome sequencing data.Bioinformatics. 2019, btz727.
4. Butelli E, Licciardello C, Zhang Y, et al. Retrotransposons control fruit-specific, cold-dependent accumulation of anthocyanins in blood oranges.Plant Cell. 2012;24(3):1242–55.
5. Cao Y, Chen G, Wu G, et al. Widespread roles of enhancer-like transposableelements in cell identity and long-range genomic interactions. Genome Res.2019;29(1):40–52.
6. Capella-Gutiérrez S, Silla-Martínez JM, Gabaldón T. trimAl: a tool forautomated alignment trimming in large-scale phylogenetic analyses.Bioinformatics. 2009;25(15):1972–3.
7. Carpentier M-C, Manfroi E, Wei F-J, et al. Retrotranspositional landscape ofAsian rice revealed by 3000 genomes4. Nat Commun. 2019;10(1):2.
8. Carr M, Bensasson D, Bergman CM. Evolutionary genomics of transposableelements in Saccharomyces cerevisiae. Plos One. 2012;7(11):e50978.
9. Chen J, Hu Q, Zhang Y, Lu C, Kuang H. P-MITE: a database for plantminiature inverted-repeat transposable elements. Nucleic Acids Res. 2014;42(Database issue):D1176–81.
10. Chen J, Lu L, Benjamin J, et al. Tracking the origin of two geneticcomponents associated with transposable element bursts in domesticatedrice. Nat Commun. 2019;10(1):641.
11. Chen J, Wrightsman TR, Wessler SR, Stajich JE. RelocaTE2: a high resolutiontransposable element insertion site mapping tool for populationresequencing. PeerJ. 2017;5:e2942.
12. Chuong EB, Elde NC, Feschotte C. Regulatory activities of transposableelements: from conflicts to benefits. Nature Reviews. Genetics. 2017;18(2):71–86.
13. Eddy SR. Accelerated profile HMM searches. PLoS Comput Biol. 2011;7(10):e1002195.
14. Ellinghaus D, Kurtz S, Willhoeft U. LTRharvest, an efficient and flexiblesoftware for de novo detection of LTR retrotransposons. BMCBioinformatics. 2008;9:18.
15. Ewing AD. Transposable element detection from whole genome sequencedata. Mob DNA. 2015;6:24.
16. Flutre T, Duprat E, Feuillet C, Quesneville H. Considering transposableelement diversification in de novo annotation approaches. Plos One. 2011;6(1):e16526.
17. Fu L, Niu B, Zhu Z, Wu S, Li W. CD-HIT: accelerated for clustering the next-generation sequencing data. Bioinformatics. 2012;28(23):3150–2.
18. Gardner EJ, Lam VK, Harris DN, et al. The Mobile element locator tool(MELT): population-scale mobile element discovery and biology. GenomeRes. 2017;27(11):1916–29.
19. Han Y, Wessler SR. MITE-hunter: a program for discovering miniatureinverted-repeat transposable elements from genomic sequences. NucleicAcids Res. 2010;38(22):e199.
20. Hénaff E, Vives C, Desvoyes B, et al. Extensive amplification of the E2Ftranscription factor binding sites by transposons during evolution ofBrassica species. Plant J. 2014;77(6):852–62.
21. Hénaff E, Zapata L, Casacuberta JM, Ossowski S. Jitterbug: somatic andgermline transposon insertion detection at single-nucleotide resolution.BMC Genomics. 2015;16:768.
22. Huang W, Massouras A, Inoue Y, et al. Natural variation in genomearchitecture among 205 Drosophila melanogaster genetic reference panellines. Genome Res. 2014;24(7):1193–208.
23. International Rice Genome Sequencing Project. The map-based sequence ofthe rice genome. Nature. 2005;436(7052):793–800.
24. Jiang C, Chen C, Huang Z, Liu R, Verdier J. ITIS, a bioinformatics tool foraccurate identification of transposon insertion sites using next-generationsequencing data. BMC Bioinformatics. 2015;16(1):72.
25. Jiang N, Wessler SR. Insertion preference of maize and rice miniatureinverted repeat transposable elements as revealed by the analysis of nestedelements. Plant Cell. 2001;13(11):2553–64.
26. Katoh K, Standley DM. MAFFT multiple sequence alignment softwareversion 7: improvements in performance and usability. Mol Biol Evol. 2013;30(4):772–80.
27. Keane TM, Wong K, Adams DJ. RetroSeq: transposable element discoveryfrom next-generation sequencing data. Bioinformatics. 2013;29(3):389–90.
28. Kobayashi S, Goto-Yamamoto N, Hirochika H. Retrotransposon-inducedmutations in grape skin color. Science. 2004;304(5673):982.
29. Kofler R, Gómez-Sánchez D, Schlötterer C. PoPoolationTE2: comparativepopulation genomics of transposable elements using Pool-Seq. Mol BiolEvol. 2016;33(10):2759–64.
30. Kofler R, Orozco-terWengel P, De Maio N, et al. PoPoolation: a toolbox forpopulation genetic analysis of next generation sequencing data frompooled individuals. Plos One. 2011;6(1):e15925.
31. Lerat E, Goubert C, Guirao-Rico S, et al. Population-specific dynamics andselection patterns of transposable element insertions in European naturalpopulations. Mol Ecol. 2019;28(6):1506–22.
32. Linheiro RS, Bergman CM. Whole genome resequencing reveals naturaltarget site preferences of transposable elements in Drosophilamelanogaster. Plos One. 2012;7(2):e30008.
33. Merenciano M, Iacometti C, González J. A unique cluster of roo insertions inthe promoter region of a stress response gene in Drosophila melanogaster.Mob DNA. 2019;10:10.
34. Miele V, Penel S, Duret L. Ultra-fast sequence clustering from similaritynetworks with SiLiX. BMC Bioinformatics. 2011;12:116.
35. Naito K, Zhang F, Tsukiyama T, et al. Unexpected consequences of a suddenand massive transposon amplification on rice gene expression. Nature.2009;461(7267):1130–4.
36. Nelson MG, Linheiro RS, Bergman CM. McClintock: an integrated pipeline fordetecting transposable element insertions in whole-genome shotgunsequencing data. G3. 2017;7(8):2763–78.
37. Platzer A, Nizhynska V, Long Q. TE-locate: a tool to locate and grouptransposable element occurrences using paired-end next-generationsequencing data. Biology. 2012;1(2):395–410.
38. Quinlan AR, Hall IM. BEDTools: a flexible suite of utilities for comparinggenomic features. Bioinformatics. 2010;26(6):841–2.
39. Rahman R, Chirn G, Kanodia A, et al. Unique transposon landscapes arepervasive across Drosophila melanogaster genomes. Nucleic Acids Res.2015;43(22):10655–72.
40. Rice P, Longden I, Bleasby A. EMBOSS: the european molecular biologyopen software suite. Trends Genet. 2000;16(6):276–7.
41. Rishishwar L, Mariño-Ramírez L, Jordan IK. Benchmarking computationaltools for polymorphic transposable element detection. Brief Bioinform. 2017;18(6):908–18.
Vendrell-Mir et al. Mobile DNA (2019) 10:53 Page 18 of 19
42. Sanseverino W, Hénaff E, Vives C, et al. Transposon insertions, structuralvariations, and snps contribute to the evolution of the melon genome. MolBiol Evol. 2015;32(10):2760–74.
43. Slotkin RK, Martienssen R. Transposable elements and the epigeneticregulation of the genome. Nat Rev Genet. 2007;8(4):272–85.
44. Stewart C, Kural D, Strömberg MP, et al. A comprehensive map of mobileelement insertion polymorphisms in humans. PLoS Genet. 2011;7(8):e1002236.
45. Studer A, Zhao Q, Ross-Ibarra J, Doebley J. Identification of a functionaltransposon insertion in the maize domestication gene tb1. Nat Genet. 2011;43(11):1160–3.
46. Ullastres A, Merenciano M, González J. Natural transposable elementinsertions drive expression changes in genes underlying Drosophilaimmune response. BioRxiv. 2019, 655225.
47. Zhang J, Chen L-L, Sun S, et al. Building two indica rice reference genomeswith PacBio long-read and Illumina paired-end sequencing data. Sci Data.2016;3:160076.
48. Zhuang J, Wang J, Theurkauf W, Weng Z. TEMP: a computational methodfor analyzing transposable element polymorphism in populations. NucleicAcids Res. 2014;42(11):6826–38.
Publisher’s NoteSpringer Nature remains neutral with regard to jurisdictional claims inpublished maps and institutional affiliations.
Vendrell-Mir et al. Mobile DNA (2019) 10:53 Page 19 of 19