A BAYESIAN ESTIMATION OF THE RELATIONSHIP AMONG ECONOMIC FUNDAMENTALS...
22
* Department of Economics and Statistics, University of Benin, Benin City, Nigeria, E-mail: [email protected], [email protected] ** Department of Finance, University of Lagos, Akoka, Nigeria, E-mail: [email protected] *** Access Global Consult, Palmgrove, Lagos, Nigeria, E-mail: [email protected] Asian-African Journal of Economics and Econometrics, Vol. 13, No. 2, 2013: 189-208 A BAYESIAN ESTIMATION OF THE RELATIONSHIP AMONG ECONOMIC FUNDAMENTALS AND STOCK MARKET PERFORMANCE IN NIGERIA Mustapha Saidi Atanda * , Nureni-Balogun Akeem Ade ** and Yusuf Ismaila Akanni *** ABSTRACT The traditional monetary transmission channels show the role of interest rates and money supply in stimulating asset prices and output in an economy. In an attempt to validate this claim the study verifies the interdependence among economic fundamentals and the stock market through the asset and credit channels. The empirical investigation was conducted using VEC causality and Bayesian VAR model. Macroeconomic variables of importance were money supply, inflation, monetary policy rate, credit to the private sector and exchange rate. The stock market index – All Share Index – is used to measure stock activities. Empirical results showed that both credit and asset channels were effective vantage point in transmitting macroeconomic responses to the economy. However, the results also showed that the stock market could be an effective channel of transmission in the near term. The monthly data used were sourced from the Central Bank of Nigeria and Nigerian Stock Exchange websites (2000-2011). Keywords: Monetary Policy, Money growth, Asset Price Channel, Credit Channel, Causality, Vector Autoregressive model, Bayesian VAR model. JEL Classification: C11, G10, G15, G19, N27 1. INTRODUCTION The central banks’ monetary policy in a simplified analysis is the optimal quantity of money. In a financial sense, monetary policy is the optimal rate of growth of stock of money. More generally, monetary policy is a bundle of actions and regulatory stances taken by the central bank. Monetary policy decisions affect the economy in general and the price level to be specific, the process of achieving this impact assessment is known as the transmission mechanism of monetary policy. The transmission of monetary impulses to both the real and financial sectors involves a numerous mechanisms and actions by economic agents at various stages. As a result, monetary policy action, considerable time to affect price developments usually takes place. Furthermore, the size and strength of the different effects depend on the state, sectors’ elasticity and investors’
Transcript of A BAYESIAN ESTIMATION OF THE RELATIONSHIP AMONG ECONOMIC FUNDAMENTALS...

A Bayesian Estimation of the Relationship among Economic Fundamentals... 189
* Department of Economics and Statistics, University of Benin, Benin City, Nigeria, E-mail:[email protected], [email protected]
** Department of Finance, University of Lagos, Akoka, Nigeria, E-mail: [email protected]*** Access Global Consult, Palmgrove, Lagos, Nigeria, E-mail: [email protected]
Asian-African Journal of Economics and Econometrics, Vol. 13, No. 2, 2013: 189-208
A BAYESIAN ESTIMATION OF THE RELATIONSHIPAMONG ECONOMIC FUNDAMENTALS AND STOCK
MARKET PERFORMANCE IN NIGERIA
Mustapha Saidi Atanda*, Nureni-Balogun Akeem Ade** andYusuf Ismaila Akanni***
ABSTRACT
The traditional monetary transmission channels show the role of interest rates and money supplyin stimulating asset prices and output in an economy. In an attempt to validate this claim thestudy verifies the interdependence among economic fundamentals and the stock market throughthe asset and credit channels. The empirical investigation was conducted using VEC causalityand Bayesian VAR model. Macroeconomic variables of importance were money supply, inflation,monetary policy rate, credit to the private sector and exchange rate. The stock market index – AllShare Index – is used to measure stock activities. Empirical results showed that both credit andasset channels were effective vantage point in transmitting macroeconomic responses to theeconomy. However, the results also showed that the stock market could be an effective channel oftransmission in the near term. The monthly data used were sourced from the Central Bank ofNigeria and Nigerian Stock Exchange websites (2000-2011).
Keywords: Monetary Policy, Money growth, Asset Price Channel, Credit Channel, Causality,Vector Autoregressive model, Bayesian VAR model.
JEL Classification: C11, G10, G15, G19, N27
1. INTRODUCTION
The central banks’ monetary policy in a simplified analysis is the optimal quantity of money. Ina financial sense, monetary policy is the optimal rate of growth of stock of money. More generally,monetary policy is a bundle of actions and regulatory stances taken by the central bank. Monetarypolicy decisions affect the economy in general and the price level to be specific, the process ofachieving this impact assessment is known as the transmission mechanism of monetary policy.The transmission of monetary impulses to both the real and financial sectors involves a numerousmechanisms and actions by economic agents at various stages. As a result, monetary policyaction, considerable time to affect price developments usually takes place. Furthermore, thesize and strength of the different effects depend on the state, sectors’ elasticity and investors’

190 Mustapha Saidi Atanda, Nureni-Balogun Akeem Ade and Yusuf Ismaila Akanni
opinion of the economy, which makes the precise impact difficult to estimate and this form thebasis why this research is pertinent to the development of the Nigerian environs. More generally,central banks typically see themselves confronted with long variable and uncertain lags in theconduct of monetary policy.
In an attempt, to achieve a set of objective for the macroeconomic policy (Inflation, realoutput and employment); monetary policy actions such as changes in the discount rate have anindirect effect on these variables and considerable lags are involved in the policy transmissionmechanism. Broader financial markets though, for example the stock market, government andcorporate bond markets, mortgage markets, foreign exchange markets, are quick to incorporatenew information. Therefore, a more direct and immediate effect of changes in the monetarypolicy instruments may be identified using financial data. Identifying the link between monetarypolicy and financial asset prices is highly important to gain a better insight in the transmissionmechanism of monetary policy, since changes in asset prices play a key role in several channels–other asset prices and credit channels.
According to the dividend discount and discounted cash flow models, stock prices areequal to the present value of expected future met cash flows. Changes in stock prices determinethe responsiveness of investors to investment in securities and that explains the performance ofthe stock market. Therefore, aggregate assessment requires better understanding of the impactof macroeconomic variables on the performance of stock market which justifies the purpose ofthis work. Monetary policy play important role in determining equity returns either by alteringthe discount rate used by market participants or by influencing market participants expectationsof future economic activity.
Going by related channels of transmission, an expansionary monetary policy is commonlyviewed as good news for investors as this generates lower interest rate, increase future economicactivity and higher earnings for the firm in the economy. Thus, monetary policy tighteningshould come with lower stock prices as interest rate rises which gives higher discount rate forthe expected stream of cash flows and lower the future expected returns and economic activity.Therefore, stock market participants manage to understudy strategies based on the stance ofthe monetary authority as inferred by changes in indicators of the central bank policy. Therefore,this paper focuses on the interdependence of monetary policy variables and the stock marketvariable proxy by the All share Index.
Previous empirical results largely support the notion that expansionary (contractionary)monetary policy increases (decreases) contemporaneous stock returns, as well as expectedreturns1. In these studies they actually relate stock returns to measures of monetary policystringency in the context of single equation specifications and/or multivariate VectorAutoregressions. Upward shift in risk premium, movements in monetary aggregates andmarket interest rates are crucial factors that increase stock prices2 (Oyama, 1997). Previousresults indicate that for the majority of the countries reveal that monetary environment is animportant determinant of investors’ required returns. This holds across variety of returnsspecifications. This clearly shows that expansionary monetary policy improves the stockmarket and boost stock market performance. Policy implication of this result lies on the factthe monetary authorities and stock market participants should be aware of the relationship

A Bayesian Estimation of the Relationship among Economic Fundamentals... 191
between monetary policy and stock market performance in order to understand the effects ofpolicy shifts.
Purfield (2007) explains the relevance of asset prices as been leading indicators for futurechanges in economic activity because asset prices reflect the discounted value of expectedfuture dividend vis a vis expected growth. Thorbecke (1997) finds out that positive monetarypolicy shocks increase stock returns when this happens, it suggests that monetary policy exertsreal effects by increasing future cash flows or by decreasing the discount factors at whichthose cash flows are capitalized. Bernanke and Kuttner (2004) state that, a tightening monetarypolicy lead investors to view stocks as riskier investment and thus will demand for a higherreturn to hold stocks. From these review, it is clear that previous empirical work had found thatthe monetary authority’s decisions affect asset prices, including stock prices. Nevertheless,less attention had been directed to observe the link between monetary policy variables and thestock market in Nigeria even till date.
The overall objective of this paper is to provide empirical evidence on the relationshipbetween economic fundamentals and one of the most pronounced branch of financial markets,the stock market. It is evident that stock price are amongst the most closely monitored assetsprices in the world as they are highly sensitive to economic forces (Butt, 2010), therefore,critical examination of its response to changes in macroeconomic variables are major concern.The specific objectives contain the causal relationship between selected monetary variablesand the stock market indicator. Secondly, stock prices often exhibit pronounced volatility andboom-bust cycles leading to concerns about sustained deviations from their fundamental valueswhich when corrected have significant reverse consequence for stock market performance andeconomic growth. Thus, the existence of volatility strength of the stock market series shall alsobe verified. More so, establishing the existence of a stock market response to macroeconomicvariables using quantitative methodology will not only be germane to research on stock marketdeterminants but will also contribute to a deeper understanding of the conduct of economicand financial policy and of the potential economic impact of policy actions in Nigeria.
The organization of this paper is as follows: the next section discusses the review of relatedvast empirical literature while section three presents the theoretical framework and methodologydesign underlying the link between economic fundamentals and stock market. Section four consistsof various methods to be employed. Section five comprises results and discussion and responsesof the stock market. Lastly, section six provides conclusions and policy implications of the paper.
2. REVIEW OF LITERATURE
The fundamental approach is that the introduction of restrictive monetary policy to regulate theeconomy will leave the investors with no opportunity to raise fund except through the stockmarket3. Friedman (1956), attempted to integrate two separable decisions to be made by agents;the first relates to the decision on the quantity of savings and decision on how to allocate thosesavings among assets in a portfolio and in so doing transformed the liquidity preference theoryof the demand for money. In other words, he proposed that portfolio allocation decisions couldhave an impact on consumption – investment decisions determined by the interest ratemovements4.

192 Mustapha Saidi Atanda, Nureni-Balogun Akeem Ade and Yusuf Ismaila Akanni
Bernanke and Blinders (1992) observed that as interest rates are rising, firms that havetheir loan sourcing potentials eroded by high interest rates will suffer some adjustment costswhich can be traced to the effect of monetary contraction which include a reduction in bankdeposits and their holding of securities, a lagged decrease in bank loans, and measures ofaggregate output will respond to monetary impulses with a similar lag and simultaneouslybank loans will suffer a decline. The lending channel has often restricted the traditional monetarystance Bofinger (2001) illustrated this using a three variable model on an IS-LM frameworkwhich includes, money, bonds and reserves that banks hold with the central bank. Bernankeand Gertler (1995) found that monetary policy does not only affect the interest rate but also theexternal finance premium and this brings to light the notion of credit channel of monetarytransmission mechanism. The lending channel however, is an extension of the credit channel,and the main focus is on banks which is consistent with the finding that banks are the majorconveyors of monetary policy impulses to the real sectors of the economy.
Thorbecke (1997) makes use of quite number of alternative methodologies to examine therelationship between monetary policy and stock prices in the United States. He adopts theVAR modeling framework, his findings was that monetary policy shocks, measured byorthogonal innovations in the Fed funds rate have higher impact on smaller capitalizationstocks, this is in line with the hypothesis that monetary policy affects firms’ access to credit.Cassola and Morana (2004) also employ VAR methodology, in their study they employed thecointegrated VAR system with variables like real GDP, Inflation< real money balances (M3),short term interest rate, bond yield, and real stock prices in order to examine the transmissionmechanism of monetary policy in the Euro area. Their results indicate that a permanent positivemonetary shock has a temporary positive effect on real stock prices.
Following Fama and French5 (1989), Patelis (1997) observed that predictability in excessUS stock returns can be attributed to shifts in monetary policy stance. He also finds that monetarypolicy variables are significant predictors of future returns, although they cannot account fullyfor the observed stock return predictability. Jensen and Johnson (1995) also find that monetarypolicy developments are associated with patterns in stock returns. They were establish thatlong term stock returns following discount rate decreases are higher and less volatile thanreturns following rate increases. Their motivation for the use of discount rate as a proxy for thestance of monetary policy follows from the view that the discount rate is typically regarded asa signal of monetary developments. Conover, Jensen and Johnson (1999) argue that not onlyUS stock returns, but also returns on foreign markets are related with US monetary environments.They find that stock returns in twelve OECD countries over the period 1956-1995 are generallyhigher in expansive US and local monetary environments than they are in restrictiveenvironments.
2.1. Stock Market Operation and Performance
The Lagos State Exchange commenced operations in 1961; it was renamed the Nigerian StockExchange (NSE) in 1977. Branches were established in eight locations.6 The total number oflisted stocks increased from 9 in 1961 to 52 in 1971 and 71 in 1978. It also increased to 157 in1980, 276 in 1994, 277 in 2004 respectively. However, it declined to 260 in 2000, 202 in 2006
A Bayesian Estimation of the Relationship among Economic Fundamentals... 193
and further increased to 212 in 2007, 213 in 2008 and 266 in 2009. It noticed a sharp drop in2010 to 217 (Ariyo and Adelegan, 2005; and Mustapha, 2011). The determination of shareprices is not exclusively left to the forces of demand and supply. Both NSE and SEC, as marketregulators, can and sometimes do impose a cap on share price movement. Nse has widened theprice cap but that does not affect the efficiency of the market and its pricing policy, however,prices is known to reflect available market information (Olowe, 1998; Oludoyi, 1999; andAdelegan, 2003).
NSE transited from the call over trading system to the automated trading system (ATS).An electronic business platform was commissioned in 2003. The approach facilitates investors’transactions in the Central Securities Clearing System (CSCS) database for easy monitoring oftheir accounts. The Nigerian securities market trade alert information was introduced in 2005.The mobile phone alert system alert stockholders of any transaction in their stock within 24hours. Nigeria’s stock market is still developing. A number of studies have been conducted toidentify the level of efficiency and the problem hindering development of the market (Omole,1999; Oludoyi, 1999; Adelegan, 2003). Few description of the recent performance in the stockmarket is described below.
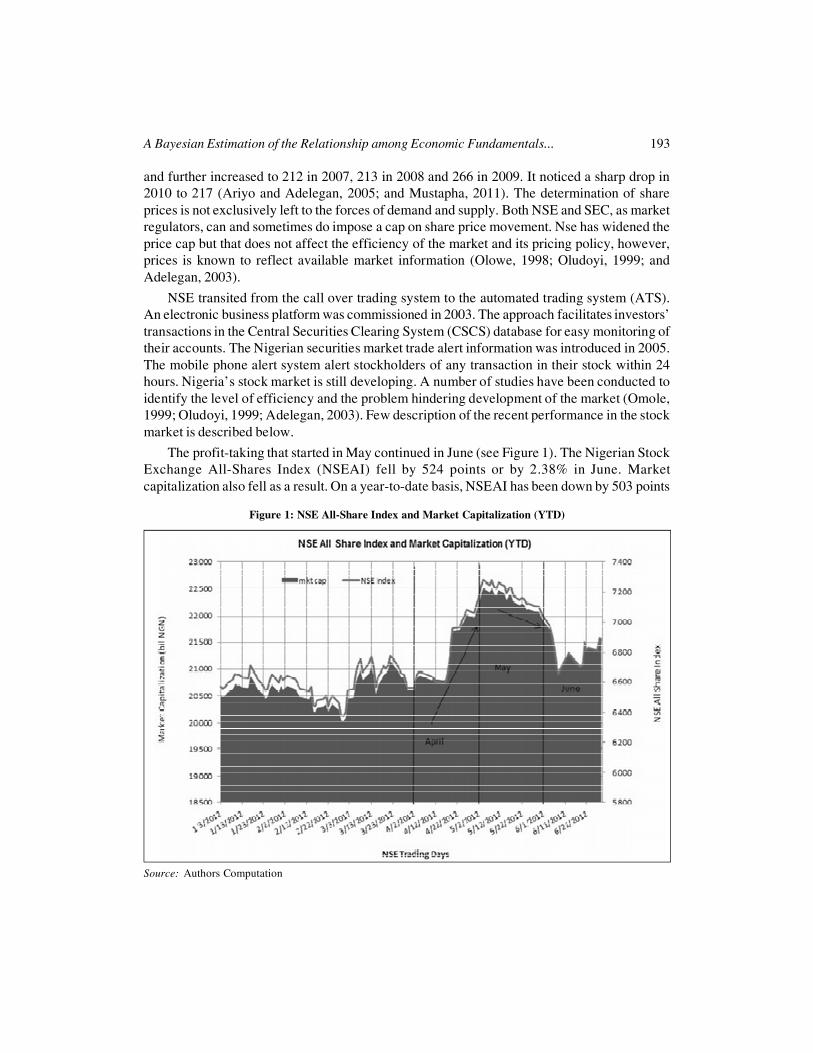
The profit-taking that started in May continued in June (see Figure 1). The Nigerian StockExchange All-Shares Index (NSEAI) fell by 524 points or by 2.38% in June. Marketcapitalization also fell as a result. On a year-to-date basis, NSEAI has been down by 503 points
Figure 1: NSE All-Share Index and Market Capitalization (YTD)
Source: Authors Computation

194 Mustapha Saidi Atanda, Nureni-Balogun Akeem Ade and Yusuf Ismaila Akanni
or by 2.28%. The trading volume increased compared to May. As clearly observed in figure 1,most year-to-date gains on the NSEAI were recorded in the second half of April making thelast two weeks of April the most profitable period of 2012 so far. The NSEAI finished April atover 22,000 points. The rally lasted until May 4th reaching the YTD peak of 22,666 points andsliding ever since. The NSEAI lost 1123 points (close to 5% of its value) from the May 4th peaktill the end of June. On a year-to-date(YTD) basis the NSEAI has been down by 503 points orby 2.28% and subsequently the market capitalization of the companies listed on the NSE hasdecreased by N344 billion or by 5% compared to 2011-end.
2.2. Macroeconomic Environs and Stock Market
Money Supply and Stock Prices
There has been no clear-cut on the effects of money supply on stock prices. a positive causalrelationship which is hypothesized in financial theory literature by (Sprinkel, 1964, Homa andJaffe 1971, Hamburger and Kochin 1972, Pearce and Roley 1985, Husain and Mahmood, 1999).This is based on the assumption of inverse relationship between money supply to interest rates,and negative causal relation from interest rates to stock prices (Alatiqi and Fazel, 2008). However,some studies found positive causal relationship and argue for non existence of a stable andstructural relationship (Pesando, 1974. Kraft and Kraft, 1997, Gupta, 1974).
Money supply growth is expected to lead to a decrease in interest rates which will lead toa decrease in the discounting factor on future receipts. This is expected to lead to an increaseddemand for shares as the share prices and returns soar. However, an increase in money supplywill also lead to an increase in money demand therefore the shift in the money demand functionto the right would result in the simultaneous shift of the money supply to the right as well. Thisgenerates a new equilibrium interest rate above the old interest rate. Therefore, the assumptionthat is made is that the effects of factors that lead to a decline in interest rates outweigh thosethat may result in ultimately a higher equilibrium interest (Alatiqi and Fazel, 2008).Hashemzadeh and Taylor (1988) have found bi-directional causality present in the regressionmodels between money supply and stock returns using stock indexes to estimate stock returns.Financial theory postulates that an increase in money supply increases the demand for stockswhich rallies the price of shares.
Interest Rates and Stock Prices
Theoretically the interest rates and stock prices have an inverse relationship. The is because arise in interest rate reduces the present value of future dividends income which should depressstock prices (Hamrita, Abdullah and Ammou, 2009). Conversely, low interest rates results inlower opportunity cost of borrowing. Lower interest rates stimulate investments and economicactivities which will cause prices to rise. The direction of causality seems to be mostly runningfrom interest rates to stock price but not the other way an indication of bi-directional causality.The link between stock prices and nominal interest rates mirrors the ability of an investor toadjust the structure of her portfolio between stock and bonds (Apergis and Eleftheriou (2000).The implication is therefore that an interest rate increase (decrease) prompts our representative

A Bayesian Estimation of the Relationship among Economic Fundamentals... 195
investor to change the composition of her portfolio in favour of (against) bonds. Malkiel (1982)and Modigliani and Cohn (1979) argue that the interest rates seem to be the most importantdeterminants of stock prices. There is no consensus in literature over the actual relationshipbetween stock prices and interest rates. Empirical attempts provide evidence in favour of apositive, rather than a negative relationship in other empirical studies (Asprem, 1989, Shillerand Beltratti, 1992 and Barsky, 1989). This paper therefore endeavours to link up and explainthe nature that exists between stock prices and interest rates in Nigeria.
Stock Prices and Inflation
Sourial (2002) observes that inflation is positively related to interest rates and negatively relatedto stock prices. This is refers to as inflation expectation hypothesis. Modigliani and Cohn (1979)argue that stock market react inappropriately to inflation due to investors’ ignorance that interestrate rise to compensate for the rise in inflation. When interest rates increase investors view thisas an increase in the cost of production since cost of capital has increased and they increaseprices of their goods and services. The price level rises yet the objective of monetary authoritiesis to curtail the pressure of inflation which is interpreted wrongly by the market. However,stock prices of firms go down, since stocks are now less attractive, on top of that companies’profitability is affected by rising inflation as households reduce their consumption in expectationof tougher times ahead.
3. THEORETICAL FRAMEWORK
This section points out the theoretical link between monetary policy and the stock market.Previous argument in this respect had two broad divisions; the first division is the group thatbelieves that the link runs from monetary policy to the stock market. Whilst the other groupargues that the link runs from the stock market to monetary policy. Stock market players need tobe aware policy direction as it affects their activities and decisions. Theory acknowledges thatmarket reacts to unexpected changes which are surprise announcements by the monetaryauthorities. The major theoretical link between monetary policy and stock market to be adoptedby this study is based on the interest rate channel.
3.1. Money Supply and Interest Rate Channel
Interest rate channel is the traditional transmission mechanism7. It can be easily regarded as themain channel since it has an indirect impact on other monetary channels. Adjustment andvariations in interest rates have impact on asset prices by altering the discount rate which is animportant determinant of asset pricing (Faure, 2003). An interest rate adjustment also has aneffect on the exchange rate through its impact on capital flows and exchange rate is part of therelevant variable monitor by the central bank of an economy (Neri, 2004).
A central bank can pursue an expansionary monetary policy by adjusting its policyinstrument, either decreasing its policy interest rate or increasing its monetary aggregate underits control. A restrictive monetary policy involves increasing the policy interest rate or decreasingmonetary aggregate under the Central Bank control. For instance, a tightening monetary policyin most cases this result in the decline of money supply, this policy is associated with higher

196 Mustapha Saidi Atanda, Nureni-Balogun Akeem Ade and Yusuf Ismaila Akanni
interest rates. Cost of capital increases when interest rates have been increased consequentlyleading to a reduction in the demand for credit which leads to decline in investment and aggregatedemand and output decline for there no longer meaningful investment.
Figure 2: A Schematic Flow Chart of Macroeconomic Variables, Stock Price andAggregate Output Monetary Variables
Source: Author’s Computation
There are various ways of valuing equity but the interest in this paper goes for twoapproaches, Smith (1925) and Gordon Growth Model (1962), net present values models. Theinterest rate just discussed is a component of these valuation methods indirectly through therate of return. Therefore the review of stock valuation methods shall be discussed in the sub-section below:
3.2. Stock Market Valuation and Interest Rates
In financial theory, issues relating to valuation of shares in the stock market are based on thepresent value model. There are two versions of the present value in the literature namely Smith(1925) and Gordon (1962) version (Moolman, 2004). The purpose of stock valuation methodsis to attempt to estimate the intrinsic value of a share. The major reason for adopting stockvaluation methods is to attempt to estimate the intrinsic value of a share. The current interestrate is used to discount future dividend flows. Lucas (1978) postulated that the price of a stock
A Bayesian Estimation of the Relationship among Economic Fundamentals... 197
is given by the discounted sum of future dividend payments. A change in supply of money willlead investors to revalue the stock market (Sellin, 2001).
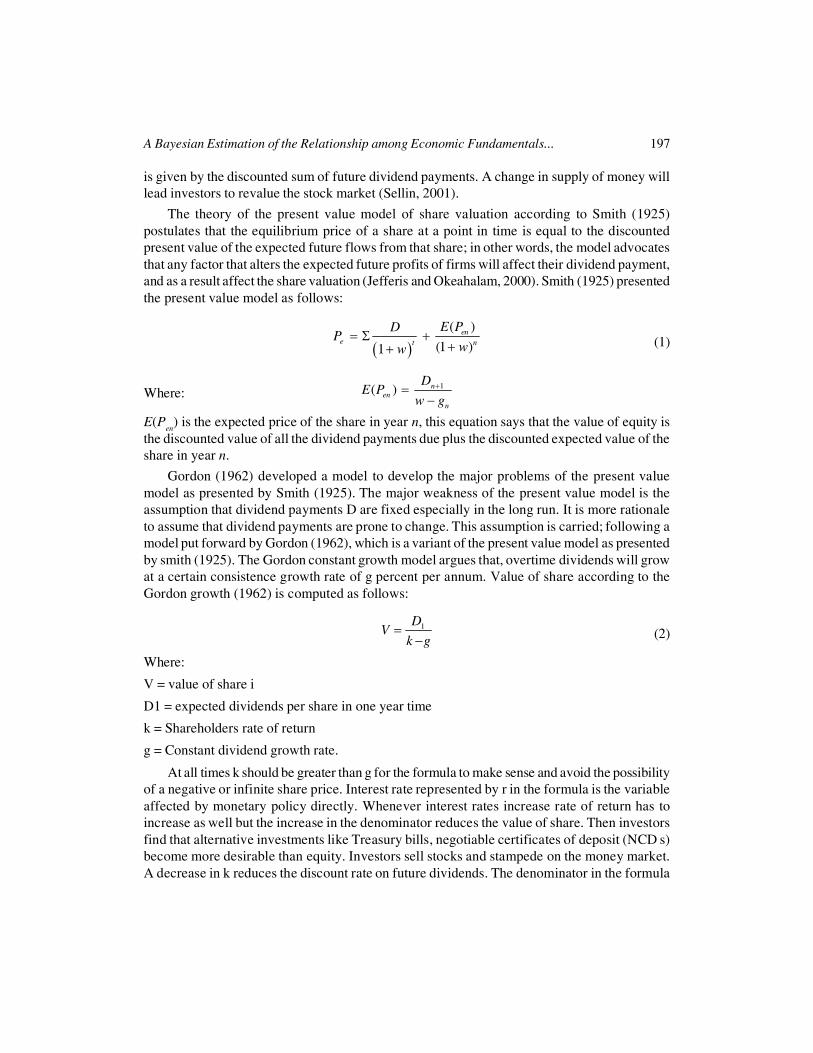
The theory of the present value model of share valuation according to Smith (1925)postulates that the equilibrium price of a share at a point in time is equal to the discountedpresent value of the expected future flows from that share; in other words, the model advocatesthat any factor that alters the expected future profits of firms will affect their dividend payment,and as a result affect the share valuation (Jefferis and Okeahalam, 2000). Smith (1925) presentedthe present value model as follows:
� �� � �
��
( )
(1 )1en
e t n
E PDP
ww (1)
Where:���
1( ) nen
n
DE P
w g
E(Pen
) is the expected price of the share in year n, this equation says that the value of equity isthe discounted value of all the dividend payments due plus the discounted expected value of theshare in year n.
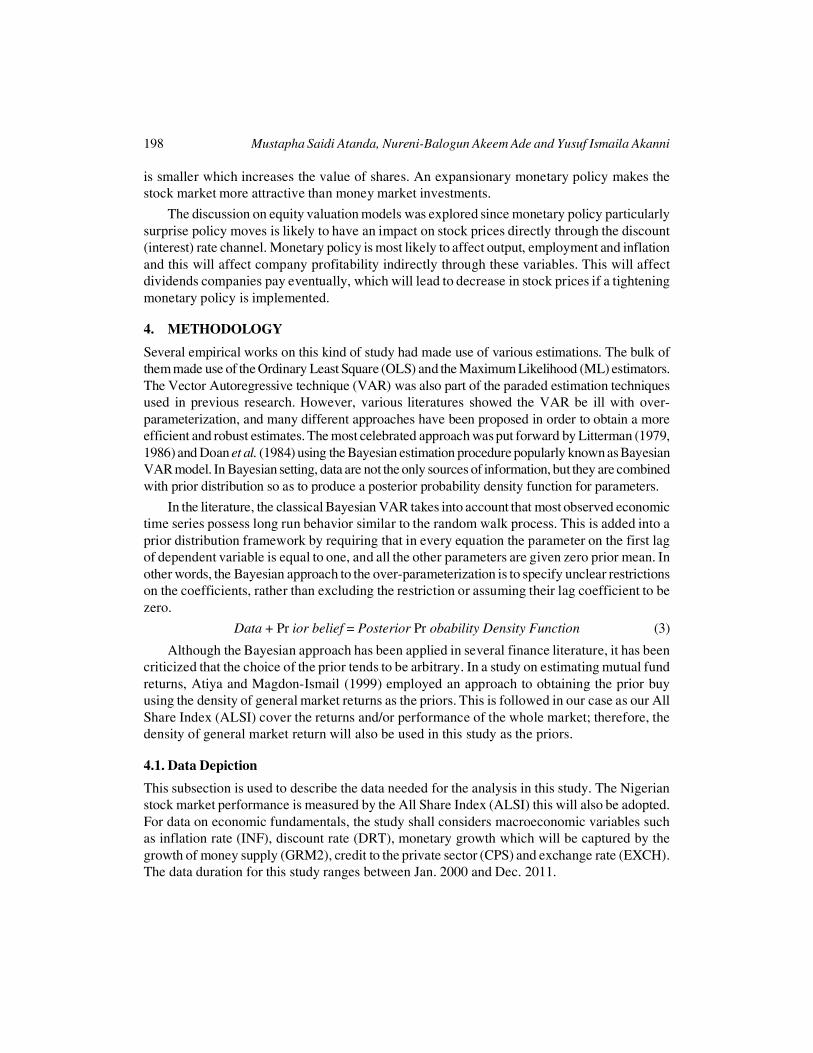
Gordon (1962) developed a model to develop the major problems of the present valuemodel as presented by Smith (1925). The major weakness of the present value model is theassumption that dividend payments D are fixed especially in the long run. It is more rationaleto assume that dividend payments are prone to change. This assumption is carried; following amodel put forward by Gordon (1962), which is a variant of the present value model as presentedby smith (1925). The Gordon constant growth model argues that, overtime dividends will growat a certain consistence growth rate of g percent per annum. Value of share according to theGordon growth (1962) is computed as follows:
��
1DV
k g (2)
Where:
V = value of share i
D1 = expected dividends per share in one year time
k = Shareholders rate of return
g = Constant dividend growth rate.
At all times k should be greater than g for the formula to make sense and avoid the possibilityof a negative or infinite share price. Interest rate represented by r in the formula is the variableaffected by monetary policy directly. Whenever interest rates increase rate of return has toincrease as well but the increase in the denominator reduces the value of share. Then investorsfind that alternative investments like Treasury bills, negotiable certificates of deposit (NCD s)become more desirable than equity. Investors sell stocks and stampede on the money market.A decrease in k reduces the discount rate on future dividends. The denominator in the formula
198 Mustapha Saidi Atanda, Nureni-Balogun Akeem Ade and Yusuf Ismaila Akanni
is smaller which increases the value of shares. An expansionary monetary policy makes thestock market more attractive than money market investments.
The discussion on equity valuation models was explored since monetary policy particularlysurprise policy moves is likely to have an impact on stock prices directly through the discount(interest) rate channel. Monetary policy is most likely to affect output, employment and inflationand this will affect company profitability indirectly through these variables. This will affectdividends companies pay eventually, which will lead to decrease in stock prices if a tighteningmonetary policy is implemented.
4. METHODOLOGY
Several empirical works on this kind of study had made use of various estimations. The bulk ofthem made use of the Ordinary Least Square (OLS) and the Maximum Likelihood (ML) estimators.The Vector Autoregressive technique (VAR) was also part of the paraded estimation techniquesused in previous research. However, various literatures showed the VAR be ill with over-parameterization, and many different approaches have been proposed in order to obtain a moreefficient and robust estimates. The most celebrated approach was put forward by Litterman (1979,1986) and Doan et al. (1984) using the Bayesian estimation procedure popularly known as BayesianVAR model. In Bayesian setting, data are not the only sources of information, but they are combinedwith prior distribution so as to produce a posterior probability density function for parameters.
In the literature, the classical Bayesian VAR takes into account that most observed economictime series possess long run behavior similar to the random walk process. This is added into aprior distribution framework by requiring that in every equation the parameter on the first lagof dependent variable is equal to one, and all the other parameters are given zero prior mean. Inother words, the Bayesian approach to the over-parameterization is to specify unclear restrictionson the coefficients, rather than excluding the restriction or assuming their lag coefficient to bezero.
Data + Pr ior belief = Posterior Pr obability Density Function (3)
Although the Bayesian approach has been applied in several finance literature, it has beencriticized that the choice of the prior tends to be arbitrary. In a study on estimating mutual fundreturns, Atiya and Magdon-Ismail (1999) employed an approach to obtaining the prior buyusing the density of general market returns as the priors. This is followed in our case as our AllShare Index (ALSI) cover the returns and/or performance of the whole market; therefore, thedensity of general market return will also be used in this study as the priors.
4.1. Data Depiction
This subsection is used to describe the data needed for the analysis in this study. The Nigerianstock market performance is measured by the All Share Index (ALSI) this will also be adopted.For data on economic fundamentals, the study shall considers macroeconomic variables suchas inflation rate (INF), discount rate (DRT), monetary growth which will be captured by thegrowth of money supply (GRM2), credit to the private sector (CPS) and exchange rate (EXCH).The data duration for this study ranges between Jan. 2000 and Dec. 2011.

A Bayesian Estimation of the Relationship among Economic Fundamentals... 199
All Share Index
The All Share Index is a broad index as it allows seeing the market spectrum at a glance. Themarket index represents the most liquid stocks on the floor of the exchange. The index includescompanies stocks that have been actively traded and the source of the data is from the NigerianStock Exchange Market (NSEM). Monthly returns are calculated as continuously compoundedreturns at time t, A
t
In other words, as the natural log difference in the closing market index ALSIt between two
months as shown below:
� � � ���
� � � 11
tt t t
t
ALSIA In In ALSI In ALSI
ALSI (4)
Inflation Rate
Inflation rate has been always announced on monthly series within a month lag. The majorsource of inflation data in Nigeria is National Bureau of Statistics (NBS). In this study themonth on change data series shall be considered.
Broad Money Supply (M2)
The broad money supply data is obtained from the Central Bank of Nigeria (CBN) and themonthly growth rate of M2 has been calculated using the logarithmic form below:
g(M 2)t = log (M 2)t – log(M 2)
t–1(5)
Monetary Policy Rate
The rate is decided by the monetary policy committee of the Central Bank of Nigeria and isannounced on monthly basis.
Credit to the Private Sector
This includes both private business and household borrowings. The monthly growth in credit tothe private sector gcps is calculated as follows:
(gcps)t = log(cps)
t – log(cps)
t–1(6)
Exchange Rate
Similar studies on the subject matter had made use of exchange rate as one of the explanatoryvariables. Based on the significant changes in the exchange rate of Nigeria with the estimationperiod; this study shall also consider exchange rate as one of its regressors to measure the influenceof international activities as the exchange rate determines international price of transaction.
4.2. Empirical Investigation
The standard procedure when using time series is to do stationarity tests. Due to the nature andfeatures of time series data, it is require that series are of zero mean and constant variance that
200 Mustapha Saidi Atanda, Nureni-Balogun Akeem Ade and Yusuf Ismaila Akanni
is, integrated of order zero, I(0). Gujarati (2005) describes a stationary stochastic process ascontaining constant mean and variance overtime and a non-serially correlated covariance. Thisstudy uses two popular tests. The first is unit root test Augmented Dickey Fuller (ADF) test andthe second is a stationarity test Dickey Fuller Generalized Least Square (DF-GLS) test. Sincethe former is extensively discussed in the literature (See Enders, 2004 and Brooks, 2008) itshall not be discussed but the DF-GLS is considered because of the presence of trend in any ofthe data. DF-GLS de-trending nature takes care of this. As it is done in related studies whichwork with financial data, common tests for financial time series will be conducted.
Cointegration has been commonly investigated prior to the estimation of VAR models byquite number of studies. However, Fuller (1976) and Sims (1980) argued that the goal of theVAR model is to determine the interrelationships among the variables and not to determine theimpact assessments. Hence, the empirical investigation is conducted using a version of theVAR model i.e. the Bayesian VAR (BVAR) model. The classical Bayesian VAR methodologyshows that the prior is specified taking into consideration that most observed economic timeseries have long run behavior similar to the random walk process; this is accommodated by theprior distribution framework. The prior distribution requires that in every equation the parameteron the first lag of dependent variable is equal to one, and all the other parameters are givenzero prior mean. In other words, the Bayesian approach to the over-parameterization is tospecify (unclear) restrictions on the coefficients, rather than assigning lag coefficient to zero.This is done by putting long lags normal prior distribution with zero mean and small standarddeviation. The standard deviation of prior distribution is presented as follows:
� ���
( ) ( , )( , , ) i
j
h k g i j sS i j k
s (7)
Where si is the standard error of univariate autoregression on equation i. The variables in the
right hand side between brackets are product of various options of control and represent thetightness or weight of the prior on coefficient i, j and k. The first option is the overall tightnesswhich represents the standard deviation on the first own lag. Second option is the tightness onthe lag relative to lag 1. Finally, the tightness on variable j in equation i relative to variable i isspecified as 1. If i = j or otherwise the bracket is multiplied by the ratio of the standard error ofi and j to correct for different scales of the variables.
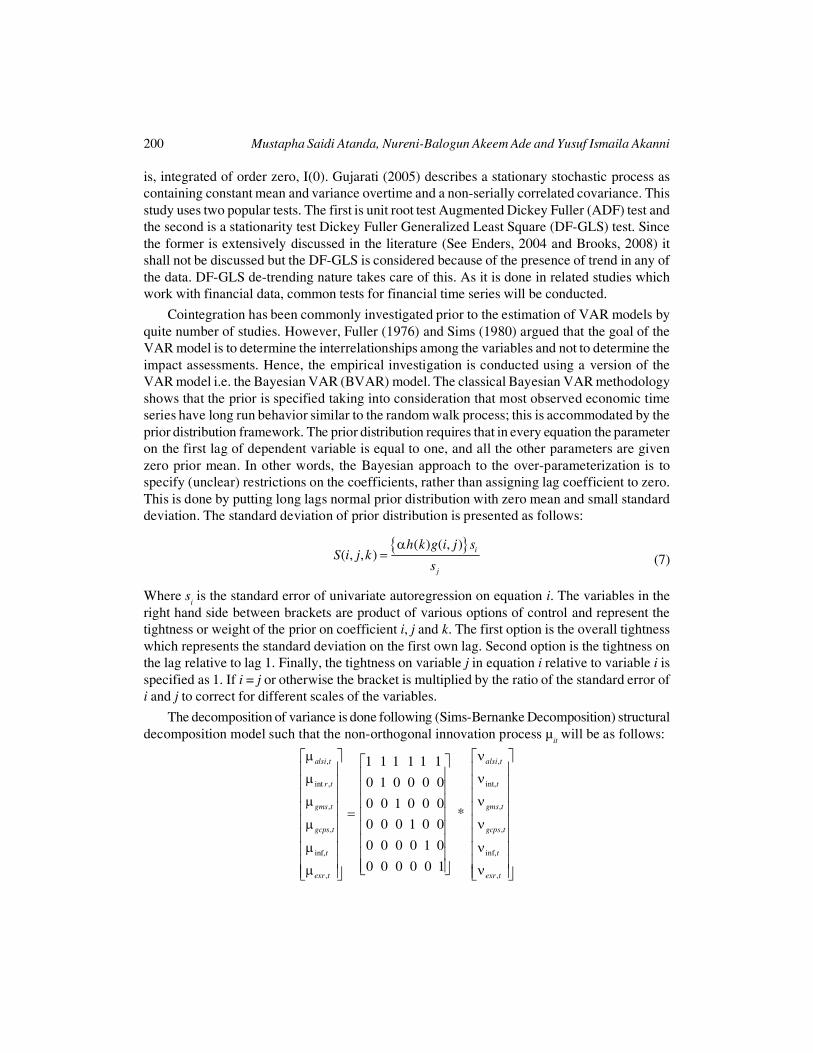
The decomposition of variance is done following (Sims-Bernanke Decomposition) structuraldecomposition model such that the non-orthogonal innovation process µ
it will be as follows:
� �� � � �� �� � � �� �� �� � � �� �� � � �� �� �� � � �� � �� � � �� �� �� � � �� �� �� � � �� �� � � �� �� �� �� � � �� � � �
, ,
int , int,
, ,
, ,
inf, inf,
, ,
1 1 1 1 1 1
0 1 0 0 0 0
0 0 1 0 0 0*
0 0 0 1 0 0
0 0 0 0 1 0
0 0 0 0 0 1
alsi t alsi t
r t t
gms t gms t
gcps t gcps t
t t
exr t exr t

A Bayesian Estimation of the Relationship among Economic Fundamentals... 201
Where the left hand side is the matrix of the residuals and the right hand side is theinnovations of the corresponding variables. The ordering matrix is assigned to showthe contemporaneous response of the index variable (ALSI) to shocks in monetary policyvariables. Similarly the Granger causality tests to detect the causation of the shock among thevariables.
5. RESULTS AND DISCUSSION
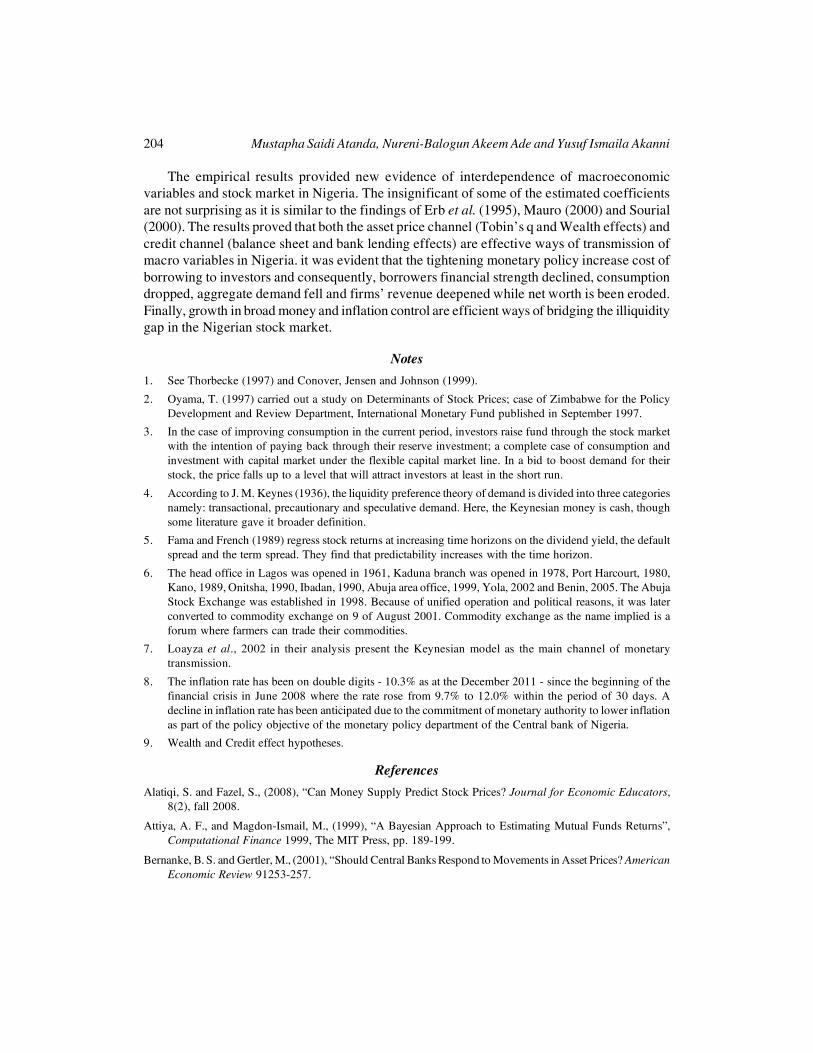
A cursory reflection of Appendix 1 shows that most of the series have features of non normality;this is common in financial time series data. The Jarque-Bera statistics tests the normality of theseries and the null hypothesis is that series are normally distributed. Hence, the null hypothesiscan be rejected for variables like GALSI, GCPS, GMS, MPR. Except for inflation and exchangerate that evidence reveals that they are normally distributed. Table 1 presents the stationary testresults and there is evidence of stationarity at levels for variables like GALSI, GCPS, GMS andINFL, I (0). However, EXR and MPR attained their stationary point at first difference, I (1)respectively.
Table 1Test for Stationarity of Series
Variables ADF Test DF-GLS Test(t-values) (t-values) I(d)
Growth of ALSI (GALSI) -9.921 -9.517 I(0)
Money Growth (GMS) -14.381 -7.977 I(0)
Growth of CPS (GCPS) -17.014 -15.222 I(0)
Monetary Policy Rate (MPR) -11.761 -11.778 I(0)
Inflation Rate (INFL) -3.354 -4.119 I(0)
Exchange Rate (EXR) -8.497 -8.515 I(0)
Critical Values for each Test
1% -3.476 -2.581
5% -2.881 -1.943
Definitions:
ADF = Augmented Dickey Fuller Test
DF-GLS Test = Dickey Fuller Generalized Least Square Test
I (d) = Order of Integration
Source: Author’s Computation
The results of the stationary test reveal that variables exhibit different levels of stationarypoints. This necessitates the performance of the cointegration test, which will be done throughthe Joahansen and Jesulis (1991) multivariate procedure. The cointegration results in table 2report an existence of long term relationship among the variables as we given by significanceof two cointegrating vectors using the MHM p-values.

202 Mustapha Saidi Atanda, Nureni-Balogun Akeem Ade and Yusuf Ismaila Akanni
Table 2Multivariate Co-integration Test
Johansen Co-integration Test
Hypotheses Eigen Values Trace Stats C.V. (0.05) Prob.**
None* 0.278 141.7 95.753 0.000*At most 1* 0.251 96.412 69.818 0.000*At most 2* 0.195 56.172 47.856 0.006**denotes rejection of the hypothesis at 0.05 level**Mackinnon-Haug-Michelis (1999) P-Values
Source: Author’s Computation
As discussed from the cointegration test that a long term relationship exist among variablesthe paper can employ a vector error correction (VEC) modeling to estimate its joint causalityresults but before that, the lag selection criteria for the VEC model is presented in table 3 withthe optimum lag and serial autocorrelation result, note that the probability value of theautocorrelation LM test is reported for simplicity. The optimal lag length chosen has to besmallest lag length among the ones that eliminate serial autocorrelation, thus, the researchercan use discretion as well. An optimum lag length of 2 lags is chosen in the study.
Table 3Lag Length Criteria and Autocorrelation Test
VEC Lag Length and Autocorrelation Test
Information Criteria VEC Lag Autocorrelation Test
Modified LR Test Statistics 2 0.05Final Prediction Error (FPE) 1 0.01Akaike Information Criterion (AIC) 1 0.02Schwarz Criterion (SC) 1 0.01Hannan-Quinn Information Criterion (HQ) 1 0.28Optimum Lag 2 0.00
Source: Author’s Computation
5.1. Causation, Shocks and Innovations
The causality results in table 4 and the Bayesian VAR estimate show that the growth of themarket index vis-à-vis the index returns respond positively to inflation rate shock as reportedby the empirical result. A 0.12% positive shock response exist between inflation and marketgrowth and the causality test also gave a unidirectional causation running from inflation to thestock market. The positive relation between inflation rate and asset returns in domestic currencyis in line with Tobin’s q and Fisher effect hypotheses that suggest that nominal asset returnsshould move in the same direction with inflation (Mishkin, 1995). Intuitively, for the positiveresponse between Nigeria’s stock market and inflation rate; money illusion does exists as inflationis on the rise8 and considerably low real interest rates which debar investment (Modigliani andCohen, 1979; Mishkin, 1995). This is observed in the movement of the capitalization and analystcomments of profit takings as been sole responsible for the downward trend (see figure 1).
A Bayesian Estimation of the Relationship among Economic Fundamentals... 203
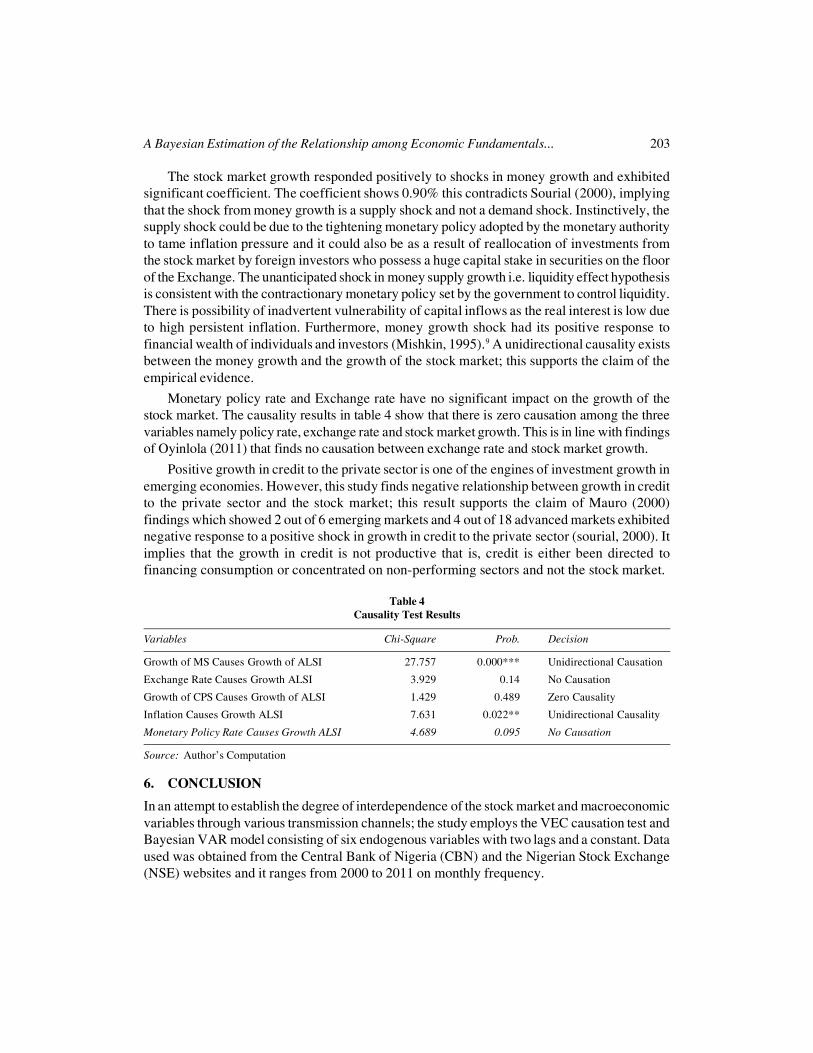
The stock market growth responded positively to shocks in money growth and exhibitedsignificant coefficient. The coefficient shows 0.90% this contradicts Sourial (2000), implyingthat the shock from money growth is a supply shock and not a demand shock. Instinctively, thesupply shock could be due to the tightening monetary policy adopted by the monetary authorityto tame inflation pressure and it could also be as a result of reallocation of investments fromthe stock market by foreign investors who possess a huge capital stake in securities on the floorof the Exchange. The unanticipated shock in money supply growth i.e. liquidity effect hypothesisis consistent with the contractionary monetary policy set by the government to control liquidity.There is possibility of inadvertent vulnerability of capital inflows as the real interest is low dueto high persistent inflation. Furthermore, money growth shock had its positive response tofinancial wealth of individuals and investors (Mishkin, 1995).9 A unidirectional causality existsbetween the money growth and the growth of the stock market; this supports the claim of theempirical evidence.
Monetary policy rate and Exchange rate have no significant impact on the growth of thestock market. The causality results in table 4 show that there is zero causation among the threevariables namely policy rate, exchange rate and stock market growth. This is in line with findingsof Oyinlola (2011) that finds no causation between exchange rate and stock market growth.
Positive growth in credit to the private sector is one of the engines of investment growth inemerging economies. However, this study finds negative relationship between growth in creditto the private sector and the stock market; this result supports the claim of Mauro (2000)findings which showed 2 out of 6 emerging markets and 4 out of 18 advanced markets exhibitednegative response to a positive shock in growth in credit to the private sector (sourial, 2000). Itimplies that the growth in credit is not productive that is, credit is either been directed tofinancing consumption or concentrated on non-performing sectors and not the stock market.
Table 4Causality Test Results
Variables Chi-Square Prob. Decision
Growth of MS Causes Growth of ALSI 27.757 0.000*** Unidirectional Causation
Exchange Rate Causes Growth ALSI 3.929 0.14 No Causation
Growth of CPS Causes Growth of ALSI 1.429 0.489 Zero Causality
Inflation Causes Growth ALSI 7.631 0.022** Unidirectional Causality
Monetary Policy Rate Causes Growth ALSI 4.689 0.095 No Causation
Source: Author’s Computation
6. CONCLUSION
In an attempt to establish the degree of interdependence of the stock market and macroeconomicvariables through various transmission channels; the study employs the VEC causation test andBayesian VAR model consisting of six endogenous variables with two lags and a constant. Dataused was obtained from the Central Bank of Nigeria (CBN) and the Nigerian Stock Exchange(NSE) websites and it ranges from 2000 to 2011 on monthly frequency.
204 Mustapha Saidi Atanda, Nureni-Balogun Akeem Ade and Yusuf Ismaila Akanni
The empirical results provided new evidence of interdependence of macroeconomicvariables and stock market in Nigeria. The insignificant of some of the estimated coefficientsare not surprising as it is similar to the findings of Erb et al. (1995), Mauro (2000) and Sourial(2000). The results proved that both the asset price channel (Tobin’s q and Wealth effects) andcredit channel (balance sheet and bank lending effects) are effective ways of transmission ofmacro variables in Nigeria. it was evident that the tightening monetary policy increase cost ofborrowing to investors and consequently, borrowers financial strength declined, consumptiondropped, aggregate demand fell and firms’ revenue deepened while net worth is been eroded.Finally, growth in broad money and inflation control are efficient ways of bridging the illiquiditygap in the Nigerian stock market.
Notes
1. See Thorbecke (1997) and Conover, Jensen and Johnson (1999).
2. Oyama, T. (1997) carried out a study on Determinants of Stock Prices; case of Zimbabwe for the PolicyDevelopment and Review Department, International Monetary Fund published in September 1997.
3. In the case of improving consumption in the current period, investors raise fund through the stock marketwith the intention of paying back through their reserve investment; a complete case of consumption andinvestment with capital market under the flexible capital market line. In a bid to boost demand for theirstock, the price falls up to a level that will attract investors at least in the short run.
4. According to J. M. Keynes (1936), the liquidity preference theory of demand is divided into three categoriesnamely: transactional, precautionary and speculative demand. Here, the Keynesian money is cash, thoughsome literature gave it broader definition.
5. Fama and French (1989) regress stock returns at increasing time horizons on the dividend yield, the defaultspread and the term spread. They find that predictability increases with the time horizon.
6. The head office in Lagos was opened in 1961, Kaduna branch was opened in 1978, Port Harcourt, 1980,Kano, 1989, Onitsha, 1990, Ibadan, 1990, Abuja area office, 1999, Yola, 2002 and Benin, 2005. The AbujaStock Exchange was established in 1998. Because of unified operation and political reasons, it was laterconverted to commodity exchange on 9 of August 2001. Commodity exchange as the name implied is aforum where farmers can trade their commodities.
7. Loayza et al., 2002 in their analysis present the Keynesian model as the main channel of monetarytransmission.
8. The inflation rate has been on double digits - 10.3% as at the December 2011 - since the beginning of thefinancial crisis in June 2008 where the rate rose from 9.7% to 12.0% within the period of 30 days. Adecline in inflation rate has been anticipated due to the commitment of monetary authority to lower inflationas part of the policy objective of the monetary policy department of the Central bank of Nigeria.
9. Wealth and Credit effect hypotheses.
References
Alatiqi, S. and Fazel, S., (2008), “Can Money Supply Predict Stock Prices? Journal for Economic Educators,8(2), fall 2008.
Attiya, A. F., and Magdon-Ismail, M., (1999), “A Bayesian Approach to Estimating Mutual Funds Returns”,Computational Finance 1999, The MIT Press, pp. 189-199.
Bernanke, B. S. and Gertler, M., (2001), “Should Central Banks Respond to Movements in Asset Prices? AmericanEconomic Review 91253-257.

A Bayesian Estimation of the Relationship among Economic Fundamentals... 205
Bernanke, B., and Gertler, M., (1995), “Inside the Black Box: The Credit Channel of Monetary PolicyTransmission”, National Bureau of Economic Research, WP5146.
Brooks, C., (2008), Introductory Econometrics for Finance, Cambridge, New York. Cambridge University Press.
Cassola, N. and Morana, C., (2004), “Monetary Policy and Stock Market in the Euro Area. Journal of PolicyModeling 26, 387-399.
Engle, R. F., Ghysels, E. and Sohn, B., (2006), “On the Economic Sources of Stock Market Volatility. Seminar-Papers / 447 pdf.
Faure, P., (2003), “Getting to Grips with the Equity Market. Cape Town: Quoin Institute (pty) Limited.
Gordon, M. J., (1962), The Investment, Financing and Valuation of the Corporation. Homewood ILL, Irwincopyright.
Hamburger, M. J. and Kochin, L. A., (1972), “Money and Stock Prices: The Channels of Influence, Journal ofFinance 27.231-249.
Hashemzadeh, N. and Taylor, P., (1988), “Stock Prices, Money Supply, and Interest Rate: The Question ofCausality. Applied Economics, 20, 1603-1611.
Husain, F. and Mahmood, T., (1999), “Monetary Expansion and Stock Returns in Pakistan. Pakistan Institute ofDevelopment. Munich Personal RePEC Archive.
Jefferis, K. R., and Okeahalam, C. C., (2000), “The Impact of Economic Fundamentals on Stock Markets inSouthern Africa. Development Southern Africa 17, 1: 24-51.
Litterman, R. B., (1986), “Forecasting with Bayesian Vector Autoregressive –Five Years of Experience”, Journalof Business and Economic Statistics, Vol. 4, pp. 25-38.
Sourial, M. S., (2002), “The Future of the Stock Market Channel in Egypt. [online] Available: http://papers.ssrn.com/so13/cf_dev/AbsByAuth.cfm?per_id=327406
Thorbecke, T., (1997), “On Stock Market Returns and Monetary Policy, Journal of Finance 52, 635-54.
206 Mustapha Saidi Atanda, Nureni-Balogun Akeem Ade and Yusuf Ismaila Akanni
Appendix 1: Descriptive Statistics
Descriptive StatisticsVariables GALSI GMS GCPS MPR INFL EXR
Mean 0.893 2.173 2.446 12.722 12.393 129.493
Median 0.18 1.475 2.18 13 12.35 128
Std. Dev. 7.52 5.898 8.241 4.365 5.612 14.877
Skewness -0.514 0.863 0.399 0.002 0.097 -0.049
Kurtosis 8.667 17.718 43.356 1.926 3.361 2.213
Normality Test
Jarque-Bera 199.053 1317.729 9775.876 6.914 1.013 3.772
Probability 0.000*** 0.000*** 0.000*** 0.031** 0.602 0.151
Note: ***/**/* indicate 1% / 5%/ 10% levels of significanceSource: Author’s Computation
Appendix 2: Stability of the VEC Model
Source: Author’s Computation

A Bayesian Estimation of the Relationship among Economic Fundamentals... 207
Appendix 3: Graphs of Residuals
Source: Author’s Computation
208 Mustapha Saidi Atanda, Nureni-Balogun Akeem Ade and Yusuf Ismaila Akanni
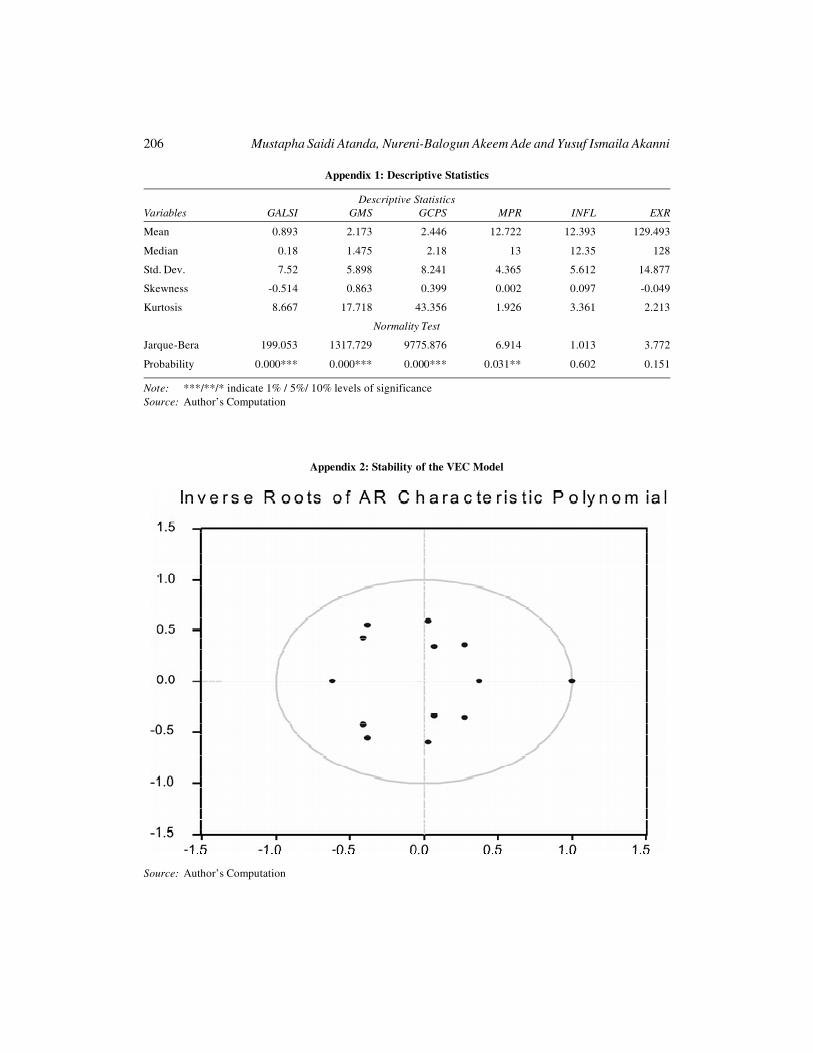
Appendix 4: Trend of Selected Macroeconomic Variables
Source: Author’s Computation


�����������������������������������������������������������������������������������������������������������������������������������������������������������������������������������������������������������������