
A Baseline Environmental Impact Assessment (EIA) of ...
17
American Journal of Bioscience and Bioengineering 2016; 4(2): 9-25 http://www.sciencepublishinggroup.com/j/bio doi: 10.11648/j.bio.20160402.11 ISSN: 2328-5885 (Print); ISSN: 2328-5893 (Online) A Baseline Environmental Impact Assessment (EIA) of Proposed Sit for Thermal Desorption Unit (TDU) Waste Management Project in Rivers State, Nigeria: Floristic Composition Approach Nsirim L. Edwin-Wosu 1 , Victor N. Sunday 2 1 Department of Plant Science and Biotechnology, Faculty of Biological Science, College of Natural and Applied Sciences, University of Port Harcourt, Choba, Port Harcourt, Rivers State, Nigeria 2 Department of Geography and Environmental Management, Faculty of Social Sciences, University of Port Harcourt, Choba, Port Harcourt, Rivers State, Nigeria Email address: [email protected] (N. L. Edwin-Wosu), [email protected] (V. N. Sunday) To cite this article: Nsirim L. Edwin-Wosu, Victor N. Sunday. A Baseline Environmental Impact Assessment (EIA) of Proposed Sit for Thermal Desorption Unit (TDU) Waste Management Project in Rivers State, Nigeria: Floristic Composition Approach. American Journal of Bioscience and Bioengineering. Vol. 4, No. 2, 2016, pp. 9-25. doi: 10.11648/j.bio.20160402.11 Received: July 11, 2015; Accepted: August 31, 2015; Published: April 21, 2016 Abstract: This report describes the results of a wet and dry season ecological baseline impact assessment study based on the context of a proposed Thermal Desorption Unit (TDU) development project in Eteo Eleme, Rivers State. Thermal Desorption Unit project of the magnitude of a waste management project must always have some negative effects on the quality and quantity of the environment. Following an environment impact assessment (EIA) a series of mitigation measures must be put in place to minimize the intensity of the negative effect of the project on the environment. The paper seeks to assess through baseline data the envisaged impact of the project on the existing conditions of the biophysical environment, to appraise the possible risk to the environment and mitigation measures adopted. It uses a combination of standard procedures of integrated data sources to qualitatively and quantitatively assess the floristic profile of the project study area. The result highlights most of the biophysical impact variables that will have negative effect on the environment. However, the study site still maintains the status of abundance, richness and evenness with obvious similarity in floristic composition and forest structure to that in tropical forest elsewhere in the world. It is obvious that the Eteo vegetation system is gradually under ecological succession resulting to secondary vegetation system without proper articulation of its wealth of flora diversity, but with high flora diversity in rainy season than dry season. The useful application of phyto-sociological indices in determining the status of its vegetation complex in terms of species abundance, density, important value index, diversity and distribution pattern is being recorded in the Table for both wet and dry seasons. The paper emphasis the need for sound environmental commitments to the project and to appraise their implementation. A proper balance between the expected benefits from the project and cost implication can only be obtained through impact studies and careful monitoring. Keywords: Species Diversity, Abundance, Importance Value Index, Density 1. Introduction Baseline studies usually entail a collection of background information and data on the physical environment and socio-economic setting of a proposed site for development. As an inevitable factor in environmental management, it is done prior to impact assessment of the given area. It is an environmental evaluation bench mark which aid in the assessment of impacts and / or effect of existing facilities and / or on – going operation or proposed project on the environment. It is a hazard and effect management process that provides assurance for sustainable environmental practices at any project location. It seek to strike a balance between obtaining sufficient information to describe existing
Transcript of A Baseline Environmental Impact Assessment (EIA) of ...

American Journal of Bioscience and Bioengineering 2016; 4(2): 9-25
http://www.sciencepublishinggroup.com/j/bio
doi: 10.11648/j.bio.20160402.11
ISSN: 2328-5885 (Print); ISSN: 2328-5893 (Online)
A Baseline Environmental Impact Assessment (EIA) of Proposed Sit for Thermal Desorption Unit (TDU) Waste Management Project in Rivers State, Nigeria: Floristic Composition Approach
Nsirim L. Edwin-Wosu1, Victor N. Sunday
2
1Department of Plant Science and Biotechnology, Faculty of Biological Science, College of Natural and Applied Sciences, University of Port
Harcourt, Choba, Port Harcourt, Rivers State, Nigeria 2Department of Geography and Environmental Management, Faculty of Social Sciences, University of Port Harcourt, Choba, Port Harcourt,
Rivers State, Nigeria
Email address: [email protected] (N. L. Edwin-Wosu), [email protected] (V. N. Sunday)
To cite this article: Nsirim L. Edwin-Wosu, Victor N. Sunday. A Baseline Environmental Impact Assessment (EIA) of Proposed Sit for Thermal Desorption Unit
(TDU) Waste Management Project in Rivers State, Nigeria: Floristic Composition Approach. American Journal of Bioscience and
Bioengineering. Vol. 4, No. 2, 2016, pp. 9-25. doi: 10.11648/j.bio.20160402.11
Received: July 11, 2015; Accepted: August 31, 2015; Published: April 21, 2016
Abstract: This report describes the results of a wet and dry season ecological baseline impact assessment study based on the
context of a proposed Thermal Desorption Unit (TDU) development project in Eteo Eleme, Rivers State. Thermal Desorption
Unit project of the magnitude of a waste management project must always have some negative effects on the quality and quantity
of the environment. Following an environment impact assessment (EIA) a series of mitigation measures must be put in place to
minimize the intensity of the negative effect of the project on the environment. The paper seeks to assess through baseline data
the envisaged impact of the project on the existing conditions of the biophysical environment, to appraise the possible risk to the
environment and mitigation measures adopted. It uses a combination of standard procedures of integrated data sources to
qualitatively and quantitatively assess the floristic profile of the project study area. The result highlights most of the biophysical
impact variables that will have negative effect on the environment. However, the study site still maintains the status of
abundance, richness and evenness with obvious similarity in floristic composition and forest structure to that in tropical forest
elsewhere in the world. It is obvious that the Eteo vegetation system is gradually under ecological succession resulting to
secondary vegetation system without proper articulation of its wealth of flora diversity, but with high flora diversity in rainy
season than dry season. The useful application of phyto-sociological indices in determining the status of its vegetation complex
in terms of species abundance, density, important value index, diversity and distribution pattern is being recorded in the Table for
both wet and dry seasons. The paper emphasis the need for sound environmental commitments to the project and to appraise their
implementation. A proper balance between the expected benefits from the project and cost implication can only be obtained
through impact studies and careful monitoring.
Keywords: Species Diversity, Abundance, Importance Value Index, Density
1. Introduction
Baseline studies usually entail a collection of background
information and data on the physical environment and
socio-economic setting of a proposed site for development. As
an inevitable factor in environmental management, it is done
prior to impact assessment of the given area. It is an
environmental evaluation bench mark which aid in the
assessment of impacts and / or effect of existing facilities and /
or on – going operation or proposed project on the
environment. It is a hazard and effect management process
that provides assurance for sustainable environmental
practices at any project location. It seek to strike a balance
between obtaining sufficient information to describe existing

10 Nsirim L. Edwin-Wosu and Victor N. Sunday: A Baseline Environmental Impact Assessment (EIA) of Proposed Sit for Thermal
Desorption Unit (TDU) Waste Management Project in Rivers State, Nigeria: Floristic Composition Approach
features, their inter-relationship and overall environmental
status or quality, while obtainingdetailed data on the current
status and trends of the vegetation to enable specific impacts
be predicte [1].
A Vegetation baseline study is an aspect of Environmental
Impact Assessment (EIA) for the proposed TDU project. This
aim at determining the current state of the environment and
assesses the likely impact of the project on the environment.
Socio-ecological changes are always enshrined in every
developmental activity [2]. A good monitoring and evaluation
system will indicate any probable changes and results of
activities, including eventual impacts and the extent of the
desired results achieved and their sustainability [3, 4, 5].
Thermal desorption is a term applied to many different
types of soil remediation technologies. It is an ex-situ means to
physically separate volatile and some semi volatile
contaminants from soil, sediments, sludges, and filter cakes. It
is a thermally induced physicalseparation process. All of these
technologies consist fundamentally of a two-step process,
involving the application of heat to a contaminated material,
such as soil, sediment, sludge, or filter cake, to vaporize the
contaminants into a gas stream, which subsequently is treated
to meet regulatory requirements prior to discharge [6,
7].Varieties of gas treatment technologies are used to collect,
condense, or destroy these volatilized gases. Contaminants are
vaporized from a solid matrix and are transferred into a gas
stream where they can be more easily managed by treatment
prior to discharge. Options used to manage or treat the
contaminant-laden gas stream may consist of condensation,
collection, or combustion. For the first two options, the
condensed or collected contaminants usually are treated off
site at some time subsequent to heat application, while in the
third option, combustion, treatment occurs on site,
immediately after the gases exit heating process [8, 9].
Thermal desorption is applicable to organic wastes and
generally is not used for treating metals and other inorganics.
Depending on the specific thermal desorption vendor selected,
the technology heats contaminated media between 200 -
1,000ºF, driving off water and volatile contaminants.
Off-gases may be burned in an after burner, condensed to
reduce the volume to be disposed, or captured by carbon
adsorption beds. In addition to volatilizing organic
contaminants contained in the waste feed, moisture is
volatilized and leaves with the off-gas.As a result, the thermal
desorption system also functions as a dryer. In fact, many
vendors refer to the primary treatment chamber of their system
as a “rotary dryer,” highlighting its effect on the material,
despite it principal purpose of evaporating and separating out
the contaminants [8, 10].
The proposed TDU EIA project is one among the work
stream in Environmental Management Improvement Program
Initiative (EMIP) of Oil and Gas organisations. This is of
fundamental importance for environmental management plan
(EMP). The EMIP road map towards operational performance
improvement requires proper EIA to be executed as a
preventive measure to reduce and provide full real time
transparency in the handling and management of organic and
other hydrocarbon generated waste such as drill cuttings and
other toxic substances.
Consequently, this has created the need for the assessment
and evaluation of the flora biodiversity of the study area as to
contribute to the delivery of the EMIP mandates and
objectives. On a parallel maxim baseline study ensures that the
proposed activities of the TDU project are executed in
accordance with statutory requirements. The tropical
rainforest constitute the most biological diverse terrestrial
ecosystem on earth [11]. It is the predominant natural forest in
Nigeria occupying about 10% of land mass which have been
extensively degraded and exist in patches. Across the world,
25 hot-spots have been identified on the basis of species
endemism and degree of threat through habitat loss [12].
Forest vegetation represents an important natural resource
with diverse scientific, technological, cultural and ecological
values at the local, state, national and international levels of
societal needs. Quite a number of endemic plant species,
which might be of immense economic importance to man and
new to science might abound in the study area hence the need
for baseline studies prior to the execution of the project.
Despite these immense economic and ecological values of
forest to man, series of ecological demand by the society are
causing significant and irreversible loss to this unique
resource [13]. Therefore, in order to assess the levels of future
impacts envisaged to emanate due to the TDU project on the
ecological biota of the environment, a comprehensive baseline
enumeration of flora composition of the area was designed
and carried out in wet and dry season. The preparation of the
EIA will also support subsequent application and acquisition
for Environmental Management Plan (EMP) and Associated
Environmental permits for the project.
The proposed baseline study was conducted under the
context and premise of reviewing existing literature of the
study area including study reports if any, determination and
description of the vegetation type, structure and floristic
composition of the study zones, determination of key species
population and their distribution in terms of phytosociological
index of abundance, and develop cost effective mitigation /
ameliorative measures, monitoring plans and Environmental
Management Plan that meet regulatory requirements. Thus,
with the aim of providing and establishing through biological
studies appropriate ecologicaldata on the existing status of all
identifiable and associated components of vegetation biota of
the people and their environ, assessment of the potential
positive and negative impact of the proposed project on the
environment, proposing appropriate mitigation measures to
minimize negative environmental impacts arising from the
project and enhance positive impact on the environment, to
incorporate the recommendations and fall-out of the EIA
process into detailed project design and decisions and
suggesting effective environmental management plan.
Consequently, developing an environmental management plan
(EMP) for all phases of the project development, to give
confidence to the planning system by providing for public
participation and for consultation processes and to help in the
identification of possible alternative processes. Based on the

American Journal of Bioscience and Bioengineering 2016; 4(2): 9-25 11
above objectives, provide an operation plan as a surveillance
network programme to monitor performance and activities of
the proposed project.
2. Materials and Methods
2.1. Geographical Description of the Study site / Area
The study site is located within Eteo Community, Eleme
Local Government Area (LGA) of Rivers State, Nigeria. It is
located between Lat. 4° 45’ 10”N & 4° 45’ 20”N and Long. 7°
10’ 20”E & 7° 10” 30”E. (Figs. 1, 2).The study areas are
located in the rainforest belt within the equatorial climate
region, characterized by high rainfall, high relative humidity
and maximum temperature. It is characterized by vegetation
complex of primary and secondary structure, heterogenous in
nature, with spatial (closed and sparse) and vertical
distribution of trees, herbs, shrubs and climbers (lianers)
belonging to different families under local environmental
conditions and edaphic nature. Such dominant families of
plant species include Melastomataceae, Poaceae,
Euphorbiaceae, Rubiaceae, Fabaceae, Costaceae, Tiliaceae,
Asteraceae, Malvaceae, Cyperaceae, Lamiaceae,
Amaranthaceae, Apocynaceae, Verbenaceae, Acanthaceae,
and Connaraceae. Others are Convolvulaceae, Arecaceae,
Moraceae, Commelinaceae, Smilacaceae, Araceae,
Icacinaceae, Vitaceae, Myrtaceae, Selaginellaceae,
Schizacaceae, Adiantaceae, Marattiaceae, Dilleniaceae,
Sapindaceae, Anacardiaceae, Polygalaceae, Solanaceae,
Asclepiadaceae, Davalliaceae, Cleomaceae, Guttiferae,
Passifloraceae, Myristicaceae, Musaceae, Marattiaceae,
Burseraceae, Cecropiaceae, Schrophulariaceae, Combretaceae
and Loganiaceae. These families among other families in the
project area are typical of fallowed secondary vegetation.
Geomorphologically, the edaphic and topographic status
shows that the site is ecologically characterized by
sandy-loam soil.
The environment has witnessed various forms of
anthropogenic activities such as farm land / settlement,
residential houses, industrial activities and other developmental
strives. Though primarily a virgin forest of various vegetation
strata, heterogeneous in structures and nature, the effect of these
forms of activities resulted to some level of ecological
succession which, have consequently left the area with some
form of irregular vegetation features and thus can best be
categorized as a lowland secondary mosaic forest as described
by Hopkin [14] for a low land secondary vegetation system.
Despite such ecological succession by anthropogenic
influences and natural selection under local environmental
condition, the vegetation can still be described as rainforest
vegetation in relation to similar view of vegetation analysis by
SAF [15] and Edwin -Wosu, [5, 16 - 18].
Fig. 1. Rivers State showing Eleme LGA.

12 Nsirim L. Edwin-Wosu and Victor N. Sunday: A Baseline Environmental Impact Assessment (EIA) of Proposed Sit for Thermal
Desorption Unit (TDU) Waste Management Project in Rivers State, Nigeria: Floristic Composition Approach
Fig. 2. Study location.
2.2. Qualitative and Quantitative Flora Assessment
There are different methods and approaches to
environmental impact assessment of development projects.
Five major types are commonly used, viz: the checklist,
interactive matrices, overlay mapping, network and
simulation modeling methods. Based on heterogeneity of the
study site and Terms of Reference’ (TOR) for the flora
biodiversity assessment in line with the irregular
physiognomy of the project area, due to human influence, the
‘Overlay Mapping method is being adopted using the simple
random sampling based on standard procedures for ecological
assessment studies [19]. A total of five transect directions in
site were systematically sampled. All the important
representative plant species sampled were identified in the
field as far as possible and were properly authenticated using
reference books and Floras such as Burkill, [20 – 24];
Hutchinson and Dalziel, [25-29]; Keay, [30].
2.3. Data Analysis
The frequency of distribution, abundance, and density of
the most representative species of the area were estimated
using the methods of Austin and Greig-Smith [31]; Kershaw
[32]; Pryor, [33] and Shukla and Chadel’s [34] approach
modified in Bonham [35]. The species diversity over the study
area was evaluated using the Shannon-Wiener [36] diversity
index. Relative density, relative abundance and relative
frequency were estimated following Misra [37] method.
While the Importance Value Index (IVI) was estimated by
adding the values of RD, RA and RF using the Shukla and
Chandel [34] method. The ratio of abundance to frequency for
different species was determined for distribution patterns.
Thus with the “thumb of rule” designated as follows: Regular
(<0.03), random (0.03 – 0.05), and contiguous (>0.05)
distribution as adopted by Curtis and Cottam [38]. Similarity
index (IS) between the two seasons vegetation complex was
derived from the formula given by Sorensen [39].
3. Result
Floristic Structure, Composition and Classification
This wet and dry season report on the TDU study area
shows that the area is associated with a flora system
characterised by secondary vegetation structure in a closed
and spatial horizontal continuum. The area has ordinarily been
influenced by anthropogenic incursion such as the springing
up of built up areas for residential and industrial purposes,
domestic fire wood logging for fuel consumption and also
American Journal of Bioscience and Bioengineering 2016; 4(2): 9-25 13
farmlands by the local inhabitants. The study as observed in
Tables 1 and 2 for the TDU operation base had shown that the
project sites are richly endowed with floras of various strata
and categories belonging to different plant families despite the
prevailing influences. The project sites are typical virgin forest
though with some levels of secondary heterogeneity as a result
of ecological succession incursioned by both natural and
human factors. Despite the ecological succession, the study
area yet contains plant species in various diversity and
abundance with representative species recorded.
Though, there were differences in the ranks of species
frequency in different transect, the TDU proposed site in wet
season recorded a total representative of 102 species under 39
families in mosaic heterogeneity (Table 1a). Twelve families
were prevalently dominant in which 9 families
(Euphorbiaceae, Fabaceae, Araceae, Apocynaceae,
Malvaceae, Rubiaceae, Passifloraceae, Asteraceae and
Cyperaceae) were very abundant while three families
(Loganiaceae, Poaceae and Commelinaceae) were in
abundance. Among the dominant families, Euphorbiaceae
recorded the highest species diversity in terms of richness with
13 species followed by Fabaceae (7 Species), Rubiaceae and
Asteraceae had 6 species respectively while Cyperaceae had 5
species. In dry season a total of 59 representative species in 30
families were recorded (Table 2a). Nine families were
prevalently dominant with five species (Apocynaceae,
Malvaceae, Rubiaceae, Poaceae and Asteraceae)very
abundant and four species (Euphorbiaceae, Fabaceae,
Tiliaceae and Cyperaceae) in abundance.Among the dominant
families Poaceae and Asteraceae were richest with five
species each. Under such ecological assessment there was
increase in the herbaceous status of habit and life form with
the most representative dominant species in the study site as
herbs distributed among the 39 and 30 families in wet and dry
season respectively.
Phytosociological assessment of species prevalence around
the TDU proposed site shows that among the representative
species (Table 1b) in wet season, 18 species had the highest
frequency occurrence of 100 = 1.61% while the density
showed 49 species with maximum range value of 10 – 60 =
0.80 – 4.80%with the highest density value of 60 = 4.80%
recorded with Manihot esculenta (cassava). A total of 76
species had maximum abundance with a range value of 10 –
100 (0.50 – 4.98%) in which Urena lobata and Oldenlandia
herbacearecorded the highest abundance values of 100 =
4.98% respectively, while Oldenlandia herbaceahave shown
dominance with Important Value Index of 8.82%. Species
diversity is one of the major criteria in recognising the
importance of an area for conservation priority. The diversity
of species in the study area has shown some degree of
variation in flora richness and evenness among representative
samples. Result showed that cassava and Oldenlandia
herbacea recorded the highest diversity with Index Value of
0.05 richness and 0.02 evenness respectively among
representative with maximum value range of 0.04 – 0.05
richness and 0.02 evenness. The ratio of abundance to
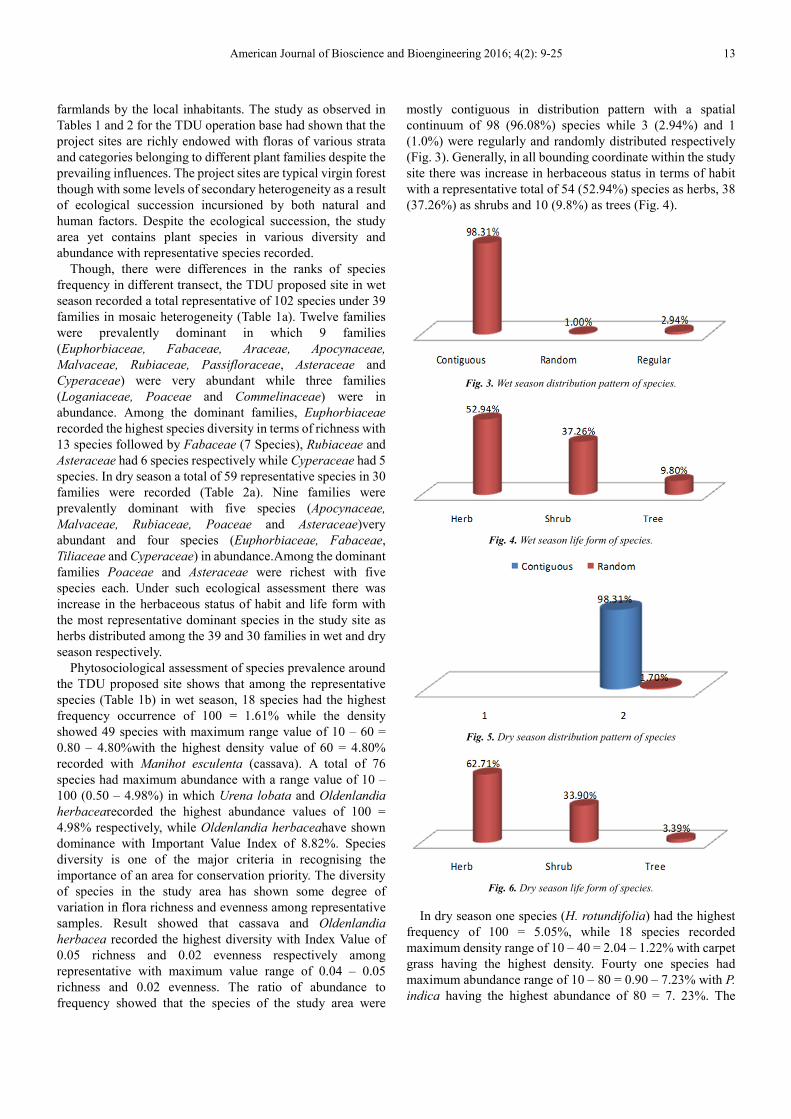
frequency showed that the species of the study area were
mostly contiguous in distribution pattern with a spatial
continuum of 98 (96.08%) species while 3 (2.94%) and 1
(1.0%) were regularly and randomly distributed respectively
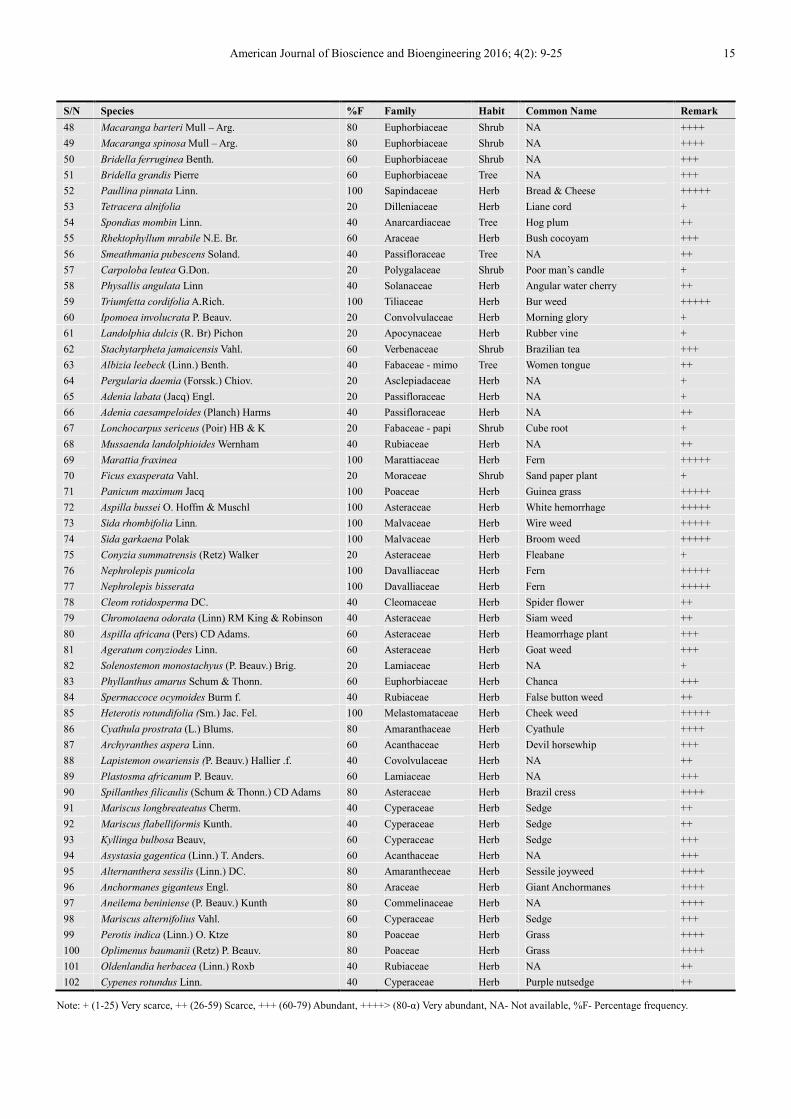
(Fig. 3). Generally, in all bounding coordinate within the study
site there was increase in herbaceous status in terms of habit
with a representative total of 54 (52.94%) species as herbs, 38
(37.26%) as shrubs and 10 (9.8%) as trees (Fig. 4).
Fig. 3. Wet season distribution pattern of species.
Fig. 4. Wet season life form of species.
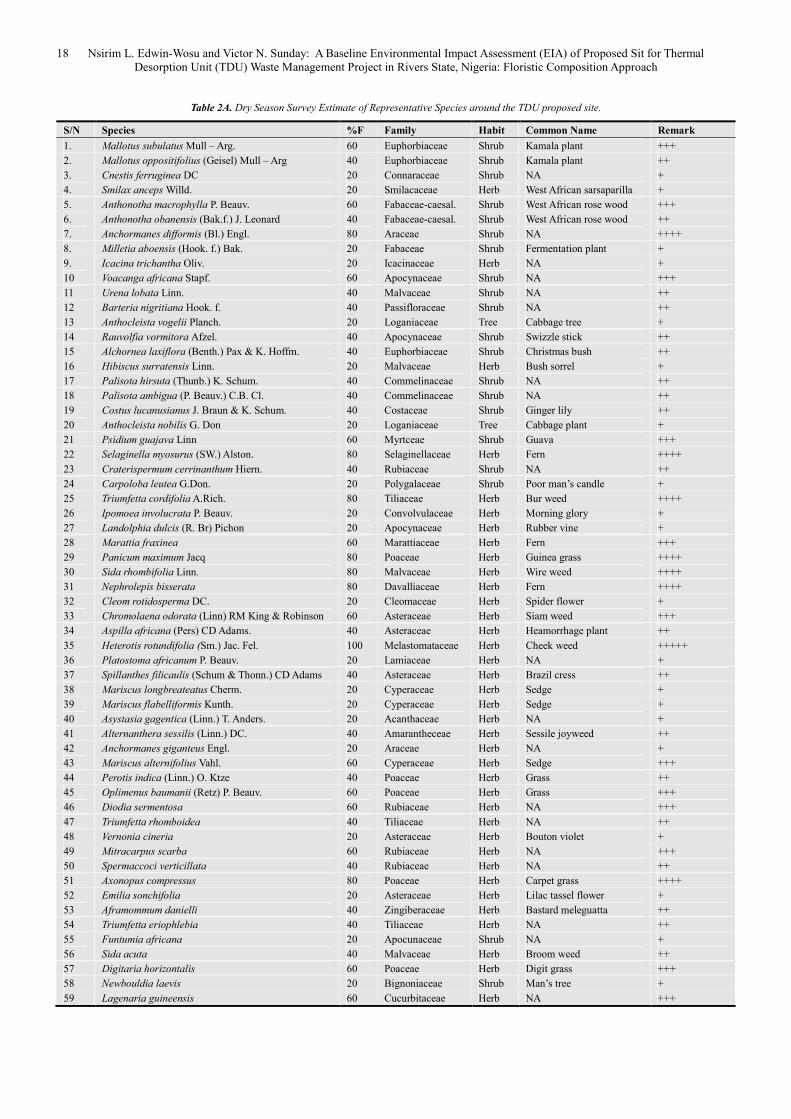
Fig. 5. Dry season distribution pattern of species
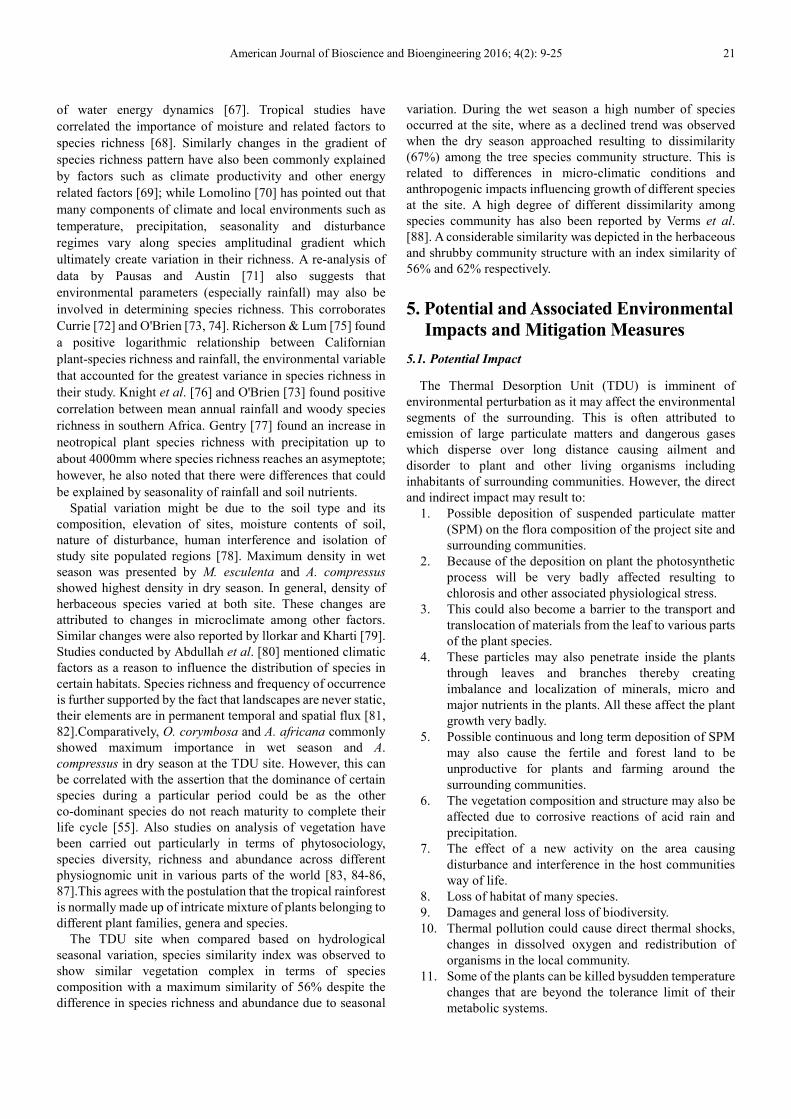
Fig. 6. Dry season life form of species.
In dry season one species (H. rotundifolia) had the highest
frequency of 100 = 5.05%, while 18 species recorded
maximum density range of 10 – 40 = 2.04 – 1.22% with carpet
grass having the highest density. Fourty one species had
maximum abundance range of 10 – 80 = 0.90 – 7.23% with P.
indica having the highest abundance of 80 = 7. 23%. The

14 Nsirim L. Edwin-Wosu and Victor N. Sunday: A Baseline Environmental Impact Assessment (EIA) of Proposed Sit for Thermal
Desorption Unit (TDU) Waste Management Project in Rivers State, Nigeria: Floristic Composition Approach
highest IVI of 16.71% was recorded by carpet grass, with
highest diversity of 0.07 richness and 0.04 evenness. The
distribution pattern had 58 (98.31%) species with contiguous
and one (1.70%) as random distribution (Fig. 5), while life
form habit had 37 (62.71%) as herbs, 20 (33. 90%) as shrubs
and 2 (3. 39%) as trees (Table 2b) (Fig. 6). Despite the
variation in season, on the basis of similarity in species
composition of the vegetation structure the site recorded
maximum similarity of 56%.
Generally, the plant species in the project location were not
remarkably infected with pathogens when compared to the
apparent observation of leaf sports, die back, leaf blotch, dry
rot, stem rot, stem corky and fungi and mushroom infestation
as at the period of sampling.
Table 1A. Wet season Survey Estimate of Representative Species around the TDU proposed site.
S/N Species %F Family Habit Common Name Remark
1 Alchornea cordifolia (Schum & Thonn) Mull – Arg. 80 Euphorbiaceae Shrub Christmas bush ++++
2 Mallotus subulatus Mull – Arg. 100 Euphorbiaceae Shrub Kamala plant +++++
3 Mallotus oppositifolus (Geisel) Mull – Arg 60 Euphorbiaceae Shrub Kamala plant +++
4 Cnestis ferruginea DC 40 Connaraceae Shrub NA ++
5 Smilax anceps Willd. 40 Smilacaceae Herb West African sarsaparilla ++
6 Anthonotha macrophylla P. Beauv. 100 Fabaceae-caesal. Shrub West African rose wood +++++
7 Anthonotha obanensis (Bak.f.) J. Leonard 100 Fabaceae-caesal. Shrub West African rose wood +++++
8 Anchormanes difformis (Bl.) Engl. 80 Araceae Shrub Forest Anchormanes ++++
9 Milletia aboensis (Hook. f.) Bak. 60 Fabaceae Shrub Fermentation plant +++
10 Icacina trichantha Oliv. 60 Icacinaceae Herb NA +++
11 Voacanga africana Stapf. 80 Apocynaceae Shrub NA ++++
12 Urena lobata Linn. 20 Malvaceae Shrub NA +
13 Oldenlandia corymbosa Linn. 60 Rubiaceae Herb Mille - graines +++
14 Icacina mannii Oliv. 20 Icacinaceae Herb NA +
15 Barteria nigritiana Hook. f. 80 Passifloraceae Shrub NA ++++
16 Elaeis guineensis Jacq 100 Arecaceae Tree Oil palm tree +++++
17 Anthocleista vogelii Planch. 80 Loganiaceae Tree Cabbage tree ++++
18 Anthocleista djalonesis A. Chev. 80 Loganiaceae Tree Cabbage tree ++++
19 Harrungana madagascariensis Ham ex Pour 100 Guttiferae Shrub Dragon’s blood +++++
20 Rauvolfia vormitora Afzel. 80 Apocynaceae Shrub Swizzle stick ++++
21 Bambusa vulgaris Schrad. 60 Poaceae Tree Indian bamboo +++
22 Alchornea laxiflora (Benth.) Pax & K. Hoffm. 80 Euphorbiaceae Shrub Christmas bush ++++
23 Manniophyton fulvum Mull – Arg. 20 Euphorbiaceae Shrub NA +
24 Hibiscus surratensis Linn. 20 Malvaceae Herb Bush sorrel +
25 Palisota hirsuta (Thunb.) K. Schum. 80 Commelinaceae Shrub NA ++++
26 Palisota ambigua (P. Beauv.) C.B. Cl. 60 Commelinaceae Shrub NA +++
27 Costus lucanusianus J. Braun & K. Schum. 80 Costaceae Shrub Ginger lily ++++
28 Costus afer Ker – Gawl. 80 Costaceae Shrub Bush cane ++++
29 Anthoeleista nobilis G. Don 40 Longaniaceae Tree Cabbage plant ++
30 Vitex doniana Sweet. 20 Vitaceae Shrub Black plum +
31 Funfumia africana (Benth.) Stapf. 60 Apocynaceae Shrub NA +++
32 Anchormanes giganteus Engl. 80 Araceae Herb Giant Anchormanes ++++
33 Psiduim guajava Linn 60 Myrtceae Shrub Guava +++
34 Maesobotrya barteri (Baill) Hutch. 40 Euphorbiaceae Shrub Bush cherry ++
35 Grifformia physocarpa Baill. 40 Fabaceae Tree NA ++
36 Selaginella myosurus (SW.) Alston. 100 Selaginellaceae Herb Fern +++++
37 Lygodium macrophyllum 100 Schizacaceae Herb Fern +++++
38. Senna hirsuta (Linn.) Irwin & Barneby 80 Fabaceae-ceasal Shrub Senna ++++
39 Manihot esculenta Crantz 100 Euphorbiaceae Shrub Cassava +++++
40 Pteris acanthonura 20 Adiantaceae Herb Fern +
41 Cissus aralioides (Welw.) Planch. 60 Vitaceae Herb NA +++
42 Stachytarpheta cayennensis (LC Rich.) Schau. 80 Verbenaceae Shrub Rat tail ++++
43 Melastomastrum capitatum (Vahl.) A & R. Fernandes 40 Melastomataceae Shrub NA ++
44 Antidesma vogelianum Mull- Arg. 40 Euphorbiaceae Shrub NA ++
45 Glyphea brevis (Spreng) Monachino 40 Tiliaceae Shrub NA ++
46 Craterispernum cerrunanthum Hiern. 60 Rubiaceae Shrub NA +++
47 Craterispernum caudatum 60 Rubiaceae Shrub NA +++
American Journal of Bioscience and Bioengineering 2016; 4(2): 9-25 15
S/N Species %F Family Habit Common Name Remark
48 Macaranga barteri Mull – Arg. 80 Euphorbiaceae Shrub NA ++++
49 Macaranga spinosa Mull – Arg. 80 Euphorbiaceae Shrub NA ++++
50 Bridella ferruginea Benth. 60 Euphorbiaceae Shrub NA +++
51 Bridella grandis Pierre 60 Euphorbiaceae Tree NA +++
52 Paullina pinnata Linn. 100 Sapindaceae Herb Bread & Cheese +++++
53 Tetracera alnifolia 20 Dilleniaceae Herb Liane cord +
54 Spondias mombin Linn. 40 Anarcardiaceae Tree Hog plum ++
55 Rhektophyllum mrabile N.E. Br. 60 Araceae Herb Bush cocoyam +++
56 Smeathmania pubescens Soland. 40 Passifloraceae Tree NA ++
57 Carpoloba leutea G.Don. 20 Polygalaceae Shrub Poor man’s candle +
58 Physallis angulata Linn 40 Solanaceae Herb Angular water cherry ++
59 Triumfetta cordifolia A.Rich. 100 Tiliaceae Herb Bur weed +++++
60 Ipomoea involucrata P. Beauv. 20 Convolvulaceae Herb Morning glory +
61 Landolphia dulcis (R. Br) Pichon 20 Apocynaceae Herb Rubber vine +
62 Stachytarpheta jamaicensis Vahl. 60 Verbenaceae Shrub Brazilian tea +++
63 Albizia leebeck (Linn.) Benth. 40 Fabaceae - mimo Tree Women tongue ++
64 Pergularia daemia (Forssk.) Chiov. 20 Asclepiadaceae Herb NA +
65 Adenia labata (Jacq) Engl. 20 Passifloraceae Herb NA +
66 Adenia caesampeloides (Planch) Harms 40 Passifloraceae Herb NA ++
67 Lonchocarpus sericeus (Poir) HB & K 20 Fabaceae - papi Shrub Cube root +
68 Mussaenda landolphioides Wernham 40 Rubiaceae Herb NA ++
69 Marattia fraxinea 100 Marattiaceae Herb Fern +++++
70 Ficus exasperata Vahl. 20 Moraceae Shrub Sand paper plant +
71 Panicum maximum Jacq 100 Poaceae Herb Guinea grass +++++
72 Aspilla bussei O. Hoffm & Muschl 100 Asteraceae Herb White hemorrhage +++++
73 Sida rhombifolia Linn. 100 Malvaceae Herb Wire weed +++++
74 Sida garkaena Polak 100 Malvaceae Herb Broom weed +++++
75 Conyzia summatrensis (Retz) Walker 20 Asteraceae Herb Fleabane +
76 Nephrolepis pumicola 100 Davalliaceae Herb Fern +++++
77 Nephrolepis bisserata 100 Davalliaceae Herb Fern +++++
78 Cleom rotidosperma DC. 40 Cleomaceae Herb Spider flower ++
79 Chromotaena odorata (Linn) RM King & Robinson 40 Asteraceae Herb Siam weed ++
80 Aspilla africana (Pers) CD Adams. 60 Asteraceae Herb Heamorrhage plant +++
81 Ageratum conyziodes Linn. 60 Asteraceae Herb Goat weed +++
82 Solenostemon monostachyus (P. Beauv.) Brig. 20 Lamiaceae Herb NA +
83 Phyllanthus amarus Schum & Thonn. 60 Euphorbiaceae Herb Chanca +++
84 Spermaccoce ocymoides Burm f. 40 Rubiaceae Herb False button weed ++
85 Heterotis rotundifolia (Sm.) Jac. Fel. 100 Melastomataceae Herb Cheek weed +++++
86 Cyathula prostrata (L.) Blums. 80 Amaranthaceae Herb Cyathule ++++
87 Archyranthes aspera Linn. 60 Acanthaceae Herb Devil horsewhip +++
88 Lapistemon owariensis (P. Beauv.) Hallier .f. 40 Covolvulaceae Herb NA ++
89 Plastosma africanum P. Beauv. 60 Lamiaceae Herb NA +++
90 Spillanthes filicaulis (Schum & Thonn.) CD Adams 80 Asteraceae Herb Brazil cress ++++
91 Mariscus longbreateatus Cherm. 40 Cyperaceae Herb Sedge ++
92 Mariscus flabelliformis Kunth. 40 Cyperaceae Herb Sedge ++
93 Kyllinga bulbosa Beauv, 60 Cyperaceae Herb Sedge +++
94 Asystasia gagentica (Linn.) T. Anders. 60 Acanthaceae Herb NA +++
95 Alternanthera sessilis (Linn.) DC. 80 Amarantheceae Herb Sessile joyweed ++++
96 Anchormanes giganteus Engl. 80 Araceae Herb Giant Anchormanes ++++
97 Aneilema beniniense (P. Beauv.) Kunth 80 Commelinaceae Herb NA ++++
98 Mariscus alternifolius Vahl. 60 Cyperaceae Herb Sedge +++
99 Perotis indica (Linn.) O. Ktze 80 Poaceae Herb Grass ++++
100 Oplimenus baumanii (Retz) P. Beauv. 80 Poaceae Herb Grass ++++
101 Oldenlandia herbacea (Linn.) Roxb 40 Rubiaceae Herb NA ++
102 Cypenes rotundus Linn. 40 Cyperaceae Herb Purple nutsedge ++
Note: + (1-25) Very scarce, ++ (26-59) Scarce, +++ (60-79) Abundant, ++++> (80-α) Very abundant, NA- Not available, %F- Percentage frequency.

16 Nsirim L. Edwin-Wosu and Victor N. Sunday: A Baseline Environmental Impact Assessment (EIA) of Proposed Sit for Thermal
Desorption Unit (TDU) Waste Management Project in Rivers State, Nigeria: Floristic Composition Approach
Table 1B. Wet Season Quantitative List of Representative Species around the TDU proposed site.
S/N Species %F D A %RF %RD %RA IVI SDR SDE A/F
1 Alchornea cordifolia (Schum & Thonn) Mull – Arg. 80 20 25 1.29 1.60 1.25 4.14 0.03 0.01 0.31
2 Mallotus subulatus Mull – Arg. 100 10 10 1.61 0.80 0.50 2.91 0.02 0.01 0.10
3 Mallotus oppositifolus (Geisel) Mull – Arg 60 14 23.3 0.96 1.12 1.16 3.24 0.02 0.01 0.38
4 Cnestis ferruginea DC 40 6 15 0.64 0.48 0.75 1.87 0.01 0.01 0.38
5 Smilax anceps Willd. 40 3 7.5 0.64 0.24 0.37 1.25 0.01 0.01 0.19
6 Anthonotha macrophylla P. Beauv. 100 20 20 1.61 1.60 1.00 4.21 0.03 0.01 0.20
7 Anthonotha obanensis (Bak.f.) J. Leonard 100 20 20 1.61 1.60 1.00 4.21 0.03 0.01 0.20
8 Anchormanes difformis (Bl.) Engl. 80 12 15 1.29 0.96 0.75 3.00 0.02 0.01 0.19
9 Milletia aboensis (Hook. f.) Bak. 60 16 26.7 0.96 1.28 1.33 3.57 0.02 0.01 0.45
10 Icacina trichantha Oliv. 60 6 10 0.96 0.48 0.50 1.94 0.01 0.01 0.17
11 Voacanga africana Stapf. 80 20 25 1.29 1.60 1.25 4.14 0.03 0.01 0.31
12 Urena lobata Linn. 20 20 100 0.32 1.60 4.98 6.90 0.04 0.02 5.00
13 Oldenlandia corymbosa Linn. 60 40 66.7 0.96 3.20 3.32 7.48 0.04 0.02 1.11
14 Icacina mannii Oliv. 20 3 15 0.32 0.24 0.75 1.31 0.01 0.01 0.75
15 Barteria nigritiana Hook. f. 80 14 17.5 1.29 1.12 0.87 3.28 0.02 0.01 0.22
16 Elaeis guineensis Jacq 100 20 20 1.61 1.60 1.00 4.21 0.03 0.01 0.20
17 Anthocleista vogelii Planch. 80 2 2.5 1.29 0.16 0.12 1.57 0.01 0.01 0.03
18 Anthocleista djalonesis A. Chev. 80 1 1.3 1.29 0.08 0.06 1.43 0.01 0.01 0.02
19 Harrungana madagascariensis Ham ex Pour 100 20 20 1.61 1.60 1.00 4.21 0.03 0.01 0.20
20 Rauvolfia vormitora Afzel. 80 14 17.5 1.29 1.12 0.87 3.28 0.02 0.01 0.22
21 Bambusa vulgaris Schrad. 60 16 26.7 0.96 1.28 1.33 3.57 0.02 0.01 0.45
22 Alchornea laxiflora (Benth.) Pax & K. Hoffm. 80 10 12.5 1.29 0.80 0.62 2.71 0.02 0.01 0.16
23 Manniophyton fulvum Mull – Arg. 20 4 20 0.32 0.32 1.00 1.64 0.01 0.01 1.00
24 Hibiscus surratensis Linn. 20 4 20 0.32 0.32 1.00 1.64 0.01 0.01 1.00
25 Palisota hirsuta (Thunb.) K. Schum. 80 20 25 1.29 1.60 1.25 4.14 0.03 0.01 0.31
26 Palisota ambigua (P. Beauv.) C.B. Cl. 60 20 33.3 0.96 1.60 1.66 4.22 0.03 0.01 0.56
27 Costus lucanusianus J. Braun & K. Schum. 80 20 25 1.29 1.60 1,25 4.14 0.03 0.01 0.31
28 Costus afer Ker – Gawl. 80 20 25 1.29 1.60 1.25 4.14 0.03 0.01 0.31
29 Anthoeleista nobilis G. Don 40 3 7.5 0.64 0.24 0.37 1.25 0.01 0.01 0.19
30 Vitex doniana Sweet. 20 2 10 0.32 0.16 0.50 0.98 0.01 0.004 0.50
31 Funfumia africana (Benth.) Stapf. 60 4 10 0.96 0.32 0.33 1.61 0.01 0.01 0.17
32 Anchormanes giganteus Engl. 80 8 5 1.29 0.64 0.50 2.43 0.02 0.01 0.06
33 Psiduim guajava Linn 60 6 5 0.96 0.48 0.50 1.49 0.01 0.01 0.08
34 Maesobotrya barteri (Baill) Hutch. 40 2 20 0.64 0.16 0.25 1.05 0.01 0.01 0.50
35 Grifformia physocarpa Baill. 40 2 20 0.64 0.16 0.25 1.05 0.01 0.01 0.50
36 Selaginella myosurus (SW.) Alston. 100 20 7.5 1.61 1.60 1.00 4.21 0.03 0.01 0.08
37 Lygodium macrophyllum 100 20 60 1.61 1.60 1.00 4.21 0.03 0.01 0.06
38. Senna hirsuta (Linn.) Irwin & Barneby 80 6 20 1.29 0.48 0.37 2.14 0.02 0.01 0.25
39 Manihot esculenta Crantz 100 60 6.7 1.61 4.80 2.99 9.40 0.05 0.02 0.07
40 Pteris acanthonura 20 4 12.5 0.32 0.32 1.00 1.64 0.01 0.01 0.63
41 Cissus aralioides (Welw.) Planch. 60 4 20 0.96 0.32 0.33 1.61 0.01 0.01 0.33
42 Stachytarpheta cayennensis (LC Rich.) Schau. 80 10 5 1.29 0.80 0.62 2.71 0.02 0.01 0.06
43 Melastomastrum capitatum (Vahl.) A & R. Fernandes 40 8 5 0.64 0.64 1.00 2.28 0.02 0.01 0.13
44 Antidesma vogelianum Mull- Arg. 40 2 10 0.64 0.16 0.25 1.05 0.01 0.01 0.25
45 Glyphea brevis (Spreng) Monachino 40 2 10 0.64 0.16 0.25 1.05 0.01 0.01 0.25
46 Craterispernum cerrunanthum Hiern. 60 6 7.5 0.96 0.48 0.50 1.94 0.01 0.01 0.13
47 Craterispernum caudatum 60 6 10 0.96 0.48 0.05 1.94 0.01 0.01 0.17
48 Macaranga barteri Mull – Arg. 80 6 6.7 1.29 0.48 0.37 2.14 0.02 0.01 0.08
49 Macaranga spinosa Mull – Arg. 80 8 10 1.29 0.64 0.50 2.43 0.02 0.01 0.13
50 Bridella ferruginea Benth. 60 4 0.96 0.96 0.32 0.33 1.61 0.01 0.01 0.02
51 Bridella grandis Pierre 60 4 0.96 0.96 0.32 0.33 1.61 0.01 0.01 0.02

American Journal of Bioscience and Bioengineering 2016; 4(2): 9-25 17
S/N Species %F D A %RF %RD %RA IVI SDR SDE A/F
52 Paullina pinnata Linn. 100 12 12 1.61 0.96 0.60 3.17 0.02 0.01 0.12
53 Tetracera alnifolia 20 2 10 0.32 0.16 0.50 0.98 0.01 0.004 0.50
54 Spondias mombin Linn. 40 1 2.5 0.64 0.08 0.12 0.84 0.01 0.004 0.06
55 Rhektophyllum mrabile N.E. Br. 60 4 6.7 0.96 0.32 0.33 1.61 0.01 0.01 0.11
56 Smeathmania pubescens Soland. 40 2 5 0.64 0.16 0.25 1.05 0.01 0.01 0.13
57 Carpoloba leutea G.Don. 20 1 5 0.32 0.08 0.25 0.65 0.01 0.003 0.25
58 Physallis angulata Linn 40 2 5 0.64 0.16 0.25 1.05 0.01 0.01 0.13
59 Triumfetta cordifolia A.Rich. 100 6 6 1.61 0.48 0.30 2.39 0.02 0.01 0.06
60 Ipomoea involucrata P. Beauv. 20 2 10 0.32 0.16 0.50 0.98 0.01 0.004 0.50
61 Landolphia dulcis (R. Br) Pichon 20 2 10 0.32 0.16 0.50 0.98 0.01 0.004 0.50
62 Stachytarpheta jamaicensis Vahl. 60 6 10 0.96 0.48 0.50 1.94 0.01 0.01 0.10
63 Albizia leebeck (Linn.) Benth. 40 2 5 0.64 0.16 0.25 1.05 0.01 0.01 0.13
64 Pergularia daemia (Forssk.) Chiov. 20 1 5 0.32 0.08 0.25 0.65 0.01 0.01 0.25
65 Adenia labata (Jacq) Engl. 20 1 5 0.32 0.08 0.25 0.65 0.01 0.003 0.25
66 Adenia caesampeloides (Planch) Harms 40 1 2.5 0.64 0.08 0.12 0.84 0.01 0.004 0.06
67 Lonchocarpus sericeus (Poir) HB & K 20 2 10 0.32 0.16 0.50 0.98 0.01 0.004 0.50
68 Mussaenda landolphioides Wernham 40 4 10 0.64 0.32 0.50 1.46 0.01 0.01 0.25
69 Marattia fraxinea 100 20 20 1.61 1.6 1.00 4.21 0.03 0.01 0.20
70 Ficus exasperata Vahl. 20 1 5 0.32 0.08 0.25 0.65 0.01 0.003 0.25
71 Panicum maximum Jacq 100 40 40 1.61 3.20 1.99 6.80 0.04 0.02 0.40
72 Aspilla bussei O. Hoffm & Muschl 100 20 20 1.61 1.60 1.00 4.21 0.03 0.01 0.20
73 Sida rhombifolia Linn. 100 20 20 1.61 1.60 1.00 4.21 0.03 0.01 0.20
74 Sida garkaena Polak 100 20 20 1.61 1.60 1.00 4.21 0.03 0.01 0.20
75 Conyzia summatrensis (Retz) Walker 20 2 10 0.32 0.16 0.50 0.98 0.01 0.004 0.50
76 Nephrolepis pumicola 100 20 20 1.61 1.60 1.00 4.21 0.03 0.01 0.20
77 Nephrolepis bisserata 100 24 24 1.61 1.92 1.20 4.73 0.03 0.02 0.24
78 Cleom rotidosperma DC. 40 10 25 0.64 0.80 1,25 2.69 0.02 0.01 0.63
79 Chromotaena odorata (Linn) RM King & Robinson 40 20 50 0.64 1.60 2.49 4.73 0.03 0.02 1.25
80 Aspilla africana (Pers) CD Adams. 60 40 66.7 0.96 3.20 3.32 7.48 0.04 0.02 1.11
81 Ageratum conyziodes Linn. 60 10 16.7 0.96 0.80 0.83 2.59 0.02 0.01 0.28
82 Solenostemon monostachyus (P. Beauv.) Brig. 20 6 30 0.32 0.48 1.50 2.30 0.02 0.01 1.50
83 Phyllanthus amarus Schum & Thonn. 60 20 33.3 0.96 1.60 1.66 4.22 0.03 0.01 0.56
84 Spermaccoce ocymoides Burm f. 40 12 30 0.64 0.96 1.50 3.10 0.02 0.01 0.75
85 Heterotis rotundifolia (Sm.) Jac. Fel. 100 20 20 1.61 1.60 1.00 4.21 0.03 0.01 0.20
86 Cyathula prostrata (L.) Blums. 80 16 20 1.29 1.28 1.00 3.57 0.02 0.01 0.25
87 Archyranthes aspera Linn. 60 20 33.3 0.96 1.60 1.66 4.22 0.03 0.01 0.56
88 Lapistemon owariensis (P. Beauv.) Hallier .f. 40 6 15 0.64 0.48 0.75 1.87 0.01 0.01 0.38
89 Plastosma africanum P. Beauv. 60 8 13.3 0.96 0.64 0.66 2.26 0.02 0.01 0.22
90 Spillanthes filicaulis (Schum & Thonn.) CD Adams 80 20 25 1.29 1.60 1.25 4.14 0.03 0.01 0.31
91 Mariscus longbreateatus Cherm. 40 8 20 0.64 0.64 1.00 2.28 0.02 0.01 0.50
92 Mariscus flabelliformis Kunth. 40 8 20 0.64 0.64 1.00 2.28 0.02 0.01 0.50
93 Kyllinga bulbosa Beauv, 60 12 20 0.96 0.96 1.00 2.92 0.02 0.01 0.33
94 Asystasia gagentica (Linn.) T. Anders. 60 6 10 0.96 0.48 0.50 1.94 0.01 0.01 0.17
95 Alternanthera sessilis (Linn.) DC. 80 20 25 1.29 1.60 1.25 4.14 0.03 0.01 0.31
96 Anchormanes giganteus Engl. 80 6 7.5 1.29 0.48 0.37 2.14 0.02 0.01 0.08
97 Aneilema beniniense (P. Beauv.) Kunth 80 12 15 1.29 0.96 0.75 3.00 0.02 0.01 0.19
98 Mariscus alternifolius Vahl. 60 20 33.3 0.96 1.60 1.66 4.22 0.03 0.01 0.56
99 Perotis indica (Linn.) O. Ktze 80 40 50 1.29 3.20 2.49 6.98 0.04 0.02 0.63
100 Oplimenus baumanii (Retz) P. Beauv. 80 40 50 1.29 3.20 2.49 6.98 0.04 0.02 0.63
101 Oldenlandia herbacea (Linn.) Roxb 40 40 100 0.64 3.20 4.98 8.82 0.05 0.02 2.50
102 Cypenes rotundus Linn. 40 20 50 0.64 1.60 2.49 4.73 0.03 0.02 1.25
6220 1250 2006.1 299.92
18 Nsirim L. Edwin-Wosu and Victor N. Sunday: A Baseline Environmental Impact Assessment (EIA) of Proposed Sit for Thermal
Desorption Unit (TDU) Waste Management Project in Rivers State, Nigeria: Floristic Composition Approach
Table 2A. Dry Season Survey Estimate of Representative Species around the TDU proposed site.
S/N Species %F Family Habit Common Name Remark
1. Mallotus subulatus Mull – Arg. 60 Euphorbiaceae Shrub Kamala plant +++
2. Mallotus oppositifolius (Geisel) Mull – Arg 40 Euphorbiaceae Shrub Kamala plant ++
3. Cnestis ferruginea DC 20 Connaraceae Shrub NA +
4. Smilax anceps Willd. 20 Smilacaceae Herb West African sarsaparilla +
5. Anthonotha macrophylla P. Beauv. 60 Fabaceae-caesal. Shrub West African rose wood +++
6. Anthonotha obanensis (Bak.f.) J. Leonard 40 Fabaceae-caesal. Shrub West African rose wood ++
7. Anchormanes difformis (Bl.) Engl. 80 Araceae Shrub NA ++++
8. Milletia aboensis (Hook. f.) Bak. 20 Fabaceae Shrub Fermentation plant +
9. Icacina trichantha Oliv. 20 Icacinaceae Herb NA +
10 Voacanga africana Stapf. 60 Apocynaceae Shrub NA +++
11 Urena lobata Linn. 40 Malvaceae Shrub NA ++
12 Barteria nigritiana Hook. f. 40 Passifloraceae Shrub NA ++
13 Anthocleista vogelii Planch. 20 Loganiaceae Tree Cabbage tree +
14 Rauvolfia vormitora Afzel. 40 Apocynaceae Shrub Swizzle stick ++
15 Alchornea laxiflora (Benth.) Pax & K. Hoffm. 40 Euphorbiaceae Shrub Christmas bush ++
16 Hibiscus surratensis Linn. 20 Malvaceae Herb Bush sorrel +
17 Palisota hirsuta (Thunb.) K. Schum. 40 Commelinaceae Shrub NA ++
18 Palisota ambigua (P. Beauv.) C.B. Cl. 40 Commelinaceae Shrub NA ++
19 Costus lucanusianus J. Braun & K. Schum. 40 Costaceae Shrub Ginger lily ++
20 Anthocleista nobilis G. Don 20 Loganiaceae Tree Cabbage plant +
21 Psidium guajava Linn 60 Myrtceae Shrub Guava +++
22 Selaginella myosurus (SW.) Alston. 80 Selaginellaceae Herb Fern ++++
23 Craterispermum cerrinanthum Hiern. 40 Rubiaceae Shrub NA ++
24 Carpoloba leutea G.Don. 20 Polygalaceae Shrub Poor man’s candle +
25 Triumfetta cordifolia A.Rich. 80 Tiliaceae Herb Bur weed ++++
26 Ipomoea involucrata P. Beauv. 20 Convolvulaceae Herb Morning glory +
27 Landolphia dulcis (R. Br) Pichon 20 Apocynaceae Herb Rubber vine +
28 Marattia fraxinea 60 Marattiaceae Herb Fern +++
29 Panicum maximum Jacq 80 Poaceae Herb Guinea grass ++++
30 Sida rhombifolia Linn. 80 Malvaceae Herb Wire weed ++++
31 Nephrolepis bisserata 80 Davalliaceae Herb Fern ++++
32 Cleom rotidosperma DC. 20 Cleomaceae Herb Spider flower +
33 Chromolaena odorata (Linn) RM King & Robinson 60 Asteraceae Herb Siam weed +++
34 Aspilla africana (Pers) CD Adams. 40 Asteraceae Herb Heamorrhage plant ++
35 Heterotis rotundifolia (Sm.) Jac. Fel. 100 Melastomataceae Herb Cheek weed +++++
36 Platostoma africanum P. Beauv. 20 Lamiaceae Herb NA +
37 Spillanthes filicaulis (Schum & Thonn.) CD Adams 40 Asteraceae Herb Brazil cress ++
38 Mariscus longbreateatus Cherm. 20 Cyperaceae Herb Sedge +
39 Mariscus flabelliformis Kunth. 20 Cyperaceae Herb Sedge +
40 Asystasia gagentica (Linn.) T. Anders. 20 Acanthaceae Herb NA +
41 Alternanthera sessilis (Linn.) DC. 40 Amarantheceae Herb Sessile joyweed ++
42 Anchormanes giganteus Engl. 20 Araceae Herb NA +
43 Mariscus alternifolius Vahl. 60 Cyperaceae Herb Sedge +++
44 Perotis indica (Linn.) O. Ktze 40 Poaceae Herb Grass ++
45 Oplimenus baumanii (Retz) P. Beauv. 60 Poaceae Herb Grass +++
46 Diodia sermentosa 60 Rubiaceae Herb NA +++
47 Triumfetta rhomboidea 40 Tiliaceae Herb NA ++
48 Vernonia cineria 20 Asteraceae Herb Bouton violet +
49 Mitracarpus scarba 60 Rubiaceae Herb NA +++
50 Spermaccoci verticillata 40 Rubiaceae Herb NA ++
51 Axonopus compressus 80 Poaceae Herb Carpet grass ++++
52 Emilia sonchifolia 20 Asteraceae Herb Lilac tassel flower +
53 Aframommum danielli 40 Zingiberaceae Herb Bastard meleguatta ++
54 Triumfetta eriophlebia 40 Tiliaceae Herb NA ++
55 Funtumia africana 20 Apocunaceae Shrub NA +
56 Sida acuta 40 Malvaceae Herb Broom weed ++
57 Digitaria horizontalis 60 Poaceae Herb Digit grass +++
58 Newbouldia laevis 20 Bignoniaceae Shrub Man’s tree +
59 Lagenaria guineensis 60 Cucurbitaceae Herb NA +++

American Journal of Bioscience and Bioengineering 2016; 4(2): 9-25 19
Table 2B. Dry Season Quantitative List of Representative Species around the TDU proposed site.
S/N Species %F D A %RF %RD %RA IVI SDR SDE A/F
1 Mallotus subulatus Mull – Arg. 60 4 6.7 3.03 0.82 0.61 4.46 0.03 0.02 0.11
2 Mallotus oppositifolius (Geisel) Mull – Arg 40 6 15 2.02 1.22 1.36 4.60 0.03 0.02 0.38
3 Cnestis ferruginea DC 20 2 10 1.01 0.41 0.90 2.32 0.02 0.01 0.50
4 Smilax anceps Willd. 20 2 10 1.01 0.41 0.90 2.32 0.02 0.01 0.50
5 Anthonotha macrophylla P. Beauv. 60 6 10 3.03 1.22 0.90 5.15 0.03 0.02 0.17
6 Anthonotha obanensis (Bak.f.) J. Leonard 40 3 7.5 2.02 0.61 0.68 3.31 0.02 0.01 0.19
7 Anchormanes difformis (Bl.) Engl. 80 2 2.5 4.04 0.41 0.23 4.68 0.03 0.02 0.03
8 Milletia aboensis (Hook. f.) Bak. 20 7 35 1.01 1.43 3.16 5.60 0.03 0.02 1.75
9 Icacina trichantha Oliv. 20 1.6 8 1.01 0.33 0.72 2.06 0.01 0.01 0.40
10 Voacanga africana Stapf. 60 4 6.7 3.03 0.82 0.61 4.46 0.03 0.02 0.11
11 Urena lobata Linn. 40 2 5 2.02 0.41 0.45 2.88 0.02 0.01 0.13
12 Barteria nigritiana Hook. f. 40 5 12.5 2.02 1.02 1.13 4.17 0.02 0.01 0.31
13 Anthocleista vogelii Planch. 20 1 5 1.01 0.20 0.45 1.66 0.01 0.01 0.25
14 Rauvolfia vormitora Afzel. 40 3 7.5 2.02 0.61 0.68 3.31 0.003 0.002 0.19
15 Alchornea laxiflora (Benth.) Pax & K. Hoffm. 40 3 7.5 2.02 0.61 0.68 3.31 0.003 0.002 0.19
16 Hibiscus surratensis Linn. 20 2 10 1.01 0.41 0.90 2.32 0.02 0.01 0.50
17 Palisota hirsuta (Thunb.) K. Schum. 40 8 20 2.02 1.63 1.81 5.46 0.03 0.02 0.50
18 Palisota ambigua (P. Beauv.) C.B. Cl. 40 8 20 2.02 1.63 1.81 5.46 0.03 0.02 0.50
19 Costus lucanusianus J. Braun & K. Schum. 40 6 15 2.02 1.22 1.36 4.60 0.03 0.02 0.38
20 Anthocleista nobilis G. Don 20 1 5 1.01 0.20 0.45 1.66 0.02 0.01 0.25
21 Psidium guajava Linn 60 2 3.3 3.03 0.41 0.30 3.74 0.02 0.01 0.06
22 Selaginella myosurus (SW.) Alston. 80 12 15 4.04 2.45 1.36 7.85 0.04 0.02 0.19
23 Craterispermum cerrinanthum Hiern. 40 2 5 2.02 0.41 0.45 2.88 0.02 0.01 0.13
24 Carpoloba leutea G.Don. 20 1 5 1.01 0.20 0.45 1.66 0.02 0.01 0.25
25 Triumfetta cordifolia A.Rich. 80 4 5 4.04 0.82 0.45 5.31 0.03 0.02 0.63
26 Ipomoea involucrata P. Beauv. 20 2 10 1.01 0.41 0.90 2.32 0.02 0.01 0.50
27 Landolphia dulcis (R. Br) Pichon 20 1 5 1.01 0.20 0.45 1.66 0.01 0.01 0.25
28 Marattia fraxinea 60 12 20 3.03 2.45 1.81 7.29 0.04 0.02 0.33
29 Panicum maximum Jacq 80 20 25 4.04 4.08 2.26 10.38 0.05 0.03 0.31
30 Sida rhombifolia Linn. 80 10 12.5 4.04 2.04 1.13 7.21 0.04 0.02 0.16
31 Nephrolepis bisserata 80 20 25 4.04 4.08 2.26 10.38 0.05 0.03 0.31
32 Cleom rotidosperma DC. 20 4 20 1.01 0.82 1.81 3.64 0.02 0.01 1.00
33 Chromolaena odorata (Linn) RM King & Robinson 60 16 26.7 3.03 3.26 2.41 8.70 0.04 0.02 0.45
34 Aspilla africana (Pers) CD Adams. 40 30 75 2.02 6.11 6.78 14.91 0.06 0.03 1.88
35 Heterotis rotundifolia (Sm.) Jac. Fel. 100 20 20 5.05 4.08 1.81 10.94 0.05 0.03 0.20
36 Platostoma africanum P. Beauv. 20 6 30 1.02 1.22 2.71 4.94 0.03 0.02 1.50
37 Spillanthes filicaulis (Schum & Thonn.) CD Adams 40 16 40 2.02 3.26 3.62 8.90 0.04 0.02 1.00
38 Mariscus longbreateatus Cherm. 20 4 20 1.02 0.82 1.81 3.64 0.02 0.01 1.00
39 Mariscus flabelliformis Kunth. 20 6 30 1.01 1.22 2.71 4.94 0.03 0.02 1.50
40 Asystasia gagentica (Linn.) T. Anders. 20 4 20 1.01 0.82 1.81 3.64 0.02 0.01 1.00
41 Alternanthera sessilis (Linn.) DC. 40 14 35 2.02 2.85 3.16 8.03 0.04 0.02 0.88
42 Anchormanes giganteus Engl. 20 1.6 8 1.01 0.33 0.72 2.06 0.01 0.01 0.40
43 Mariscus alternifolius Vahl. 60 14 23.3 3.03 2.85 2.11 7.99 0.04 0.02 0.39
44 Perotis indica (Linn.) O. Ktze 40 32 80 2.02 6.25 7.23 15.77 0.06 0.04 2.00
45 Oplimenus baumanii (Retz) P. Beauv. 60 36 60 3.03 7.34 5.42 15.79 0.06 0.04 1.00
46 Diodia sermentosa 60 10 16.7 3.03 2.04 1.51 6.58 0.03 0.02 0.28
47 Triumfetta rhomboidea 40 2 5 2.02 0.41 0.45 2.88 0.02 0.01 0.13
48 Vernonia cineria 20 4 20 2.02 0.82 1.81 3.64 0.02 0.01 1.00
49 Mitracarpus scarba 60 8 13.3 3.03 1.63 1.20 5.86 0.03 0.02 0.22
50 Spermaccoci verticillata 40 4 10 2.02 0.82 0.90 3.74 0.02 0.01 0.25
51 Axonopus compressus 80 40 50 4.04 8.15 4.52 16.71 0.07 0.04 0.63
52 Emilia sonchifolia 20 8 40 2.02 2.45 3.62 6.26 0.03 0.02 2.00
53 Aframommum danielli 40 6 15 2.02 0.41 1.36 4.60 0.03 0.02 0.38
54 Triumfetta eriophlebia 40 12 30 2.02 2.45 2.71 7.18 0.04 0.02 0.75
55 Funtumia africana 20 2 10 1.01 0.41 0.90 2.32 0.02 0.01 0.50
56 Sida acuta 40 12 30 2.02 2.45 2.71 7.18 0.04 0.020 0.75
57 Digitaria horizontalis 60 10 16.7 3.03 2.04 1.51 6.58 0.03 0.019 0.28
58 Newbouldia laevis 20 0.4 2 2.02 0.08 0.18 1.27 0.01 0.006 0.10
59 Lagenaria guineensis 60 6 10 3.03 1.22 0.90 5.15 0.03 0.016 1.67
1980 490.6 1106.4 328.31

20 Nsirim L. Edwin-Wosu and Victor N. Sunday: A Baseline Environmental Impact Assessment (EIA) of Proposed Sit for Thermal
Desorption Unit (TDU) Waste Management Project in Rivers State, Nigeria: Floristic Composition Approach
4. Discussion
Floristic composition entails the individual species that
occur in a stand or region. The nature of forest communities
largely depends on the ecological characteristics in sites,
species diversity and habitat status of species [40]. The study
has shown that the area is richly endowed with floras of
various strata and categories (trees, shrubs, herbs, lianers, and
climbers). The greater abundance of herbaceous vascular
species among the families is an indication of a secondary
vegetation structure heterogeneous in nature. The
heterogeneity of the study site vegetation is being attributed to
a number of retrogressive processes such as the influence of
human activities, the regeneration and floristic succession of
study site. This has resulted to changes in vegetation structure
in terms of abundance and species biodiversity. This
corroborates the assertion by Cubizolle et al. [41] who
observed human activity as an important agent influencing
plant species biodiversity. Biodiversity has recently emerged
as an issue of both scientific and political concern primarily
because of an increase in extinction rates caused by human
activities [42]. Several very large experiments have addressed
the relationship between biodiversity, measured as species
richness, and ecosystem function [43, 44, 45, 46, 47 48].
Ecological succession due to prevailing human factor and
local environmental conditions such as hydrological dynamics
has contributed to variation in floral diversity of the project
site in terms of the emergence of heterogeneity under stable
and moderate environmental factor. In general, plant
community ecologists are concerned with patterns of species
response to environmental gradients [49, 50, 51] and tend to
adopt (if only implicitly) a continuum approach to vegetation
with its assumption of continuous change in composition with
position in the multi-dimensional environmental space [52].
The study site has shown differences in the ranks of species in
terms of frequency, abundance, density, diversity, importance
value index and distribution pattern in different transect. The
decreased shift in vegetation composition in dry season may
have also ensued from the loss of annual species that may not
have been environmentally adapted to such a seasonal change
due to decline in moisture content (dry habitat) of the site.
However, other parameters like topography, soil, climate,
aspect, altitude and geographical location do influence the
vegetation diversity of forest.
Frequency is a measure of the uniformity of distribution of a
species; thus a low frequency indicates that a species is either
irregularly distributed or rare in a particular stand or forest.
Frequent distribution of plant density, cover, biomass per unit
area, and height, are used as a measures for expressing
biological abundance and biological dominance of vegetation,
have also been used to describe species composition and
spatial patterns of vegetation in different plant communities
[53]. High frequency indicated more frequent distribution of
species at the TDU site due to optimum environmental
conditions such as the moisture content from the prevailing
rainfall during the wet season. Species dominant during the
different seasons at the site were M. subulatus, A.
macrophylla, A. obanenesis, E. guineensis, H.
madagascariensis, S. myosurus, L. macrophyllum, M.
esculenta, P. pinnata, T. cordifolia, M. fraxinea, P. maximum,
A. bussei, S. rhombifolia, S. garkaena, N. pumicicola, N.
bisserata and H. rotundifolia for wet season, whereas in dry
season H. rotundifolia showed high dominance at the site.
Their dominance in a particular season is seen due to the
availability of optimum conditions for their growth. Similar
observations in context with the present study were also
reported by Kukshal et al. [54] and Shameem et al. [55]. Thus
it becomes evident that during these seasons frequent
occurrence of species is mainly due to the presence of enough
moisture and micro-nutrients [56]. Difference in the species
composition from site to site is mostly due to
micro-environmental changes [57]
It is essential to consider the environmental (e.g. climatic)
control over the niche dimensions of individual species and
patterns of local species richness (alpha diversity) before
attempting to develop general principles for diversity theory.
Species diversity is one of the most important characteristics of
a community; it is a mechanism which generates stability. The
nature of plant community at a place is determined by other that
grows and develops in such environment [58]. The herbaceous
nature of the site could also be a reflection of its life form
transition stage with low shrubby and tree status at the time of
sampling following human and environmental influences and
conditions. This is in conformity with Shameen et al. [55] who
observed high diversity of herb layer in the absence of much
vegetation cover. Though similar decreases in species
abundance and diversity have been recorded among species,
this possibly could be due to anthropogenic gradient such as the
local devegetation for fuel. However, the ecosystem still
maintains the status of abundance, richness and evenness.
Species richness is defined as the number of species (i.e.
trees, shrubs, vascular plants) per unit area. There is growing
interest in quantifying patterns of species richness in tropical
forest especially in forest fragments in a landscape mosaic.
Landscape ecologists have used landscape metrics to estimate
tree species richness with relatively little success because
these variables do not take into account levels of natural and
anthropogenic disturbance and the successional status of
forests [58, 60, 61]. Numerous problems regarding the study
of species richness need to be clarified, including the role of
disturbance [62], and the relative importance of biotic versus
abiotic factors [63, 64]. Huston [62] reviewed species richness
extensively, and regarded patterns of species richness as being
determined by the interaction of disturbance with
environmental gradients and competitive exclusion. Although
over any large region, distribution of species richness is likely
to be governed by two or more environmental gradients [65,
66], species richness studies in relation to environmental
gradients have been mainly single-factor studies.
This assertion could be reaffirmed by a macro-scale study,
which has attributed species diversity richness to be a product
American Journal of Bioscience and Bioengineering 2016; 4(2): 9-25 21
of water energy dynamics [67]. Tropical studies have
correlated the importance of moisture and related factors to
species richness [68]. Similarly changes in the gradient of
species richness pattern have also been commonly explained
by factors such as climate productivity and other energy
related factors [69]; while Lomolino [70] has pointed out that
many components of climate and local environments such as
temperature, precipitation, seasonality and disturbance
regimes vary along species amplitudinal gradient which
ultimately create variation in their richness. A re-analysis of
data by Pausas and Austin [71] also suggests that
environmental parameters (especially rainfall) may also be
involved in determining species richness. This corroborates
Currie [72] and O'Brien [73, 74]. Richerson & Lum [75] found
a positive logarithmic relationship between Californian
plant-species richness and rainfall, the environmental variable
that accounted for the greatest variance in species richness in
their study. Knight et al. [76] and O'Brien [73] found positive
correlation between mean annual rainfall and woody species
richness in southern Africa. Gentry [77] found an increase in
neotropical plant species richness with precipitation up to
about 4000mm where species richness reaches an asymeptote;
however, he also noted that there were differences that could
be explained by seasonality of rainfall and soil nutrients.
Spatial variation might be due to the soil type and its
composition, elevation of sites, moisture contents of soil,
nature of disturbance, human interference and isolation of
study site populated regions [78]. Maximum density in wet
season was presented by M. esculenta and A. compressus
showed highest density in dry season. In general, density of
herbaceous species varied at both site. These changes are
attributed to changes in microclimate among other factors.
Similar changes were also reported by llorkar and Kharti [79].
Studies conducted by Abdullah et al. [80] mentioned climatic
factors as a reason to influence the distribution of species in
certain habitats. Species richness and frequency of occurrence
is further supported by the fact that landscapes are never static,
their elements are in permanent temporal and spatial flux [81,
82].Comparatively, O. corymbosa and A. africana commonly
showed maximum importance in wet season and A.
compressus in dry season at the TDU site. However, this can
be correlated with the assertion that the dominance of certain
species during a particular period could be as the other
co-dominant species do not reach maturity to complete their
life cycle [55]. Also studies on analysis of vegetation have
been carried out particularly in terms of phytosociology,
species diversity, richness and abundance across different
physiognomic unit in various parts of the world [83, 84-86,
87].This agrees with the postulation that the tropical rainforest
is normally made up of intricate mixture of plants belonging to
different plant families, genera and species.
The TDU site when compared based on hydrological
seasonal variation, species similarity index was observed to
show similar vegetation complex in terms of species
composition with a maximum similarity of 56% despite the
difference in species richness and abundance due to seasonal
variation. During the wet season a high number of species
occurred at the site, where as a declined trend was observed
when the dry season approached resulting to dissimilarity
(67%) among the tree species community structure. This is
related to differences in micro-climatic conditions and
anthropogenic impacts influencing growth of different species
at the site. A high degree of different dissimilarity among
species community has also been reported by Verms et al.
[88]. A considerable similarity was depicted in the herbaceous
and shrubby community structure with an index similarity of
56% and 62% respectively.
5. Potential and Associated Environmental
Impacts and Mitigation Measures
5.1. Potential Impact
The Thermal Desorption Unit (TDU) is imminent of
environmental perturbation as it may affect the environmental
segments of the surrounding. This is often attributed to
emission of large particulate matters and dangerous gases
which disperse over long distance causing ailment and
disorder to plant and other living organisms including
inhabitants of surrounding communities. However, the direct
and indirect impact may result to:
1. Possible deposition of suspended particulate matter
(SPM) on the flora composition of the project site and
surrounding communities.
2. Because of the deposition on plant the photosynthetic
process will be very badly affected resulting to
chlorosis and other associated physiological stress.
3. This could also become a barrier to the transport and
translocation of materials from the leaf to various parts
of the plant species.
4. These particles may also penetrate inside the plants
through leaves and branches thereby creating
imbalance and localization of minerals, micro and
major nutrients in the plants. All these affect the plant
growth very badly.
5. Possible continuous and long term deposition of SPM
may also cause the fertile and forest land to be
unproductive for plants and farming around the
surrounding communities.
6. The vegetation composition and structure may also be
affected due to corrosive reactions of acid rain and
precipitation.
7. The effect of a new activity on the area causing
disturbance and interference in the host communities
way of life.
8. Loss of habitat of many species.
9. Damages and general loss of biodiversity.
10. Thermal pollution could cause direct thermal shocks,
changes in dissolved oxygen and redistribution of
organisms in the local community.
11. Some of the plants can be killed bysudden temperature
changes that are beyond the tolerance limit of their
metabolic systems.
22 Nsirim L. Edwin-Wosu and Victor N. Sunday: A Baseline Environmental Impact Assessment (EIA) of Proposed Sit for Thermal
Desorption Unit (TDU) Waste Management Project in Rivers State, Nigeria: Floristic Composition Approach
5.2. Mitigation Measures
1. Fire outbreak in the area and surrounding vegetation
shall be prevented.
2. Organizations shall institute a contingency plan (and
should there be an existing one, need to be enforced
effectively) which addresses the identification and
protection of vulnerable and sensitive areas including the
surrounding vegetation.
3. Vegetation clearing shall be minimized and limited to
only required area (within the limit of the acquired land
as this may influence negatively the existence of
biodiversity of the area). Thus there is need for the
creation and development of a buffer zone for flora that
may have been displaced or lost their natural habitation
as a result of such project.
4. Areas not directly used for the project should have the
following mitigative measures viz.
� Vegetation will not be cut back to bare soil and should be
left to decay naturally.
� Overhanging plant species will not be cut back
� There should be no chopping or removal of plant species
of any kind and care should be taken to avoid damage to
root zones in project operations.
� Branch removal may be necessary for the project site but
this will be performed so as not to adversely affect the
growth characteristics of the mangrove vegetation.
� Exploitation of forest resources by both contractors and
staff of organization shall be prohibited. The
management shall provide employment for the host
communities by ensuring that majority of the unskilled
and semi-skilled labour needed for the project execution
shall be obtained from the surrounding communities.
� Routine inspection of project location and facilities shall
be maintained to ensure facility integrity and guide
against facility degeneration / collapse and pollutant
release on vegetations of the area.
5. There is need for the management to institute an
integrated conservation and development strategy
considered as a valuable land use option to reconcile
development and conservation objectives in rural areas for
a profitable exploitation of resources by local residents.
The application of such a concept in communal lands
outside protected areas has to meet two main requirements to
ensure a sustainable implementation. First, it must rely on the
support of local communities, through their active
involvement in biodiversity management operations and
hence decision making. Secondly, it requires precise and
regular information on flora abundance and trends to ensure
that management schemes are adaptive and allow for a
sustainable use of biodiversity populations. Consequently, the
implementation of a community-based conservation
programme needs the development of a monitoring method
that respects a compromise between its applicability by local
communities, both in terms of finance and skills, and the
reliability of results.
6. Conclusion
Understanding of vegetation structure and component of
ecosystem is important in several environmental baseline and
impact studies. Such investigation of vegetation is often
carried out in order to establish the degree of imminent
environmental hazard and recovery of such envisaged
ecological hazard as could be the case with TDU Waste
management project. In the event of uncontrolled and
accidental discharge of SPM, a preconceived knowledge of
the vegetation is helpful in the determination of long and
short-term effects of such emission on all major ecological
habitats of the affected area. It will also give adequate support
and facilitate the identification and assessment of associated
environmental problems such as socio-economic and health
implications of ecological predicament that many arise as a
result of the incident.
References
[1] Nwafor, J. C. Environmental Impact Assessment for sustainable development: The Nigerian perspective. EDPCA Publications Enugu, 2006.
[2] AUS AID. Baseline Study Guidelines. Australian AID Knowledge Warehouse, 2003.
[3] Collins, R. Ecological monitoring and biodiversity surveys at the Smithsonian Tropical Research Institute Boscas Deltoro Research Station. Caribean J. Sci. 41(3): 367 – 373. 2005.
[4] Minter, B. A, and Collins, J. P. Ecological ethics: building a new tool kit for ecologist and biodiversity managers. Conserve. Biol. 1803 – 1812. 2005.
[5] Edwin-Wosu, N. L. Eco-taxonomic Baseline Assessment of vegetation of Pirigbene –Obama – Agip oil field further development project in Southern Ijaw Local Government Area, Bayelsa State. Final Draft Report, NAOC / Sydney Gate-way (Nig) Limited. October, 2010.
[6] U. S. Environmental Protection Agency. Draft Guidance for Implementing Thermal Desorption Remedies at Superfund Sites. Memorandum from John J. Smith, Chief Design and Construction Management Branch. 1994a.
[7] U. S. Environmental Protection Agency. Vendor Information System for Innovative Treatment Technologies (VISITT Database), Version 4.0.Office of Solid Waste and Emergency Response, Washington, DC. 1994b.
[8] U. S. Environmental Protection Agency. Tech Trends: Thermal Desorption at Gas Plants. EPA-542-N-95-003.1995.
[9] U. S. Environmental Protection Agency. Technology Fact Sheet: A Citizen’s Guide to Thermal Desorption. EPA 542-F-96-005.Technology Innovation Office. 1996.
[10] U. S. Environmental Protection Agency. Engineering Bulletin: Thermal Desorption Treatment. EPA/540/2-91/008.Superfund. 1991.
[11] Whitmore, T. C. An Introduction to Tropical Rainforest: Oxford University Press Inc., New York, 282p. 1998.

American Journal of Bioscience and Bioengineering 2016; 4(2): 9-25 23
[12] Myers, N. A.; Russell, C.; Mittermelert, G.; Mittermelert, A. B.; Gustavo, D.F. and Jennifer, K. Biodiversity hot spots for conservation priorities. Nature, 24: 853 – 858. 2000.
[13] El-Khouly, A. A. L. Effect of human activities on vegetation in Siwa Oasis. International Conference on Water Resources and Arid Environment, 112: 115 -143. 2004.
[14] Hopkin, B. Vegetation of the Olakemeji Forest Reserve, Nigeria J. Eco. 56:97-115. 1968.
[15] SAF. Forest Cover types of North America. Washington D. C. Society of American Foresters. 1954.
[16] Edwin-Wosu, N. L. Eco-taxonomic Post-impact Assessment of vegetation of GOI lake oil spillage (EIA SHEWING) – Vegetation survey claim of Goi Community against Shell Petroleum Development Company (SPDC) in Gokana Local Govt. Area. 2011.
[17] Edwin-Wosu, N. L. Environmental Evaluation Study of Vegetation of the Disused Imo River, Nkpoku, Obigbo North, Ebubu Pipeline (ROW) in Rivers State / and Abia State, February, 2012. MACPHED / SPDC. Wet Season Draft Report. 2012a.
[18] Edwin-Wosu, N. L. EIA Baseline Study of Vegetation / Wildlife for the OBIAFU / OBRIKOM- Indorama Eleme Fertilizer Company Limited (IEFCL) Gas Delivery Pipeline Project, August 2012.Environmental & Chemical Services Limited / IDORAMA ELEME PETROCHEMICAL COMPANY LIMITED. 2012b.
[19] Kinako, P. D. S. Ecology and conservation of natural resources. Belk publishers, Port Harcourt. Pp145. 1989.
[20] Burkill, H. M. Useful Plant of West Tropical Africa, Vol. 1 (2ed.). Royal Botanic Garden, Kew, London. 1985.
[21] Burkill, H. M. Useful Plant of West Tropical Africa, Vol. 2 (2ed.). Royal Botanic Garden, Kew, London. 1994.
[22] Burkill, H. M. Useful Plant of West Tropical Africa, Vol. 3 (2ed.). Royal Botanic Garden, Kew, London. 1995.
[23] Burkill, H. M. Useful Plant of West Tropical Africa, Vol. 4 (2ed.). Royal Botanic Garden, Kew, London. 1997.
[24] Burkill, H. M. Useful Plant of West Tropical Africa, Vol. 5 (2ed.). Royal Botanic Garden, Kew, London. 2000.
[25] Hutchinson, J.; Dalziel, J. M. Flora of West Tropical Africa, Vol. 1. (Part 1.) Crown Agents for oversea government and administrations, Millbank London. 1954.
[26] Hutchinson, J.; Dalziel, J. M. Flora of West Tropical Africa, Vol. 1. (Part 2.) Crown Agents for oversea government and administrations, Millbank London. 1958.
[27] Hutchinson, J.; Dalziel, J. M. Flora of West Tropical Africa, Vol. 2. Crown Agents for oversea government and administrations, Millbank London. 1963.
[28] Hutchinson, J.; Dalziel, J. M. Flora of West Tropical Africa, Vol. 3. (Part 1) Crown Agents for oversea government and administrations, Millbank London. 1968.
[29] Hutchinson, J.; Dalziel, J. M. Flora of West Tropical Africa, Vol. 3. (Part 2.) Crown Agents for oversea government and administrations, Millbank London. 1972.
[30] Keay, R. W. J. Trees of Nigeria. Clarendon Press. 1989.
[31] Austin, M. P. and Greg-smith, P. The application of quantitative method to vegetation survey J.Ecol. 56:851-884. 1968.
[32] Kershaw, K. A. Quantitative and Dynamic Plant Ecology. 2nd Edition, Edward Arnold, London pp 305, 1975.
[33] Pryor, L. D. Australian endangered species. Eucalyptus Australian National Parks and Wildlife Services Special Publication (5) Canberra 139 pp. 1981.
[34] Shukla, S. R. and Chandel, S. P. Plant Ecology. 4th Edn. S. Chandel and Co. Ramnagar, New Delhi – 110055.197pp. 1980.
[35] Bonham, C. D. Frequency: Measurement of Terrestrial vegetation, John Wiley and Sons Inc New York, NY pp 90-96. 1989.
[36] Shannon, C. E. and Wienner, W. The mathematical theory of communications. Urbana, Illinois: University of Illinois Press. 1949.
[37] Misra, R. Ecology Workbook. Oxford & IBH Publishing Co. Pvt Ltd., New Delhi. 244 pp. 1968.
[38] Curtis, J. T. and Cottam, G. Plant Ecology Work Book: Laboratory field reference manual. Bugess Publishing Co., Minnesota. 193 pp. 1956.
[39] Sorensen, T. A. A method of establishing groups of equal amplitude in plant sociology based on similarity of species content. K. Danake Videnk Biol. Skr., 5: 1-34. 1948.
[40] Mohammed, A. and Al-Amin, M. Regeneration status in a proposed biodiversity conservation area of Bangladesh. Proceeding Pakistan Academy Science: 44(3): 165-172. 2007.
[41] Cubizolle, H. Tourman, A. Argant, J. Porteret, J. Oberlin, C. and Serieyssol, K. Organs of Europe biodiversity: palaeo-geographic signification of peat inception during the Holocene in the granite Eastern Massif Central (France). Landscape Ecology, 7: 211-227. 2003.
[42] Ehrlich, P. R. and Wilson, E. O. Biodiversity studies: science and policy. Science and policy. Science, 253: 758 – 762. 1991.
[43] Tilman, D. and Downing, J.A. Biodiversity and stability in grasslands. Nature, 367: 363 – 365. 1994.
[44] Naeem, S.; Thomson, L. J.; Lawler, S. P.; Lawton, J. H. and Woodfin, R. M. Declining biodiversity can alter the performance of ecosystem. Nature, 368: 734 – 737. 1994.
[45] Naeem, S.; Thomson, L. J.; Lawler, S. P.; Lawton, J. H. and Woodfin, R. M. Empirical evidence that declining species diversity may alter performance of terrestrial ecosystems. Proc. R. Soc. Land. B. 347: 249 – 262. 1995.
[46] Kareiva, P. Diversity begets productivity. Nature, 368: 686 – 689. 1994.
[47] Kareiva, P. Diversity and sustainability on the prairie. Nature, 379: 673 – 674. 1996.
[48] Tilman, D. Biodiversity: population versus ecosystem stability. Ecology, 77: 350-363. 1996.
[49] Tilman, D.). Plant strategies and the structure and dynamics of plant communities. University Press, Princeton, NJ. 1988.
[50] Wisheu, I. C. and Keddy, P. A. Species richness-standing crop relationship along four lakeshore gradients: constraint on the general model. Canadian Journal of Botany, 67: 1609 – 1617. 1989.

24 Nsirim L. Edwin-Wosu and Victor N. Sunday: A Baseline Environmental Impact Assessment (EIA) of Proposed Sit for Thermal
Desorption Unit (TDU) Waste Management Project in Rivers State, Nigeria: Floristic Composition Approach
[51] Moore, D. R. J. and Keddy, P. A. The relationship between species richness and standing crop in wetlands: the importance of scale. Vegetation, 79: 99 – 106. 1989.
[52] Austin, M.P. The potential contribution of vegetation ecology to biodiversity research. Ecography, 22: 465 – 484.1999.
[53] Chen, J.; Shiyomi, M. and Yamamura, Y. Frequency distribution models for spatial patterns of vegetation abundance. Ecol. Mod., 211: 403 – 410. 2008.
[54] Kukshal, S.; Nautiyal, B. P.; Anthwal, A.; Sharma, A. and Bhat, A. B. Phytosociological investigation and lifeform pattern of grazing lands under pine canopy in temperate zone, Northwest, Himalaya, India. Res. J. Bot., 4: 55 – 69. 2009.
[55] Shameen, S. A.; Irfana, N. K. and Bhat, G. A. Comparative assessment of edaphic features and herbaceous diversity in lower Dachigham national park, Kashmir, Himalaya. Journal of Ecology and the Natural Environment, 3(6):196 – 204. 2011.
[56] Nanette, M. Deacon, L. and Robinson, C. Greater nitrogen and / or phosphorus availability increase plant species cover and diversity at a high arctic polar semi-desert. Polar Biol. 30: 559 – 570. 2007.
[57] Mishra, D.; Mishra, T. K. and Banerjee, S. K. Comparative phytosociological and soil physic-chemical aspects between managed and unmanaged lateritic land. Ann. For., 5(1): 16 – 25. 1997.
[58] Bliss, L. C. Rosine and lipid contents in alpine Tundra plants. Ecology, 43: 753 -757. 1962.
[59] Turner, I. M. and Corlett, R. T. The conservation value of small, isolated fragments of lowland tropical rain forest. Trends in Ecology and Evolution, 11: 330 – 333. 1996.
[60] Whitmore, T. C. Tropical rainforest disturbance, disappearance, and species loss. In Tropical Forest Remnants; W.F. Laurance and R. O. Bierregaard (Eds.) Chicago: University of Chicago Press, pp. 3 -12. 1997.
[61] Nepstad, D. C.; Versssimo, A.; Alencar, A.; Nobres, C.; Lima, E.; Lefebre, P.; Schlessinger, P.; Potter, C.; Moutinho, P.; Mendoza, E.; Cochrane, M. and Brooks, V. Large – scale impoverishment Amazonian forest by logging and fire. Nature, 398: 505 – 508. 1999.
[62] Huston, M. A. Biological diversity. The coexistence of species on changing landscapes. Cambridge University Press, Cambridge. 1994.
[63] Cornell, H. V. and Lawton, J. H. Species interactions, local and regional processes, and limits to the richness of ecological communities: a theoretical perspective. Journal of Animal Ecology, 61: 1-12. 1992.
[64] Austin, M. P. and Gaywood, M. Current problems of environmental gradients and species response curves in relation to continuum theory. Journal of vegetation science, 5: 473 – 482.1994.
[65] Pausas, J. G. Species richness pattern in the understorey of Pyrenean. Pinus sylvestris forest. J. Veg. Sci. 5: 517 – 524. 1994.
[66] Austin, M. P. Pausas, J. G. and Nicholis, A. O. Patterns of tree species richness in relaltion to environment in south-easthern New South Wales. Australian Journal of Ecology, 21: 154 – 164. 1996.
[67] O’ Brien, E. M.; Whittaker, R. J. and Field, R. Climate and woody plant diversity in Southern Africa, relationships at species, genus and family levels. Ecography, 21, 495 – 509. 1988.
[68] Brown, J. H. Species diversity. Analytical biogeography (Eds.) A. A. Myers and P. S. Giller. Chapman and Hall, London. 1988.
[69] Grytness, J. A.; Birks, H. J. B. and Peglar, S. M. Plant species richness in Fennoscandia; evaluating relative importance of climate and history. Nordic Journal Botany 19, 489 – 503. 1999.
[70] Lomolino, M. V. Elevation gradient of species richness, historical and prospective views. Global Ecology and Biogeography, 10, 3 – 13. 2001.
[71] Pausas, J. G. and Austin, M. P. Patterns of plant species richness in relation to different environments: An appraisal. Journal of Vegetation Science, 12: 153 – 166. 2001.
[72] Currie, D. J. Energy and large scale patterns of animal and plant species richness. Am. Nat. 137: 27 – 49. 1991.
[73] O’Brien, E. M. Climatic gradient in woody plant species richness: towards an explanation based on an analysis of southern Africa’s woody flora. J. Biogeogr. 20: 181 – 198. 1993.
[74] O’ Brien, E. M. Water-energy dynamics, climate, and prediction of woody plant species richness: an interim general model. J. Biogeography, 25: 379 – 398. 1998.
[75] Richerson, P. J. and Lum, K. L. Pattern of species diversity in California: relations to weather and topography. Am. Nat. 116: 504 – 536. 1980.
[76] Knight, R. S.; Crowe, T. M. and Siegfried, W. R. Distribution and species richness of tree in southern African. J. S. Afr. Bot. 48: 455 – 480. 1982.
[77] Gentry, A. H. Changes in plant community diversity and floristics composition on environmental and geographical gradients. Ann. Mo. Bot. Gard. 75: 1 -34. 1988.
[78] Alhassan, A. B.; Chiroma, A. M. and Kundiri A. M. Properties and classification of soils of Kajimaram Oasis of Northeast Nigeria. Int. j. Agric. Biol., 8: 256 - 261. 2006.
[79] Ilorkar, V. M. and Khartri, P. K. Phytosociological study of Navegaon National Park, Maharashtra. Ind. For., 129(3):377 – 387. 2003.
[80] Abdullah, M. B.; Sanusi, S. S.; Abdul S. D. and Sawa, F. B. J. An assessment of the herbaceous species vegetation of Yankari Game Reserve, Bauchi, Nigeria. Am-Eur. J. Agric. Environ. Sci., 6(1): 20 – 25. 2009.
[81] Stemier, N. C. and Koliler, N. Effect of land scape pattern on species richness, a modeling approach. Agriculture, Ecosystem and Environment 93: 353 – 361. 2003.
[82] Brown, J. H. and Leband, D. N. Species imperilment and spatial patterns of development in the United States. Conservation Biology, 20(1): 239 – 244. 2006.
[83] Ganesh, T.; Ganesan, R.; Devy, M. S.; Davidar, R.; Bawa, K. S. Assessment of plant biodiversity at a mid-elevation evergreen forest of Kala Kad- Mundane Thura Tger Reserve, Western Ghats, India. Current Sciences 71: 379 – 392. 1996.

American Journal of Bioscience and Bioengineering 2016; 4(2): 9-25 25
[84] Pandey, S. K. and Shukla, R. P. Plant diversity and community patterns along the disturbance gradient in plantation forests of Sal (Shorearobusta Gaertn) Current Science 77: 814 – 818. 1999.
[85] Pandey, S. K. and Shukla, R. P. Plant diversity in managed Sal (Shorearobusta Gaertn) forest of Gorakhpur, India: species compositon, regeneration and conservation. Biodiversity and Conservation 12: 2295 – 2319. 2003.
[86] Pandey, S. K. and Shukla, R. P. Plant community and diversity patterns within the forested landscape of north-eatern U. P. Indian Forester 131: 1217 – 1226. 2005.
[87] Tripathi, S. L. and Shukla, R. P. Effect of clipping and grazing on the various vegetational parameters of grass-land communities of Gorakhpur. Tropical Ecology 48: 61 – 70. 2007.
[88] Verma, A. E.; Kapoor, K. S.; Rawat, R. S.; Subramani, S. P. and Kumar, S. Analysis of plant diversity in degraded and plantation forests in Kunihar forest division of Himachal Pradesh. Ind. J. For., 28 (10): 11 – 16. 2005.


