A 40-100 MHz B-SCAN ULTRASOUND BACKSCATTER · PDF fileUltrasound in Medicine and Biology...
10
Pergamon l Original Contribution Ultrawund in Med. & Biol., Vol. 21, No. I, pp. 79-88. 1995 Copyright 0 1995 Elsevier Science Ltd Printed in the USA. All rights reserved 0301.5629195 $9.50 + .OO 0301-5629(94)00083-2 A 40-100 MHz B-SCAN ULTRASOUND BACKSCATTER MICROSCOPE FOR SKIN IMAGING DANIEL H. TURNBULL,+” BRIAN G. STARKOSKI,~ KASIAA. HARASIEWICZ,* JOHN L. SEMPLE,* LYNN FROM,~ ADITYA K. GUTA," DANIELN. SAUDER*" and F.STUART FOSTERS +Toronto-Bayview Regional Cancer Centre and Sunnybrook Health Science Centre, Department of Medical Biophysics, $University of Toronto, 2075 Bayview Avenue, Toronto, Ontario, Canada M4N 3M5, and the Departments of *Surgery and “Pathology, Women’s College Hospital, University of Toronto, and the Department of “Dermatology, Sunnybrook Health Science Centre, University of Toronto (Received 6 Jmuu~ 1994; in jnul fbrm 19 April 1994) Abstract-There is a growing interest in high resolution, subsurface imaging of cutaneous tissues using higher frequency ultrasound, and several commercial systems have been developed recently which operate at 20 MHz. Some of the possible applications of higher frequency skin imaging include tumour staging, boundary definition, and studies of the response of tumours to therapy, investigations of inflammatory skin conditions such as psoriasis and eczema, and basic studies of skin aging, sun damage and the effects of irritants. Investigation of these areas is quite new, and the role of ultrasound skin imaging is continuing to evolve. Lateral resolution in the 20 MHz imaging systems ranges from 200 to 300 pm, which limits imaging applications to cutaneous structures which are relatively large in size. In this paper, a real-time ultrasound backscatter microscope (UBM) for skin imaging is described which operates in the 40-100 MHz range, providing axial resolution between 17 and 30 pm and lateral resolution between 33 and 94 pm. This improvement in resolution over current skin ultrasound systems should prove useful in determining the margins of small skin lesions, and in obtaining more precise, in viva skin thickness measurements to characterize nonmalignant skin disease. Example images of normal skin, seborrhoeic keratosis and malig- nant melanoma illustrate the imaging potential of this system. Key Words: Ultrasound backscatter microscope, Ultrasound, High frequency, High resolution, Skin imaging, Normal skin, Seborrhoeic keratosis, Melanoma. INTRODUCTION The use of high resolution ultrasound imaging has re- cently attracted the attention of the dermatology com- munity. In part, the growing interest in this field can be attributed to the availability of several commercial imaging systems operating in the 20 to 30 MHz fre- quency range, and to the appearance of several review articles (Gropper et al. 1993; Perednia 1991) and a book (Altmeyer et al. 1992) which outline the princi- ples of high frequency ultrasound skin imaging, and review the clinical results from the commercial scan- ners. In fact, measurements of skin thickness were first made with ultrasound by Alexander and Miller (I 979), and ultrasound skin imaging has been employed and refined over a period of more than 10 years (Serup Address correspondence to: Daniel H. Tumbull (present address), Skirball Institute of Biomolecular Medicine. New York University Medical Center, 540 First Avenue, New York, NY 10016. USA. 1992). The development of in viva skin imaging sys- tems with resolution better than 100 pm is quite new, and is limited to a few experimental scanners which operate close to 50 MHz in frequency (El-Gamma1 et al. 1992; Foster et al. 1993; Stiller et al. 1993). The improved resolution of higher frequency imaging sys- tems should improve the diagnostic value of ultrasound in determining the lateral margins and depths of skin tumours, as well as improving the accuracy of skin thickness measurements to characterize nonmalignant skin disease and to investigate the effects of therapeutic agents. In this paper, we describe a high resolution, real- time ultrasound backscatter microscope (UBM) which has been developed for skin imaging. We use the termi- nology, UBM, to describe this imaging system to dif- ferentiate it from both lower frequency B-scan imaging systems and from scanning acoustic microscopy, a transmission imaging method which has been used to 79
Transcript of A 40-100 MHz B-SCAN ULTRASOUND BACKSCATTER · PDF fileUltrasound in Medicine and Biology...

Pergamon
l Original Contribution
Ultrawund in Med. & Biol., Vol. 21, No. I, pp. 79-88. 1995 Copyright 0 1995 Elsevier Science Ltd Printed in the USA. All rights reserved
0301.5629195 $9.50 + .OO
0301-5629(94)00083-2
A 40-100 MHz B-SCAN ULTRASOUND BACKSCATTER MICROSCOPE FOR SKIN IMAGING
DANIEL H. TURNBULL,+” BRIAN G. STARKOSKI,~ KASIA A. HARASIEWICZ,*
JOHN L. SEMPLE,* LYNN FROM,~ ADITYA K. GUTA," DANIEL N. SAUDER*" and F. STUART FOSTERS
+Toronto-Bayview Regional Cancer Centre and Sunnybrook Health Science Centre, Department of Medical Biophysics, $University of Toronto, 2075 Bayview Avenue, Toronto, Ontario, Canada M4N 3M5, and the
Departments of *Surgery and “Pathology, Women’s College Hospital, University of Toronto, and the Department of “Dermatology, Sunnybrook Health Science Centre, University of Toronto
(Received 6 Jmuu~ 1994; in jnul fbrm 19 April 1994)
Abstract-There is a growing interest in high resolution, subsurface imaging of cutaneous tissues using higher frequency ultrasound, and several commercial systems have been developed recently which operate at 20 MHz. Some of the possible applications of higher frequency skin imaging include tumour staging, boundary definition, and studies of the response of tumours to therapy, investigations of inflammatory skin conditions such as psoriasis and eczema, and basic studies of skin aging, sun damage and the effects of irritants. Investigation of these areas is quite new, and the role of ultrasound skin imaging is continuing to evolve. Lateral resolution in the 20 MHz imaging systems ranges from 200 to 300 pm, which limits imaging applications to cutaneous structures which are relatively large in size. In this paper, a real-time ultrasound backscatter microscope (UBM) for skin imaging is described which operates in the 40-100 MHz range, providing axial resolution between 17 and 30 pm and lateral resolution between 33 and 94 pm. This improvement in resolution over current skin ultrasound systems should prove useful in determining the margins of small skin lesions, and in obtaining more precise, in viva skin thickness measurements to characterize nonmalignant skin disease. Example images of normal skin, seborrhoeic keratosis and malig- nant melanoma illustrate the imaging potential of this system.
Key Words: Ultrasound backscatter microscope, Ultrasound, High frequency, High resolution, Skin imaging, Normal skin, Seborrhoeic keratosis, Melanoma.
INTRODUCTION
The use of high resolution ultrasound imaging has re- cently attracted the attention of the dermatology com- munity. In part, the growing interest in this field can be attributed to the availability of several commercial imaging systems operating in the 20 to 30 MHz fre- quency range, and to the appearance of several review articles (Gropper et al. 1993; Perednia 1991) and a book (Altmeyer et al. 1992) which outline the princi- ples of high frequency ultrasound skin imaging, and review the clinical results from the commercial scan- ners. In fact, measurements of skin thickness were first made with ultrasound by Alexander and Miller (I 979), and ultrasound skin imaging has been employed and refined over a period of more than 10 years (Serup
Address correspondence to: Daniel H. Tumbull (present address), Skirball Institute of Biomolecular Medicine. New York University Medical Center, 540 First Avenue, New York, NY 10016. USA.
1992). The development of in viva skin imaging sys- tems with resolution better than 100 pm is quite new, and is limited to a few experimental scanners which operate close to 50 MHz in frequency (El-Gamma1 et al. 1992; Foster et al. 1993; Stiller et al. 1993). The improved resolution of higher frequency imaging sys- tems should improve the diagnostic value of ultrasound in determining the lateral margins and depths of skin tumours, as well as improving the accuracy of skin thickness measurements to characterize nonmalignant skin disease and to investigate the effects of therapeutic agents.
In this paper, we describe a high resolution, real- time ultrasound backscatter microscope (UBM) which has been developed for skin imaging. We use the termi- nology, UBM, to describe this imaging system to dif- ferentiate it from both lower frequency B-scan imaging systems and from scanning acoustic microscopy, a transmission imaging method which has been used to
79

Ultrasound in Medicine and Biology Volume 2 I, Number 1, 1995
BEAM
Fig. I. Block diagram showing the main components and organization of the skin UBM system.
image thin sections of skin (Kolosov et al. 1987; Mat- thes et al. 1992). Three transducers, fabricated from a copolymer of polyvinylidene difluoride and trifluoro- ethylene (PVDF-TrFE), are used to cover the fre- quency range from 40 to 70 MHz. A higher frequency transducer fabricated from lead zirconate titanate (PZT), operating close to 100 MHz in frequency, is also described. The focusing properties, and the re- sulting measurements of resolution from these trans- ducers are described. Images of normal skin are pre- sented at different frequencies. Finally, images of sev- eral skin lesions are demonstrated, including two examples of malignant melanoma.
SYSTEM DESCRIPTION
Figure 1 is a block diagram showing the main com- ponents of the skin UBM. This UBM employs standard pulse-echo techniques to produce high resolution im- ages of skin using ultrasound frequencies between 40 and 100 MHz. Some differences between this system and a previous system developed by Sherar et al. (1989) are in the mechanical scan system, described below, which includes direct encoding of the trans- ducer position and the ability to collect volumetric image data as a series of two-dimensional (2D) images. The scan converter is more flexible and faster than the earlier version, allowing variable image size selection over a range from 2 to 8 mm. The image is produced by scanning a focused transducer over an 8 mm linear path. Coupling to the skin is provided by a 30 mm diameter acrylic cup, which is gently pressed against the skin around the region of interest and then filled with a viscous, hypoallergenic methyl cellulose solu- tion (I% Isopto Tears, Alcon Canada Inc., Missis- sauga, Ontario), chosen to minimize fluid leaking from the cup. The transducer is excited by a 200 to 400 V mono-cycle pulse produced by a high frequency pulse
generator (Model AVB2-C-OCIC for frequencies up to 60 MHz; Model AVB2-C for higher frequencies; Avtech Electrosystems, Ottawa, Ontario). A diode ex- pander (Model DEX-3, Matec Instruments, Hopkinton, MA) serves to eliminate low amplitude noise from the excitation pulse, and terminates the transmission line to the pulser during the receive mode of operation. The received signals are processed as described below, and passed through a custom scan converter which outputs the video images. Image capture is accom- plished using an optical disk recorder (Model TQ- 2023F, Panasonic Matsushita Electric Industrial Co. Ltd., Ibaraki Osaka, Japan), or through the Macintosh IIfx computer using a video frame grabber board (QuickView Studio QT, E-machines Inc., Beaverton, Oregon). The mechanical probe is mounted on an artic- ulated arm (Double Arm Model 303261-9015, Carl Zeiss Canada, Mississauga, Ontario) to allow the trans- ducer to be placed at any position on the body, and the entire scanner resides on a cart (MetroFlex, InterMetro Industries Corp., Wilkes-Barre, PA) which can be eas- ily transported from the laboratory to various clinics around the hospital (Fig. 2).
Trunsducer jiibrication Three of the skin UBM transducers were fabricated
from 10 pm thick copolymer of PVDF-TrFE (Ato-
Fig. 2. Photograph of the skin UBM system.

Skin imaging 0 D. H. TUKNBULL et al. 81
Table I. Measured characteristics of skin UBM transducers. Transducer 3 was excited with two different pulsers, resulting in two sets of characteristics. Transducer 4 is the high frequency PZT transducer.
Transducer Aperture
(mm) f-number
Nominal frequency
(MHz)
-6 dB bandwidth
(MHz)
Axial resolution
Wm)
Lateral resolution
(pm)
Depth of field
(mm)
I 4 2.5 40 23 30 94 I .7 2 3 2 SO 22 28 60 0.85 3a 3 1.5 62 41 20 35 0.39 3b 3 I.5 68 50 I7 33 0.35 4 I 3 92 38 21 45 I .o
them, King of Prussia, PA), spherically focused with a conductive epoxy backing as described by Foster et al. ( 1993). The frequency of each transducer is affected by the transducer material thickness, the aperture, the focal length, and the frequency of the monocycle exci- tation pulse. A variation in the operating frequency of the transducers, each of which was fabricated from the same thickness of copolymer, resulted from differences in aperture and focal length: a smaller aperture results in a transducer which is better matched to the 50 R pulsing and receiving electronics at a higher frequency, while a longer focal length results in more attenuation of the higher frequency components in the pulse, re- sulting in a lower operating frequency. It should be noted that cable length between the expander and trans- ducer is short (15 cm), so that tuning effects of this cable length and the cable from the expander to the limiter have a minor effect on the pulse characteristics (Lockwood et al. 1991a). For reference, the cable be- tween the expander and limiter was also 15 cm long. The frequency range covered by the polymer transduc- ers is from 40 to 70 MHz.
pulse and focusing characteristics of each transducer, described later in the paper.
Motion system
A fourth, higher frequency focused transducer was fabricated from a 25 pm thick layer of high density PZT (D3203, Motorola, Albuquerque, NM). The fabri- cation procedure used to produce this transducer is discussed in detail by Lockwood et al. (1994), so it will only be described briefly here. A bulk sample of PZT was lapped to 25 pm, after which a 100 ym thick layer of conductive epoxy was cast on the back surface of the PZT and allowed to cure. A 1 mm diameter chip was then cut from the block, gently heated and pressed into a spherically shaped well using a 6 mm diameter ball. When the composite material (PZT and conduc- tive epoxy) was cooled to room temperature, the spher- ical shape was maintained and the chip was built into a transducer with additional conductive epoxy backing material. Using this method, we have fabricated a lens- less, focused PZT transducer operating just below 100 MHz in frequency.
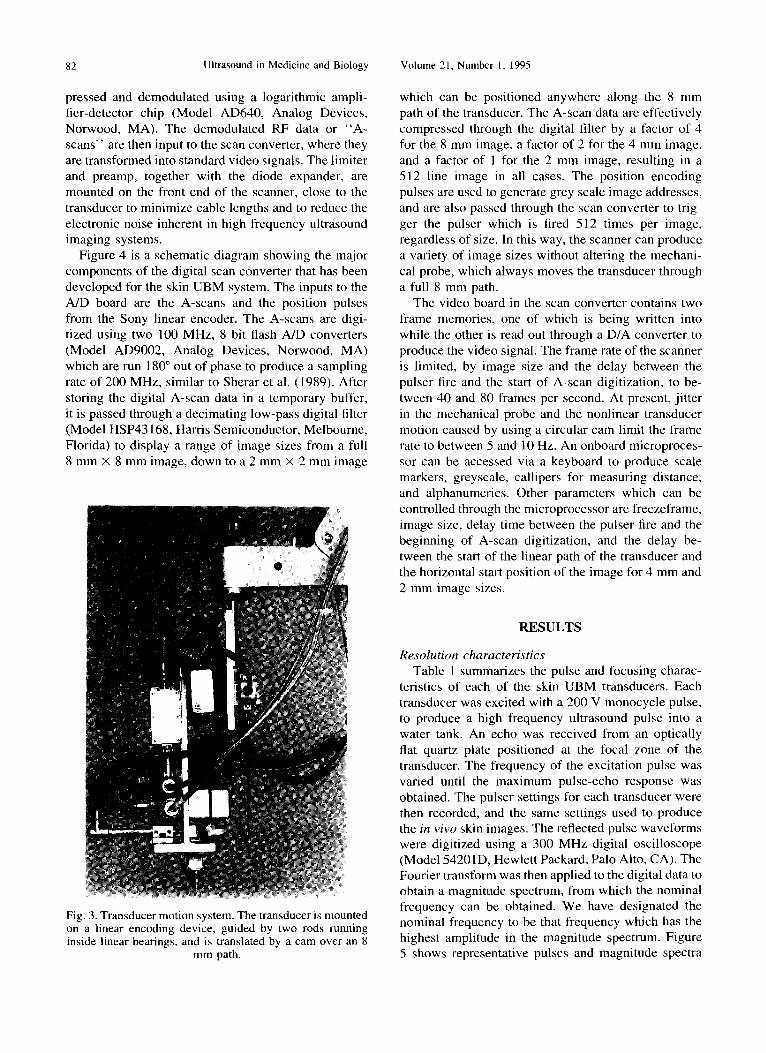
The transducer motion is under the control of a two- axis servo controller (Model DMC-720, Galil Motion Control Inc., Sunnyvale, CA). On the first axis, a DC servo motor turns a circular cam mounted to the motor spindle at a point offset 8 mm from the cam’s geometri- cal centre. The result is a linear motion over an 8 mm path length of the transducer, which is mounted to the shaft of a spring loaded linear encoder (DG 810-L probe and MD20A detector, Sony Magnescale, Tokyo, Japan). The encoder emits pulses every 4 pm, which are used to trigger the pulser and subsequent data ac- quisition. The transducer is guided along a linear path by two shafts which run inside small linear bearings incorporated into the transducer holder. The linear mo- tion of the transducer along the 8 mm path is repeated every 100-200 ms, resulting in an image frame rate of 5- 10 Hz. The second axis of the servo controller is connected to a small motorized motion table (Model CTC-512, Microkinetics Corp., Laguna Hills, CA) so that the mechanical probe can be moved in the direc- tion perpendicular to the scan plane. This second mo- tion stage has been synchronized with the Panasonic optical disk recorder to collect serial scans over a dis- tance of up to 25 mm. This allows rapid acquisition of serial images, and should allow for volumetric as- sessment of skin lesions (Pawlak et al. 1992; Stiller et al. 1993). Figure 3 provides a close-up view of the front end of the scanner and the components of the mechanical probe.
Receive signal processing and scan converter
The aperture and f-number (aperture diameter/focal length) for each of the four transducers described above are given in Table 1. Table 1 also includes the
The backscatter signals from the transducer are first passed through a radio frequency (RF) limiter (Model INSOB, Wiltron Instruments Ltd., Nepean, Ontario) to protect the receive circuitry from the high amplitude excitation pulse. The RF data are passed through a 30 dB preamplifier (Model AU-l 114, Miteq Inc., Haup- pauge, NY), processed through a custom designed time-gain compensator (TGC) circuit, and then com-
82 Ultrasound in Medicine and Biology Volume 2 1, Number I, 1995
pressed and demodulated using a logarithmic ampli- fier-detector chip (Model AD640, Analog Devices, Norwood, MA). The demodulated RF data or “A- scans” are then input to the scan converter, where they are transformed into standard video signals. The limiter and preamp, together with the diode expander, are mounted on the front end of the scanner, close to the transducer to minimize cable lengths and to reduce the electronic noise inherent in high frequency ultrasound imaging systems.
Figure 4 is a schematic diagram showing the major components of the digital scan converter that has been developed for the skin UBM system. The inputs to the A/D board are the A-scans and the position pulses from the Sony linear encoder. The A-scans are digi- tized using two 100 MHz, 8 bit flash A/D converters (Model AD9002, Analog Devices, Norwood, MA) which are run 180” out of phase to produce a sampling rate of 200 MHz, similar to Sherar et al. (1989). After storing the digital A-scan data in a temporary buffer, it is passed through a decimating low-pass digital filter (Model HSP43 168, Harris Semiconductor, Melbourne, Florida) to display a range of image sizes from a full 8 mm X 8 mm image, down to a 2 mm x 2 mm image
Fig Oil
ins
,. 3. Transducer motion system. The transducer is mounted a linear encoding device, guided by two rods running
ide linear bearings, and is translated by a cam over an 8 mm path.
which can be positioned anywhere along the 8 mm path of the transducer. The A-scan data are effectively compressed through the digital filter by a factor of 4 for the 8 mm image, a factor of 2 for the 4 mm image, and a factor of 1 for the 2 mm image, resulting in a 5 12 line image in all cases. The position encoding pulses are used to generate grey scale image addresses, and are also passed through the scan converter to trig- ger the pulser which is fired 512 times per image, regardless of size. In this way, the scanner can produce a variety of image sizes without altering the mechani- cal probe, which always moves the transducer through a full 8 mm path.
The video board in the scan converter contains two frame memories, one of which is being written into while the other is read out through a D/A converter to produce the video signal. The frame rate of the scanner is limited, by image size and the delay between the pulser fire and the start of A-scan digitization, to be- tween 40 and 80 frames per second. At present, jitter in the mechanical probe and the nonlinear transducer motion caused by using a circular cam limit the frame rate to between 5 and IO Hz. An onboard microproces- sor can be accessed via a keyboard to produce scale markers, greyscale, callipers for measuring distance, and alphanumerics. Other parameters which can be controlled through the microprocessor are freezeframe, image size, delay time between the pulser fire and the beginning of A-scan digitization, and the delay be- tween the start of the linear path of the transducer and the horizontal start position of the image for 4 mm and 2 mm image sizes.
RESULTS
Resolution churucteristics
Table 1 summarizes the pulse and focusing charac- teristics of each of the skin UBM transducers. Each transducer was excited with a 200 V monocycle pulse, to produce a high frequency ultrasound pulse into a water tank. An echo was received from an optically flat quartz plate positioned at the focal zone of the transducer. The frequency of the excitation pulse was varied until the maximum pulse-echo response was obtained. The pulser settings for each transducer were then recorded, and the same settings used to produce the in vivo skin images. The reflected pulse waveforms were digitized using a 300 MHz digital oscilloscope (Model 54201D, Hewlett Packard, Palo Alto, CA). The Fourier transform was then applied to the digital data to obtain a magnitude spectrum, from which the nominal frequency can be obtained. We have designated the nominal frequency to be that frequency which has the highest amplitude in the magnitude spectrum. Figure 5 shows representative pulses and magnitude spectra

Skin imaging 0 D. H. TURNBULL er al 83
A/D BOARD I VIDEO BOARD
A-SCAN 4
4---+--b I
i
- VtDEO T
POSlTlON dUMEAIC
GRAY SCALE GRAPHICS )m
Fig. 4. Block diagram of the scan converter.
from three transducers with nominal frequencies of 40 MHz (Fig. 5a), 62 MHz (Fig. 5b) and 92 MHz (Fig. 5~). The bandwidth of each transducer was measured as the full width at half maximum (FWHM) of the magnitude spectrum. The nominal frequency and band- width of each of the skin UBM transducers is included in Table 1. Note that there are two sets of characteris- tics shown for transducer 3, which was operated at either 62 MHz using the lower frequency pulser (Av- tech AVB2-C-OCIC), or at 68 MHz using the higher
frequency pulser (Avtech AVB2-C). Transducer 4 in Table 1 is the high frequency (92 MHz) PZT trans- ducer.
Resolution of the skin UBM system was measured in several ways. Axial resolution can be measured from the width of the pulses, such as those shown in Fig. 5, according to the formula:
Axial resolution
= (pulse width) X (speed of sound)/2 (1)
Fig. 5. Pulse-echo responses and magnitude spectra of three transducers. Nominal (peak) frequencies: (a) 40 MHz; (b) 62 MHz; (c) 92 MHz (PZT transducer).

84 Ultrasound in Medicine and Biology
DISTANCE (pm)
Fig. 6. Lateral line responses of the 40 and 62 MHz transduc- ers, measured by scanning the transducer in the lateral direc-
tion across a 20 pm diameter glass fibre.
where the speed of sound in water can be taken to be
1.5 mm/ps, and the factor of two is included because
the measured pulse is a two-way response. The axial resolution of our system, measured according to eqn
(1) and the -6 dB pulse width, ranges from 17 pm at 68 MHz to 30 pm at 40 MHz. Note that the decreased bandwidth of the PZT transducer results in a slightly reduced axial resolution compared to copolymer trans- ducer 3. The resolution shown in Table 1 may be some- what different than the resolution that can be achieved in the skin images, where contrast between tissues can be low. However eqn (l), using the -6 dB pulse width, is the most widely accepted measure of axial resolution and provides a quantitative measure by which different transducers can be compared.
The lateral resolution of the skin UBM transducers was estimated in two ways. Each transducer was scanned, in the lateral direction, across a 20 pm diame- ter glass fibre placed at the focal zone of the transducer. The resolution of the scanning micrometer was -C 5 pm. The amplitude of the received signal was then plotted as a function of position, as shown in Fig. 6 for the 40 MHz and the 62 MHz transducers. The lateral resolution given in Table 1 is the FWHM of the response, which is in good agreement with the theoretical beam width, X(Foca1 Distance)/(Aperture Diameter), in all cases. Another indication of lateral resolution was obtained by imaging a resolution phan- tom, consisting of six 20 pm diameter glass fibres having centre-to-centre spacings of 500 pm, 400 pm, 300 pm, 200 pm, 100 pm and 50 pm. Figure 7 shows images of the resolution phantom made with the 40 MHz transducer (Fig. 7a) and the 62 MHz transducer (Fig. 7b). The improved resolution with the higher frequency transducer is obvious, the 50 pm spaced fibres being clearly resolved with the 62 MHz trans- ducer.
In a B-scan ultrasound imaging system using a sin-
Volume 21, Number 1, 1995
gle focused transducer, lateral resolution must be bal- anced against the depth of field of the transducer, which defines the useful imaging range. A commonly used measure of depth of field (DOF) is defined at half maximum intensity by the following equation (Hunt et al. 1983):
DOF = 7.1X(f-number)2. (2)
The DOF of each of the skin UBM transducers is included in Table 1. The compromise between im- proved lateral resolution and decreased DOF using a focused transducer is highlighted by comparing trans- ducer 3 and transducer 4. The high resolution of the strongly focused transducer 3 is achieved at the cost of very limited depth of field. Transducer 4, on the
(4
Fig. 7. Images of a resolution phantom consisting of 20 pm diameter glass fibres with a spacing between fibres ranging from 50 pm to 500 ym: (a) 4 mm x 4 mm, 40 MHz image, callipers measure a distance of 96 pm; (b) 2 mm X 2 mm, 62 MHz image, callipers measure a distance of 48 pm. The smallest scale markers, on the right side of each image, are
separated by 100 pm.

Skin imaging l D. H. TURNBULL et ul. 85
other hand, has a lateral resolution of 45 pm even in
a weakly focused transducer (f/3), with more than twice the depth of field transducer 3. We have included the 92 MHz PZT transducer in this study to emphasize the different strategies that may be taken to improve resolution in UBM. The high inherent sensitivity of piezoceramic materials, and the ability to fabricate high frequency focused transducers, make the use of PZT transducers in UBM an attractive alternative to traditional copolymer transducers.
In vivo skin images Figure 8 shows examples of 4 mm X 4 mm images
of normal palm skin made at several frequencies, from 40 to 68 MHz. With the 40 MHz transducer, the entire skin thickness can be visualized and a blood vessel (arrow) in the lower dermis can be imaged (Fig. 8a). The high scattering power of blood in this frequency range (Lockwood et al. 1991 b) is evident from the signal level within the vessel. At 62 MHz (Fig. 8b) and 68 MHz (Fig. SC), the decrease in penetration in the skin is marked, but two distinct layers in the epider- mis are clearly visualized. The epidermis on the palm of the hand is much thicker than in other parts of the body. The epidermal layers demonstrated by the skin UBM appear to correlate with the most superficial epi- dermal layer, the stratum comeum, which consists of denucleated comified cells, and the underlying stratum granulosum extending down to the basal cell layer which separates the epidermis and dermis.
Figure 9 shows a similar comparison between a 40 MHz, 8 mm X 8 mm image of normal forearm skin (Fig. 9a), and a 92 MHz, 4 mm X 4 mm image of the same region of skin (Fig. 9b). The use of the higher frequency transducer allows a more detailed examina- tion of the epidermis and upper dermis, whereas the lower frequency transducer can be used to image the entire thickness of the dermis, down into the subcuta- neous tissues. It is interesting to note the appearance at 92 MHz of two hypoechoic structures in the upper dermis, which may correspond to superficial sweat glands. The penetration in skin at 92 MHz is approxi- mately 1 mm (Fig. 9b) compared to the 68 MHz copol- ymer transducer which produced penetration in the same skin of less than 0.5 mm (data not shown), indi- cating that the lack of penetration when using the fl 1.5 copolymer transducer is due to the sensitivity and focusing properties of the transducer, rather than the frequency. This point can be understood from the lim- ited depth of field of the copolymer transducer (Trans- ducer 3 in Table 1). It is therefore evident that in some
instances, penetration may actually be increased by
improving transducer sensitivity, and increasing both
thef-number and the frequency of the transducer. An
alternative strategy has recently been reported, which
(4
Fig. 8. 4 mm X 4 mm images of normal palm skin: (a) 40 MHz; (b) 62 MHz; (c) 68 MHz. At 40 MHz the epidermis (E), dermis (D) and subcutaneous layers (S) are shown, as well as a blood vessel in the lower dermis (arrow). At the higher frequencies, the epidermis is resolved into two layers, most likely the stratum comeum (SC) and the stratum granu- losum (SG). The smallest scale markers, on the right side
of each image, are separated by 100 ,um.

86 Ultrasound in Medicine and Biology Volume 2 1, Number 1, 1995
04
Fig. 9. (a) 8 mm X 8 mm, 40 MHz image of normal forearm skin, demonstrating the epidermis (E), dermis (D) and subcu- taneous tissue (S); (b) 4 mm x 4 mm image of the same forearm skin made with a higher frequency (92 MHz) PZT transducer. The hypoechoic structures in the upper dermis may correspond to superficial sweat glands (arrows). The smallest scale markers, on the right side of each image, are
separated by 100 pm.
involves scanning a highly focused transducer in both the lateral and axial directions (Passmann et al. 1993). In this approach resolution is improved, but image frame rate is low.
Figure 10a shows the 40 MHz, 8 mm X 8 mm image of a (benign) pigmented seborrhoeic keratosis, while Fig. lob shows the corresponding histological section, stained with Haematoxylin and Eosin (H & E). In this, and all subsequent histological samples, the tissue was fixed in buffered formalin, embedded in paraffin, and sectioned. Comparisons were made between central sections, ultrasonic and histologic, through each lesion. The seborrhoeic keratosis shown in Fig. 10 was charac- terized by a very- strong entry echo at the skin surface,
probably due to the thickened keratin layer associated with these tumours. In addition, two shadows in the UBM image (arrows) correlate well with the location of keratin deposits on the histological section (Fig. lob). Clinical examination of this pigmented sebor- rhoeic keratosis was inconclusive as to whether it was benign or a nodular melanoma. The UBM image shows clearly that the lesion is quite superficial with little or no penetration into the dermis.
Figure 1 I a shows the 50 MHz image of a melanoma which measured more than a centimetre in diameter. The decreased backscatter level in the melanoma com- pared to the surrounding dermis is consistent with 20 MHz images of melanoma (Berson et al. 1992; Harland et al. 1993). The depth of this tumour was determined histologically to be 0.83 mm. On examination with the skin UBM system, the tumour appeared to have a nod-
(4
(b) Fig. 10. (a) 8 mm X 8 mm, 40 MHz image of a (benign) pigmented seborrhoeic keratosis (SK), with epidermis (E) and dermis (D) marked; (b) corresponding histological sec- tion, stained with Haematoxylin and Eosin (H & E). Shadows in the UBM image correlate with the location of keratin deposits on the histological section (arrows). The smallest scale markers, on the right side of image (a), are separated
by 100 pm.

Skin imaging 0 D. H TURNBULL erd. 87
(4
(b)
Fig. 11. (a) 8 mm x 8 mm, 50 MHz image of malignant melanoma; (b) corresponding histology section (H & E). The UBM image shows similar backscatter levels in the melanoma (M) and a region of scar tissue (SC) from a previ- ous biopsy. The epidermis (E), dermis (D) and subcutaneous fat (SF) are also indicated. The smallest scale markers, on
the right side of image (a), are separated by 100 pm.
ule extending deep into the dermis, and a depth mea- surement of over 2 mm was made with the callipers. The histological section, shown in Fig. 1 lb, revealed that what appeared to be an extension of the tumour was actually scar tissue from a previous biopsy. The similarity in backscatter level from the melanoma and the scar at 50 MHz is interesting, and leads us to cau- tion users of high frequency ultrasound imaging sys- tems to be careful in the interpretation of images from previously biopsied melanomas.
Many cases of melanoma in the clinic are more superficial than the example shown in Fig. 12. Figure 12a shows the UBM image of a superficial spreading melanoma made with the highly focused, 62 MHz transducer. The maximum tumour thickness was deter- mined to be 0.42 mm by histology (Fig. 12b), while the in vivo measurement of tumour thickness was 0.37 mm. It should be noted that LJBM thickness measure- ment is made assuming a speed of sound in skin of
1600 m/s, which may not be precisely correct, but is unlikely to be wrong by more than 2 5% (Serup 1992).
The structure causing the shadow in the left portion of the image was a small wire, placed on the skin at the lateral margin of the tumour. The tumour thickness measurement may be altered by the deformation caused by the wire pushing down on the surface. It is interesting to note the marked difference between the perilesional skin to the left of the wire, and the mela- noma to the right of the wire which appears as a fairly uniform hypoechoic zone correlating well with the his- tology section.
CONCLUSION
We have developed a real-time, B-scan UBM for skin imaging capable of operating up to a frequency of 100 MHz. We have demonstrated the imaging char- acteristics of this scanner over a frequency range from
(4
(b) Fig. 12. (a) 8 mm x 8 mm, 62 MHz image of a thin superfi- cial spreading melanoma; (b) corresponding histology sec- tion (H & E). The shadowing structure in the left portion of the UBM image is a wire that was placed at the lateral edge of the tumour (arrow), delineating perilesional normal skin (N) and melanoma (M). The smallest scale markers, on the
right side of image (a), are separated by 100 pm.

88 Ultrasound in Medicine and Biology Volume 21, Number 1, 1995
40 to 92 MHz. Axial resolution in the system was measured and found to lie between 17 and 30 pm, while lateral resolution was measured to be between 33 and 94 pm. The potential of the skin UBM system for investigating skin tumours as well as nonmalignant skin disease has been demonstrated through example images of normal and pathological skin, and the corre- lation between the UBM images and histology. We believe this high frequency ultrasound scanner can be used for the in viva determination of tumour margins and depths, and in the precise measurement of skin thickness to characterize various skin diseases and the effects of topical therapeutic agents.
In the future, we will concentrate on improving the imaging characteristics of the skin UBM system by developing more sensitive, piezoceramic transducers (Lockwood et al. 1994) and higher frequency transduc- ers fabricated from both lead zirconate titanate and lithium niobate. The scanner, as described in this paper, is currently being evaluated in the melanoma clinic at the Toronto-Bayview Regional Cancer Centre, and in several general dermatology clinics at the Sunnybrook Health Science Centre in Toronto. In the melanoma studies, in viva thickness measurements made with the skin UBM system are being compared to the histologi- cally determined tumour thickness, which is the single most important parameter for melanoma staging. Early results of these clinical studies indicate that higher frequency ultrasound should be useful for investigating superficial nevi and melanomas.
Acknowledgements - The development of this scanner was sup- ported by a grant from Hoechst, Inc. F. S. Foster is a Terry Fox Scientist of the National Cancer Institute of Canada. We thank Harry Easton of the Toronto-Bayview Regional Cancer Centre for design- ing and machining many of the scanner parts.
REFERENCES
Alexander, H.; Miller, D. L. Determining skin thickness with pulsed ultrasound. J. Invest. Dermatol. 72: 17- 19; 1979.
Altmeyer, P.; El-Gammal, S.; Hoffmann, K., eds. Ultrasound in dermatology. Berlin: Springer-Verlag; 1992.
Berson, M.; Vaillant, L.; Patat, F.; Pourcelot, L. High-resolution real-time ultrasonic scanner. Ultrasound Med. Biol. 18:471-478; 1992.
El-Gammal, S.; Hoffmann, K.; Auer, T.; Korten, M.; Altmeyer, P.; Hoss, A.; Ermert. H. A 50 MHz high resolution ultrasound im- aging system for dermatology. In: Altmeyer, P.; El-Gammal, S.; Hoffmann, K., eds. Ultrasound in dermatology. Berlin: Springer- Verlag; 1992:297-322.
Foster, F. S.; Pavlin, C. J.; Lockwood, G. R.; Ryan, L. K.; Harasie- wicz, K. A.; B&b&, L. R.; Rauth, A. M. Principles and applica- tions of ultrasound backscatter microscopy. IEEE Trans. Ul- trason. Ferroelec. Freq. Contr. 40:608-617; 1993.
Gropper, C. A.; Stiller, M. J.; Shupack, J. L.; Driller, J.; Rorke, M.; Lizzi, F. Diagnostic high resolution ultrasound in dermatology. Int. J. Dermatol. 32:243-250; 1993.
Harland. C. C.; Bamber, J. C.; Gusterson, B. A.; Mortimer, P. S. High frequency, high resolution B-scan ultrasound in the assessment of skin tumours. Br. J. Dermatol. 128:525-532; 1993.
Hunt, J. W.; Arditi, M.; Foster, F. S. Ultrasound transducers for pulse-echo medical imaging. IEEE Trans. Biomed. Eng. BME- 30:453-481; 1983.
Kolosov, 0. V.; Levin, V. M.: Mayev, R. G.; Senjushkina, T. A. The use of acoustic microscopy for biological tissue characterization. Ultrasound Med. Biol. 13:477-483; 1987.
Lockwood, G. R.; Hunt, J. W.; Foster, F. S. The design of protection circuitry for high frequency ultrasound imaging systems. IEEE Trans. Ultrason. Ferroelec. Freq. Contr. 38:48-55; 199la.
Lockwood, G. R.; Ryan, L. K.; Hunt, J. W.; Foster, F. S. Measure- ment of the ultrasonic properties of vascular tissues and blood from 35 to 65 MHz. Ultrasound Med. Biol. 17:653-666; 1991b.
Lockwood, G. R.; Tumbull, D. H.; Foster, F. S. Fabrication of high frequency spherically shaped ceramic transducers. IEEE Trans. Ult;ason: F&roelec. Freq.‘Contr. 41:231-235; 1994.
Matthes, U.; HGxtennann, S.; Hoffmann, K.; El-Gammal, S.; Bruschke, E.; Altmeyer, P. Acoustic microscopy in dermatology: Norma1 skin structures and tumours. In: Altmeyer, P.; El-Gam- mal, S.; Hoffmann, K., eds. Ultrasound in dermatology. Berlin: Springer-Verlag; 1992.328-340.
Passmann, C.; Ermert, H.; Auer, T.; Kaspar, K.; El-Gammal, S.; Altmeyer, P. In viva ultrasound biomicroscopy. Proc. IEEE Ultra- sonics Symposium, IEEE Cat. No. 93CH3301-9; 1993:1015- 1018.
Pawlak, F. M.; Hoffmann, K.; El-Gamma], S.; Altmeyer, P. Three- dimensional reconstruction of serial ultrasound images of the skin. In: Altmeyer, P.; El-Gammal, S.; Hoffmann, K., eds. Ultra- sound in dermatology. Berlin: Springer-Verlag; 1992:385-396.
Perednia, D. A. What dermatologists should know about digital imaging. J. Am. Acad. Dermatol. 25:89-108; 1991.
Serup, J. Ten years’ experience with high-frequency ultrasound ex- amination of the skin: Development and refinement of technique and equipment. In: Altmeyer, P.; El-Gammal, S.; Hoffmann, K., eds. Ultrasound in dermatology. Berlin: Springer-Verlag; 1992:41-54.
Sherar, M. D.; Starkoski, B. G.; Taylor, W. B.; Foster, F. S. A IO0 MHz B-scan ultrasound backscatter microscope. Ultrason. Imaging 1 I :95- 104; 1989.
Stiller, M. J.; Driller, J.; Shupack, J. L.; Gropper, C. G.; Rorke, M. C.; Lizzi, F. L. Three-dimensional imaging for diagnostic ultrasound in dermatology. J. Am. Acad. Dermatol. 29: 17 I - 175; 1993.