A 3D GEOLOGICAL MODEL OF THE 1963 VAJONT … · ing the slide. The continuity of ... of all times....
10
Italian Journal of Engineering Geology and Environment - Book Series (6) www.ijege.uniroma1.it © 2013 Sapienza Università Editrice 531 DOI: 10.4408/IJEGE.2013-06.B-51 A 3D GEOLOGICAL MODEL OF THE 1963 VAJONT LANDSLIDE AndreA BISTACCHI (*) , MAtteo MASSIRONI (**) , LAurA SUPERCHI (**) , LucA ZORZI (**) , roberto FRANCESE (***) , MAssiMo GIORGI (***) , FiLippo CHISTOLINI (*) & rinALdo GENEVOIS (**) (*) Università degli Studi di Milano Bicocca - Department of Earth and Environmental Sciences - Milan, Italy, (**) Università degli Studi di Padova - Dipartimento di Geoscienze - Padova, Italy (***) OGS - Istituto Nazionale di Oceanografia e di Geofisica Sperimentale - Dipartimento di Geofisica della Litosfera Trieste, Italy non-planar geometry is affected by the interference pat- tern of two regional-scale fold systems. The landslide is partitioned into two distinct and internally continuous rock masses with a distinct kinematics, which are char- acterised by a very limited internal deformation dur- ing the slide. The continuity of these two large blocks points to a very localized deformation, occurring along a thin, continuous and weak cataclastic horizon. Key words: Vajont landslide, 3D geomodelling, Gocad, structural geology, landslide kinematics, Southern Alps INTRODUCTION The Vajont Landslide is one of the most cata- strophic slope failures of the past century and possibly of all times. About 240 Mm 3 of the Jurassic-Creta- ceous carbonatic sequence on the Monte Toc northern slope slid into the Vajont Reservoir on October 9th 1963, displacing the water in the reservoir and produc- ing a huge wave that overtopped the dam and killed al- most 2000 people in the Piave valley below. Both the pre-1963 and post-1963 geological configurations are very well characterized thanks to reliable geological and topographic data collected during the first phase of studies of the Vajont landslide, before the 1963 fail- ure (rossi & seMenzA, 1965). The availability of this dataset did not prevent the 1963 catastrophe (an his- torical account can be found in seMenzA & Ghirotti, 2005), but today allows a very detailed reconstruction of the landslide kinematics, which might be used to ABSTRACT The Vajont landslide has been the object of several studies because of its catastrophic consequences and particular evolution. Several qualitative or quantitative models have been presented in the last 50 years, but a complete explanation of all relevant geological and mechanical processes still remains elusive. In order to better understand the mechanics and dynamics of the 1963 event, we have reconstructed the first 3D geologi- cal model of the landslide, which allowed us to accu- rately investigate the landslide structure and kinemat- ics. The input data for the model consisted in: pre- and post-landslide geological maps, pre- and post-landslide orthophotos, pre- and post-landslide digital elevation models, structural data, boreholes, and geophysical data. All these data have been integrated in a 3D geo- logical model implemented in Gocad, using the implicit surface modelling method. Results of the 3D geological model include the depth and geometry of the sliding surface, the volume of the two lobes of the landslide accumulation, kinematics of the landslide in terms of the vector field of finite displacement, and high quality meshes useful for mechanical simulations. The latter can include information about the stratigraphy and in- ternal structure of the rock masses and allow tracing the displacement of different material points in the land- slide from the pre-1963-failure to the post-landslide state. As a general geological conclusion, we may say that the structural analysis and the 3D model allowed us to recognize very effectively a sliding surface, whose
Transcript of A 3D GEOLOGICAL MODEL OF THE 1963 VAJONT … · ing the slide. The continuity of ... of all times....

Italian Journal of Engineering Geology and Environment - Book Series (6) www.ijege.uniroma1.it © 2013 Sapienza Università Editrice
531
DOI: 10.4408/IJEGE.2013-06.B-51
A 3D GEOLOGICAL MODEL OF THE 1963 VAJONT LANDSLIDE
AndreA BISTACCHI(*), MAtteo MASSIRONI(**), LAurA SUPERCHI(**),LucA ZORZI(**), roberto FRANCESE(***), MAssiMo GIORGI(***),
FiLippo CHISTOLINI(*) & rinALdo GENEVOIS(**)
(*)Università degli Studi di Milano Bicocca - Department of Earth and Environmental Sciences - Milan, Italy,(**)Università degli Studi di Padova - Dipartimento di Geoscienze - Padova, Italy
(***)OGS - Istituto Nazionale di Oceanografia e di Geofisica Sperimentale - Dipartimento di Geofisica della LitosferaTrieste, Italy
non-planar geometry is affected by the interference pat-tern of two regional-scale fold systems. The landslide is partitioned into two distinct and internally continuous rock masses with a distinct kinematics, which are char-acterised by a very limited internal deformation dur-ing the slide. The continuity of these two large blocks points to a very localized deformation, occurring along a thin, continuous and weak cataclastic horizon.
Key words: Vajont landslide, 3D geomodelling, Gocad, structural geology, landslide kinematics, Southern Alps
INTRODUCTIONThe Vajont Landslide is one of the most cata-
strophic slope failures of the past century and possibly of all times. About 240 Mm3 of the Jurassic-Creta-ceous carbonatic sequence on the Monte Toc northern slope slid into the Vajont Reservoir on October 9th 1963, displacing the water in the reservoir and produc-ing a huge wave that overtopped the dam and killed al-most 2000 people in the Piave valley below. Both the pre-1963 and post-1963 geological configurations are very well characterized thanks to reliable geological and topographic data collected during the first phase of studies of the Vajont landslide, before the 1963 fail-ure (rossi & seMenzA, 1965). The availability of this dataset did not prevent the 1963 catastrophe (an his-torical account can be found in seMenzA & Ghirotti, 2005), but today allows a very detailed reconstruction of the landslide kinematics, which might be used to
ABSTRACTThe Vajont landslide has been the object of several
studies because of its catastrophic consequences and particular evolution. Several qualitative or quantitative models have been presented in the last 50 years, but a complete explanation of all relevant geological and mechanical processes still remains elusive. In order to better understand the mechanics and dynamics of the 1963 event, we have reconstructed the first 3D geologi-cal model of the landslide, which allowed us to accu-rately investigate the landslide structure and kinemat-ics. The input data for the model consisted in: pre- and post-landslide geological maps, pre- and post-landslide orthophotos, pre- and post-landslide digital elevation models, structural data, boreholes, and geophysical data. All these data have been integrated in a 3D geo-logical model implemented in Gocad, using the implicit surface modelling method. Results of the 3D geological model include the depth and geometry of the sliding surface, the volume of the two lobes of the landslide accumulation, kinematics of the landslide in terms of the vector field of finite displacement, and high quality meshes useful for mechanical simulations. The latter can include information about the stratigraphy and in-ternal structure of the rock masses and allow tracing the displacement of different material points in the land-slide from the pre-1963-failure to the post-landslide state. As a general geological conclusion, we may say that the structural analysis and the 3D model allowed us to recognize very effectively a sliding surface, whose

A. BISTACCHI, M.MASSIRONI, L. SUPERCHI, L. ZORZI, R. FRANCESE, M. GIORGI, F. CHISTOLINI & R. GENEVOIS
532
International Conference Vajont 1963-2013. Thoughts and analyses after 50 years since the catastrophic landslide Padua, Italy - 8-10 October 2013
Fig. 1 - Geological sketch-map of the Vajont Landslide area (from massironi et alii, this volume)
features are being re-analysed using new field surveys, photogrammetric analyses, terrestrial and aerial laser scanning, topographic DEM analyses, rock-masses characterization, and a completely revised analysis of several boreholes drilled after 1963. Most of these new data are reviewed and discussed by MAssironi et alii (this volume), who propose a totally revised structural geology background for the landslide. Here we show how we have integrated all these new and historical
gain a better understanding of landslides and the re-lated hazard in general.
Although the landslide has been extensively stud-ied, its structural controls, deformation mechanisms, triggering factors, and dynamics, are still not com-pletely understood. The recent development of new technologies enables a better characterization and un-derstanding of the landslide. Geological, structural, ge-omorphological, hydrogeological and geomechanical

A 3D GEOLOGICAL MODEL OF THE 1963 VAJONT LANDSLIDE
Italian Journal of Engineering Geology and Environment - Book Series (6) www.ijege.uniroma1.it © 2013 Sapienza Università Editrice
533
& seMenzA (1965), and constitutes the basis for the reconstruction of the geological structure within the landslide accumulation and substratum.
Regarding the structural setting, MAssironi et alii (this volume) have completed a thorough review of available data and a detailed new study, resulting in a complete reinterpretation of structures within the landslide, with consequences on any further devel-opment in terms of kinematic or dynamic models. Some of these observations, and particularly those performed at large scale, have been included in our 3D geological model.
Particularly important is the observation that most of the folds that can be recognized on the sliding sur-face, and the major folds occurring within the land-slide accumulation, with N-S and E-W axes, predate the landslide and have a tectonic origin. This, which contrasts with assumptions made by many previous authors (e.g. pAronuzzi & boLLA, 2012) is easily dem-onstrated since the same folding pattern is observed out of the landslide. The preservation of these struc-tures within the landslide is so good that the largest folds can be traced to the corresponding structures in the immediate vicinity of the landslide (MAssironi et alii, this volume). Quite obviously, such a perfect preservation indicates that internal deformation of the landslide accumulation is very limited, and that land-slide-related deformation occurred along localized fault-like horizons, as will be confirmed in the section on 3D kinematic analysis.
Considering just the large scale structures, MAs-sironi et alii (this volume) have also recognized that the overall geometry of the sliding surface is defined by the interference of two synclines, the E-W trend-ing Erto Syncline and the (previously unknown) N-S trending Massalezza Syncline, defining a km-scale basin structure (Fig. 1). We will see in the following that this structure is very well represented in the 3D geological model, and has a strong influence on the kinematics and dynamics of the landslide (cAsteL-LAnzA et alii, this volume).
3D MODELINGWe have reconstructed a 3D geological model
which represents both the pre-1963 and post-1963 con-figuration (Fig. 2). This was possible thanks to the reli-able geological and topographic data collected during the geological surveys aimed at the design of the Vajont
data in a detailed 3D geological model of the landslide, how the 3D model has been reconstructed, which is its accuracy and reliability, and which is its importance as a basis for detailed numerical simulations of failure mechanisms. The 3D geological model allows to inves-tigate the structural setting before and after failure, the landslide kinematics, and to compare all this with dif-ferent kinds of numerical simulations.
GEOLOGICAL SETTINGThe northern slope of Monte Toc, where the land-
slide developed in the Vajont Valley, is entirely carved within carbonatic Jurassic-Cretaceous sequences of the Venetian Southern Alps. The stratigraphy of these units has been described in detail by seMenzA (1965) and MArtinis (1978), in studies where the geology of the landslide (both at surface and in boreholes) has been compared with outcrops in the Vajont Valley, not far from the landslide itself. The units outcropping in the landslide accumulation and in its surrounding are, from bottom to top (Fig. 1):• the Vajont Limestone (Dogger, 350-400 m): mas-
sive reworked oolitic limestone (e.g. zeMpoLich, 1995) outcropping in the Vajont Gorge, below the landslide;
• the Fonzaso Formation (Oxfordian-Callovian, 10-40 m): layered cherty limestone which in the upper part also show thin greenish clayey interlayerings, considered by hendron & pAtton (1985) the weak layers along which the sliding surface developed;
• the Rosso Ammonitico (Titonian-Kimmeridgian, 0-15 m): a thin and discontinuous fossiliferous nodular limestone unit which is not represented in most published maps;
• the Calcare di Soccher (Cretaceous, 150-250 m): massive limestones (lower member) grading to layered marly and cherty limestone (upper mem-bers); a large part of the landslide is constituted by this stratigraphic unit; the lower part of this unit is marked by a thin but characteristic conglomer-atic layer which represents a very useful structural marker within the landslide and in its surroundings;
• the Scaglia Rossa (Upper Cretaceous-Eocene, ca. 300 m): layered marly limestones and marls with a penetrative scaly fabric, not outcropping in the landslide.This sequence has been mapped at the 1:5.000
scale in the pre- and post-landslide setting by rossi

A. BISTACCHI, M.MASSIRONI, L. SUPERCHI, L. ZORZI, R. FRANCESE, M. GIORGI, F. CHISTOLINI & R. GENEVOIS
534
International Conference Vajont 1963-2013. Thoughts and analyses after 50 years since the catastrophic landslide Padua, Italy - 8-10 October 2013
phase of the project all these data have been georefer-enced (Italian Gauss Boaga grid, east zone), converted to suitable file formats and imported in a Gocad project. In Figure 2 the pre- and post-landslide geological maps are shown, draped onto the pre- and post-landslide to-pography, readily evidencing the huge mass of the Va-jont Landslide.
Due to the particular behaviour of the landslide - a rock slide where large coherent blocks glided along a very localized basal slipping surface (e.g. hendron & pAtton, 1985), the slide deposit is composed of two main lobes (eastern and western) internally separated into a few large blocks where the original stratigra-phy is preserved. This is readily evident by comparing the pre- and post-landslide geological maps in the 3D rendering in Figure 2. These lobes are separated one from each other by localized discontinuities, and from the bedrock by the main sliding surface. This allowed us to reconstruct the stratigraphy within each block, which, in structural geology terms, could be consid-ered as a relatively undistorted fault-bounded block, whilst the discontinuities can be considered as faults (actually they show the same geometries as low-angle normal faults). The basal sliding surface, extending everywhere below the landslide and separating it from the bedrock, is shared by both the pre- and post-1963 models. On the other hand, the topography and land-slide structure show appreciable variations between the pre- and post-landslide models. In the following we will show how these variations have been used to
Dam and particularly during the first phase of studies of the Vajont Landslide, before the October 9th 1963 failure (seMenzA, 1965). Input data for the pre-1963 3D model consist in a 1:5000 pre-landslide geological map (rossi & seMenzA, 1965), and in a digital eleva-tion model obtained by interpolation of the contour lines (10 m equidistance) represented within this map. The post-1963 geology is well represented by the post-landslide geological map (rossi & seMenzA, 1965), which after 50 years is still considered very reliable (see seMenzA & Ghirotti, 2000, and MAssironi et alii, this volume, for a review of the historic data). Stratig-raphy and the characterization of boreholes drilled after the landslide is covered by MArtinis (1978) and has been reviewed during this project. Post-landslide to-pography has been obtained from a recent aerial Lidar survey, and additional information have been collected on orthorectified aerial photos (both from irdat.regione.fvg.it/CTRN/). Additional structural data and the over-all geological setting are discussed in MAssironi et alii (this volume). The reliability of the pre-landslide geo-logical map is ranked very high, by comparison with the post-landslide map by the same authors. Also the pre-landslide topography is considered quite reliable, by comparison with the recent Lidar survey in regions not affected by the landslide. In the last year a detailed geophysical survey, combining seismic and electric resistivity tomography, has been carried out by FrAnc-ese et alii (this volume), and also these data have been integrated in the post-landslide 3D model. In the first
Fig. 2 - Pre- and post-landslide geological maps (-, 1965), draped on the pre- and post-slide topography. See legend in 252 Figure 1. The huge mass transfer (270 Mm3) from the steep northern slopes of Monte Toc, which filled the gorge, can be easily 253 recognized. Post-landslide boreholes, as deep as 300m, are shown as a reference in both images

A 3D GEOLOGICAL MODEL OF THE 1963 VAJONT LANDSLIDE
Italian Journal of Engineering Geology and Environment - Book Series (6) www.ijege.uniroma1.it © 2013 Sapienza Università Editrice
535
between their branch lines. However, this is not con-sidered a real concern, since the vertical extension of these discontinuities is limited.
Finally, implicit surface modelling was applied within blocks separated by discontinuities, allowing to independently model the stratigraphy within each block. The input data in this case are traces of strati-graphic contacts, structural data (including fold axes considered as in MAssiot & cAuMon, 2010), bore-hole stratigraphy and geophysical data. The implicit surface modelling is carried out with the GRGPack plugin on an unstructured tetrahedral mesh generated within each block with the TetGen algorithm (MAs-siot & cAuMon, 2010). The result is a realistic recon-struction of the blocks’ internal structure, with rele-vant ties to the pre-landslide structure, as discussed in MAssironi et alii (this volume).
Apart from a better definition of the internal struc-ture of the landslide, the main improvements with re-spect to previous models of the landslide, based on dense networks of cross sections, are a more precise definition of the volumes involved and a more con-sistent and reliable reconstruction of the sliding sur-face. The volume of the landslide, calculated in the pre-1963 configuration, is 241.3 Mm3. The most sig-nificant differences in the shape of the sliding surface are (1) the presence of the Massalezza syncline, which results in a convergence of the western and eastern slopes of this surface (Fig. 3), and (2) a longitudinal shape which is partly different from the one assumed by previous authors.
reconstruct the landslide kinematics.Both the pre- and post-1963 models have been
reconstructed in two main steps. First the discon-tinuities have been interpolated in Gocad with con-ventional "explicit" interpolation techniques using the DSI algorithm (MALLet, 2002). Then the stratigraphy within each block has been modelled with an implicit approach, using the GRGPack plugin (cAuMon et alii, 2009; MAssiot & cAuMon, 2010). This technique was found very effective in the integration of surface and subsurface geological data, both in the pre- and post-1963 setting.
In the case of the sliding surface, the data integrat-ed in the model consist in (Fig. 3): (1) topography of the now-exposed upper portions of this surface (from Lidar point cloud), (2) surface geology (traces of faults and geological boundaries from pre- and post-landslide geological maps), and (3) boreholes (con-straining at depth the sliding surface). In terms of 3D geomodelling techniques (MALLet, 2002), all these data have been added as control points to a surface pinned to the branch line (assumed perfectly known from geological maps), which marks the intersections between the sliding surface and the pre-1963 topogra-phy. The overall geometry of the sliding surface was then interpolated by means of the DSI algorithm in Gocad (MALLet, 2002).
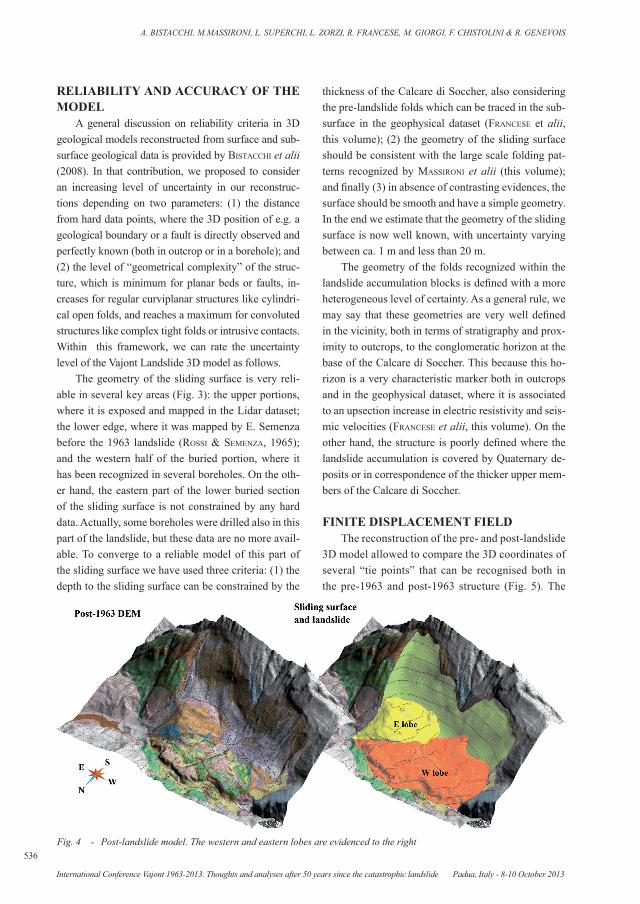
Other discontinuities, such as those separating the two lobes, or different blocks within the two lobes, in the post-landslide 3D model (Fig.- 4), cannot be con-strained so well, and basically are simply interpolated
Fig. 3 - Pre-landslide model. The pre-landslide DEM (left) is removed as to reveal the sliding surface (right, in green with elevation contours). The red line marks the now-exposed portion of the sliding surface reconstructed from Lidar data. The boreholes in the western-lower area are highlighted
A. BISTACCHI, M.MASSIRONI, L. SUPERCHI, L. ZORZI, R. FRANCESE, M. GIORGI, F. CHISTOLINI & R. GENEVOIS
536
International Conference Vajont 1963-2013. Thoughts and analyses after 50 years since the catastrophic landslide Padua, Italy - 8-10 October 2013
RELIABILITY AND ACCURACY OF THE MODEL
A general discussion on reliability criteria in 3D geological models reconstructed from surface and sub-surface geological data is provided by bistAcchi et alii (2008). In that contribution, we proposed to consider an increasing level of uncertainty in our reconstruc-tions depending on two parameters: (1) the distance from hard data points, where the 3D position of e.g. a geological boundary or a fault is directly observed and perfectly known (both in outcrop or in a borehole); and (2) the level of “geometrical complexity” of the struc-ture, which is minimum for planar beds or faults, in-creases for regular curviplanar structures like cylindri-cal open folds, and reaches a maximum for convoluted structures like complex tight folds or intrusive contacts. Within this framework, we can rate the uncertainty level of the Vajont Landslide 3D model as follows.
The geometry of the sliding surface is very reli-able in several key areas (Fig. 3): the upper portions, where it is exposed and mapped in the Lidar dataset; the lower edge, where it was mapped by E. Semenza before the 1963 landslide (rossi & seMenzA, 1965); and the western half of the buried portion, where it has been recognized in several boreholes. On the oth-er hand, the eastern part of the lower buried section of the sliding surface is not constrained by any hard data. Actually, some boreholes were drilled also in this part of the landslide, but these data are no more avail-able. To converge to a reliable model of this part of the sliding surface we have used three criteria: (1) the depth to the sliding surface can be constrained by the
thickness of the Calcare di Soccher, also considering the pre-landslide folds which can be traced in the sub-surface in the geophysical dataset (FrAncese et alii, this volume); (2) the geometry of the sliding surface should be consistent with the large scale folding pat-terns recognized by MAssironi et alii (this volume); and finally (3) in absence of contrasting evidences, the surface should be smooth and have a simple geometry. In the end we estimate that the geometry of the sliding surface is now well known, with uncertainty varying between ca. 1 m and less than 20 m.
The geometry of the folds recognized within the landslide accumulation blocks is defined with a more heterogeneous level of certainty. As a general rule, we may say that these geometries are very well defined in the vicinity, both in terms of stratigraphy and prox-imity to outcrops, to the conglomeratic horizon at the base of the Calcare di Soccher. This because this ho-rizon is a very characteristic marker both in outcrops and in the geophysical dataset, where it is associated to an upsection increase in electric resistivity and seis-mic velocities (FrAncese et alii, this volume). On the other hand, the structure is poorly defined where the landslide accumulation is covered by Quaternary de-posits or in correspondence of the thicker upper mem-bers of the Calcare di Soccher.
FINITE DISPLACEMENT FIELDThe reconstruction of the pre- and post-landslide
3D model allowed to compare the 3D coordinates of several “tie points” that can be recognised both in the pre-1963 and post-1963 structure (Fig. 5). The
Fig. 4 - Post-landslide model. The western and eastern lobes are evidenced to the right

A 3D GEOLOGICAL MODEL OF THE 1963 VAJONT LANDSLIDE
Italian Journal of Engineering Geology and Environment - Book Series (6) www.ijege.uniroma1.it © 2013 Sapienza Università Editrice
537
lobe. The eastern group of displacement vectors is characterized by a length of 464±12 m, an azimuth of 3±1°, and a rather constant plunge, indicating no rotational kinematics. Overall, the small standard deviations within each group indicates a very limit-ed deformation within each block, consistently with structural geology observations by MAssironi et alii (this volume), and no rotations in a map view (in contrast with pAronuzzi & boLLA, 2012). Moreover, it appears that the two lobes followed partly con-vergent paths (about 5° of convergence), which is consistent with the kinematic control - or “confine-ment” effect - exerted by the Massalezza syncline. In other words the western lobe was pushed to the
tie points have been connected with straight line seg-ments, which represent the finite displacement vec-tor accumulated between the pre- and post-landslide stages. The length and 3D direction of these vectors has been compared, and it was possible to recognize two distinct groups of vectors with a very limited internal variability. The two groups are represented in blue and red in Fig. 6, for the western and eastern groups, and correspond to tie points selected in the western and eastern lobe respectively. The western group of displacement vectors is characterized by a length of 361±12 m, an azimuth of 8±2.5°, and a downward decrease in plunge, indicating a partly ro-tational kinematics (in cross section) for the western
Fig. 6 - Finite displacement field. Reference points (“tie points”) recognized in the pre-1963 and post-1963 geology have been 261 connected by finite displacement vectors. The eastern and western lobes are represented by red and blue vectors respectively
Fig. 5 - Cross sections across the western and eastern lobes and location of cross sections superposed on a map including the 259 sliding surface and the surrounding geology as in Figure 3

A. BISTACCHI, M.MASSIRONI, L. SUPERCHI, L. ZORZI, R. FRANCESE, M. GIORGI, F. CHISTOLINI & R. GENEVOIS
538
International Conference Vajont 1963-2013. Thoughts and analyses after 50 years since the catastrophic landslide Padua, Italy - 8-10 October 2013
NNE by the sliding surface dipping in that direc-tion, and the eastern lobe suffered an opposite ef-fect due to the eastern limb of the syncline dipping towards the NNW. Finally, the different lengths of displacement vectors is consistent with the eastern lobe being partly thrust on top of the western lobe for a distance of about 100 m, as already evidenced by seMenzA (1965).
EXPORTING MODEL GEOMETRIES TO-WARDS OTHER MODELING PACKAGES
One important goal of this 3D geological mod-elling project was to provide a common best-fit geo-metrical and geological basis for the development of numerical models dealing with various aspects of the landslide mechanics and hydrogeology. The ge-ometries that we have obtained will be available in the future by request to the corresponding author. At the time of writing, these geometries have been exported in different file formats and made available to parallel projects mainly dealing with the mechanical simula-tion of the triggering phase. Different approaches have been used to export the Gocad geometries to-wards Midas/GTS (cAsteLLAnzA et alii, this volume), 3DEC, Slope Model, and UDEC.
Midas/GTS has an import tool particularly suited for sets of contour lines, which are used to constrain NURBS surfaces that in turn control the 3D finite ele-ment mesh. Thus, we exported (DXF format) a very high resolution set of contour lines from the sliding surface and topography, defined in Gocad as triangu-lated surfaces. We have also been able to import in Midas/GTS the tetrahedral mesh generated in Gocad with the TetGen algorithm, but in the end this mesh re-sulted very heavy, having a very high resolution, and was not used in simulations.
As regards 3DEC and SlopeModel, we have ex-ported the Gocad triangulated surfaces to Rhino3D, using the intermediate OBJ exchange format. From this file format it is possible to generate 3DEC and FLAC3D geometries using KUBRIX Geo (www.itascacg.com).
Finally, two 2D sections have been exported in DXF format to be imported in different 2D modelling packages. These sections have been cut in the western and eastern lobes of the landslide, oriented parallel to the slope of the sliding surface.
CONCLUSIONThe 3D geological modelling of large landslides
is considered a very interesting, yet challenging task because of the very complex structures involved and of the lack of detailed subsurface data. In the case of the Vajont Landslide, these difficulties are less pronounced than in other cases, due to the particular kinematics, characterized by sliding of large coher-ent blocks along thin fault-like horizons. In addition a very complete topographic, geologic and geophysical dataset is available for both the pre- and post-land-slide configuration.
The modelling approach chosen for this project, which includes a first step of conventional "explicit" modelling of large-scale discontinuities, and a second step of implicit surface modelling of the stratigraphy within each block, proved to be very effective. Par-ticularly important is the possibility to include in the analysis data that are very heterogeneous and sparse.
Concluding, our approach allowed to recon-struct a reliable best-fit 3D geological model of the Vajont Landslide, which allows: (1) to measure the landslide volume, (2) to reconstruct its kinemat-ics, and (3) to export the geometries and geologi-cal properties towards various geomechanical and hydrogeological modelling packages. A possible improvement in the model presented here would be the inclusion of geomechanical properties measured in outcrops or boreholes, which would allow for a very advanced geostatistical modelling of these fun-damental parameters.
ACKNOWLEDGMENTSFieldwork was carried out by all authors, geophysi-
cal data were collected by RF and MG, and structural analysis was coordinated by MM. AB performed the 3D modelling. The paper was written by AB with contribu-tions mainly by MM. RG developed and coordinated the project. The Friuli Venezia-Giulia Region is thanked for providing aerial Lidar data. The Gocad Research Group and Paradigm Geophysical are acknowledged for wel-coming us into the Gocad Consortium. Guillame Cau-mon is warmly acknowledged for providing assistance with the Gocad implicit surface modelling plugin.

A 3D GEOLOGICAL MODEL OF THE 1963 VAJONT LANDSLIDE
Italian Journal of Engineering Geology and Environment - Book Series (6) www.ijege.uniroma1.it © 2013 Sapienza Università Editrice
539
REFERENCESbistAcchi A., MAssironi M., dAL piAz G.V., dAL piAz G., MonopoLi b., schiAVo A. & toFFoLon G. (2008) - 3D fold and fault
reconstruction with uncertainty model: an example from an Alpine tunnel case study. Computers and Geosciences, 34: 351-372.cAsteLLAnzA r., AGLiArdi F., bistAcchi A., MAssironi M., crostA G.b. & GeneVois R. (2013) - 3D finite-element modelling of the Vajont
landslide initiation stage. In this volume.cAuMon G., cLeMent J., riFFAuLt d. & Antoine c. (2009) - Modeling of geological structures for structural constraints: faults, fold axes
and dip domains. Proceedings of the 29th Gocad Meeting, Nancy.FrAncese r., GiorGi M., bohM W., bondesAn A., bistAcchi A., MAssironi M. & GeneVois r. (2013) - Comprehensive 3D geophysical
modeling of the Vajont landslides and of its surroundings. In this volume.hendron A.J. & pAtton F.d. (1985) - The Vaiont slide, a geotechnical analysis based on new geological observations of the failure
surface. Tech Rep GL-85–5, 2 vols.MALLet J.L. (2002) - Geomodeling. Oxford University Press, New York.MArtinis b. (1978) - Contributo alla stratigrafia dei dintorni di Erto-Casso (Pordenone) ed alla conoscenza delle caratteristiche
strutturali e meccaniche della frana del Vajont. Memorie di Scienze Geologiche, Università di Padova, 32: 1-33.MAssiot c. & cAuMon G. (2010) - Accounting for axial directions, cleavages and folding style during 3D structural modeling.
Proceedings of the 30th Gocad Meeting, Nancy.MAssironi M., superchi L., zAMpieri d., bistAcchi A., rAVAGnAn r., berGAMo A., Ghirotti M. & GeneVois r. (2013) - Geological
structures of the Vajont landslide. In this volume.pAronuzzi p. & boLLA A. (2012) - The prehistoric Vajont rockslide: An updated geological model. Geomorphology, 169-170: 165-191.
doi:10.1016/j.geomorph.2012.04.021rossi & seMenzA e. (1965) - Carte Geologiche del versante settentrionale del M. Toc e zone limitrofe prima e dopo il fenomeno di
scivolamento del 9 Ottobre 1963. Scala 1:5000. Ist. Geol. Univ. Ferrara, Italy.seMenzA e. (1965) - Sintesi degli studi geologici sulla frana del Vaiont dal 1959 al 1964. Memorie del Museo Tridentino di Scienze
Naturali, 16: 1-52.seMenzA e. & Ghirotti M. (2000) - History of the 1963 Vaiont Slide. The importance of the geological factors to recognise the ancient
landslide. Bulletin of Engineering Geology and the Environment, 59: 87-97.zeMpoLich W.G. & hArdie L.A. (1997) - Geometry of dolomite bodies within deep-water resedimented oolite of the Middle Jurassic
Vajont Limestone, Venetian Alps, Italy: analogs for hydrocarbon reservoirs created through fault-related burial dolomitization. In Kupecz A., GLuyAs J. & bLoch s. (eds.). Reservoir quality prediction in sandstones and carbonates. 127-162.