A 150-year record of coastline dynamics within a sediment ... · A 150-year record of coastline...
72
•
Transcript of A 150-year record of coastline dynamics within a sediment ... · A 150-year record of coastline...

Loughborough UniversityInstitutional Repository
A 150-year record ofcoastline dynamics within a
sediment cell: EasternEngland
This item was submitted to Loughborough University's Institutional Repositoryby the/an author.
Citation: MONTREUIL, A-L. and BULLARD, J.E., 2012. A 150-year recordof coastline dynamics within a sediment cell: Eastern England. Geomorphology,179, pp. 168 - 185.
Additional Information:
• This article was published in the journal, Geomorphology[ c© Elsevier B.V.] and the definitive version is available at:http://dx.doi.org/10.1016/j.geomorph.2012.08.008
Metadata Record: https://dspace.lboro.ac.uk/2134/11209
Version: Accepted for publication
Publisher: c© Elsevier B.V.
Please cite the published version.

This item was submitted to Loughborough’s Institutional Repository (https://dspace.lboro.ac.uk/) by the author and is made available under the
following Creative Commons Licence conditions.
For the full text of this licence, please go to: http://creativecommons.org/licenses/by-nc-nd/2.5/

1
A 150-year record of coastline dynamics within a sediment cell: eastern England. 1
2
3
Anne-Lise Montreuil1, Joanna E. Bullard1* 4
5
1Department of Geography, Loughborough University, Leicestershire, LE11 3TU, UK. 6
Email: [email protected] 7
Tel: +44(1)509 222794 8
Fax: +44(0)1509 223930 9
10
*Corresponding author 11
12

2
Abstract 13
Coastal sediment cells reflect processes operating at a range of scales, but it is the medium 14
spatial and temporal scales (decades to centuries) that are of greatest interest for coastal 15
management. This paper focuses on coastline position change within a single sediment cell 16
over 150 years where the geomorphology includes cliffs, beaches and saltmarshes. The 17
focus is the east coast of England from Flamborough Head to Gibraltar Point. Although the 18
updrift sector of this sediment cell has been studied for well over a century, the downdrift 19
sector has attracted significantly less attention. Using topographic profiles, bathymetric 20
profiles, aerial photographs and historical maps we mapped coastline erosion and accretion 21
using the Digital Shoreline Analysis System (DSAS) and calculated volumetric changes for 22
different morphometric units. Rapid erosion of the updrift Holderness cliffs has been 23
counterbalanced with accretion on beaches along the downdrift Lincolnshire coast. The 24
amount of accretion in Lincolnshire corresponds to around 29% of the volume of sediment 25
eroded from Holderness. Much of the eroded cliff material is likely to be deposited 26
temporarily into nearshore and offshore sand banks before being redistributed by cross-27
shore currents. An exploration of storm surge impact on long-term erosion and accretion 28
rates showed no clear relationship between storm surge frequency and change in coastline 29
position, however this may be in part due to the relative timing of storm occurrence and data 30
acquisition. The Jenkinson Daily Weather Type classification was found to be a reasonable 31
proxy for the occurrence of strong onshore winds which may offer scope for further 32
investigation of the role of forcing factors over time periods beyond the length of the 33
meteorological and tidal station records. Winter North Atlantic Oscillation phase was not a 34
good indicator of storminess on the east coast of England but may be a useful proxy for 35
quiescence. 36
37
38

3
Keywords Sediment cell, Coastline change, sediment budget, storm surge, Jenkinson 39
Weather Types 40
41
42
Highlights 43
1) Trends in the balance of sediment supplies and sinks in a littoral cell are examined. 44
2) Long-term erosion dominates cliffs updrift and reaches rates of up to 2 m year-1 45
3) Accretion up to 2.7 m yr-1 dominates on sandy beaches at the centre of the cell. 46
4) The Jenkinson Daily Weather Type is a useful proxy for UK east coast storminess. 47
48

4
1. Introduction 49
Coastlines are inherently dynamic landscape components and significant alterations in their 50
position and alignment have been documented worldwide. These changes occur in response 51
to factors such as sea-level change (Orford et al.,1995), large-scale morphological self-52
organization (Cooper et al., 2007), changes in sediment budget associated with sources 53
(e.g. rivers, cliff erosion), sinks (e.g. sand banks, submarine canyons) and longshore 54
transport (Pye, 1983; Aagaard et al., 2004), variations in storminess and wave climate 55
(Zhang et al., 2001; Pye and Blott, 2008), and coastal management (Iskander et al., 2007; 56
Kaminsky et al., 2010). Along any stretch of coastline, variations in the rate and direction 57
(erosion or accretion) of change are common, associated with local sediment budget and 58
coastal characteristics such as the distribution of headlands, cliffs and beaches; records of 59
such dynamics are typically used to plan coastal management strategies. The importance of 60
littoral sediment budget as a control on the direction of coastline movement is widely 61
recognized and is typically linked to the concept of the sediment (or littoral) cell. Ideal 62
sediment cells are sections of coast that are relatively self-contained and include defined 63
sources, transport pathways and sinks of sediment. The concept was first applied to the 64
California coast (Bowen and Inman, 1966; Inman and Frautschy, 1966) but is now widely 65
used in countries such as the USA, Canada, New Zealand and the UK for coastal 66
management planning, where cell boundaries define the planning units (e.g. Motyka and 67
Brampton, 1993; Hooke and Bray, 1995; Cooper and Pontee, 2006). 68
69
The delimitation and operation of sediment cells reflect processes interacting at a range of 70
spatial and temporal scales, and in many areas coastal morphology and dynamics still reflect 71
and are recovering from the impact of Holocene sea-level changes and deglaciation (May 72
and Hansom, 2003). It is the medium spatial (≥10 km) and temporal (decades to centuries) 73
scales that are usually of greatest interest for coastal management and forward planning 74

5
(Cooper et al., 2001; Pethick, 2001; Orford and Pethick, 2006; Gelfenbaum and Kaminsky, 75
2010), but there is often a lack of systematic information concerning decadal-scale changes 76
in interacting landforms within a single cell (e.g. Lee, 2001; Ruggiero et al., 2005; Pye et al., 77
2007). The aim of this paper is to quantify the spatial and temporal variability in coastline 78
position, rate of change and sediment budget within a single sediment cell. Particular 79
attention has been given to six areas of interest characterised by different coastal landforms 80
(e.g. cliffs, beaches) or management intervention. We use complementary data sources 81
including maps, aerial photographs and topographic profiles to document change over 82
timescales up to 150 years. A preliminary examination of the relationship between 83
morphological change and forcing factors is also presented. The area of interest is the east 84
coast of England between Flamborough Head and Gibraltar Point. Whilst the northern part of 85
this region has been widely-studied, the downdrift, southern sector has attracted significantly 86
less attention. 87
88
2. Regional setting 89
Prior to the 1980s, coastal management in Britain was typically local in focus and 90
determined by administrative bodies such as local authorities. Increasing recognition in the 91
1980s that management at one location can impact the coastline elsewhere led to various 92
authorities combining interests to develop more integrated coastal management plans 93
(Hooke and Bray, 1995). These coastal groups recognised the importance of understanding 94
sediment transport patterns for effective management (e.g. Hooke and Bray, 1995; Hooke et 95
al., 1996). Since the 1990s, the coastline of England and Wales has been divided in to 96
eleven coastal cells (Motyka and Brampton, 1993) (Fig. 1). Each of these cells represents a 97
defined natural sedimentary system and for each there is a Shoreline Management Plan 98
(SMP) used to guide sustainable coastal defence decision-making processes (MAFF, 1994; 99
DEFRA, 2006). SMPs involve numerous partner organisations and stakeholders including 100
local authorities, government agencies and business and community groups, and their 101
6
introduction marked a strategic step towards integrated management of the coastline within 102
natural rather than purely administrative boundaries that is both long term and considers the 103
impact of local-scale coastal management elsewhere (Hooke and Bray, 1995; O’Connor et 104
al., 2009). 105
106
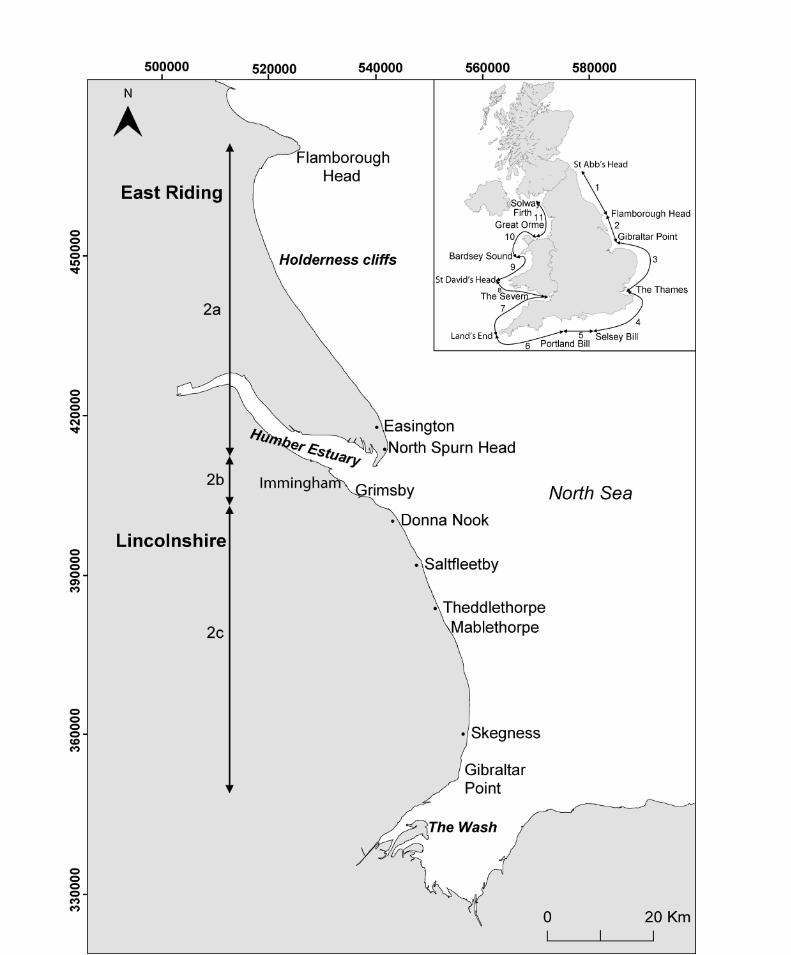
2.1. Geomorphology of the coastal cell 107
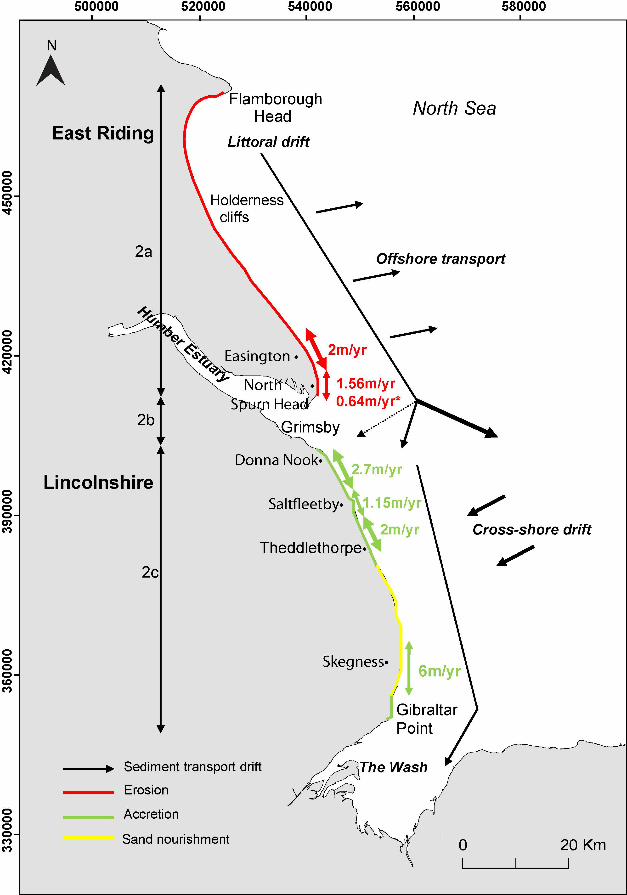
This paper focuses on sediment cell 2 along the East Riding and Lincolnshire coastlines, 108
which is divided into three sub-cells (2a Flamborough Head to Spurn Head; 2b Outer 109
Humber Estuary; 2c Donna Nook to Gibraltar Point: Fig. 1). Net longshore sediment 110
transport is from north to south. The concept of sediment cells focuses on wave-driven 111
transport of non-cohesive sediments (Motyka and Brampton, 1993) and is harder to apply to 112
fine sediments in suspension (Hooke and Bray, 1995). However, many sediment cells 113
include a variety of landforms including both those formed from non-cohesive sediments 114
(such as sandy beaches) and those dominated by cohesive material such as saltmarshes. 115
In the study area, coastal geomorphology within the cell is varied and includes chalk and 116
glacial till cliffs, wide sandy beaches, saltmarshes, sand dunes, coastal spits and nearshore 117
and offshore sand banks. Coastal management strategies include engineered defences built 118
over the last two centuries and beach nourishment programmes, although large stretches of 119
the coastline have no man-made defences. The main cell boundaries are Flamborough 120
Head to the north, a fixed chalk headland, and Gibraltar Point spit in the south, which is a 121
partial boundary with sediment transfer continuing in to The Wash and southern North Sea. 122
123
<Fig. 1> 124
125
7
In the north of the sediment cell, glacial till cliffs 3-40 m high extend 60 km along the 126
Holderness coast and are rapidly retreating (recently reviewed by Quinn et al., 2009). The 127
cliff erosion occurs through repeated landslide activity, caused mainly by waves undercutting 128
the base of the cliffs and removing beach material (Dossor, 1955; Quinn et al., 2009). Sea 129
defences are present near some coastal towns. Sediment eroded from these cliffs and the 130
shore platform are transported southwards to Spurn Head and to offshore sand banks by 131
littoral drift and wave currents. Spurn Head is a narrow sand and gravel spit that extends 5.5 132
km into the mouth of the Humber Estuary (sub-cell 2b). The Humber Estuary mouth 133
stretches from Spurn Head to Donna Nook and is influenced both by the tide and flow from 134
the river. Strong tidal flows intersect the north-south sediment transport pathway along the 135
open coast, limiting the entry of gravels and sands into the estuary mouth. 136
137
In contrast, the low-lying Lincolnshire coast, south of the Humber, comprises superficial 138
deposits left by retreating ice sheets (Swinnerton and Kent, 1949; Brampton and Beven, 139
1987) and is characterized by sandy beaches and saltmarshes (sub-cell 2c). Offshore sand 140
banks are present from Donna Nook to Mablethorpe, and not only protect the shore against 141
wave attack, but also provide a source of sand to the beaches which are up to 3.5 km wide 142
and backed by dunes (van Houwelingen et al., 2006). Extensive saltmarshes at Saltfleetby 143
are sheltered by broad beaches. This section of the Lincolnshire coastline is typically 144
accreting (HR Wallingford, 2002). South of Mablethorpe the sediment budget changes and 145
coastal erosion dominates in part due to the absence of offshore sand banks (Dugdale and 146
Vere, 1993). Sea defences have been built to protect against coastal flooding and, following 147
a severe storm surge in 1953, extensive ‘hard’ defences were built such as seawalls, 148
groynes and revetments particularly near Skegness. Historically, during high storms, the thin 149
sand cover on the beach moved seaward and the underlying glacial till was exposed and 150
eroded. To counter this erosion, a major beach renourishment plan began in 1994 and 151
continues to date (Environment Agency, 2004). Just south of Skegness, the coastline 152

8
changes orientation slightly providing a sheltered coast for the development of coastal dunes 153
and saltmarshes at Gibraltar Point (National Nature Reserve). 154
155
2.2. Marine and climatic setting 156
Along this coast, tides are semi-diurnal and macro-tidal, with a mean spring tidal range of 6 157
m; tidal currents flow southward during the flood and northward during the ebb (Table 1). 158
The dominant incident wave approach is from the north to east quadrant (corresponding to 159
the longest wind fetch). Offshore significant wave conditions are characterized by a 50% 160
exceedence significant wave height of 0.5 m and a modal wave period of 4s, but wave 161
heights can reach 2.5 m in winter (van Houwelingen et al., 2008). Wave-driven processes 162
and flood residual tidal currents are the main drivers of alongshore sediment transport which 163
is directed towards the south (Pye, 1995; van Houwelingen et al., 2006). Storm surges are 164
relatively rare, but the most severe recent events occurred in 1953 (Barnes and King, 1953; 165
Brampton and Beven, 1987) and in 1978, and significantly affected the Lincolnshire coast 166
(Steers et al., 1979; Blott and Pye, 2004). Severe storm surges are the result of combined 167
high tidal level and energetic wave activity, caused by deep depressions tracking eastward 168
toward the North Sea and moving around the North Sea basin in an anticlockwise circulation 169
(Dolata et al., 1983). Consequently, surge levels increase southwards along the east coast 170
of England caused by the funnelling effect of the narrowing North Sea. Winds prevail from 171
the southwest (i.e. offshore) and wind speeds are modest (<8 m.s-1) for the majority of the 172
time (73%). During winter months, however, the development of high pressure systems over 173
the British Isles and the North Sea can lead to prolonged strong northwesterly and easterly 174
winds (Steers, 1966). 175
176
<Table 1> 177
178

9
Global average sea level rose at approximately 1.8 mm year-1 between 1961 and 2003, but 179
has accelerated to 3.1 mm year-1 over recent years (IPCC, 2007). Along the east coast of 180
England, sea-level rise is lower than this global average at c.1 mm year-1 (HECAG, 2009, 181
Woodworth et al., 2009). For the purposes of this study sea level is considered to have been 182
negligible from 1850 to 2010. 183
184
3. Methods and Approach 185
Changes in coastline position (section 3.2) from the mid-1990s for the whole sediment cell 186
were determined using cross-shore topographic surveys. From these, we identified 6 specific 187
areas of interest (AOIs) within the sediment cell representing a range of coastal 188
geomorphological features (Table 2). These 6 AOIs were examined in more detail to 189
determine: 190
1. the changing position and relative rate of retreat or accretion of the coastline from the 191
mid- to late-1800s to date; 192
2. changes in the volume of sediment in backshore and beach/foreshore from the mid-193
1990s to date; 194
3. changes in nearshore bathymetry from 1999 (for AOIs 3-6 only). 195
A preliminary exploration of the key environmental factors affecting rates of coastline change 196
was made using climate and tidal data, including the potential for using a proxy dataset to 197
explain long-term geomorphological changes. 198
199
<Table 2> 200
201
3.1. Geomorphological data sources 202

10
3.1.1. Topographic and bathymetric profiles 203
The temporal frequency of cross-shore topographic surveys around the UK is variable and 204
for this study dates were selected that were: a) available for all AOIs, b) corresponded to 205
aerial photograph coverage, and c) maximized the length of the record. Surveys were used 206
from the mid-1990s (one of 1994, 1996 or 1997), 1999, 2005, 2008 and 2010 and were 207
supplied for the Holderness coast by the East Riding of Yorkshire Council, and for 208
Lincolnshire by the UK Environment Agency. For each year, a total of 160 profiles, surveyed 209
in summer or early autumn, was analysed (profile spacing 0.5 km and 1 km along the East 210
Riding and Lincolnshire coasts, respectively). Initially surveys were conducted using a 211
standard total station (horizontal accuracy ±0.1 m and vertical accuracy ±0.01 m) located 212
over Ordnance Survey (OS) control points and referenced to the ODN datum. However, 213
since 1999 and 2003 (East Riding and Lincolnshire, respectively), surveys have been made 214
using a RTK-GPS system. Detailed topographic airborne laser surveys have been 215
undertaken along the East Riding coast since 2008 (horizontal accuracy ±1 m; vertical 216
accuracy ±0.15 m). From these we extracted cross-shore topographic profiles along the 217
same lines used in earlier surveys. 218
219
Nearshore changes were determined using bathymetric surveys made as seaward 220
extensions of the terrestrial cross-shore topographic profiles, and carried out by Gardline 221
under contract to the UK Environment Agency in 1999, 2005 and 2008 along the 222
Lincolnshire coast only. The surveys employed single multi-beam echo-sounders, the 223
accuracy of which has been estimated to be ±1 m in the horizontal and ±0.005 m in the 224
vertical (Gardline, 2008). 225
226
3.1.2. Maps and Aerial Photographs 227

11
For each AOI, coastline change was estimated over a ~150-year period using historic OS 228
maps (1854-1951: Table 3) and aerial photographs (1953-2010: Table 3 - available data 229
vary by site). Analysis of the historical OS maps can often experience a delay between field 230
survey dates and the publication dates, so that it is difficult to establish specifically when 231
surveys were undertaken. Aerial survey acquisitions were generally during summer months. 232
The use of historical data and combining different data sources can be subject to 233
uncertainties and errors (Thomas et al., 2011; James et al., 2012) which were minimized 234
where possible. Aerial photographs were individually registered against the 2010 ortho-235
rectified photographs using the British National Grid (OSGB36) reference system, and 236
ArcMap 9.3 software. Registration was based upon eight stable ground control points (e.g. 237
buildings, road junctions) visually identifiable on all photographs; an average error of ±1.5 m 238
is considered acceptable (Dolan et al., 1991; Chaverot et al., 2008). The root mean square 239
error (RMSE; Maune, 2007) associated with the geo-referencing process was less than 3.5 240
m for each aerial photograph. Independent error estimates were also undertaken by 241
measuring the positional difference of six additional ground control points, on every map and 242
aerial photograph and the same features on the 2010 ortho-rectified photograph. The 243
average difference for the OS maps ranges between 6.6 m and 7.3 m, while the errors of 244
ortho-photographs are estimated to be 3.4 m in 1953, and below 2 m for all others and 245
deemed to be within acceptable limits (Longley et al., 2005). 246
247
<Table 3> 248
249
The coastline (section 3.2) on each map and aerial photograph was digitized using ArcView 250
9.3 software. The Digital Shoreline Analysis System (DSAS) enables calculation of rate of 251
change statistics from multiple shoreline positions (Thieler et al., 2009; Brooks and Spencer, 252
2010;) and was used in combination with ArcView to calculate coastline change between 253
consecutive maps and aerial photographs. For this study, transects were generated every 254
100 m perpendicular to the reference coastline, defined as 1854 and 1891 for the East 255
12
Riding and Lincolnshire coast AOIs respectively (Table 2). At Saltfleetby, the number of 256
transects was reduced due to a lack of ground control points in part of the AOI and historical 257
coastal change was only estimated from ortho-photographs. This is because when 258
measured using the above technique there was a difference in the coastline position 259
depicted on the 1951 OS map and that interpreted from the 1953 aerial photographs of 625 260
m. In the context of other coastline changes, such high rates of accretion are highly unlikely 261
and are attributed to errors and uncertainties in the mapping process (James et al., 2012). 262
Within DSAS, the End Point Rate (EPR) method, determining the distance between the 263
earliest and the most recent coastlines divided by the time between surveys, was used to 264
obtain rates of coastline change. This also reduces the potential problem of image quality 265
over time (Dolan et al., 1991). 266
267
3.2. Definition of morphological parameters 268
Defining a consistent reference point along a dynamic coastline is challenging due to 269
variations in tide levels, meteorological or marine conditions (Pajak and Leatherman, 2002; 270
Thieler and Danforth, 1994), and limitations of spatial resolution during data acquisition 271
(Cracknell, 1999). Here, the coastline was defined from the topographic profiles using a fixed 272
reference plane at HAT (highest astronomical tide) level for the sandy beaches along Spurn 273
Head and the Lincolnshire coast; for precision, cross-shore profiles were linearly interpolated 274
to 0.1 m. The HAT level often coincides with the seaward limit of vegetated coastal 275
foredunes and can provide an objective, repeatable way of identifying morphological sub-unit 276
boundaries (Guillén et al., 1999). However, along the East Riding coast the top of cliff/cliff 277
base position identified from field or airborne surveys was assumed to provide a better 278
representation of the coastline (Brooks and Spencer, 2010). Coastline changes were 279
investigated relative to the initial survey if profiles did not reach the HAT level (with first 280
measureable survey being the zero, or reference, line). 281
13
282
The topographic profiles were also used to quantify sediment budget changes in the AOIs 283
(1997-2010 East Riding; 1994-2010 Lincolnshire). Cross-shore profiles were divided into 284
three morphological units - backshore, foreshore and nearshore – and sediment volume was 285
determined using simple trapezoidal area calculations under the survey line for one unit 286
length (m3 m-1) of coastline. The reference base for the backshore was +MHWS (mean high 287
water spring) height (Fig. 2), and thus corresponds to the sediment unit which is only 288
affected by marine processes during energetic events. The boundaries of the foreshore unit 289
are MHWS and ODN heights (z=0 m). In both these units volume is calculated above ODN. 290
The nearshore zone was divided using ODN to MLWS (sub-unit 1) and from MLWS to z = -5 291
m (sub-unit 2). The baseline of z = -5 m was used to compute the sediment volume (Fig. 2). 292
293
<Fig. 2> 294
295
Although it has been argued that the HAT level gives a good approximation of coastline 296
(Halcrow, 1988; Saye et al., 2005; Pye et al., 2007), it is worth noting that across different 297
data sources (aerial photographs, topographic profiles) there is no significant correlation 298
between the coastline and HAT level positions (Table 4). There are several possible reasons 299
for this; first the coastline derived from aerial photographs corresponds to the crest of the 300
foredune on sandy beaches, while the HAT level often represents the foredune slope-toe, 301
which is likely to be a more dynamic morphologic feature (Ruessink and Jeuken, 2002). 302
Second, the terrestrial and airborne surveys were not carried out simultaneously so some 303
morphological change may have occurred between survey periods. Coastline position is 304
related to the sand volume of the backshore and, unsurprisingly, there is a negative 305
relationship between sand volume in the backshore and in the foreshore. Recent studies 306
elsewhere in the North Sea Basin have suggested that significant quantities of sand can be 307

14
supplied from the nearshore zone to the shoreface during energetic hydrodynamic 308
conditions (Aagaard et al., 2004; Anthony et al., 2006). 309
310
<Table 4> 311
312
3.3. Climate and tidal data sources 313
Coastline position reflects processes operating at a range of magnitudes and frequencies. It 314
has been demonstrated, for example, that the coastline can recover relatively rapidly 315
following a single storm event, however sequences of storm events can cause major and 316
sustained alterations due to insufficient recovery time (Douglas and Crowell, 2000; Morton 317
and Sallenger, 2003; Stockdon et al., 2007). Detailed examination of the impact of climate 318
and tidal conditions on the coastline would require continuous records of all variables 319
including coastline position. Whilst coastline position data are only available every few years 320
over the long term and every few months more recently, there are higher temporal resolution 321
records of wind and water level and atmospheric conditions. These data can be used to 322
identify the occurrence and frequency of high magnitude events, such as storms, that are 323
likely to have a significant influence on the coastline. 324
325
3.3.1. Modern records 326
Wind and water level records were examined from 1994 to 2010 to investigate the causes of 327
temporal and spatial variability in coastline dynamics. Hourly mean wind speed and direction 328
were obtained from Donna Nook weather station and fifteen-minute measurements of the 329
water level at Immingham tide gauge were supplied by the British Meteorological Data 330
Centre and the British Oceanographic Data Centre (BODC) respectively. Data relating to 331
water levels obtained in Chart Datum were converted to Ordnance Datum using the 332

15
conversions at Spurn Head and Skegness given by BODC (www.bodc.ac.uk). Within macro-333
tidal environments, the primary factor controlling storm impacts is the water level reached 334
during storm surges, and it must be associated with both wind speed and direction, and 335
amplitude of surge (Vasseur and Héquette, 2000). Storm surge impact will only occur during 336
high tides. To identify energetic events with potential impact on the coastline a storm surge 337
was defined as the occurrence of onshore winds (i.e. winds from 350° to 150°) ≥ 14 m s-1 338
combined with a water level ≥ 3.5 m (ODN). Offshore winds are in the range 180° to 320°, 339
with all other winds defined as alongshore. The mean of the monthly extreme water levels 340
from 1994 to 2010 was 3.88 m and 3.74 m (ODN) at Spurn Head and Skegness, 341
respectively. However, tide gauge measurements do not always reflect the hydrodynamic 342
processes operating near the coast (Masselink and Hughes, 2003; Parker and Foden, 343
2009), particularly the run-up (set-up and wave up-rush) which can reach tens of centimetres 344
along a macro-tidal beach during a storm surge. Therefore, a threshold of 3.5 m, slightly 345
lower than the mean monthly extreme water level, was selected. This also corresponds 346
approximately to the height of the interface between the foredune toe and the gentle beach 347
slope along the Lincolnshire coast. 348
349
3.3.2. Proxy records of wind strength 350
The lack of long, continuous wind records has limited exploration of the impacts of long-term 351
variations in storminess. However, given that the passage of synoptic scale storms is 352
associated with strong winds due to intense pressure gradients (Carnell et al., 1996) it may 353
be possible to use historical records of synoptic conditions to estimate long-term storminess 354
(Alexandersson et al., 2000; Wang et al., 2009; Donat et al., 2010). Studies have suggested 355
that the North Atlantic Oscillation (NAO) may control the occurrence of storm surge in the 356
Atlantic and thus potentially influence coastal morphological changes (Woolf et al., 2002; 357
O’Connor et al., 2011; Thomas et al., 2011). However, no clear associations have been 358

16
found between NAO and the extreme wind and water climate in the North Sea (Woolf et al., 359
2003; Tsimplis et al., 2005), probably due to the sheltering effect of the British Isles land 360
mass. 361
362
A method of classifying the daily circulation patterns of the British Isles (50°–60°N, 2°E–363
10°W) was developed by Lamb (1972) and has been applied to a range of west European 364
climatological and environmental studies (El-Kadi and Smithson, 1992; Wilby et al., 1997; 365
Buchanan et al., 2002). Lamb’s subjective classification used daily atmospheric pressure 366
charts to examine the surface airflow pattern and steering of the circulation system. Eight 367
main directional types are recognized as the cardinal points, and there are three main non-368
directional types: anticyclonic, cyclonic, and unclassified. Days not characterized by a single 369
weather type can be classified into one of nineteen hybrid combinations of the main types. 370
Jenkinson and Collinson (1977) subsequently designed an objective, automated version of 371
Lamb’s classification (Jones et al., 1993) to produce the Jenkinson daily weather type (JWT) 372
catalogue (also known as Circulation Weather Type; CWT). JWT is based on a 16-point grid 373
of mean sea level pressure data over the British Isles to determine numerical values or 374
indices of geostrophic wind total flow (F) and cardinal direction (D) at 0.1° intervals. 375
376
In this study, the Jenkinson daily synoptic indices from 1871 to 2010 were used as a climate 377
proxy (provided by the Climate Research Unit, University of East Anglia, UK). Wind flow 378
expressed in pressure units was converted to m s-1 (1 unit = 0.617 m s-1) and the JWT was 379
then used to determine the number of days when onshore, offshore, and alongshore winds 380
exceeding 14 m s-1 occurred. These records were used to evaluate the annual variability in 381
wind storminess at the synoptic scale. 382
383
384

17
4. Results 385
4.1. Coastal morphological changes 386
4.1.1. Flamborough Head to Gibraltar Point 387
Topographic profiles clearly highlight recent changes in coastline position (Fig. 3). There is a 388
marked contrast between the eroding Holderness cliffs of East Riding, and the accreting 389
Lincolnshire coast. Retreating sectors account for ~50.1 km out of 98.5 km (50.8%) of the 390
coastline, whereas naturally accreting sectors extend for ~25.4 km (25.8%) and artificially 391
(nourished) accreting or stable sectors represent ~23 km (23.4%). 392
393
<Fig. 3 > 394
395
On average, the Holderness cliffs retreated -28 m between the initial survey (mid-1990s) and 396
2010, but changes along this stretch of the coast varied from cliff retreat (erosion) of -89.8 m 397
at the P97 profile to an advance (accretion) of +36.9 m at the P127 profile near Spurn Head 398
between 1997 and 2010. In the north (P8-9) the coastline is near-stable due to sea defences 399
(Fig. 3: where positive values indicate accretion or seawards extension and negative values 400
indicate retreat or erosion). The mean short-term rate of retreat of the Holderness cliffs is 401
1.88 m year-1 but this varied over the survey period from -1.67 m year-1 (1990s-2005), 402
followed by more rapid erosion of -2.65 m year-1 (2005-2008) then slowing to -1.71 m year-1 403
(2008-2010). Along Spurn Head, parts of the spit extended seawards (e.g. profile P127 404
showed accretion of +37 m) and other parts eroded (narrowed). The mean rate of change 405
along Spurn Head varied from +2.84 m year-1 at P127 (centre of the spit) to -3.14 m year-1 at 406
P131 (south) between 1997 and 2010. 407
408

18
Along the Lincolnshire coast, coastline change (1994-2010) varied from retreat of -11.3 m at 409
the L2A5 profile to an advance of +191.3 m at the L2E4 profile due to the extension of the 410
saltmarsh at Saltfleetby (Fig. 3). At Donna Nook the greatest seawards advance was +17.6 411
m (L1A4) whilst at Theddlethorpe it was +37.3 m (L2D1). Further south, changes range from 412
-2.9 m at the profile L2B7 to +54.6 m at the L2C6 (just north of Skegness) between 1994 413
and 2010. 414
415
4.1.2. Specific areas of interest – trends in coastline position 1800s-2010 416
Within the sediment cell, the AOIs have very different spatial and temporal dynamics. Over 417
the past 150 years the Easington cliffs have been eroding (Fig. 4). Mean cliff retreat rate is -418
2 m year-1 but it exceeded -3 m year-1 for the periods 1854-1890, and 1969-2005. The 419
annual rate of cliff erosion decreased to -1.36 m year-1 between 2005 and 2010. The highest 420
rates of retreat occur along the southern urbanized coastal sections and locally reached -3.9 421
m yr-1 from 2008-2010 and -5.6 m yr-1 from 1952 to 1969. Over the long-term North Spurn 422
Head is eroding with a mean rate of coastline change of -1.56 m year-1 for the period 1854-423
2010 (Fig. 4). As at Easington, the highest rate of erosion measured (-4.9 m year-1) occurred 424
between 1951 and 1969. Since 1969, data from the aerial photograph analysis indicate that 425
the mean annual rate of retreat is slowing down. 426
427
<Fig. 4> 428
429
The downdrift sector of the sediment cell (2c – Lincolnshire) is dominated by sandy beaches 430
and saltmarshes (Table 2). At Donna Nook map and aerial photograph analyses indicate a 431
seaward advance of the coastline of 2.7 m year-1 (Fig. 5A). Since 1951 the rate of accretion 432
19
has been relatively constant. This AOI stretches 5.1 km alongshore but coastline advance 433
since 1891 has varied from +46 m in the north to +449 m at the southern end of the site. 434
435
<Fig. 5> 436
437
At Saltfleetby, coastline evolution was only investigated between 1994 and 2010 (section 438
3.1.2). Results indicate erosion of -1.1 m year-1 between 1994 and 2008, followed by a more 439
recent phase of accretion (Fig. 5E). The Saltfleetby AOI is characterized by extensive 440
saltmarsh partially bounded on the seaward side by sand dunes. These dunes have been 441
very dynamic and their development appears to be linked to that of the saltmarsh. Aerial 442
photograph analysis indicates both an inland migration and decrease in size of these dunes. 443
Taking the Saltfleetby AOI as a whole, the overall erosion trend reflects the morphological 444
changes of these coastal dunes. By excluding transects intersecting the dunes, the results 445
indicate that where saltmarsh dominates it is accreting at a rate of +1.15 m year-1. A gradual 446
increase in the rate of accretion was also observed from +1.36 m year-1 (1999-2005) to 447
+2.64 m year-1 (2008-2010). 448
449
South of Saltfleetby, at the Theddlethorpe AOI there is no saltmarsh, but a wide beach with 450
well-developed dunes. Within the AOI overall coastline position advanced +126 m in the 451
north increasing to c..+185 m in the south. Here the coastline is accreting rapidly at a mean 452
rate of 2 m year-1 (1891-2010). As with the other AOIs, the rate of coastline change has 453
varied through time and between 1951 and 1953 an accretion rate as high as +7.67 m year-1 454
is suggested by our analysis; however this may be over-estimated due to the change in data 455
source from the OS map (1951) to aerial photographs (1953). From the photo-interpretation 456
analysis, the rate of accretion varied with a mean annual rate from c.+3.1 m year-1 for 1976-457
20
1983 to just +0.97 m year-1 over the period 2005-2008. By considering the photo-458
interpretation results only, the mean rate of coastline accretion was of +1.9 m year-1 between 459
1953-2010, which is similar to the average estimated for the 119-year study period. 460
461
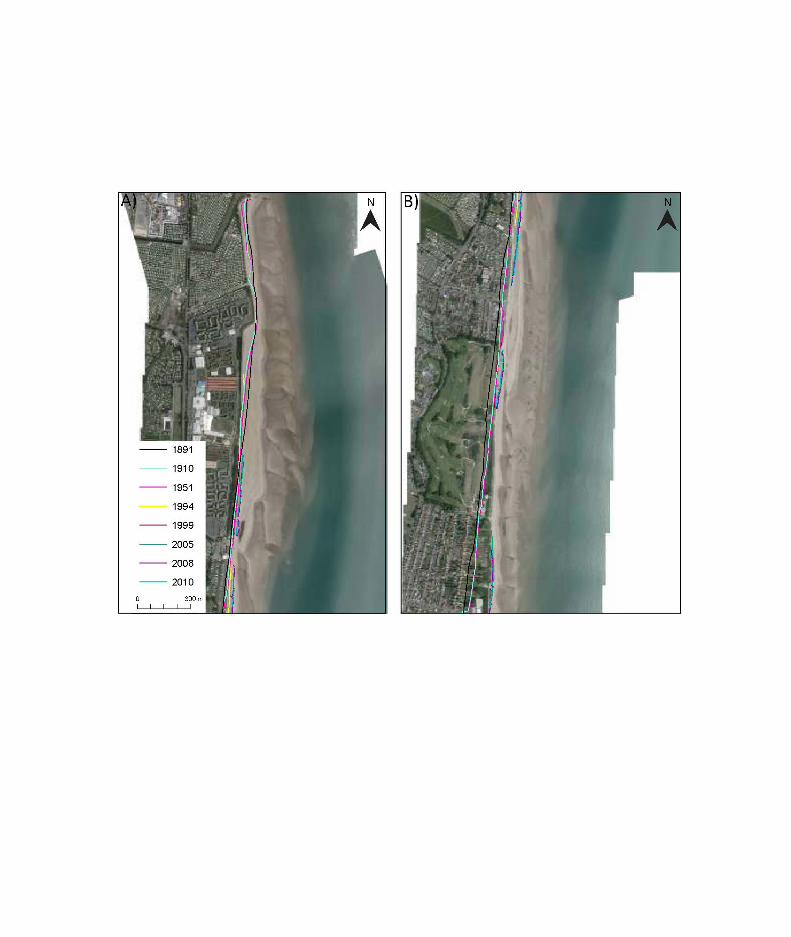
No detailed analyses of the coastline changes were undertaken along the Skegness coast 462
because it has been protected by sea defences which were installed following the 1953 463
floods and are well maintained (HECAG, 2009). Sea defences prevent or alter interactions 464
between inland and tidal zones, however since 1994 the data show accretion seaward of the 465
defences along a vegetated line which has extended both alongshore and towards the sea 466
(Fig. 6). This may be a response to a major sand nourishment programme undertaken just to 467
the north along the beach at the L2B6 profile of 210,000 m3 in 1994, with subsequent 468
replenishment in 2006 and 2007 (Environment Agency, 2008). 469
470
<Fig. 6> 471
472
4.1.3. Specific areas of interest – changes in sediment budget 1990s-2010 473
Tables 5 and 6 present the net sediment budget calculated individually for the backshore, 474
foreshore and nearshore (bathymetric) units in each of the AOIs (Fig. 2). The data shown 475
are the total gain (+) or loss (-) of sediment in m3 x 103 between successive surveys, and 476
cumulative change through time. Annual rate of change in m3 year-1 is also estimated. 477
478
<Table 5> 479
<Table 6> 480
481
21
At Easington, from 1997 to 2010 there was a cumulative sand loss of c. -66.9 ×10³ m3 for the 482
combined backshore and foreshore units (Table 4). The majority of this is accounted for by 483
cliff erosion in the backshore which is twenty-two times greater than losses from the 484
foreshore unit. North Spurn Head was also affected by overall sand loss with an erosion rate 485
of c. -1.5×10³ m3 year-1 although during specific periods both the backshore (1997-1999) and 486
foreshore (1999-2005) did gain sediment (c. -8.3×10³ m3 and 0.8 x 10³ m3 respectively). 487
488
As might be expected from the long-term coastline trends described above, the Lincolnshire 489
coast overall gained sediment from 1994-2010. At Donna Nook the results indicate an 490
annual positive budget of 49.9 ×10³ m3 year-1. The backshore displayed the greatest mean 491
accretion rate of 30.5×10³ m3 year-1, however net volume gain has fallen since 2005 with 492
sand losses between 2005 and 2008. Similarly at Saltfleetby there were volumetric gains in 493
both the backshore and foreshore from 1994 to 2005 followed by overall sediment losses 494
from 2005 to 2010. Overall Theddlethorpe gained on average c. 47.6×10³ m3 year-1 from 495
1994 to 2010 but all of the increase in sediment volume was on the backshore (c. 63. ×103 496
m3 year-1) whilst the foreshore actually lost c. -15.4×10³ m3 year-1. At Skegness there was a 497
total mean accretion of c. 21.5×10³ m3 year-1 with the greatest changes recorded in the 498
backshore unit. 499
500
For the nearshore units (Table 5) there were overall sediment gains at Donna Nook and 501
Skegness but sediment losses at Saltfleetby (-6.3×10³ m3 year-1) and Theddlethorpe (-502
35.1×10³ m3 year-1). At Theddlethorpe, interestingly the nearshore sub-unit 1 from ODN to 503
MLWS experienced a significant sand loss, whilst accretion took place in the seaward 504
nearshore unit. At Skegness the nearshore zone gained sediment in sub-unit 1 but lost 505
sediment in sub-unit 2. 506
507

22
4.2 Forcing factors 508
4.2.1. Twenty-year record 509
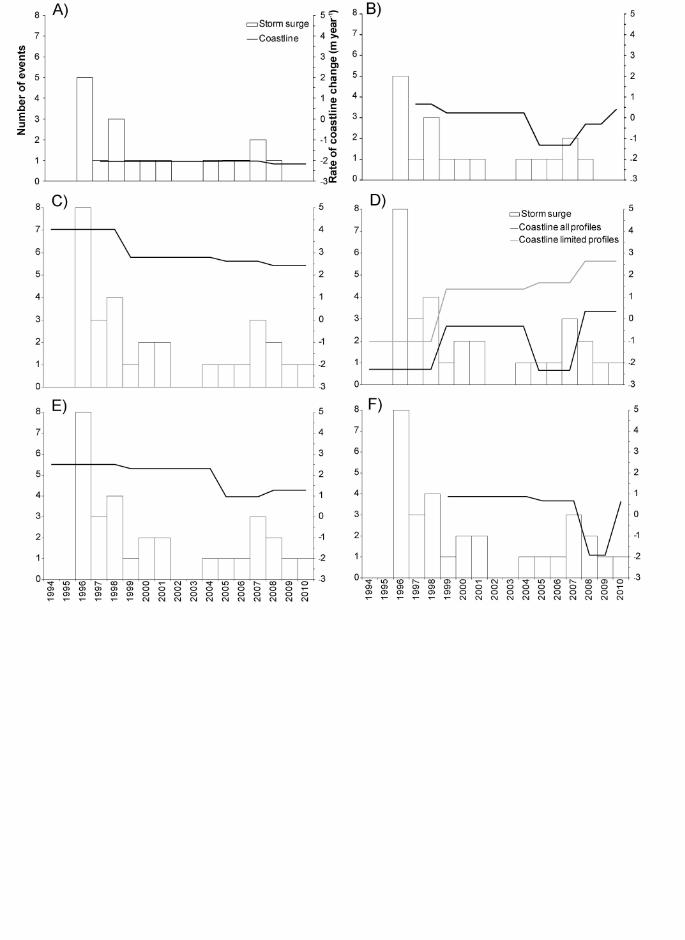
Strong onshore winds occurring during astronomical high tides result in storm surges that 510
could be responsible for coastline erosion and retreat. The analysis of forcing factors for the 511
period 1993-2009 shows water levels above 3.5 m are infrequent and no storm surge events 512
were recorded in 1994-1995 and 2002-2003 (Fig. 7). Although storm surge frequency was 513
variable, the mean rate of coastline retreat at Easington was relatively constant from 1994-514
2010. At North Spurn Head storm activity (1-5 events yr-1) from 1997-2001 coincided with a 515
phase of accretion (Fig. 7) whilst from 2002-2006 storms were less frequent and this 516
included a phase of coastline erosion of up to -1.3 m yr-1. 517
518
<Fig. 7> 519
520
Along the Lincolnshire coast, at Donna Nook (Fig. 7C) up to 8 storm surges per year 521
occurred between 1994 and 1998 and this coincided with coastline accretion of c. +4 m year-522
1. Coastal propagation subsequently continued at a slower but relatively constant rate. A 523
stormy phase from 1996-1998 coincided with saltmarsh retreat at Saltfleetby AOI of -2.3 m 524
year-1 however this slowed down to less than -0.3 m year-1 between 1999 and 2004 before 525
accelerating back to -2.3 m year-1 from 2005-2007, another storm phase. However, where it 526
is unconstrained by the coastal dunes, the saltmarsh shows significant seaward advance 527
over the last twelve years, with no clear relationships with the occurrence of storm surge 528
events. At Theddlethorpe the highest rates of coastline accretion (+2.5 m year-1) occurred 529
between 1994 and 1998 (Fig. 6E) when up to 8 storms per year were recorded. The rapid 530
coastline advance continued in the absence of frequent storm events between 1999 and 531
2004 and continued, but at a slower rate until 2010. This decrease in the rate of advance 532

23
coincided with a period of slightly higher storm surge activity. At Skegness from 1999-2004 533
the coastline (HAT level) prograded at a rate of +1 m year-1 but changed to a retreat of -2 m 534
year-1 between 2008 and 2010, possibly in response to storms in 2008. 535
536
4.2.2. Long-term record 537
Fig. 8 shows the occurrence of days with high wind speeds (storms) from 1871 to 2010 over 538
the British Isles indicated by JWT. The most frequent winds are offshore, coinciding with 539
strong westerly winds in winter. The long-term trend of strong offshore winds appears 540
relatively stable although with a slight fall in frequency in the 1960s. However, offshore winds 541
are not likely to be associated with significant storm surges. Rather storm surge will be 542
associated with strong onshore winds. From 1871-2010 the annual frequency of onshore 543
winds ≥14 m s-1 varies from zero in 1932 to 19 in 1917. The 5-year running mean indicates 544
three peaks in the onshore storm event record in 1876, 1878, and 1883. This last peak was 545
followed by a relatively stable period of 35 years. Three distinct stormy periods occurred in 546
1955-1970, 1975-1988 and 1994-2000 (Fig. 8). Strong alongshore winds typically occur on 547
fewer than 6 days per year. 548
549
<Fig. 8> 550
551
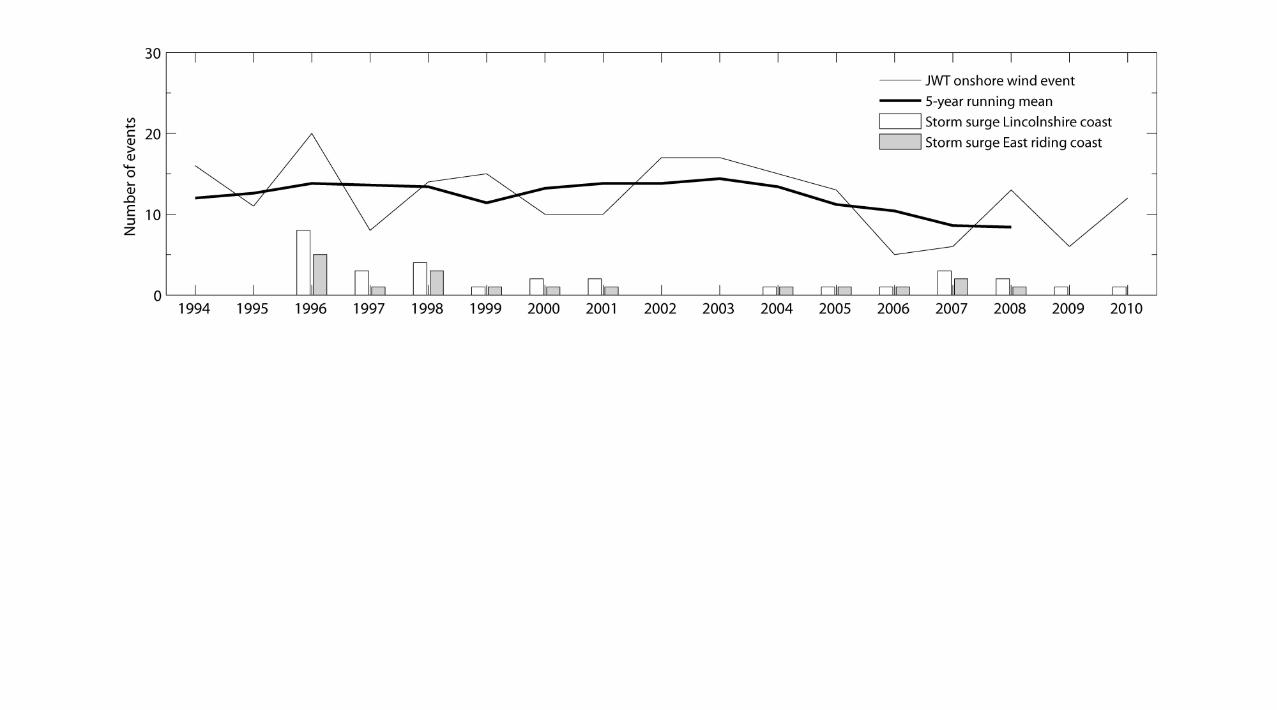
To assess the utility of the Jenkinson weather catalogue as a proxy for storm surge, a 552
correlation analysis was undertaken between the frequency of storm surges predicted per 553
year using recorded wind and tide data from 1994 to 2010 and the incidence of onshore 554
wind events exceeding 14 m s-1 predicted by JWT records for the same period. The temporal 555
patterns of storm frequency are broadly similar (Fig. 9) and high correlation coefficients are 556

24
obtained for both Skegness (r=0.52, p<0.05) and Spurn Head (r=0.58 p<0.05) suggesting 557
the Jenkinson weather catalogue may be a useful proxy for long-term storminess. 558
559
<Fig. 9> 560
561
5. Discussion 562
An examination of detailed records over the past two decades and longer historical records 563
demonstrates clear trends in erosion and accretion along the Flamborough Head to Gibraltar 564
Point coast. These trends can be ascribed to factors such as natural antecedent conditions, 565
relative position within the sediment cell (i.e. updrift/downdrift) and human activities. In this 566
discussion, we consider the short-term changes in coastline position and sediment budget 567
and their relationships with environmental forcing factors, the long term historical coastline 568
changes and finally possible response of the coastline to sea level rise. 569
570
5.1. Coastline changes from mid 1990s-2010 571
Unsurprisingly, the topographic profile data indicate rapid and significant erosion of the 572
Holderness cliffs since the mid-1990s. Spatially-averaged retreat rates suggest more rapid 573
erosion from 2005-2008 (>2.6 m yr-1) compared with preceding and following years (c. 1.7 m 574
yr-1). However, rates of cliffline recession are spatially very variable (Fig. 3). This reflects 575
localised occurrence of landslips, which typically cause a few years of increased recession 576
followed by a period of below average retreat (Pringle, 1985; Posford Duvivier, 1992), such 577
as described for profiles P78 and P95 by Quinn et al. (2009), the location of intertidal 578
sandbars which accelerate cliff erosion rates (Pringle, 1985; Pethick, 1996; Moore et al., 579
1998) and the presence or absence of offshore sand banks which reduce inshore wave 580
25
energy and hence slow retreat rates (Eurosion, 2003). Changes in the HAT level indicate 581
that, downdrift of Holderness, the north Lincolnshire beaches are accreting. Leggett et al. 582
(1998) also documented accreting beach profiles along the north Lincolnshire coast with a 583
positive change of 2% (by volume) from 1991-1996. Between Mablethorpe and Skegness, 584
the coastline has been affected by beach nourishment since 1994, and overall the HAT level 585
has undergone seaward extension. The UK Environment Agency (2011) suggests accretion 586
of the upper-beach in this location can be attributed to retention of renourishment material 587
blown up the beach. 588
589
Using topographic profiles for all the cliffed sections of the East Riding coast, we calculated 590
that the retreating cliffs have lost 1,004,755 m3 yr-1 (1000x103 m3 yr-1) of sediment since the 591
initial survey in the mid-1990s. This rate is comparable to the estimate of 1000×103 m3 year-1 592
(from 1852-1952) by Valentin (1971). ABP (1996) predicted a slightly higher cliff erosion rate 593
of up to 1400×103 m3 year-1. The combined sediment losses from both the cliffs and the 594
shoreface along the Holderness coast are estimated to be in the region 2500-3000 ×103 m3 595
year-1 (ABP, 1996; Balson et al., 1996, 1998; Eurosion, 2003), which increases to 3900-4700 596
x103 m3 year-1 if the lower seabed to the limit of erosion is included (Wingfield and Evans, 597
1998). Of this eroded material 60-80% is clays and silts, while the rest is predominantly sand 598
and gravels (Balson and Harrison, 1988; Blewett and Huntley, 1998; Townend and 599
Whitehead, 2003). Balson et al. (1998) estimated that 33% of the sediment is eroded from 600
the cliff, and 67% from the shorefaces and seabed. 601
602
Calculations for the AOI at Easington for this paper suggest the cliffs here have yielded 603
approximately 66.9×10³ m3 year-1 (Table 5). Posford Duvivier (1992) modeled the wave-604
driven littoral drift at Easington (including both sediments being transported from the 605
northern cliffs and input from Easington itself) and predicted a southward longshore sand 606
26
transport of 157-310×103 m3 year-1 from this area. Easington marks the point at which the 607
southwards travelling sand derived from erosion along the total length of the cliffs moves 608
offshore (Halcrow and Geosea, 1990), although the precise transport pathways of eroded 609
sediments will depend on their mineralogy and grain size (Newsham et al., 2002). This 610
offshore transport is a result of a combination of the change in both the orientation of the 611
coast and the direction of the tidal currents at this point. Previous studies suggest 3-6% of 612
the eroded cliff material is transported to the southern end of Holderness and incorporated in 613
to the Spurn Head spit whilst the remainder is deposited in the nearshore and offshore 614
zones (Valentin, 1971; Ciavola, 1997). 615
616
Whilst the littoral drift may input 30-60 x 103 m3 yr-1 to the spit (Valentin, 1971; Ciavola, 617
1997), our results show that erosion from North Spurn Head has the potential to supply 618
1.5×10³ m3 year-1 to areas downdrift (Table 5). The principal pathway of bedload sediment 619
material is southwards towards the nearshore sand banks of The Binks, which act as a sand 620
reservoir for Spurn Head and a buffer to erosion under energetic hydrodynamic conditions. 621
The littoral cell of interest has three sub-cells, the central one (2b; Fig. 1) being defined by 622
the Humber Estuary. The sediment budget of the Humber Estuary is complex but whilst total 623
sediment flux through the estuary mouth is very high, the net exchange between the estuary 624
and the North Sea is low (Townend and Whitehead, 2003) with estimates of sediment input 625
to the North Sea ranging from 100-255 kt yr-1 (compared with 1400-2610 kt yr-1 eroded from 626
Holderness; McCave, 1987; HR Wallingford, 1992). Only around 1% of the total sediment is 627
estimated to enter and circulate into the Humber estuary before being expelled back in to the 628
North Sea (Halcrow and GeoSea, 1990; Black and Veatch, 2004). Fine sediments eroded 629
from the updrift Holderness cliffs are transported into the estuary by the flood tide and 630
coarser sand-sized materials are moved in to the marine environment (ABP, 2000). Strong 631
tidal flows can prevent gravels and sands from crossing the Humber Estuary (HECAG, 632
2009), however, Robinson (1968) released seabed drifters from The Binks near Spurn Head, 633
27
60% of which were recovered from the south shore confirming a sediment transport pathway 634
across the mouth. Medium and fine sands can be transported across the estuary mouth 635
especially during storm conditions and build up in offshore sand banks at Donna Nook 636
(Steers, 1966; Tonk, 2000; HECAG, 2009). This deposition is reflected in this study through 637
the dominance of accretion in both the back/fore shore and nearshore zones at Donna Nook 638
where the volume of accretion is equivalent to 5.8% of the total estimated Holderness cliff 639
erosion (Tables 5, 6). Additional sediment supply to this area can come from The Binks 640
during storm surge conditions (HR Wallingford, 2002). 641
642
From the mid-1990s to 2010 the back and fore shore units at Saltfleetby and Theddlethorpe 643
have been accreting, while erosion has characterized the nearshore zone (Tables 5, 6). The 644
total annual sediment supply at Saltfleetby and Theddlethorpe is equivalent to 4.7% of that 645
eroded from the East Riding coast. At Mablethorpe, the coastline switches from accretion to 646
erosion (Schans et al., 2001) driven by a combination of exposure to wave activity (Dugdale 647
and Vere, 1993) and anthropogenic pressures (Robinson, 1964; Pye, 1995). The artificially 648
nourished coastal section from Mablethorpe to Skegness was assumed not to accumulate 649
sediment from the Holderness cliffs. Data from topographic and bathymetric profiles at 650
Gibraltar Point indicate that sediment input has been approximately 181.9×10³ m3 year-1. 651
Assuming no additional sources, this quantity would represent 18.7% of the cliff material 652
eroded to the north. Again assuming no additional sediment sources or sinks along the 653
coastline, when combined with the 5.8% input to Donna Nook and 4.7% input at Saltfleetby-654
Theddlethorpe, this suggests that only 29% of the material eroded in sediment sub-cell 2a is 655
transported ‘directly’ by the littoral drift to the Lincolnshire coast (sub-cell 2c). The majority of 656
sand material eroded from the Holderness cliffs can therefore be assumed to move offshore, 657
however the division is likely to be less clear-cut as material transported offshore to the 658
Binks and other sand banks along the Lincolnshire coast, will be redistributed by cross-shore 659

28
wave currents (Halcrow, 1988; ABP, 1996). Sediments introduced to the system during the 660
nourishment programme may also form some of the inputs to Gibraltar Point. 661
662
Over the short-term there were few storm surges where wind speed was ≥14 m s-1 and water 663
level was ≥3.5 m ODN, but the highest frequencies occurred between 1996-2001. This was 664
followed by two very calm years and then by a period of medium activity between 2004-2010 665
(Fig. 7). At Easington, retreat rates were remarkably constant whereas they varied far more 666
at North Spurn Head and along the Lincolnshire coast. Our data show a positive correlation 667
between storm surge occurrence and coastline position and between storm surge and sand 668
volume in the backshore, whereas there is a negative relationship with the sand volume in 669
the foreshore (Table 4). However, there are no clear relationships between coastline change 670
and storminess. A limitation of our data set is the relative timing of data acquisition in that it 671
rarely includes the coastline position recorded immediately before or after a storm surge, 672
however it may represent the beach morphology in calm weather conditions, and thus the 673
post-storm recovery state. 674
675
5.2. Coastal evolution from the 1800s to 2010 676
Although coastline changes determined from maps and historical aerial photographs are 677
likely to be less reliable than recent field surveys, they are necessary to determine the long-678
term evolutionary tendency of the coastline. The changes that have taken place in the 679
northern part of this sediment cell (2a) along the Holderness coast have been the subject of 680
numerous previous studies (e.g. Reid, 1885; Valentin, 1954, 1971; Dosser, 1955; Steers, 681
1966; Mason and Hansom, 1988; HECAG, 2009; Quinn et al., 2009), and beach 682
development in the far south around Gibraltar Point has also received some attention (e.g. 683
King, 1964, 1968, 1973; Barnes and King 1955; King and Barnes, 1964). There has, 684
29
however, been considerably less research in the south-central sector of the cell along the 685
north Lincolnshire coast. 686
687
In the north of the sediment cell, we determined that the southern Holderness cliffs have, on 688
average, been eroding at 2 m yr-1 since 1854 (Fig. 11). This is in agreement with previous 689
estimates of 1-2 m yr-1 over 150 years (Valentin, 1954; Mason and Hansom, 1988; Quinn et 690
al., 2009). Some research indicates that towards Flamborough Head, parts of the north of 691
the Holderness coast underwent aggradation from 1852-1952 (Valentin, 1954; Bird, 1984) 692
but analysis of recent topographic profiles (1994-2010) suggest that currently erosion is 693
taking place along the whole cliffed coastline albeit at a much more rapid rate towards the 694
south. Spurn Head has long been recognized as a very dynamic feature undergoing cyclic 695
breaching, destruction and reformation (De Boer, 1964). This paper has reported significant 696
variability in rates of erosion on North Spurn Head ranging from nearly -5 m yr-1 (1951-1969) 697
to <-0.7 m yr-1 (1890-1951 2005-2010). This most recent decrease in rates of erosion was 698
also observed by Saye et al. (2005). 699
700
In contrast, the beaches of north Lincolnshire have undergone accretion up to +2.7 m year-1 701
over the past 120 years (Fig. 11). The result agrees with the study by Halcrow (1988) which 702
indicated accretion from the late 19th century to 1970. Robinson (1984) also reported that by 703
the early 19th century the Saltfleetby-Theddlethorpe coastline was characterized by an 704
accreting coastline. One of the sediment sources for these beaches is, as mentioned above, 705
material eroded from the Holderness coast (Steers, 1946), but in addition there is onshore 706
movement of material from sand banks (Halcrow, 1988; ABP, 1996; HR Wallingford, 2002). 707
Our analysis did not indicate any general coastline retreat caused by the severe 31st 708
January-1st February 1953 North Sea storm surge, however the intervals between maps and 709
aerial photographs probably hides some short-term coastline recession. The storm surge 710
impacts in 1953 are also likely to have been reduced by the presence of coastal dunes and 711

30
the higher, wide beach along the North Lincolnshire coast (Robinson, 1953; Brampton and 712
Beven, 1987). 713
714
<Fig. 11> 715
716
5.3 Proxies for storminess 717
718
Pressure-based circulation weather types, such as the JWT used here, have been widely 719
used to examine general trends and variability in long-term storminess in Europe (e.g. 720
Alexandersson et al., 2000; Donat et al., 2011; Wang et al., 2011) and are generally more 721
reliable proxies over sea than over land (Krueger et al., 2012). We suggest JWT may 722
provide a reasonable proxy for storminess on the east coast of England. Frequencies of 723
storm events identified using JWT data are much higher than those of measured storm 724
surges (Fig. 9); this is because we have not differentiated onshore energetic events 725
associated with high tides, where storm surges would be likely, from those associated with 726
low tides where little or no impact would be expected due to the lower overall water level 727
(Chaverot et al., 2008). Accounting for water level over the longer term is something that 728
could be explored in future. Over long time periods other studies have successfully used 729
similar proxy measures of storminess, such as variations in the NAO, to explain temporal 730
patterns of coastline evolution (Vespremeanu-Stroe et al., 2007; Thomas et al., 2011; 731
O’Connor et al., 2011) which suggests analysis of the JWT data set may be worth pursuing 732
further. 733
734

31
Overall temporal patterns of storminess (all directional sectors) in the NE Atlantic and North 735
Sea since the 1870s determined using the JWT/CWT approach have shown variable, but 736
typically low, levels of storminess in the late nineteenth century and first half of the twentieth 737
century (Alexandersson et al., 2000; Wang et al., 2009) although in the central North Sea 738
(55°N 5°E) total gale days indicate high storminess in the early twentieth century (Donat et 739
al., 2011). Minimum storm activity has been put at around 1960 with maximum storminess 740
during the 1990s followed by a decline to long-term average conditions in the early 2000s 741
(Wang et al., 2009; Donat et al., 2011). This is broadly in accordance with patterns 742
determined in this paper, however due to the geomorphological research questions being 743
addressed we deconstructed the total record into specific directional sectors (onshore, 744
offshore and alongshore) and events meeting specific wind speed conditions, and these 745
components show some differences to the overall pattern. For example, the frequency of 746
JWT onshore wind storms was variable from 1871 to the 1920s (1-19 events per year), but 747
was slightly higher than the long term mean of 7 events per year. This was followed by a 748
relatively calm period of up to 35 years (Fig. 10A). Peak periods of onshore wind storm 749
events occurred during 1955-1970, 1975-1988, and from the mid-1990s to 2000. The first of 750
these peak periods contrasts with more widely-observed low levels of overall storminess 751
(which can be seen in the offshore record in Fig. 8). These peaks indicate an increase in 752
wind speeds likely to generate greater significant wave heights and these energetic periods 753
are broadly coincident with the highest rates of coastal erosion recorded between 1854-1890 754
and 1951-1969 at Easington and North Spurn Head (Fig. 10). The JWT storm event 755
frequency decreased after 2005, which coincides with a decrease of coastline recession 756
rates at these sites. Within a littoral sediment cell with a defined sediment budget, erosion of 757
material in one part of the cell should lead to accretion elsewhere within the cell; accordingly 758
high recession rates along the Easington cliffs between 1891-1910 and 1976-1983 were 759
concomitant with the highest rates of coastline accretion recorded at Donna Nook (1891-760
1910) and Theddlethorpe (1976-1983), and from 1994-2005 at both sites (Fig. 10). In 761
contrast, the recent decrease in cliff retreat from 2005-2010 may be the cause of the lower 762

32
rates of seaward accretion along the North Lincolnshire sandy beaches over the same 763
period. In the study region our long-term data set only provides reliable information 764
concerning longshore coastal changes, however, as discussed in section 5.1, the short-term 765
(decadal) data indicate cross-shore sediment transport to and from offshore stores such as 766
sand banks is substantial. As with other regions, such as the Columbia River Littoral Cell 767
(Ruggiero et al., 2005), lack of cross-shore transport data makes it difficult to make long-768
term sediment budget calculations. 769
770
Within our data, one particular period of interest is that between the 1900s and 1951 where 771
rates of coastline change throughout the sediment cell were very low. This broadly coincides 772
with a long period of low frequencies of annual wind storms (1920-1955). Both the 773
geomorphological and climatological records suggest there was a period of quiescence 774
lasting ~35 years in the first half of the 20th century. Previous research has identified strong 775
correlations between storminess in the NE Atlantic (including the North Sea) and NAO (e.g. 776
Wang et al., 2009), but in the methods we indicated that winter NAO was not a good 777
indicator of storminess on the east coast of England. Positive winter NAO phase leads to 778
enhanced westerlies due to a stronger than usual sub-tropical high pressure centre and a 779
deeper than normal Icelandic low (Hurrel, 1995) and most storms identified using CWT are 780
associated with westerly flow (Donat et al., 2010). Between 1900s and 1950, winter NAO 781
phase was positive with consecutive strong positive phases between 1900-1915 and 1915-782
1930 (Fig. 10B). Over this period, the occurrence of storm events, affecting the North 783
Atlantic west-facing coast would be expected to have increased, whereas the east coasts 784
would be relatively sheltered. It can be suggested, therefore, that although positive NAO 785
phase may not indicate storminess on the east coast of England, it could provide a useful 786
proxy for quiescence. The advantage of using JWT/CWT data sets is that they can be 787
focused on specific directional sectors (in this case winds from the north and the eastern 788
sector (N, NE, E, SE) which is important in the context of understanding the impact of events 789

33
on the coastline. Although the JWT approach was originally developed for the British Isles 790
(Lamb, 1972) it has been successfully applied to other regions including the Netherlands 791
(Buishandt and Brandsma, 1997), Spain (Goodess and Palutikof, 1998, Lorenzo et al., 792
2008), Portugal (Trigo and Dacamara, 2000) and Morocco (Born et al., 2010) in research 793
focusing primarily on precipitation and catchment scale flooding. This paper, and other 794
recent studies using circulation weather types to examine wind storms (e.g. Wang et al. 795
2009; Donat et al., 2011), suggest that they could provide a valuable data source for 796
interpreting long-term coastal geomorphological change throughout northwest Europe. 797
798
The use of JWT/CWT data merits further exploration but low levels of storminess are not 799
likely to explain fully the relatively static nature of the coastline from 1900 to 1950. Other 800
possibilities are a redistribution of sediments, for example there was a natural extension of a 801
barrier located seaward of the centre of the Spurn spit during the 18th and 19th centuries 802
(Halcrow, 2002) which may have lead to a reduction in sand volume reaching beaches in 803
north Lincolnshire as the barrier extended (Pye and Blott, 2010). In addition, this coast has a 804
long history of defence. Hard coastal defences were built on sections of the Holderness 805
coast such as Hornsea, Mappleton, Withernsea and Easington in the late 19th century and 806
may have temporarily reduced or stopped the cliff retreat; the construction of a groyne field 807
is also likely to have impeded the littoral drift of sediment (Pye and Blott, 2010). In 1883/84, 808
further groynes and timber revetments were built to prevent breaching and erosion along 809
Spurn Head. Spurn Head was a military stronghold during the second world war and coastal 810
defences were built along the seaward side (De Boer, 1981), which are likely to have 811
reduced alongshore sand transport to the south. These were abandoned and fell in to 812
disrepair in the 1960s. 813
814
815
5.4. Response of the coastline to sea-level rise 816
34
There are number of challenges associated with predicting the response of sediment cell 817
and landform dynamics to climate change and sea-level rise. One of the most important is 818
obtaining historical records over sufficiently long time periods for accurate change detection, 819
particularly given that in many littoral cells short-term changes can occur at a very different 820
rate, or even show the opposite trend, to long-term change (Ruggiero et al., 2005; Brooks 821
and Spencer, 2012). In addition, as demonstrated here, because both cliff and beach 822
systems can exhibit considerable alongshore variability in rates of change, and because 823
sediment processes acting over a larger area can influence local scale change, the spatial 824
scale needs to extend over at least the sub-cell and ideally the whole coastal cell (Ruggiero 825
et al., 2005; Neill et al., 2008; Quinn et al., 2009). In this study, the time interval between 826
data sets (years to decades) and the length of time between the earliest and the most recent 827
data set (>110 years) means the impact of short-term change is minimised; there are clear 828
directional changes at most of the AOIs examined (with the exception of Spurn Head). Over 829
the historical period coastline dynamics in the downdrift sector of the sediment cell (2c) have 830
been controlled by the supply of sand material from the updrift section of the cell (2a), the 831
eroding Holderness coast. During periods of more rapid cliff retreat, rates of coastline 832
progradation have been higher on the Lincolnshire coast; when cliff retreat is slowed, such 833
as during the early twentieth century, rates of accretion downdrift are reduced. For the 834
central sub-cell (2b) historical data used to reconstruct changes in the volume of the Humber 835
estuary since 1851 suggest an overall period of infilling prior to 1940 followed by erosion up 836
to 2000 (although data sources prior to 1936 were incomplete) however there has been no 837
significant change in average flow rates over the last century (Townend et al., 2007). 838
839
A number of studies has examined and modelled the likely response of other sectors of the 840
east coast of England (notably sediment cell 3; East Anglia) to future environmental change 841
(Dickson et al., 2007; Dawson et al., 2009; Brooks and Spencer, 2012). Sea level is 842
predicted to rise at an accelerated rate in future (IPCC, 2007) and there is a range of 843

35
possible responses of cliffs to sea-level rise varying from increased retreat rate to decreased 844
retreat rate or no change (Ashton et al., 2011), but sea-level rise is not the only controlling 845
factor on cliff retreat (e.g. Lim et al., 2010). Storm frequency and magnitude are also 846
predicted to increase and will probably heighten coastal erosion as well as flooding on low-847
lying coasts (Webster et al., 2005; Bindoff et al., 2007; Chini et al., 2010). Dickson et al. 848
(2007) and Brooks and Spencer (2012) used historical data for retreating sectors of the East 849
Anglian coast (Norfolk and Suffolk respectively; both sediment cell 3) to test models for 850
predicting coastline response to sea level rise. Brooks and Spencer (2012) found that the 851
longer the time period for which historical (baseline) data were available, the better the 852
predictions, but importantly found that a single spatially-averaged estimate of retreat 853
performed poorly because the alongshore variation in retreat rates was not accounted for. 854
On the Norfolk coast, models of historical change captured the measured patterns of erosion 855
in the cliffed sectors (e.g. from Weybourne to Eccles) and deposition along the 856
unconsolidated coastline from Eccles to Winterton Ness, and a similar pattern of cliff 857
recession and beach volume increase is predicted under a variety of sea level change and 858
management scenarios (Dickson et al., 2007). In sediment cell 2, it could be assumed that 859
the future rate of cliff erosion and sediment supply will be similar to present day rates 860
(Newsham et al., 2002; Black and Veatch, 2004), although whilst this may be an appropriate 861
assumption at Easington where rates of erosion have been relatively stable for 150 years, at 862
sites such as Spurn Head future behaviour is likely to be harder to predict (Scott and Wilson, 863
2009). Spurn Head above the upper-intertidal zone is expected to migrate westward, but it 864
is unlikely to extend further south due to the forcing effects of tidal flows and overwashing 865
events that occur during storm surges (East Riding Council, 2004). Models applied to cell 3 866
suggest that broad spatial patterns of erosion and retreat are likely to continue over the 867
twenty-first century and, similarly; in cell 2 sand eroded from the Holderness cliffs is likely to 868
continue to supply the North Lincolnshire coastline causing ongoing accretion. At present, 869
whilst the Holderness coast has some coastal defences these are insufficient to prevent cliff 870
erosion and the current Shoreline Management Plan recommends letting natural processes 871

36
continue except in localised areas where town frontages and infrastructure require protection 872
(HECAG, 2009). Similarly, along the Lincolnshire coast defences are minimal north of 873
Mablethorpe and continued coastal progradation will likely allow this to continue during the 874
current century even under predicted sea-level rise. A largely unknown factor, and one for 875
which there are fewer long-term historical records from which to make predictions, is the 876
impact of cross-shore sediment transport to and from the offshore sand banks. As indicated 877
in section 5.1 offshore sediment transport is substantial and the offshore sand banks play an 878
important role not only in supplying sand to the coastline, but also in reducing wave energy 879
(Steers, 1966; Motyka and Brampton, 1993; Blott and Pye, 2004, Brooks and Spencer, 880
2012) which may impact both coastline recession and progradation rates. 881
882
6. Conclusions 883
Spatial and temporal variability in coastline position, rate of change and sediment budget 884
were assessed within a single sediment cell. There have been clear trends in erosion and 885
accretion from Flamborough Head to Gibraltar Point over the past 150 years and the 886
different parts of the sediment cell are clearly connected. High rates of erosion updrift (2a) 887
are associated with high rates of accretion downdrift (2c) and periods of relative stability in 888
these two sections of the sediment cell are broadly coincident. The volume of sediment 889
incorporated in to the accreting beaches represents around 29% of that eroded from the 890
Holderness cliffs. The results highlight the importance of understanding the variable 891
dynamics of different types of landform occurring within a single sediment cell (e.g. cliffs, 892
dune-backed beaches). Erosion on sandy beaches is often an outcome of storm surges, 893
however where the storm causes the release of large quantities of sediment updrift within 894
the sediment cell, this erosion may be mitigated or, in the case of north Lincolnshire, result in 895
accretion due to the increased sediment supply to areas downdrift. 896
897

37
Overall temporal patterns of storminess in the north Atlantic and North Sea can be identified 898
using pressure-based continental weather types. An exploration of the use of the Jenkinson 899
Daily Weather Type as a proxy for storm surges over the historical record suggests that by 900
deconstructing the data into specific directional sectors, to account for onshore-, offshore- 901
and alongshore-directed events, useful information on long-term patterns of storminess and 902
its potential impacts on specific coasts can be obtained. The performance of such weather 903
type data for predicting the geomorphological impacts of storm surges would probably be 904
improved by incorporating information about water level with the wind record. 905
906
907
908
38
Acknowledgments 909
This research was funded by The Crown Estate in association with The National Maritime 910
Museum under a Caird-Crown Estate Research Fellowship awarded to A. Montreuil in 2010. 911
The authors also would like to thank following organizations and individuals for providing 912
aerial photograph, field profile data: David Welsh of the Environment Agency, Neil Mclachlan 913
of the East Riding Yorkshire Council. Historical aerial photographs were supplied by Roger 914
Briggs of Natural England, and the English Heritage of National Monument record. 915
Jenkinson weather catalogue was provided by the Climatic Research Unit of the UEA, and 916
Dr Harpham is thanked for his exceptionally efficiency. 917
918
919

39
References 920
Aagaard, T., Nielsen, J., Gro Jensen, S., Friderichsen, J., 2004. Longshore sediment 921
transport and coastal erosion at Skallingen, Denmark. Danish Journal of Geography 104, 5-922
14. 923
ABP, 1996. Southern North Sea Sediment Transport Study, Literature review and 924
conceptual sediment transport model. Report R546, ABP Research and Consultancy Ltd, 925
Southampton. 926
Alexandersson, H., Tuomenvirta, H., Schmith, T., Iden, K. 2000. Trends of storms in NW 927
Europe derived from an updated pressure data set. Climate Research 14, 71-73. 928
Anthony, E.J., Ruz, M.H., Vanhée, S., 2006. Morphodynamics of intertidal bars on a 929
megatidal beach, Merlimont, northern France. Marine Geology 208, 73–100. 930
Ashton, A.D., Walkden, M.J.A., Dickson, M.E. 2011. Equilibrium responses of cliffed coasts 931
to changes in the rate of sea level rise. Marine Geology 284, 217-229. 932
Balson, P.S., Tragheim, D., Newsham, R., 1998. Determination and prediction of sediment 933
yields from recession of the Holderness coast, eastern England. Proceedings of the 33rd 934
MAFF Conference River and Coastal Engineers, London, pp. 4.5.1-4.6.2. 935
Balson, P.S., Tragheim,D., Newsham, R., 1996. A photographic technique to determine the 936
potential sediment yield from recession of the Holderness coast, UK, in Taussik, J., Mitchell, 937
J. (Eds.) Partnership in Coastal Zone Management. Samara Publishing Ltd, Cardigan, pp. 938
507-514. 939
Balson, P.S., Harrison, D.J., 1988. Marine aggregate survey Phase 1: Southern North Sea, 940
British Geological Survey, Marine report 86/38. 941
Barnes, F.A., King, C.A.M., 1953. The storm flood of 1st February, 1953 II, The Lincolnshire 942
coastline and the 1953 storm flood. Geography 38, 141-160. 943
Barnes, F.A., King, C.A.M., 1955. Beach changes in Lincolnshire since the 1953 storm 944
surge. East Midland Geographer 1, 18-28. 945
Bindoff, N.L., Willebrand, J., 2007. Observations: Oceanic Climate Change and Sea Level. 946
in: Solomon, S., D. Qin, M. Manning, Z. Chen, M. Marquis, K.B. Averyt, M. Tignor and H.L. 947
Miller. (Eds.), Climate Change 2007: The Physical Science Basis. Contribution of Working 948
Group I to the Fourth Assessment Report of the Intergovernmental Panel on Climate 949
Change. Cambridge University Press, pp. 387-429. 950

40
Bird, E., 1984. Coasts. Basil Blackwell, New York. 951
Black and Veatch Ltd., 2004. Humber Estuary Shoreline management plan phase 2, 952
summary of geomorphology studies. Report produced for Environment Agency. 953
Blewett, J., Huntley, D. 1998. Measurement of suspended sediment transport processes in 954
shallow water off the Holderness coast, UK. Marine Pollution Bulletin 37, 134-143. 955
Blott, S.J., Pye, K., 2004. Morphological and sedimentological changes on an artificially 956
nourished beach, Lincolnshire, UK. Journal of Coastal Research 20, 241-233. 957
Born, K., Fink, A.H., Knippertz, P. 2010. Meteorological processes influencing the weather 958
and climate of Morocco. In: Speth, P., M. Christoph, B. Diekkruger, M. Bollig, A.H. Fink, H. 959
Goldbach, T. Heckelei, T., G. Menz, B. Reichert, M. Rossler (eds). Impacts of Global 960
Change on the Hydrological Cycle in West and Northwest Africa. Springer, Berlin, 150-163. 961
Bowen, A.J., Inman, D.L., 1966. Budget of littoral sands in the vicinity of Point Arguello, 962
California. Coastal Engineering Research Centre. Technical Memorandum 19, 41 pp. 963
Brampton, A.H., Beven, S.M., 1987. Beach changes along the coast of Lincolnshire, U.K 964
(1959-1985). Proceedings on Coastal Sediments 87. Am. Society of Civil Engineers, 539-965
554. 966
Brooks, S.M., Spencer, T., 2010 Temporal and spatial variations in recession rates and 967
sediment release from soft rock cliffs, Suffolk coast, UK. Geomorphology 124, 26-41. 968
Brooks, S.M., Spencer, T. 2012. Shoreline retreat and sediment release to accelerating sea 969
level rise: measuring and modeling cliffline dynamics on the Suffolk Coast, UK. Global and 970
Planetary Change 80-81, 165-179. 971
Bryant, E.A., 1988. Storminess and high tides beach change, Stanwell Park, Australia, 1943-972
1978. Marine Geology 79, 171-187. 973
Buchanan, C.M., Beverland, I.J., Heal, M.R., 2002. The influence of weather-type and long-974
range transport on airborne particle concentrations in Edinburgh, UK. Atmospheric 975
environment 36, 5343-5354. 976
Buishand, A., Brandsma, T. 1997. Comparison of circulation classification schemes for 977
predicting temperature and precipitation in the Netherlands. International Journal of 978
Climatology 17, 875-889. 979
41
Carnell, R.E., Senior, C.A., Mitchell, J.F.B., 1996. An assessment of measures of 980
storminess: simulated changes in northern hemisphere winter due to increasing CO2. 981
Climate Dynamics 12, 467-476. 982
Chaverot, S. Héquette, A., Cohen, O., 2008. Changes in storminesss and shorline evolution 983
along the northern coast of France during the second half of the 20th century. Zeitschrift fuer 984
Geomorphologie 52, 1-20. 985
Chini, N., Stansby, P., Leake, J., Wolf, J., Roberts-Jones, J., Lowe, J. 2010. The impact of 986
sea level rise and climate change on inshore wave climate: a case study for East Anglia 987
(UK). Coastal Engineering 57, 973-984. 988
Ciavola, P., 1997. Coastal dynamics and impact of coastal protection works on the Spurn 989
Head spit (UK). Catena 30, 369-389. 990
Cooper, J.A.G., McKenna, J., Jackson, D.W.T, O’Connor, M., 2007. Mesoscale coastal 991
behavior related to morphological self-adjustment. Geology 35, 187-190. 992
Cooper, N.J., Hooke, J.M., Bray, M.J. 2001. Predicting coastal evolution using a sediment 993
budget approach: a case study from southern England. Ocean and Coastal Management 44, 994
711-728. 995
Cooper, N.J., Pontee, N.I., 2006. Appraisal and evolution of the littoral ‘sediment cell’ 996
concept in applied coastal management: experiences from England and Wales. Ocean and 997
Coastal Management 49, 498-510. 998
Cracknell, A.P., 1999. Remote sensing techniques in estuaries and coastal zones an update. 999
International Journal of Remote Sensing 19, 485–496. 1000
Dawson, R.J., Dickson, M.E., Nicholls, R.J., Hall, J.W., Walkden, M.J.A., Stansby, P.K., 1001
Mokrech, M., Richards, J., Zhou, J., Milligan, J., Jordan, A., Pearson, S., Rees, J., Bates, 1002
P.D., Koukoulas, S., Watkinson, A.R. 2009. Integrated analysis of risks of coastal flooding 1003
and cliff erosion under scenarios of long term change. Climatic Change, 95, 249-288. 1004
De Boer, G., 1964. Spurn head, its history and evolution. Transactions of the Institute of 1005
British Geographers 34, 71-89. 1006
De Boer, G., 1981. Spurn Point since 1849, in: Neale, J., Flenley, J. (Eds.), The Quaternary 1007
in Britain. Pergamon Press, Oxford, pp. 206-215. 1008
DEFRA, 2006. Shoreline management plan guidance Volume 1: aims and requirements, 44 1009
pp. 1010

42
Dickson, M.E., Walkden, M.J.A., Hall, J.W. 2007. Systemic impacts of climate change on an 1011
eroding coastal region over the twenty-first century. Climatic Change 84, 141-166. 1012
Dolan, R., Fester, M.S., Holme, S.J., 1991. Temporal analysis of shoreline recession and 1013
accretion. Journal of Coastal Research 7, 723–744. 1014
Dolata, L.F., Roeckner, E., Behr, H., 1983. Prognostic storm surge simulation with a 1015
combined meteorological/oceanographic model. North Sea Dynamics, in: Sündermann, J., 1016
Lenz, W. (Eds.), North Sea Dynamics. Springer-Verlag, pp. 266–278. 1017
Donat, M.G., Leckebusch, G.C., Pinto, J.G., Ulbrich, U. 2010. Examination of wind storms 1018
over Central Europe with respect to circulation weather types and NAO phases. International 1019
Journal of Climatology 30, 1289-1300. 1020
Donat, M.G., Renggli, D., Wild, S., Alexander, L.V., Leckebusch, G.C., Ulbrich, U. 2011. 1021
Reanalysis suggests long-term upward trends in European storminess since 1871. 1022
Geophysical Research Letters 38, L14703. 1023
Dossor, J., 1955. The coast of Holderness: the problem of erosion, Proceedings of the 1024
Yorkshire Geological Society 30, 133-145. 1025
Douglas, B. C., Crowell, M., 2000. Long-Term Shoreline Position Prediction and Error 1026
Propagation’. Journal of Coastal Research 16, 145–152. 1027
Dugdale, R. E., Vere, A., 1993. Saving Lincolnshire’s beaches. East Midland Geographer 1028
16, 31-32. 1029
Dugdale, R.E., 1980. Nearshore sandbanks and foreshore accretion on the south 1030
Lincolnshire coast. East Midland Geographer 7, 49-63. 1031
East Riding Council, 2004 Coastal processes, pp. 1-4. 1032
El-Kadi, A.K.A., Smithson, P.A., 1992. Atmospheric classifications and synoptic climatology. 1033
Progress in Physical Geography 16, 432-455. 1034
Environment Agency, 2004. Lincshore 2005 to 2010 PAR Volume 1, Strategy For Approval. 1035
Report to Environment Agency, Anglian Region, Peterborough. Halcrow, Swindon. 1036
Environment Agency, 2008. Anglian Coastal Monitoring Programme, Coastal Trend 1037
Analysis, Lincolnshire Subcells 2b-c _Grimsby to Gibraltar Point, 63 pp. 1038
Environment Agency, 2011. Anglian coastal monitoring programme, Lincshore coastal 1039
morphology report 2006-2011, 35 pp. 1040
43
Eurosion, 2003. Holderness coast, UK, Eurosion case study, DHV group, 22 pp. 1041
Gardline, 2008. Lincolnshire coastline bathymetric/beach survey, summer 2008, survey 1042
report Ref 7689, 19 pp. 1043
Gelfenbaum, G., Kaminsky, G.M. 2010. Large-scale coastal change in the Columbia River 1044
littoral cell : an overview. Marine Geology 273, 1-10. 1045
Goodess, C.M., Palutikof, J.P. 1998. Development of daily rainfall scenarios for southeast 1046
Spain using a circulation-type approach to downscaling. International Journal of Climatology 1047
10, 1051-1083. 1048
Guillén, J., Stive, M.J.F., Capobianco, M., 1999. Shoreline evolution of the Holland coast on 1049
a decadal scale. Earth Surface Processes and Landforms 24, 517-536. 1050
Halcrow and GeoSea Consulting, 1990. The Anglian Sea Defence Management Study - 1051
Phase III. Field Survey Report. Volume 3. Estuary Sediment Trends. GeoSea Consulting, 1052
Cambridge. 1053
Halcrow, 1988. The sea defence management study for the Anglian region, study report Sir 1054
William Halcrow & Partner Ltd, Swindon, UK. 1055
HECAG, 2009. Flamborough Head to Gibraltar Point Shoreline Management Plan, Scott 1056
Wilson, 182 pp. 1057
Hooke, J.M., Bray, M.J. 1995. Coastal groups, littoral cells, policies and plans in the UK. 1058
Area 27, 358-368. 1059
Hooke, J.M., Bray, M.J., Carter, D.J. 1996. Sediment transport analysis as a component of 1060
coastal management – a UK example. Environmental Geology 27, 347-357. 1061
HR Wallingford, 1992. Particulate pollutants in the North Sea. Report SR 292. Hydraulics 1062
Research Wallingford. 1063
HR Wallingford, 2002. Southern North Sea Sediment transport Study Phase, Sediment 1064
Transport Report EX 4526, 93 pp. 1065
Hurrel, J.W., 1995. Decadal trends in the North Atlantic Oscillation: regional temperatures 1066
and precipitation. Science 269, 678-679. 1067
Inman, D.L., Frautschy, J.D., 1966. Littoral processes and the development of shorelines. 1068
Proceedings Coastal Engineering Conference, ASCE, pp. 511-536. 1069
44
IPCC, 2007. Climate Change 2007: Impacts, Adaptation and Vulnerability. in: M.L. Parry, 1070
O.F. Canzioni, J.P. Palutikof, J.P. van der Linden, C.E. Hanson (eds) Contribution of 1071
Working Group II to the Fourth Assessment Report of the Intergovernmental Panel on 1072
Climate Change. Hanson, Cambridge University Press., pp. 7-22. 1073
Iskander, M.M., Frihy, O.E., EL Ansary, A.E., El Mooty, M.M.A., Nagy, H.M., 2007. Beach 1074
impacts of shore-parallel breakwaters backing offshore submerged ridges, Western 1075
Mediterranean Coast of Egypt. Journal of Environmental Management 85, 1109–1119. 1076
James, L.A., Hodgson, M.E., Ghoshal, S., Megison Latiolais, M., 2012. Geomorphic change 1077
detection using historic maps and DEM differencing: the temporal dimension of geospatial 1078
analysis. Geomorphology 137, 181-198. 1079
Jenkinson, A.F., Collinson, B.P., 1977. An initial climatology of gales over the North Sea. 1080
Synoptic Climatology Branch Memorandum 62, Meteorological Office, Bracknell. 1081
Jones, P.D., Hulme, M., Briffa, K.R., 1993. A comparison of Lamb circulation types with an 1082
objective classification scheme. International Journal of Climatology 13, 655–663. 1083
Kaminsky, G. M., Ruggiero, P., Buijsman, M.C., McCandless, D., Gelfenbaum, G., 2010. 1084
Historical evolution of the Columbia River littoral cell. Marine Geology 273, 96-126. 1085
King, C.A.M., 1964. The character of the offshore zone and its relationship to the foreshore 1086
near Gibraltar Point, Lincolnshire. East Midland Geographer 3, 230-243. 1087
King, C.A.M., 1968. Beach measurements at Gibraltar Point, Lincolnshire. East Midland 1088
Geographer 4, 295-300. 1089
King, C.A.M., 1973. Dynamics of beach accretion in south Lincolnshire, England. In: D.R. 1090
Coates (ed) Coastal Geomorphology. Proceedings of the 3rd Annual Geomorphology 1091
Symposium Series, Binghampton, New York. 73-98. 1092
King, C.A.M., Barnes, F.A., 1964. Changes in the configuration of the inter-tidal beach zone 1093
of part of the Lincolnshire coast since 1951. Zeitschrift für Geomorphologie 8, 105-126. 1094
Krueger, O., Von Storch, H., 2012. The informational value of pressure-based single-station 1095
proxies for storm activity. Journal of Atmospheric and Oceanic Technology 29, 569-580. 1096
Lamb, H.H., 1972. British Isles Weather Types and a Register of the Daily Sequence of 1097
Circulation Patterns, 1861–1971. Geophysical Memoir 116, HMSO, London, 85 pp. 1098

45
Lee, M., 2001. Coastal defence and the Habitats Directive: predictions of habitat change in 1099
England and Wales. Geographical Journal 167, 39-56. 1100
Leggett, D.J., Lowe, J.P., Cooper, N.J., 1998. Beach evolution on the Southern Sea coast. 1101
Coastal Engineering 26, 2759-2772. 1102
Lim, M., Rosser, N.J., Allison, R.J., Petley, D.N. 2010. Erosional processes in the hard rock 1103
coastal cliffs at Staithes, North Yorkshire. Geomorphology 114, 12-21. 1104
Longley, P.A., Goodchild, M.F., Maquire, D.J., Rhind, D.W., 2005. Geographic Information 1105
Systems and Science 2nd edition, Wiley, London. 1106
Lorenzo, M.N., Taboada, J.J., Gimeno, L. 2008. Links between circulation weather types and 1107
teleconnection patterns and their influence on precipitation patterns in Galicia (NW Spain). 1108
International Journal of Climatology 28, 1493-1505. 1109
McCave, I.N. 1987. Fine sediment sources and sinks around the East Anglian coast. Journal 1110
of the Geological Society of London 144, 149-152. 1111
MAFF 1994. Shoreline Management Plans: a guide for operating authorities. Ministry of 1112
Agriculture, Fisheries and Food and the Welsh Office, London. 1113
Mason, S.J., Hansom, J.D., 1988. Cliff erosion and its contribution to a sediment budget for 1114
part of the Holderness coast, England. Shore and Beach 56 (4), 30-38. 1115
Masselink, G., Hughes, M.G., 2003. Introduction to Coastal Processes and Geomorphology, 1116
Hodder Arnold, Hodder Headline Group, London. 1117
Maune, D.F. 2007. Digital Elevation Model Technologies and Applications: The DEM Users 1118
Manual 2nd edition. American Society for Photogrammetry and Remote Sensing, Bethesda. 1119
May, V., Hansom, J., 2003. Coastal Geomorphology of Great Britain. No. 28 in Geological 1120
Conservation Review Series. Joint Nature Conservation Committee, Peterborough 1121
Moore, T., Morris, K., Blackwell, G., Gibson, S., Stebbing, A., 1998. An expert system for 1122
integrated coastal zone management: a geomorphological case study. Marine Pollution 1123
Bulletin 37, 361-370. 1124
Morton, R.A., and Sallenger, A.H., Jr., 2003. Morphological impacts of extreme storms on 1125
sandy beaches and barriers. Journal of Coastal Research 19, 560-573. 1126
Motyka, J.M., Brampton, A.H., 1993. Coastal mapping-mapping of Littoral cells, Technical 1127
report SR 328, HR Wallingford Ltd, 102 pp. 1128

46
Neill, S.P., Elliott, A.J., Hashemi, M.R. 2008. A model of interannual variability in beach 1129
levels. Continental Shelf Research 28, 1769-1781. 1130
Newsham, R., Balson, P.S., Tragheim, D.G., Denniss, A.M., 2002. Determination and 1131
prediction of sediment yields from recession of the Holderness Coast, NE England. Journal 1132
of Coastal Conservation 8, 49-54. 1133
O’Connor, M.C., Cooper, J.A.G., Jackson, D.W.T., 2011. Decadal behavior of tidal inlet-1134
associated beach systems, northwest Ireland in relation to climate forcing. Journal of 1135
Sedimentary Research 81, 38-51. 1136
O’Connor, M.C., Lymberry, G., Cooper, J.A.G., Gault, J., McKenna, J. 2009. Practice versus 1137
policy-led coastal defence management. Marine Policy 33, 923-929. 1138
Orford, J.D., Carter R.W.G., Jennings S.C., Hinton A.C. 1995. Processes and timescales by 1139
which a coastal gravel-dominated barrier responds geomorphologically to sea-level rise: 1140
Story Head barrier, Nova Scotia. Earth Surface Processes and Landforms 20, 21-37. 1141
Orford, J.D., Cooper, A.G., McKenna, J., 1999. Mesoscale temporal changes to foredunes at 1142
Inch Spit, south-west Ireland. Zeitschrift für Geomorphologie 43 (4), 439-461. 1143
Orford, J.D., Pethick, J., 2006. Challenging assumption of future coastal habitat development 1144
around the UK. Earth Surface Processes and Landforms 31, 1625-1642. 1145
Pajak, M.J., Leatherman, S., 2002. The high water line as shoreline indicator. Journal of 1146
Coastal Research 18, 329-337. 1147
Parker, J.A., Foden, D., 2009. High-resolution measurement of a North Sea storm surge. 1148
Journal of Coastal Research SI 56, 1656-1660. 1149
Pethick, J., 2001. Coastal management and sea-level rise. Catena 42, 307-322. 1150
Pethick, J S., 1994. Humber estuary and coast – management issues. Report by: Institute of 1151
Estuarine and Coastal Studies, University of Hull, for Humberside County Council. 1152
Pethick, J.S. 1996. Coastal slope development: temporal and spatial periodicity in the 1153
Holderness cliff recession. In Anderson, M.G., Brooks, S.M. (eds). Advances in Hillslope 1154
Processes. Wiley, Chichester, vol. 2, 897-917. 1155
Posford Duvivier, 1992. Easington Coast Protection. Report to Holderness Borough Council. 1156
Posford Duvivier, Peterborough. 1157
47
Pringle, A.W., 1985. Holderness coast erosion and the significance of ords. Earth Surface 1158
Processes and Landforms 10, 107-124. 1159
Pye, K., 1983. Coastal dunes. Progress in Physical Geography, 31, pp 249-266. 1160
Pye, K., 1995. Controls on long-term saltmarsh accretion and erosion in the Wash, Eastern 1161
England. Journal of Coastal Research 11, 337–356. 1162
Pye, K., Blott, S.J., 2008. Decadal-scale variation in dune erosion and accretion rates: an 1163
investigation of the significance of changing storm tide frequency and magnitude on the 1164
Sefton coast, UK. Geomorphology 102, 652-666. 1165
Pye, K., Blott, S.J., 2010. Aldbrough gas storage project: geomorphological assessment of 1166
impact of proposed cliff protection works on adjoining areas, report no EX1214, 16 pp. 1167
Pye, K., Saye, S.E., Blott, S.J., 2007. Sand Dune Processes and Management for Flood and 1168
Coastal Defence. Part 1: Project Overview and Recommendations. RandD Technical Report 1169
FD1302/TR/1, Department for Environment, Food and Rural Affairs, London, 35pp. 1170
Quinn, J.D., Philip, L.K., Murphy, W., 2009. Understanding the recession of the Holderness 1171
Coast, east Yorkshire, UK: a new presentation of temporal and spatial patterns. Quarterly 1172
Journal of Engineering Geology and Hydrogeology 42, 165-178. 1173
Reid, C. 1885. Memoirs of the Geological Survey of England and Wales. The Geology of 1174
Holderness, and the Adjoining Parts of Yorkshire and Lincolnshire. HMSO, London. 1175
Robinson, A.H.W., 1964. The inshore waters, sediment supply and coastal changes of part 1176
of Lincolnshire. East Midland Geographer 3, 22,307-22,321. 1177
Robinson, A.H.W., 1968. The use of sea bed drifter in coastal studies with particular 1178
reference to the Humber. Zeitschrift für Geomorphologie 7, 1-23. 1179
Robinson, D.N., 1953. The storm surge 31st January-1st February, 1953 and the associated 1180
meterological and tidal conditions. Geography 38, 134-141. 1181
Robinson D.N., 1984. The Saltfleetby-Theddlethorpe coastline. Transactions of the 1182
Lincolnshire Naturalists’ Union 21, 1–12. 1183
Ruessink, B.G., Jeuken, M.C.J.L.L., 2002. Dunefoot dynamics along the Dutch coast. Earth 1184
Surface Processes and Landforms 2, 1043-1056. 1185

48
Ruggiero, P., Kaminsky, G.M., Gelfenbaum, G., Voigt, B. 2005. Seasonal to interannual 1186
morphodynamics along a high-energy dissipative littoral cell. Journal of Coastal Research 1187
21, 553-578. 1188
Saye, S.E., van der Wal, D., Pye, K., Blott, S.J. 2005. Beach–dune morphological 1189
relationships and erosion/accretion: an investigation at five sites in England and Wales using 1190
LIDAR data. Geomorphology 72, 128–55. 1191
Schans, H., Möller, I., Spencer, T., 2001. Large-scale classification of the East Anglian 1192
coastline, UK. Coastal Dynamics ’01. Proceedings of the 4th International Conference on 1193
Coastal Dynamics, Lund, Sweden. ASCE, 683 – 692. 1194
Scott Wilson, 2009. Flamborough Head to Gibraltar Point Shoreline Management Plan. 1195
Appendix C - Assessment of Coastal Behaviour and Baseline Scenarios. Scott Wilson, 1196
Basingstoke. 1197
Steers, J.A., 1946. The Coastline of England and Wales. Cambridge University Press, 1198
Cambridge. 644 pp. 1199
Steers, J.A., 1966. Holderness, Lincolnshire and the Fenland, in: Steers, J.A. (Eds) The 1200
coastline of England and Wales. Cambridge University Press, Cambridge, pp. 406-440. 1201
Steers, J.A., Stoddart, D.R., Bayliss-Smith, T.P., Spencer, T., Durbridge, P.M. 1979. The 1202
storm surge of 11 January 1978 on the east coast of England. The Geographical Journal 1203
145, 192-205. 1204
Stockdon, H.F., Sallenger Jr., A.H., Holman, R.A., Howd, P.A., 2007. A simple model for the 1205
spatially-variable coastal response to hurricanes. Marine Geology 238, 1–20. 1206
Swinnerton, H.H., Kent, P.E. 1949. The Geology of Lincolnshire. Lincolnshire Naturalists 1207
Union, Lincoln. 1208
Thieler, E. R., Danforth, W.W., 1994. Historical shoreline mapping (I): Improving technique 1209
and reducing position errors. Journal of Coastal Research 19 (3), 549-563. 1210
Thieler, E.R., Himmelstoss, E.A., Zichichi, J.L., Ergul, A., 2009, Digital Shoreline Analysis 1211
System (DSAS) version 4.0—An ArcGIS extension for calculating shoreline change: U.S. 1212
Geological Survey Open-File Report 2008-1278. Available online at 1213
http://pubs.usgs.gov/of/2008/1278/. 1214

49
Thomas, T., Phillips, M.R., Williams, A.T., Jenkins, R.E., 2011. A multi-century record of 1215
linked nearshore and coastal change. Earth Surface Processes and Landforms 36, 995-1216
1006. 1217
Tonk, A.M., 2000. Monitoring changes in coastal morphology. North Lincolnshire, report to 1218
Environmnent Agency, 44 pp. 1219
Townend, I., Whitehead, P. 2003. A preliminary net sediment budget for the Humber 1220
Estuary. The Science of the Total Environment 314-316, 755-767. 1221
Townend, I., Wang, Z.B., Rees, J.G. 2007. Millenial to annual volume changes in the 1222
Humber Estuary. Proceedings: Mathematical, Physical and Engineering Sciences 463, 837-1223
854. 1224
Trigo, R.M., Dacamara, C.C. 2000. Circulation weather types and their influence on the 1225
precipitation regime in Portugal. International Journal of Climatology 20, 1559-1581. 1226
Tsimplis, M.N., Woolf, D.K., Osborn, T.J., Wakelin, S., Wolf, J., Flather, R., Shaw, A.G.P., 1227
Woodworth, P., Challenor, P., Blackman, D., Pert, F., Yan, Z., Jevrejeva, S., 2005. Towards 1228
a vulnerability assessment of the UK and northern European coasts: the role of regional 1229
climate variability. Philosophical Transactions of the Royal Society 363, 1329–1358. 1230
Valentin, H., 1971. Land loss at Holderness, in Steers, J.A. (Eds.), Applied Coastal 1231
Geomorphology, Macmillan, London, pp. 116-137. 1232
Valentin, H., 1954. Der landverlust in Holderness, Ostengland, von 1852-1952. Die Erde 6, 1233
296-315. 1234
van Houwelingen, S.T., Masselink, G., Bullard, J. 2006. Characteristics and dynamics of 1235
multiple intertidal bars, north Lincolnshire, England. Earth Surface Processes and 1236
Landforms, 31, 428-443. 1237
van Houwelingen, S.T., Masselink, G., Bullard, J. 2008. Dynamics of multiple intertidal bars 1238
over semi-diurnal and lunar tidal cycles, North Lincolnshire, England. Earth Surface 1239
Processes and Landforms, 33, 1473-1490. 1240
Vasseur, B., Héquette, A., 2000. Storm surges and erosion of coastal dunes between 1957 1241
and 1988 near Dunkerque (France), southwestern North Sea. Coastal and Estuary 1242
Environments. Geological Society. Sp. Publ., 175, 99-107. 1243
50
Vespremeanu-Stroe, A., Constantinescu, S., Tătui,F., Giosan, L., 2007. Multi-decadal 1244
evolution and North Atlantic Oscillation influences on the dynamics of the Danube delta 1245
shoreline. Journal of Coastal Research SI 50, 157-162. 1246
Wang, X.L., Zwiers, F.W., Swail, V.R., Feng, Y. 2009. Trends and variability of storminess in 1247
the Northeast Atlantic region, 1874-2007. Climate Dynamics 33, 1179-1195. 1248
Wang, X.L., Wan, H., Zwiers, F.W., Swail, V.R., Compo, G.P., Allan, R.J., Vose, R.S., 1249
Jourdain, S., Yin, X. 2011. Trends and low-frequency variability of storminess over western 1250
Europe, 1878-2007. Climate Dynamics 37, 2355-2371. 1251
Webster, P. J., Holland, G. J., Curry, J. A., Chang, H-R., 2005. Changes in tropical cyclone 1252
number, duration and intensity in a warming environment. Science 309, 1844-1846. 1253
Wilby, R.L., Dalgleish, H. Y., Foster, I.D.L., 1997. The impact of weather patterns on historic 1254
and contemporary catchment sediment yields. Earth Surface processes and landforms 22, 1255
353–363. 1256
Woodworth, P.L., Teferle, F.N., Bingley, R.M., Shennan, I., Williams, S.D.P., 2009. Trends in 1257
UK mean sea level revisited, Geophysical Journal International 176, 19-30. 1258
Woolf, D.K., Cotton, P.D., Challenor, P.G., 2003. Measurements of the offshore wave 1259
climate around the British Isles by satellite altimeter, Philosophical Transactions of the Royal 1260
Society 361, 27-31. 1261
Woolf, D.K., Challenor, P.G., Cotton,P.D., 2002. The variability and predictability of the North 1262
Atlantic wave climate. Journal of Geophysical Research 107 (C10), 3145-3159. 1263
Zhang, K., Douglas, B. C. and Leatherman, S. P., 2001. Beach Erosion Potential for Severe 1264
Nor'easters. Journal of Coastal Research 17, 309-321. 1265
1266
1267
1268

51
Table Captions 1269
Table 1 Tidal levels and tidal ranges, expressed in metres above Ordnance Datum 1270
Newlyn (ODN). Tide level for East Riding coast derived from Spurn Head data 1271
taken from Admiralty Tide Tables (Admiralty, 2009) and from tidal statistics at 1272
Skegness derived from POLTIPS 3 software developed by the National 1273
Oceanography Centre Liverpool (NOC, 2009). Abbreviations: HAT – Highest 1274
Astronomical Tide; MHWS – Mean High Water Spring; MHWN – Mean High 1275
Water Neap; MLWN – Mean Low Water Neap; MLWS – Mean Low Water 1276
Spring; LAT – Lowest Astronomical Tide. 1277
1278
Table 2 Summary characteristics of the six areas of interest (AOIs) examined in detail. 1279
Profile labels correspond to original data sources (East Riding Yorkshire 1280
Council or UK Environmental Agency). 1281
1282
Table 3 Summary of map and aerial photograph source documents and 1283
characteristics for each AOI. Abbreviations: B&W – black and white, EA – UK 1284
Environment Agency. For AOI information, see Table 2. 1285
1286
Table 4. Correlation table between morphology parameters and forcing factors at the 1287
sandy beaches between surveys (AOIs 2, 3, 5): CI - Relative coastline 1288
position, CHAT - HAT level position, VB - sand volume in backshore, VF – sand 1289
volume in foreshore, SS - storm surge. Correlation values above ±0.5 are in 1290
bold. 1291
1292
Table 5 Estimated inter-survey and cumulative sediment volume changes for the 1293
periods 1994/97-1999, 1999-2005, 2005-2008, 2008-2010, by shore units 1294
(see Fig. 2). Positive values indicate accretion, and negative values erosion. 1295
1296
Table 6 Estimated inter-survey and cumulative volumetric changes for the periods 1297
1994/97-1999, 1999-2005, 2005-2008, 2008-2010, by nearshore sub-unit 1298
(see Fig. 2). Positive values indicate accretion, and negative values erosion. 1299
1300

52
Figure Captions 1301
Figure 1 Inset: Distribution of coastal cells around the coast of England and Wales, 1302
Main figure: Boundaries and major features of sediment cell 2, east coast of 1303
England. 1304
Figure 2 Schematic diagram defining the limits of the backshore, foreshore and 1305
nearshore zones used to calculate sediment budget. 1306
Figure 3 Changes in coastline position within sediment cell 2 from Flamborough Head 1307
(P1) to Gibraltar Point (L2A7) over the period from mid-1990 to 2010 1308
(longshore spacing not to scale). Coastline represented by the cliff base (East 1309
Riding; P1-121) or HAT (Spurn Head; P122-P134 and Lincolnshire coast; 1310
L1A1-L2A7). Zero line represents the initial survey in 1994/96/97 along East 1311
Riding coast and 1997 along Lincolnshire coast. Profile labels correspond to 1312
original data sources (East Riding Yorkshire Council or UK Environmental 1313
Agency). Notation of AOIs is indicated - see Table 2. Profiles perpendicular to 1314
coastal defences and lagoons are excluded (P3-P7, P42-P44, P90-P93, 1315
P115-P118, P133, L2A4). 1316
Figure 4 Position of coastlines from 1854/91 to date for: A) Easington, B) North Spurn 1317
Head superimposed on ortho-photographs in 2010. Evolution of the coastline 1318
position (line curve) relative to OS maps in 1854 at C) Easington, D) North 1319
Spurn Head. Dashed line corresponds to mean long-term rate of shoreline 1320
evolution (1854-2010). 1321
Figure 5 Position of coastlines from 1891 to date for: A) Donna Nook, B) Saltfeetby, C) 1322
Theddlethorpe superimposed on ortho-photographs in 2010. Evolution of the 1323
coastline position (line curve) relative to OS maps in 1891 at D) Donna Nook, 1324
F) Theddlethorpe and in 1994 at E) Saltfeetby. Dashed line corresponds to 1325
mean long-term rate of shoreline evolution over the timeframe. 1326
Figure 6 Position of coastline from 1891 to date for Skegness: A) North, B) South. 1327
Figure 7 Annual frequency of storm surge and coastline evolution between 1994/97-1328
2010 at: A) Easington, B) North Spurn Head, C) Donna Nook, D) Saltfleetby, 1329
E) Theddlethorpe, and F) Skegness. 1330
Figure 8 Time series of JWT annual strong wind events and storm surge measured at 1331
tide gauges between 1994 and 2010 1332

53
Figure 9 Time series of JWT annual storm wind events between 1871-2010 for A) 1333
onshore winds, B) alongshore winds and C) offshore winds. In each case 1334
daily frequency and 5-year running mean are shown. Note: vertical scales 1335
differ. 1336
Figure 10 Time series of: A) JWT annual strong onshore wind events between 1871-1337
2010, B) winter NAO values (Dec-March) between 1850-2010 and coastline 1338
evolution at C) Easington, D) North Spurn Head, E) Donna Nook, and F) 1339
Theddlethorpe from 1854/91 to 2010. 1340
Figure 11 Long-term morphodynamic trends in the coastal cell along East Riding and 1341
Lincolnshire coasts at the studied AOIs since 1850/81. 1342
1343

1
Table 1 Tidal levels and tidal ranges, expressed in metres above Ordnance Datum 1
Newlyn (ODN). Tide level for East Riding coast derived from Spurn Head data taken from 2
Admiralty Tide Tables (Admiralty, 2009) and from tidal statistics at Skegness derived from 3
POLTIPS 3 software developed by the National Oceanography Centre Liverpool (NOC, 4
2009). Abbreviations: HAT – Highest Astronomical Tide; MHWS – Mean High Water Spring; 5
MHWN – Mean High Water Neap; MLWN – Mean Low Water Neap; MLWS – Mean Low 6
Water Spring; LAT – Lowest Astronomical Tide. 7
8
Coastal region HAT MHWS MHWN MLWN MLWS LAT
East Riding 3.80 3.00 1.60 -1.20 -2.70 -3.70
Lincolnshire 4.09 3.20 1.70 -1.09 -2.59 -3.57
9
10
11

1
Table 2 Summary characteristics of the six areas of interest (AOIs) examined in detail. 1
Profile labels correspond to original data sources (East Riding Yorkshire 2
Council or UK Environmental Agency). 3
AOI Sediment
cell
Location Geomorphology Alongshore
length (km)
Profiles No.
Transects
used in
DSAS
Landward
features
Near/
Offshore
features
1 2a Easington
(E)
Clay strata
and cliff from
9m to 5.3m
high
5.2 P113-P121 43
2 2a North
Spurn
Head
(NSP)
Sand spit of
c. 5km length
Glacial
ridge of
clay banks
1.4 P122-P124 17
3 2b Donna
Nook
(DN)
Coastal
dunes and
clay
embankment
Sand banks
of morainic
material
5.1 L1A1-L1A6 34
4 2c Saltfleet-
by (SA)
Saltmarsh Sand banks
of morainic
material
4.1 L2E1-L2E4 30
5 2c Theddle-
thorpe
(TH)
Coastal
dunes
Sand banks
of morainic
material
4.9 L2E5-L2D1 44
6 2c Skegness
(SK)
Engineering
defences
Erosive clay
strata
5 L2B6-L2A3 57
4

1
Table 3 Summary of map and aerial photograph source documents and 1
characteristics for each AOI. Abbreviations: B&W – black and white. For AOI 2
information, see Table 2. 3
4
AOI Year Type Source Document type Scale
EA, NSH 1854, 1890,
1951
OS map Edina Geo-referenced 1:10 560
DN, SA,
TH, SK
1891, 1910,
1951
OS map Edina Geo-referenced 1:10 560
EA, NSH 1966 B&W
Aerial photo
English Heritage
and EA
Scan from print
photograph (600dpi)
1:7 500
EA, NSH 2005, 2008,
2010
Colour
Aerial photo
East Riding
Yorkshire Council
Digital ortho-
georeferenced
1:5 000
DN 1970 B&W
Aerial photo
English Heritage Scan from print
photograph (600dpi)
1:7 500
TH 1953, 1966,
1976, 1983
B&W
Aerial photo
Natural England Scan from print
photograph (600dpi)
1:7 500
DN, SF,
TH, SK
1994, 1999 B&W
Aerial photo
Environment
Agency
Scan from print
photograph (600dpi)
1:5 000
DN, SF,
TH, SK
2005, 2008,
2010
Colour
Aerial photo
Environment
Agency
Digital ortho-
georeferenced
1:5 000
5
6
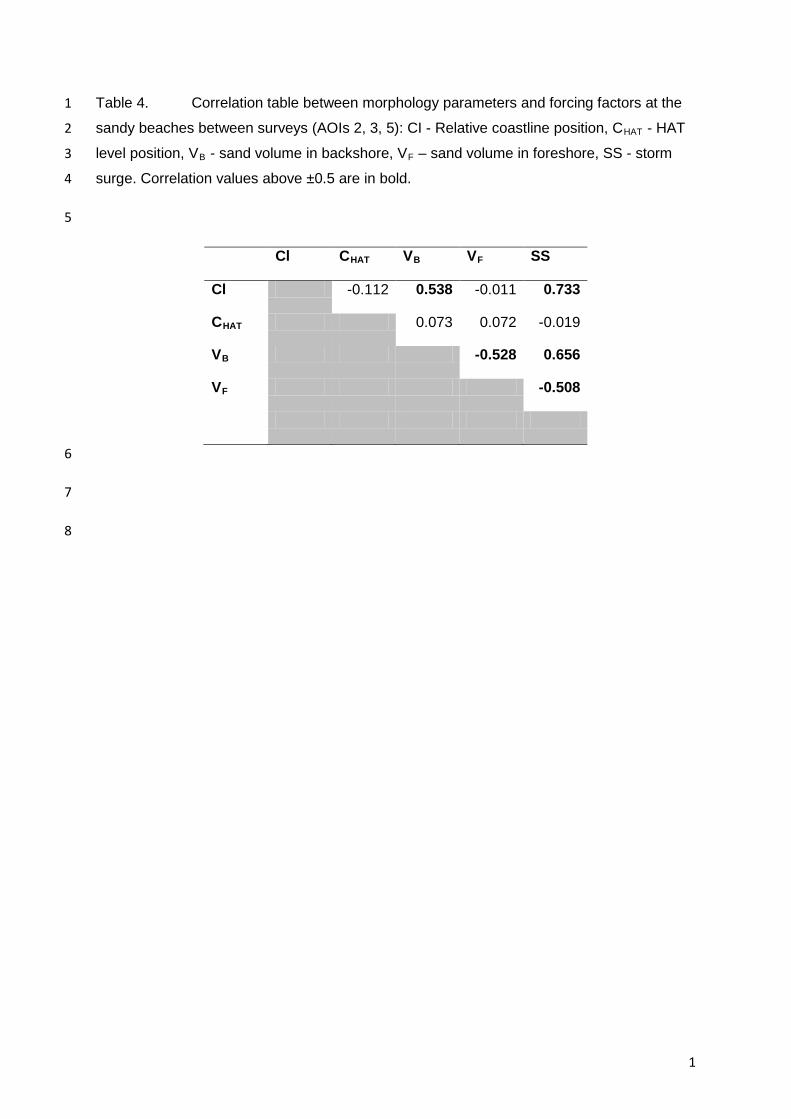
1
Table 4. Correlation table between morphology parameters and forcing factors at the 1
sandy beaches between surveys (AOIs 2, 3, 5): CI - Relative coastline position, CHAT - HAT 2
level position, VB - sand volume in backshore, VF – sand volume in foreshore, SS - storm 3
surge. Correlation values above ±0.5 are in bold. 4
5
Cl CHAT VB VF SS
Cl -0.112 0.538 -0.011 0.733
CHAT 0.073 0.072 -0.019
VB -0.528 0.656
VF -0.508
6
7
8

1
Table 5 Estimated inter-survey and cumulative sediment volume changes in 1
backshore and foreshore units (see Figure 2). Positive values indicate 2
accretion, and negative values erosion. 3
Inter-survey change (m3 x 103) Cumulative change (m3 x 103)
AOI Period Backshore Foreshore Total Backshore Foreshore Total
Easington 1997/1999 -161.3 -20.8 -182.1 -161.3 -20.8 -182.1
1999/2005 -175.9 -60.0 -235.9 -337.2 -60.0 -397.2
2005/2008 -367.8 -59.3 -427.1 -705.0 -59.3 -764.3
2008/2010 -127.2 -37.8 -165.0 -832.3 -37.8 -870.0
Rates of change (m3 year-1) -64.0 -2.9 -66.9
North Spurn 1997/1999 8.4 -1.9 6.5 8.4 -1.9 6.5
Head 1999/2005 -11.0 0.8 -10.2 -2.7 -1.9 -4.5
2005/2008 -13.0 -22.8 -35.9 -15.7 -1.9 -17.6
2008/2010 -1.4 -0.3 -1.7 -17.1 -1.9 -19.0
Rates of change (m3 year-1) -1.3 -0.1 -1.5
Donna Nook 1994/1999 96.3 91.2 187.5 96.3 91.2 187.5
1999/2005 497.5 -109.0 388.6 593.8 -17.7 576.1
2005/2008 -132.1 -105.3 -237.4 461.7 -123.0 338.6
2008/2010 26.5 432.7 459.2 488.1 309.7 797.8
Rates of change (m3 year-1) 30.5 19.4 49.9
Saltfleetby 1994/1999 349.5 129.6 479.1 349.5 129.6 479.1
1999/2005 66.4 173.7 240.1 415.9 303.3 719.2
2005/2008 -21.2 -26.6 -47.8 394.7 276.7 671.4
2008/2010 -24.2 12.7 -11.5 370.6 289.4 659.9
Rates of change (m3 year-1) 23.2 18.1 41.2
Theddlethorpe 1994/1999 681.8 -435.4 246.4 681.8 -435.4 246.4
1999/2005 276.0 358.2 634.1 957.8 -77.3 880.5
2005/2008 423.0 -330.3 92.7 1380.8 -407.6 973.3
2008/2010 -372.1 160.6 -211.5 1008.8 -247.0 761.8
Rates of change (m3 year-1) 63.0 -15.4 47.6
Skegness 1994/1999 153.1 -51.6 101.5 153.1 -51.6 101.5
1999/2005 48.6 107.6 156.2 201.7 56.0 257.7
2005/2008 -7.8 65.1 57.3 193.8 121.2 315.0
2008/2010 67.9 -38.3 29.6 261.7 82.9 344.6
Rates of change (m3 year-1) 16.4 5.2 21.5
4
5

1
Table 6 Estimated inter-survey and cumulative volumetric changes by nearshore sub-1
unit (see Figure 2). Positive values indicate accretion, and negative values erosion. 2
3
Nearshore inter-survey change
(m3 x 103)
Nearshore cumulative change
(m3 103)
Period Sub-unit1 Sub-unit2 Total Sub-unit1 Sub-unit2 Total
Donna Nook 1999/2005 219.5 112.8 332.3 219.5 112.8 332.3
2005/2008 -187.6 -73.0 -260.6 31.9 39.8 71.8
Rates of change (m3 year-1) 3.5 4.4 8.0
Saltfleetby 1999/2005 140.3 -223.4 -83.1 140.3 -223.4 -83.1
2005/2008 -3.9 30.2 26.3 136.3 -193.1 -56.8
Rates of change (m3 year-1) 15.1 -21.5 -6.3
Theddlethorpe 1999/2005 -286.3 128.2 -158.1 -286.3 128.2 -158.1
2005/2008 -14.3 70.8 56.4 -572.7 256.5 -316.2
Rates of change (m3 year-1) -63.6 28.5 -35.1
Skegness 1999/2005 116.7 12.9 129.6 116.7 12.9 129.6
2005/2008 25.3 -34.2 -8.9 142.0 -21.3 120.7
Rates of change (m3 year-1) 15.8 -2.4 13.4
4
5