A 12-year record of summer growth for Delta...
21
Is flow the cure for the summertime blues? A 12-year record of summer growth for Delta Smelt Jim Hobbs UC Davis 2014 Delta Science Conference, October 28, 2014
Transcript of A 12-year record of summer growth for Delta...

Is flow the cure for the summertime blues?
A 12-year record of summer growth for Delta Smelt
Jim Hobbs
UC Davis
2014 Delta Science Conference, October 28, 2014

1910 1920 1930 1940 1950 1960 1970 1980 1990 2000 2010
0
2
4
6
8
10
12
14
16
Wa
ter
Ye
ar
Ind
ex
Climate Variability - Drought DWR Water Year Index

Food, Predation, Temperature,
Transport, Entrainment, Toxicity
Weather, Exports, Hydrology, Turbidity, Contaminants
Air Temperature, Flows, Turbidity, Contaminant Loading, Water Diversions
Food, Predation, Temperature, Entrainment, Toxicity
Food, Predation, Size and Location of LSZ, Toxicity
Weather, Hydrology, Turbidity, Clam Grazing, Nutrients, Contaminants
Food, Predation, Temperature Harmful Algal Blooms, Toxicity
Weather, Outflow, Turbidity, Clam Grazing, Nutrients, Contaminants
Tier 2 – Environmental Drivers
Tier 3 - Habitat Attributes
Tier 1 - Landscape Attributes
Erodible Sediment Supply, Proximity to Ocean, Proximity to Discharges, Proximity to Diversions, Bathymetry (Proximity to and Extent of Shallow Areas)
Adults Eggs & Larvae
Juveniles Subadults
Tier 5 - Life Stage Transition Seasons
Tier 4 - Delta Smelt Responses
March-June (Spring)
December-May (Winter)
September-December (Fall)
June-September (Summer)
Spawning
Survival
Survival Growth
Survival
Growth

How does drought affect delta smelt?
Drought
June·September (Summer)
H3, H4b H4a
Food AvJIUbihty 8 To.1u<itv from Quality ------- H<irmful AIS.ll
Blooms
H:l 'W.lter
Temperature
Hl Pred4t1Qn
Risk
---------t-----Aut1)(hfOOl\{)1j~ I
~nd Alk:ld1thQnt>Us Cl~m Grazin& Nutrients HydrolOiY Air t~mPl';f~turc Turbidity Predator\
food ~oduction & I I ISu[ m.,l _er_l _-.......,1 .... --.....,,.J (511lpeti r.e1 i Reter tion • _ Sau> fnv;rQ!l'flf!ITfQ' T .. _________ ... .._ __ .......... ______ c_ ~lrologv ~~~ W1nt~~rk
Location of LSZ 1n relation to Clam
Dlstrl bu ti on
Pro"Ki mity to Ocean
Erodible Sediment S1.1pply

Drought effects on delta smelt
H1: Growth will be lower during drought years for all life-stages H2: Life History Diversity will be reduced during drought years

Why growth is important?
1) Mortality is HIGH in early life stages of fish 2) Mortality is selective on fish size
0 2 4 6 8 10 12 14 16 18 20 22 240
10
20
30
40
50
60
70
0 2 4 6 8 10 12 14 16 18 20 22 240
10
20
30
40
50
60
70
Back-calculated length at age 30 days post hatch Size-at-age
Source pop’n
Selection

How we measure growth

20 40 60 80 100 120 140 160
10
20
30
40
50
60
70 1999
2000
2001
2002
2004
2005
2006
2007
2008
2011
2012
2013
2014Fork
Le
ng
th (
mm
)
Average Age
Growth Rate N =1397 fish Slope = 0.35mm/d
𝐺 =𝐿𝑜𝑔(𝐿𝑐−𝐿ℎ)
𝐴𝑔𝑒

The Study
→ Flow + Food + Temperature Mean Annual Growth Rate (G)
Drought - - +
Summer Townet Survey 1999-2014 w/o 2003,2008-2010
IEP-EMP mean density copepods Apr-July
DWR annual water year index
CDEC - continuous water quality Mean Temp April-July Rio Vista & Mallard Is.
Low < 2,600-m3
Mod High>4,000-m3
Wet Above normal Below normal Dry Critically dry
Cool < 17.1 °C
Mod High> 18.3 ° C

Water Year Index H
Water Vear Index 14
12
II :z: :z:
:z:
II
4
• • .: r • • - ·r • . 2m!!llml•Bt1 Sl2Bl:ISl4 .....
ii!Ell

199920002001200220032004200520062007200820092010201120122013
0
500
1000
1500
2000
2500
3000
3500
4000
4500
5000
5500
6000
Mea
n D
ensity
Year
Rotifers
Nauplii (All)
Cycloploid Juvs
Calanoid Juvs
Cycloploid Adults
Calanoid Adults
Food W
W
W
D W
D D
D D
AN
BN
BN
BN
BN
C

1999200020012002200320042005200620072008200920102011201220132014
14
15
16
17
18
19
20
Mea
n W
ate
r T
em
pera
ture
Year
Temperature W
W
W
D
W
D
D
D
D
AN
BN
BN
BN
BN
C
C

1998 2000 2002 2004 2006 2008 2010 2012 2014 2016
0.000
0.002
0.004
0.006
0.008
0.010
0.012
0.014
0.016
0.018G
Year
Growth Rate
W
W
D
D
BN
BN
W
D
C
BN
W
D C

Model Results
Water Year Type Temperature Copepod Density

Model Results
Temperature Copepod Density Spring X2

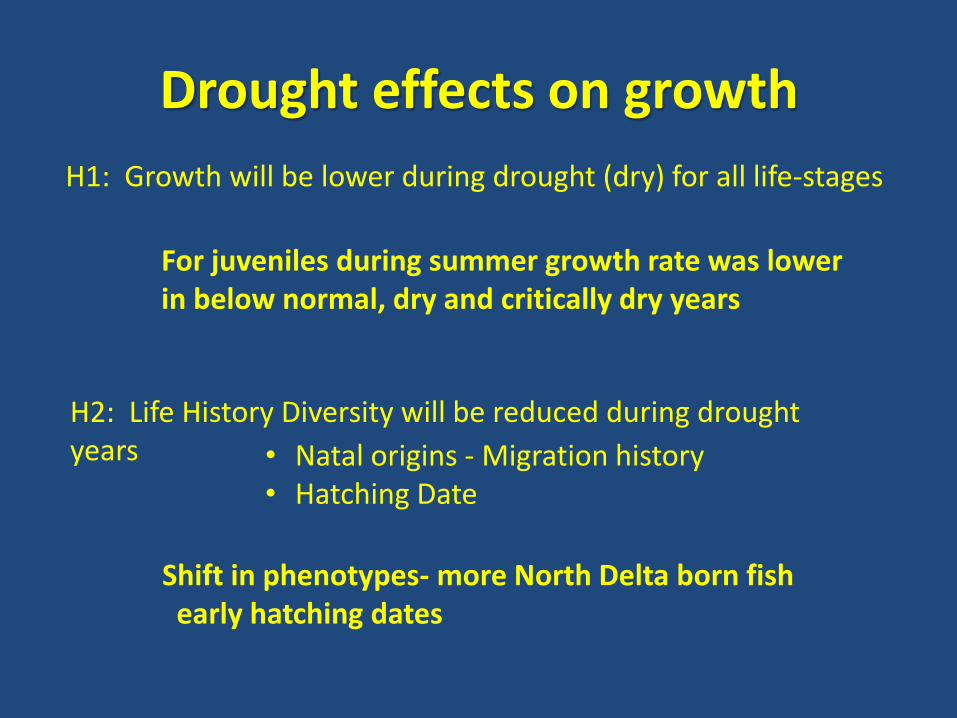
Drought effects on growth
H1: Growth will be lower during drought (dry) for all life-stages
For juveniles during summer growth rate was lower in below normal, dry and critically dry years
H2: Life History Diversity will be reduced during drought years
• Natal origins - Migration history • Hatching Date

0%
25%
50%
75%
100%
1999 2001 2002 2004 2005 2006 2007
Pe
rce
nt C
om
po
sitio
n
Sacramento River Delta Low-salinity ZoneW D BN BN D D W
Nat
al O
rigi
ns
North Delta-DWSC

1998 2000 2002 2004 2006 2008 2010 2012 2014 2016
40
60
80
100
120
140
160
180
200
220H
atc
hdate
(days fro
m J
an 1
)
YEAR
Hatchdate

Hatchdates → Temperatures
Drought effects on growth
H1: Growth will be lower during drought (dry) for all life-stages
For juveniles during summer growth rate was lower in below normal, dry and critically dry years
H2: Life History Diversity will be reduced during drought years • Natal origins - Migration history
• Hatching Date
Shift in phenotypes- more North Delta born fish early hatching dates

Thank You!
Undergraduate Research Assistants: Anna Schiller, Mackenzie Gilliam, Marielle Medina, Amy Taylor, James Chhor
Collaborators: William Bennett
Swee Teh, Ted Sommer, Louise Conrad The MAST-Drought Team. Agency: Carol Atkins-CDFW-ERP Erwin Van Nieuwenhuyse –BOR,
CDFW Ecosystem Restoration Project Grant #E1183004-02 Bureau of Reclamation-IEP Contract #R10AC20108
Funding Provided By:
Lab Technicians: Felipe La Luz, Eva Bush Naoaki Ikemiyagi