9th HITRAN conference, 26-28 June 2006, Cambridge, MA, USA ASSESSMENT OF THE GEISA AND GEISA/IASI...
43
9th HITRAN conference, 26-28 June 2006, Cambridge, MA, USA ASSESSMENT OF THE GEISA AND GEISA/IASI SPECTROSCOPIC DATA QUALITY: trough comparisons with other public database archives N. Jacquinet-Husson, N.A. Scott, A. Chédin, R. Armante Laboratoire de Météorologie Dynamique Atmospheric Radiation Analysis Group Ecole Polytechnique 91128, Palaiseau, France http://ara.lmd.polytechnique.fr
-
date post
18-Dec-2015 -
Category
Documents
-
view
216 -
download
0
Transcript of 9th HITRAN conference, 26-28 June 2006, Cambridge, MA, USA ASSESSMENT OF THE GEISA AND GEISA/IASI...

9th HITRAN conference, 26-28 June 2006, Cambridge, MA, USA
ASSESSMENT OF THE GEISA AND GEISA/IASI SPECTROSCOPIC DATA QUALITY:
trough comparisons with other public
database archives
N. Jacquinet-Husson, N.A. Scott, A. Chédin, R. Armante
Laboratoire de Météorologie DynamiqueAtmospheric Radiation Analysis Group
Ecole Polytechnique91128, Palaiseau, France
http://ara.lmd.polytechnique.fr
husson
husson
husson
9th HITRAN conference, 26-28 June 2006, Cambridge, MA, USA
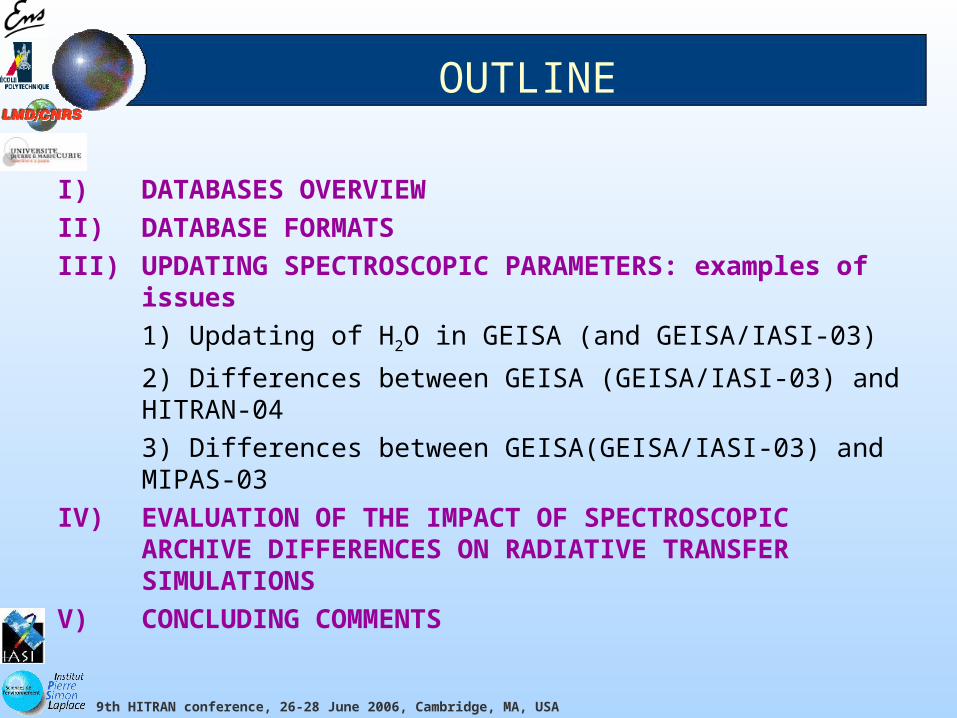
OUTLINE
I) DATABASES OVERVIEWII) DATABASE FORMATSIII) UPDATING SPECTROSCOPIC PARAMETERS:
examples of issues1) Updating of H2O in GEISA (and GEISA/IASI-03)
2) Differences between GEISA (GEISA/IASI-03) and HITRAN-043) Differences between GEISA(GEISA/IASI-03) and MIPAS-03
IV) EVALUATION OF THE IMPACT OF SPECTROSCOPIC ARCHIVE DIFFERENCES ON RADIATIVE TRANSFER SIMULATIONS
V) CONCLUDING COMMENTS
9th HITRAN conference, 26-28 June 2006, Cambridge, MA, USA
Data bases involved in comparisons
GEISA Jacquinet-Husson et al. Proc. of the 13th International TOVS Study Conference, Sainte-Adèle, Canada, 28 Oct-4 Nov. 2003
and
GEISA/IASI-03 Jacquinet-Husson et al. JQSRT 95 (2005) 429-467.
HITRAN-04 Rothman et al. JQSRT 96 (2005) 139-204.
MIPAS Dedicated Spectroscopic Database Flaud et al. Atm. And Ocean Optics, 16 (2003)
172-182.
Evaluation of the differences in contents and subsequent radiative transfer modelling
impacts
9th HITRAN conference, 26-28 June 2006, Cambridge, MA, USA
DATABASES OVERVIEW

9th HITRAN conference, 26-28 June 2006, Cambridge, MA, USA
Gestion et Etude des Informations Spectroscopiques Atmosphériques
Management and Study of Atmospheric Spectroscopic Information
The GEISA-2003 system
Three SUB-DATABASES
Line transition parameters database 42 molecules (96 isotopic species) 1,668,371 entries between 0 and 35,877 cm-1
Absorption cross-sections database IR: 32 molecular species (mainly CFC’s) UV/Visible : 11 molecular species
Aerosol data archive and softwares
ASSOCIATED MANAGEMENT SOFTWARES (For each sub-database)
9th HITRAN conference, 26-28 June 2006, Cambridge, MA, USA
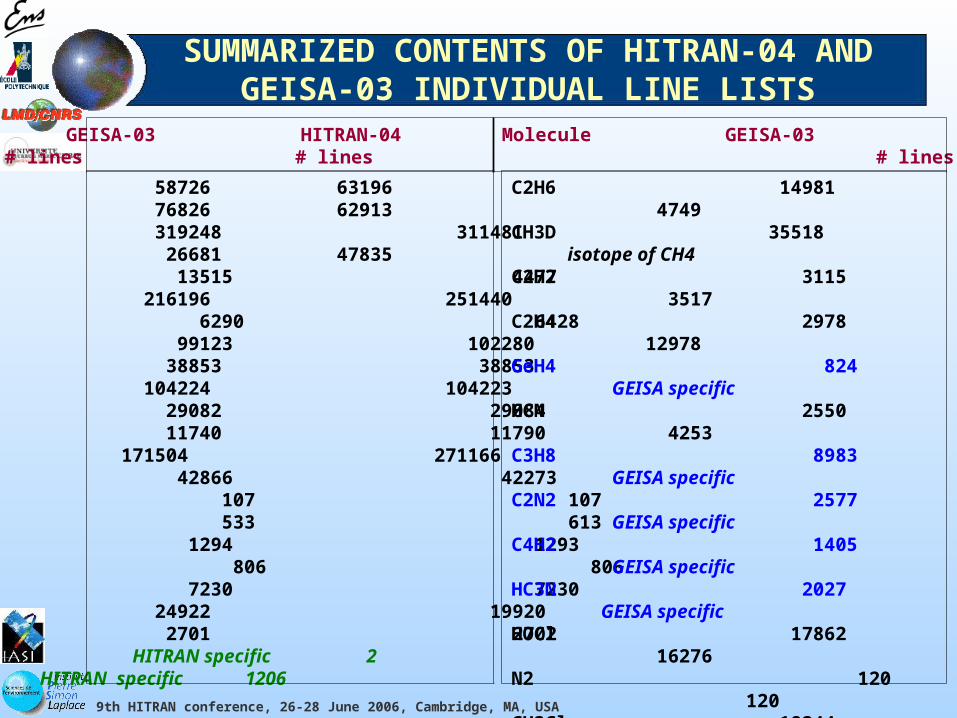
SUMMARIZED CONTENTS OF HITRAN-04 AND GEISA-03 INDIVIDUAL LINE LISTS
Molecule GEISA-03 HITRAN-04 Molecule GEISA-03 HITRAN-04 # lines # lines # lines #l ines
H2O 58726 63196 CO2 76826 62913O3 319248 311481N2O 26681 47835CO 13515 4477CH4 216196 251440O2 6290 6428NO 99123 102280SO2 38853 38853NO2 104224 104223NH3 29082 29084PH3 11740 11790HNO3 171504 271166OH 42866 42273HF 107 107HCl 533 613HBr 1294 1293HI 806 806ClO 7230 7230OCS 24922 19920H2CO 2701 2702O HITRAN specific 2NO+ HITRAN specific 1206
C2H6 14981 4749CH3D 35518 isotope of CH4C2H2 3115 3517 C2H4 2978 12978 GeH4 824 GEISA specificHCN 2550 4253C3H8 8983 GEISA specific C2N2 2577 GEISA specificC4H2 1405 GEISA specificHC3N 2027 GEISA specificHOCl 17862 16276N2 120 120CH3Cl 18344 31119H2O2 100781 100781H2S 20788 20788 HCOOH 3388 24808COF2 83750 70601SF6 11520 22901 Supl.C3H4 3390 GEISA specific HO2 38804 38804ClONO2 32199 32199 Supl.HOBr HITRAN specific 4358CH3OH HITRAN specific 19899
9th HITRAN conference, 26-28 June 2006, Cambridge, MA, USA
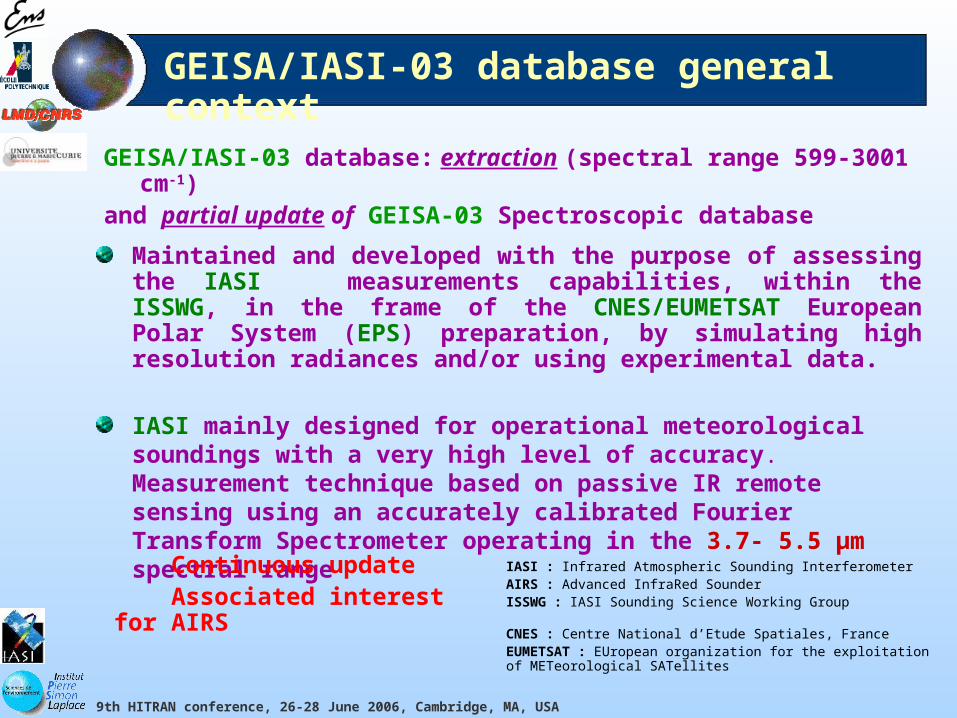
GEISA/IASI-03 database: extraction (spectral range 599-3001 cm-1)and partial update of GEISA-03 Spectroscopic database
GEISA/IASI-03 database general context
Maintained and developed with the purpose of assessing the IASI measurements capabilities, within the ISSWG, in the frame of the CNES/EUMETSAT European Polar System (EPS) preparation, by simulating high resolution radiances and/or using experimental data.
IASI mainly designed for operational meteorological soundings with a very high level of accuracy. Measurement technique based on passive IR remote sensing using an accurately calibrated Fourier Transform Spectrometer operating in the 3.7- 5.5 µm spectral range
Continuous update Associated interest for AIRS
IASI : Infrared Atmospheric Sounding InterferometerAIRS : Advanced InfraRed SounderISSWG : IASI Sounding Science Working Group
CNES : Centre National d’Etude Spatiales, FranceEUMETSAT : EUropean organization for the exploitation of METeorological SATellites
9th HITRAN conference, 26-28 June 2006, Cambridge, MA, USA
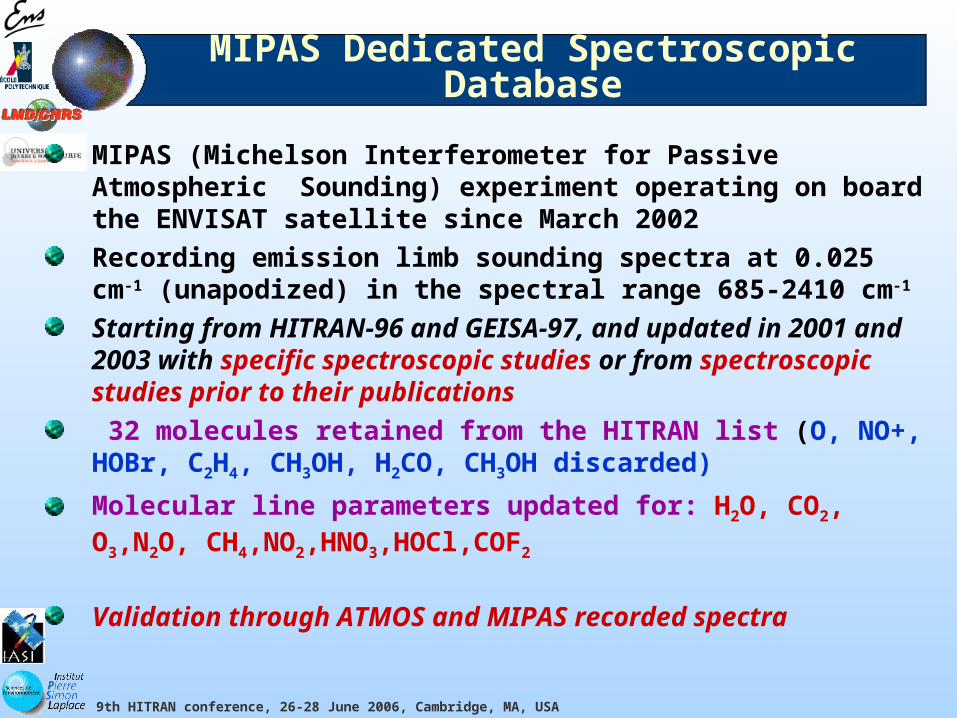
MIPAS Dedicated Spectroscopic Database
MIPAS (Michelson Interferometer for Passive Atmospheric Sounding) experiment operating on board the ENVISAT satellite since March 2002Recording emission limb sounding spectra at 0.025 cm-1 (unapodized) in the spectral range 685-2410 cm-1
Starting from HITRAN-96 and GEISA-97, and updated in 2001 and 2003 with specific spectroscopic studies or from spectroscopic studies prior to their publications 32 molecules retained from the HITRAN list (O, NO+, HOBr, C2H4, CH3OH, H2CO, CH3OH discarded)
Molecular line parameters updated for: H2O, CO2, O3,N2O, CH4,NO2,HNO3,HOCl,COF2
Validation through ATMOS and MIPAS recorded spectra
9th HITRAN conference, 26-28 June 2006, Cambridge, MA, USA
DATABASE FORMATS

9th HITRAN conference, 26-28 June 2006, Cambridge, MA, USA
GEISA-03 Line Transitions Records
A-J fields Mainly specific of GEISA management software
(A) Wavenumber (cm-1) of the line associated with the vibro-rotational transition.
(B) Intensity of the line (cm molecule-1 at 296K).(C) Lorentzian collision halfwidth (cm-1 atm-1 at 296K).(D) Energy of the lower transition level (cm-1).(E) Transition quantum identifications for the lower and upper levels of the
transition (F) Temperature dependence coefficient n of the halfwidth (G) Identification code for isotope.(I) Identification code for molecule.(J) Internal GEISA code for data identification.K-Q fields in the GEISA format Mainly HITRAN-01 format inter-
compatibility related
(K) Molecule number as in HITRAN (L) Isotope number as in HITRAN(M) Transition probability (in debye2)(N) Self broadening pressure halfwidth (HWHM) (cm-1atm-1) at 296K (for water)(O) Air pressure shift of the line transition (cm-1atm-1) at 296K(P) Accuracy indices for wavenumber, intensity and halfwidth(Q) Indices for lookup of references for wavenumber, intensity and halfwidth

9th HITRAN conference, 26-28 June 2006, Cambridge, MA, USA
R-U’ fields in the GEISA/IASI format Mainly IASI specific
(R) Temperature dependence coefficient n of the air pressure shift(A‘) Estimated accuracy (cm-1) on the line position(B‘) Estimated accuracy on the intensity of the line in (cm-1/(molecule.cm-2)(C‘) Estimated accuracy on the air collision halfwidth (HWHM) (cm-1atm-1)(F‘) Estimated accuracy on the temperature dependence coefficient n of the air broadening HW(O‘) Estimated accuracy on the air pressure shift of the line transition (cm -
1atm-1) @296K(R‘) Estimated accuracy on the temperature dependence coefficient n of the air pressure shift
GEISA-03 Line Transitions Records (following)
(N‘) Estimated accuracy on the self broadened (HWHM) (cm-1atm-1) @296K (S) Temperature dependence coefficient n of the self broadening halfwidth (S‘) Estimated accuracy on the temperature dependence coefficient n of the self broadening HW (T) Self pressure shift of the line transition (cm-1atm-1) @296K (T‘) Estimated accuracy on the self pressure shift of the line transition (cm-1atm-1) @296K (U) Temperature dependence coefficient n of the self pressure shift (U‘) Estimated accuracy on the temperature dependence coefficient n of the self pressure shift )
Water specific
209 Characters record
9th HITRAN conference, 26-28 June 2006, Cambridge, MA, USA
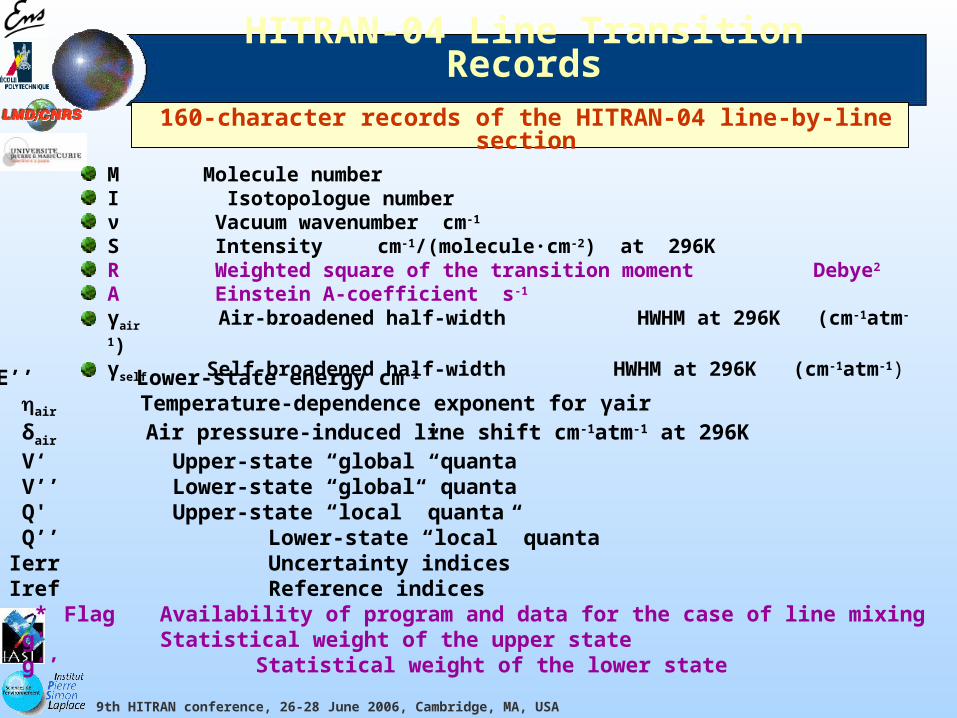
HITRAN-04 Line Transition Records
M Molecule number I Isotopologue numberν Vacuum wavenumber cm-1 S Intensity cm-1/(molecule·cm-2) at 296K R Weighted square of the transition moment Debye2
A Einstein A-coefficient s-1 γair Air-broadened half-width HWHM at 296K (cm-1atm-1) γself Self-broadened half-width HWHM at 296K (cm-1atm-1)
160-character records of the HITRAN-04 line-by-line section
E’’ Lower-state energy cm-1 air Temperature-dependence exponent for γair δair Air pressure-induced line shift cm-1atm-1 at 296K V‘ Upper-state “global” quanta V’’ Lower-state “global” quanta Q' Upper-state “local” quanta Q’’ Lower-state “local” quanta Ierr Uncertainty indices Iref Reference indices * Flag Availability of program and data for the case of line mixing g' Statistical weight of the upper state g’’ Statistical weight of the lower state

9th HITRAN conference, 26-28 June 2006, Cambridge, MA, USA
MIPAS Line Transition Records
The format of the MIPAS database as
well as the numbering of the
molecules and of the isotopic species
is the same as in HITRAN-96 and
HITRAN-2K
9th HITRAN conference, 26-28 June 2006, Cambridge, MA, USA
UPDATING OF SPECTROSCOPIC PARAMETERS:
examples of issues
9th HITRAN conference, 26-28 June 2006, Cambridge, MA, USA
1) Updating of H2O in GEISA and GEISA/IASI-03
9th HITRAN conference, 26-28 June 2006, Cambridge, MA, USA
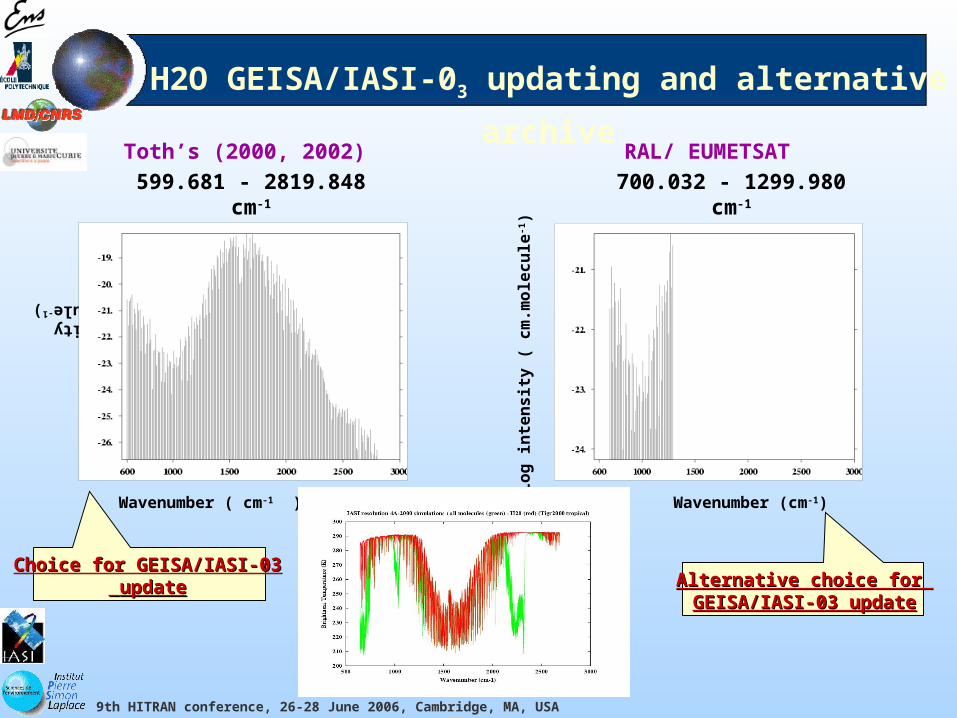
599.681 - 2819.848 cm-1
Toth’s (2000, 2002)
Log intensity ( cm.molecule-1)
Wavenumber ( cm-1 )
RAL/ EUMETSAT
Lo
g i
nte
ns
ity
( c
m.m
ole
cu
le-1)
Wavenumber (cm-1)
700.032 - 1299.980 cm-1
Choice for GEISA/IASI-03Choice for GEISA/IASI-03 updateupdate Alternative choice for Alternative choice for
GEISA/IASI-03 updateGEISA/IASI-03 update
H2O GEISA/IASI-03 updating and alternative
archive
9th HITRAN conference, 26-28 June 2006, Cambridge, MA, USA
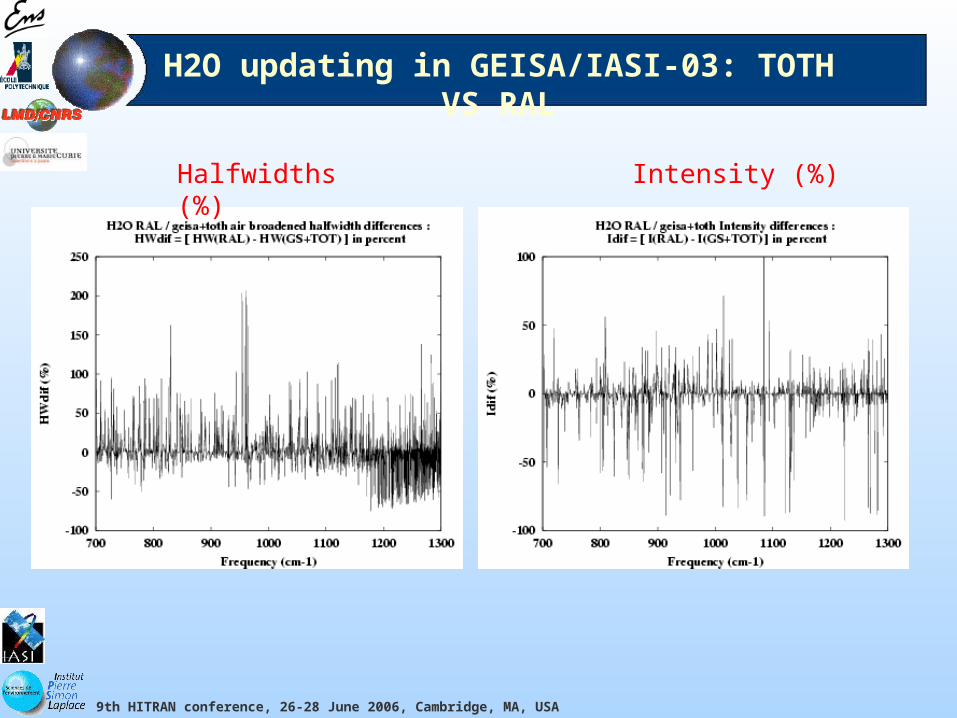
H2O updating in GEISA/IASI-03: TOTH VS RAL
Halfwidths (%) Intensity (%)
9th HITRAN conference, 26-28 June 2006, Cambridge, MA, USA
2) DIFFERENCES BETWEEN GEISA (GEISA/IASI-03) and
HITRAN-04
9th HITRAN conference, 26-28 June 2006, Cambridge, MA, USA
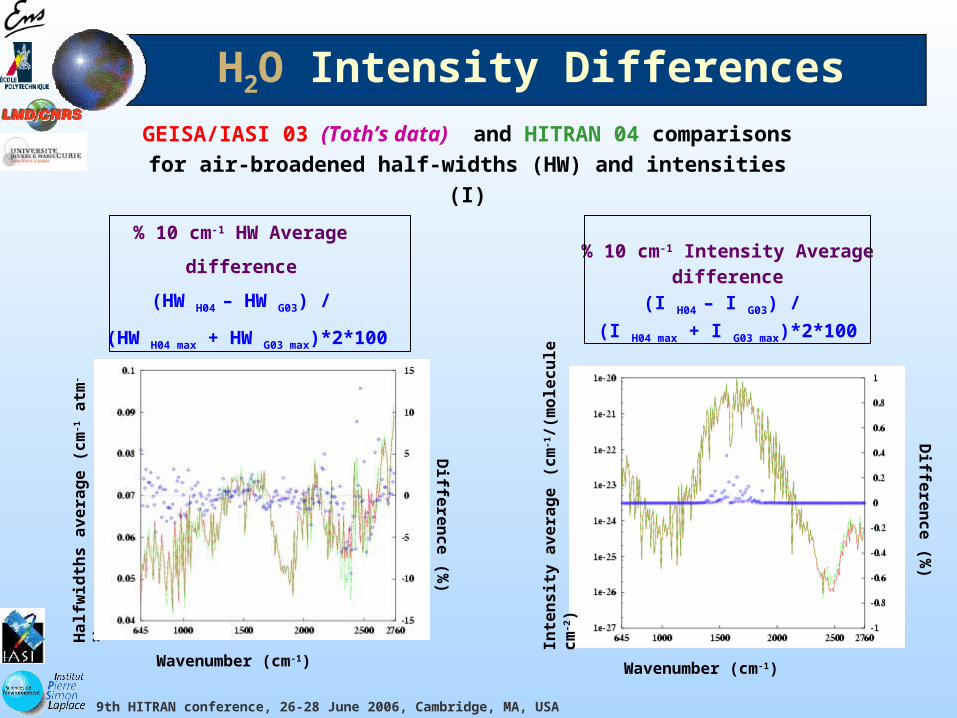
H2O Intensity DifferencesH
alf
wid
ths
av
era
ge
(c
m-1 a
tm-1)
GEISA/IASI 03 (Toth’s data) and HITRAN 04 comparisons for air-broadened half-widths (HW) and
intensities (I)
Wavenumber (cm-1)
Diffe
ren
ce
(%)
Wavenumber (cm-1)
Diffe
ren
ce
(%)
Inte
ns
ity
av
era
ge (
cm
-1/(
mo
lec
ule
cm
-2)
% 10 cm-1 HW Average
difference
(HW H04 – HW G03) /
(HW H04 max + HW G03 max)*2*100
% 10 cm-1 Intensity Average difference
(I H04 – I G03) /
(I H04 max + I G03 max)*2*100
9th HITRAN conference, 26-28 June 2006, Cambridge, MA, USA
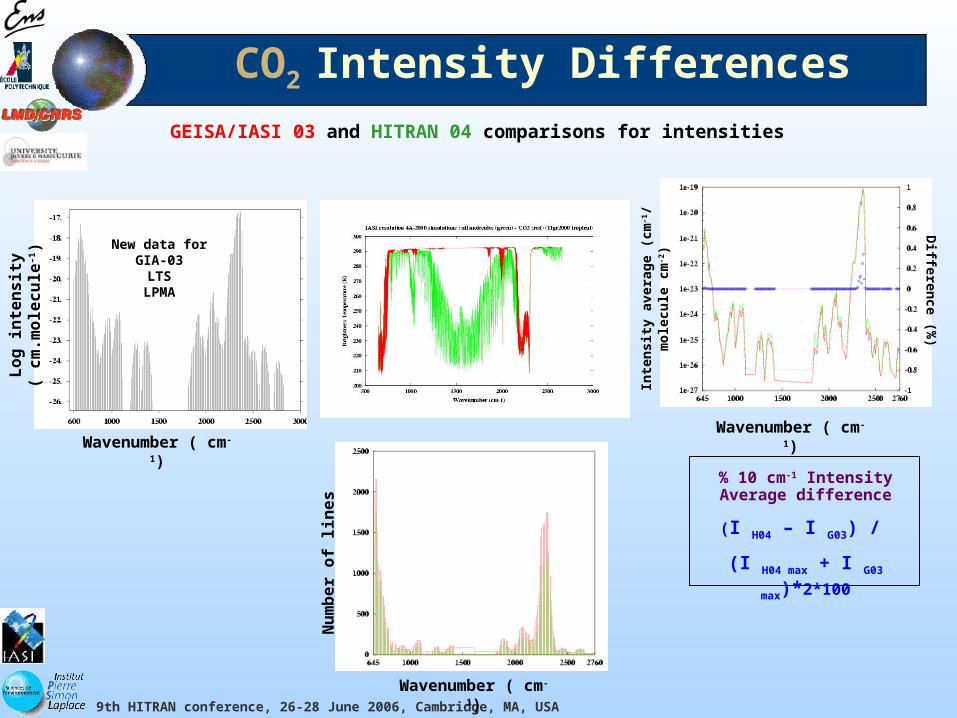
CO2 Intensity DifferencesGEISA/IASI 03 and HITRAN 04 comparisons for intensities
Wavenumber ( cm-1)
Wavenumber ( cm-1)
Wavenumber ( cm-1)Lo
g i
nte
ns
ity
( c
m.m
ole
cu
le-1)
Nu
mb
er
of
lin
es
% 10 cm-1 Intensity Average difference
(I H04 – I G03) /
(I H04 max + I G03 max)*2*100
Inte
nsi
ty a
vera
ge
(cm
-1/
mo
lecu
le c
m-2)
New data for GIA-03LTS
LPMA
Differen
ce (%)
9th HITRAN conference, 26-28 June 2006, Cambridge, MA, USA
Log intensity (cm.molecule-1)
Wavenumber (cm-1 )
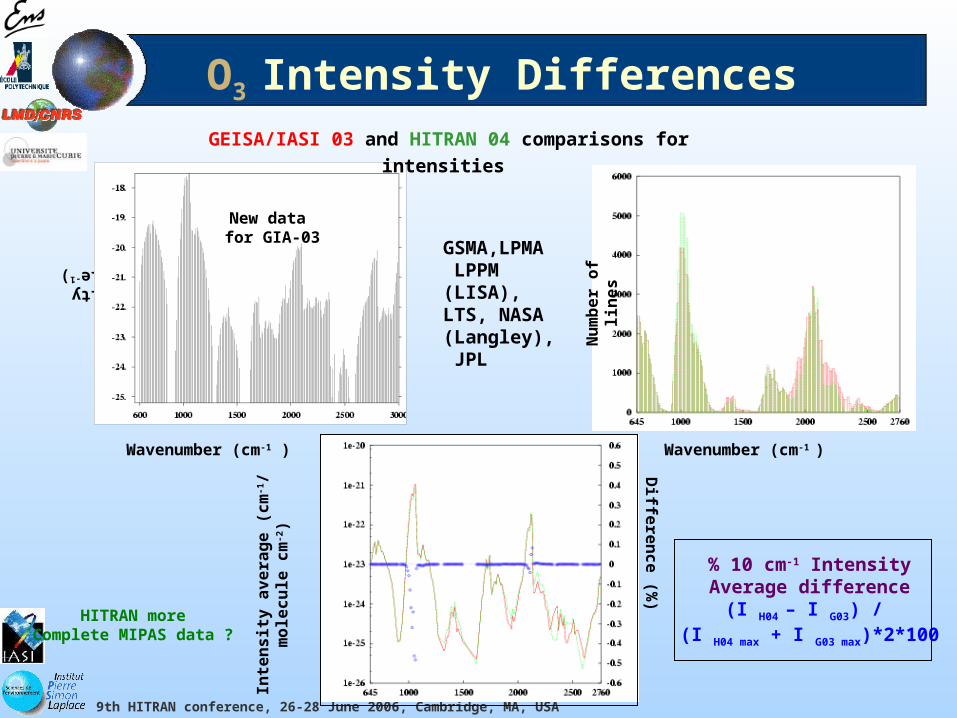
O3 Intensity DifferencesGEISA/IASI 03 and HITRAN 04 comparisons for intensities
Wavenumber (cm-1 )
New data for GIA-03
Nu
mb
er
of
lin
es
Inte
ns
ity
av
era
ge
(c
m-1/
mo
lec
ule
cm
-2)
Diffe
ren
ce
(%)
% 10 cm-1 Intensity Average difference
(I H04 – I G03) / (I H04 max + I G03 max)*2*100
GSMA,LPMA LPPM (LISA),LTS, NASA (Langley), JPL
HITRAN moreComplete MIPAS data ?
9th HITRAN conference, 26-28 June 2006, Cambridge, MA, USA
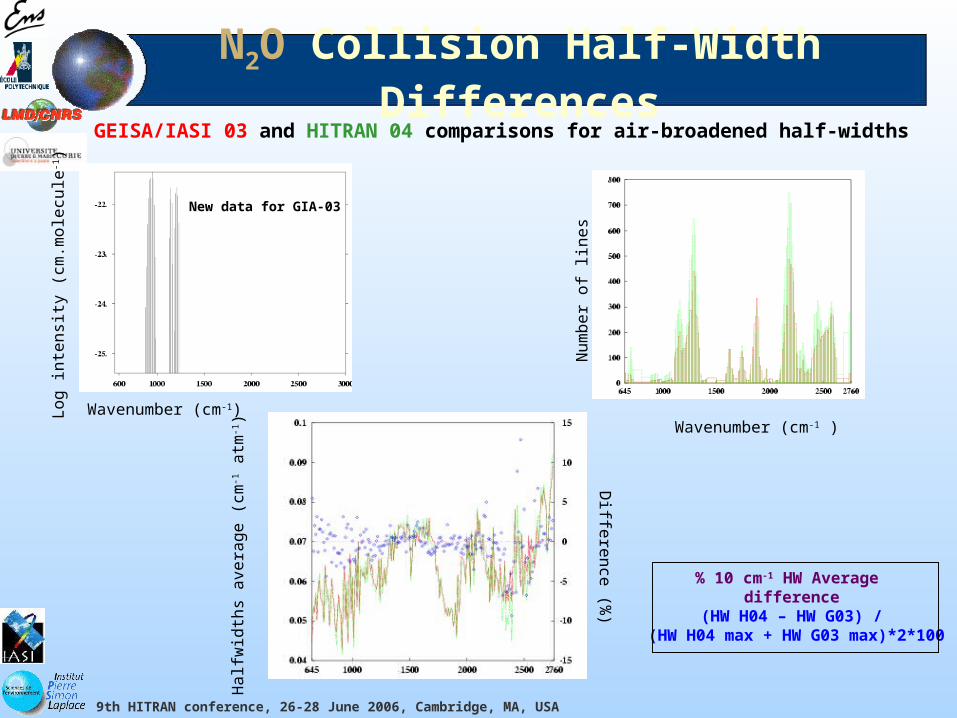
N2O Collision Half-Width Differences
GEISA/IASI 03 and HITRAN 04 comparisons for air-broadened half-widths
Lo
g in
ten
sity
(cm
.mo
lecu
le-1)
Nu
mb
er
of
line
s
Wavenumber (cm-1) Wavenumber (cm-1 )
New data for GIA-03
% 10 cm-1 HW Average difference
(HW H04 – HW G03) / (HW H04 max + HW G03 max)*2*100
Ha
lfwid
ths
ave
rag
e (
cm-1 a
tm-1)
Diffe
ren
ce (%
)
9th HITRAN conference, 26-28 June 2006, Cambridge, MA, USA
3) DIFFERENCES BETWEEN GEISA (GEISA/IASI-03)
and MIPAS-03
9th HITRAN conference, 26-28 June 2006, Cambridge, MA, USA
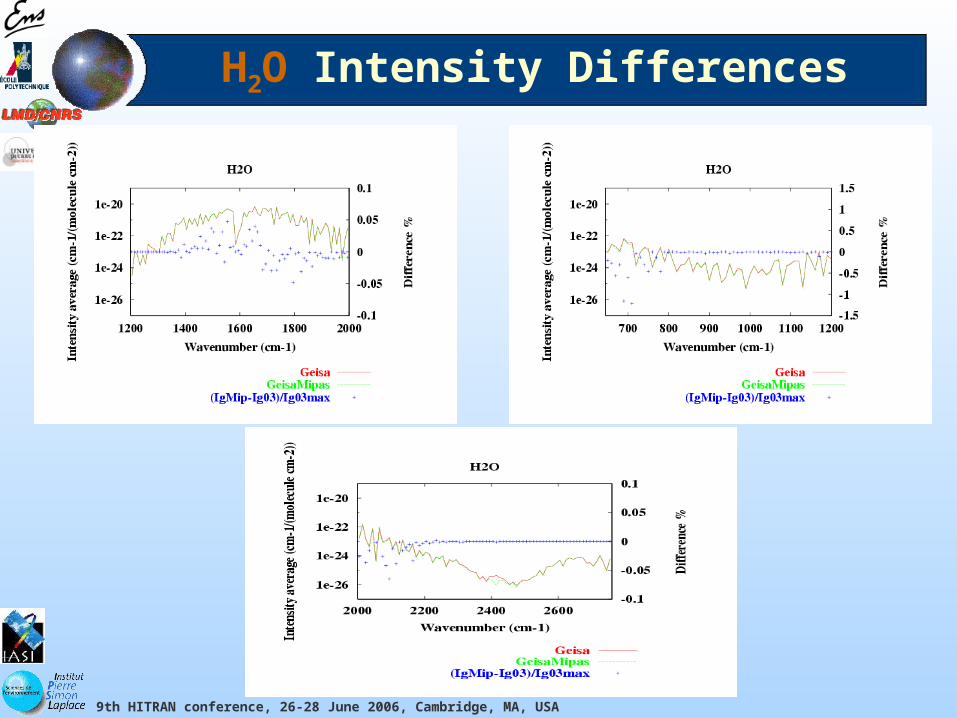
H2O Intensity Differences
9th HITRAN conference, 26-28 June 2006, Cambridge, MA, USA
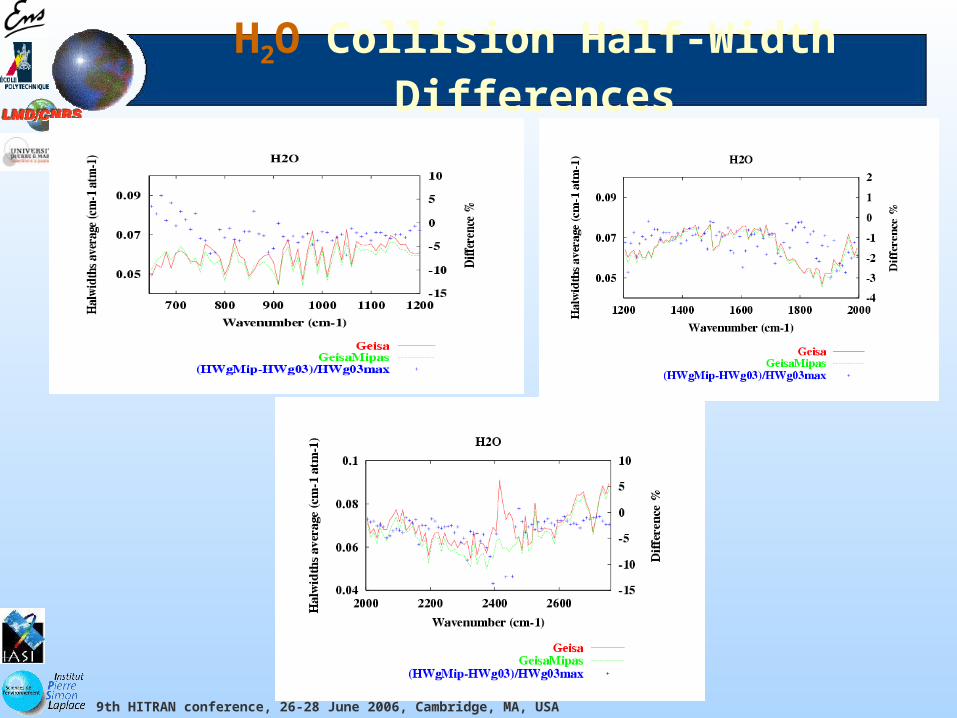
H2O Collision Half-Width Differences

9th HITRAN conference, 26-28 June 2006, Cambridge, MA, USA
CO2 Collision Half-Width Differences
9th HITRAN conference, 26-28 June 2006, Cambridge, MA, USA
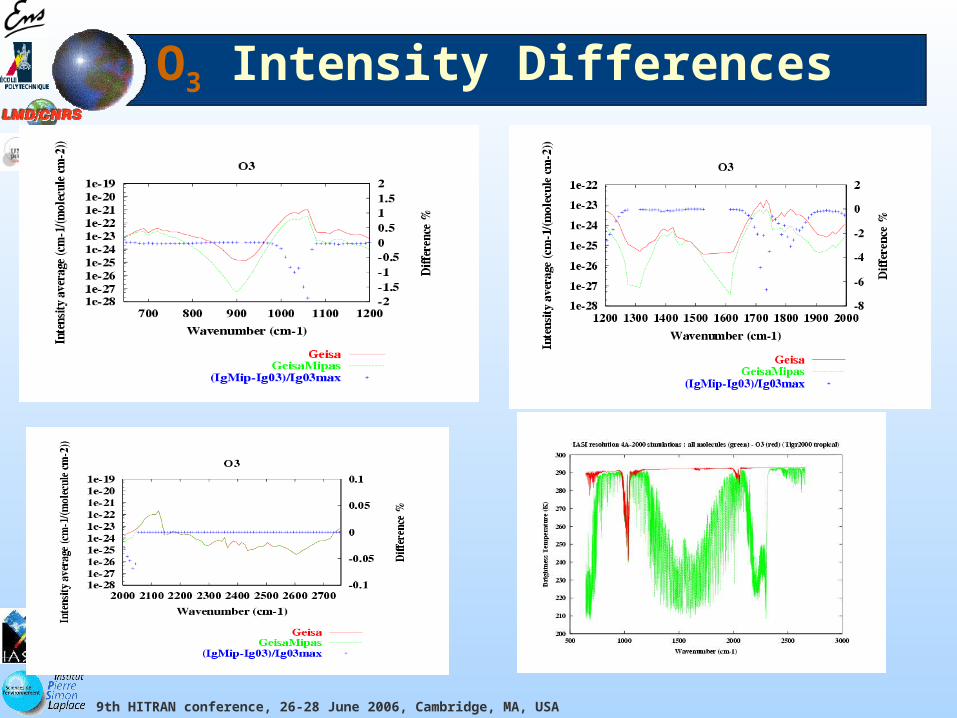
O3 Intensity Differences
9th HITRAN conference, 26-28 June 2006, Cambridge, MA, USA
Evaluation of the Impact of Spectroscopic Archive
Differences on Radiative Transfer Simulations
9th HITRAN conference, 26-28 June 2006, Cambridge, MA, USA
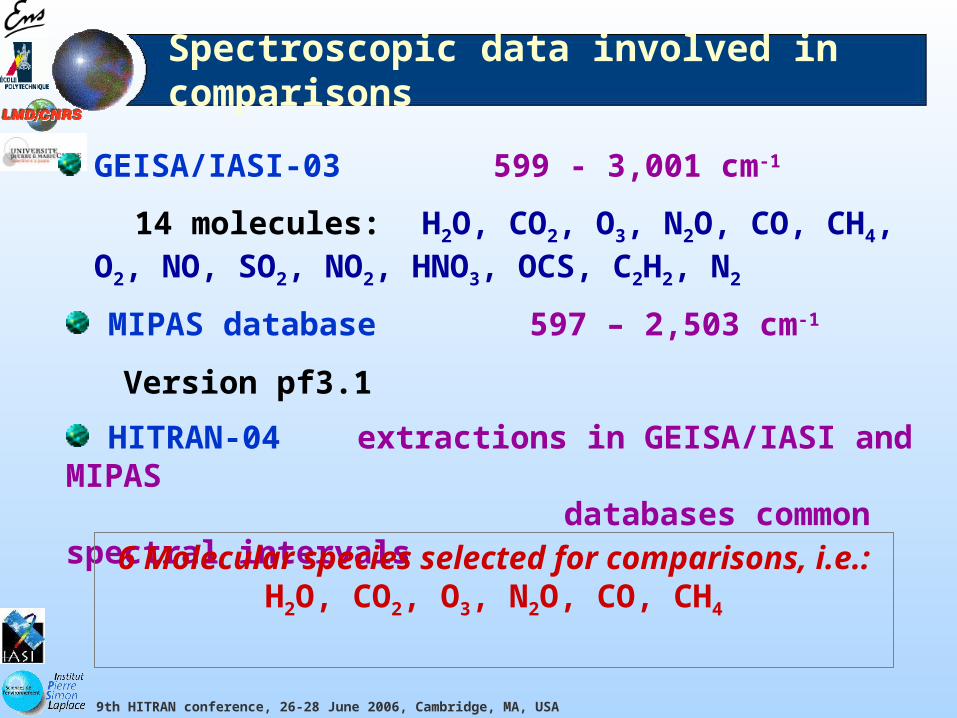
Spectroscopic data involved in comparisons
GEISA/IASI-03 599 - 3,001 cm-1
14 molecules: H2O, CO2, O3, N2O, CO, CH4, O2, NO, SO2, NO2, HNO3, OCS, C2H2, N2
MIPAS database 597 – 2,503 cm-1
Version pf3.1
HITRAN-04 extractions in GEISA/IASI and MIPAS databases common spectral intervals 6 Molecular species selected for
comparisons, i.e.:H2O, CO2, O3, N2O, CO, CH4
9th HITRAN conference, 26-28 June 2006, Cambridge, MA, USA
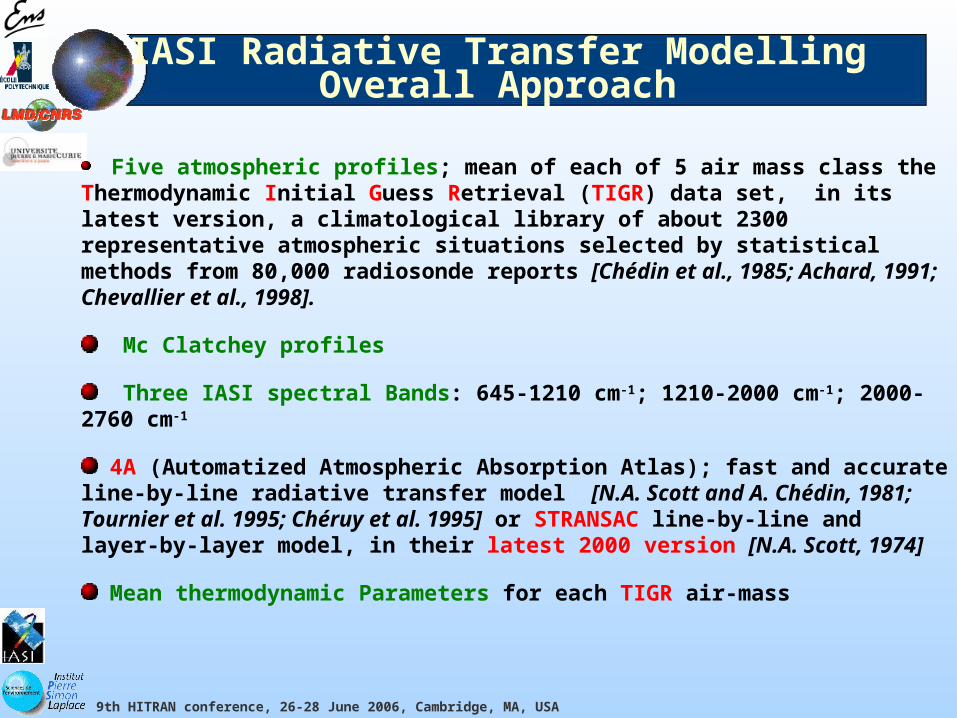
IASI Radiative Transfer Modelling Overall Approach
Five atmospheric profiles; mean of each of 5 air mass class the Thermodynamic Initial Guess Retrieval (TIGR) data set, in its latest version, a climatological library of about 2300 representative atmospheric situations selected by statistical methods from 80,000 radiosonde reports [Chédin et al., 1985; Achard, 1991; Chevallier et al., 1998].
Mc Clatchey profiles
Three IASI spectral Bands: 645-1210 cm-1; 1210-2000 cm-1; 2000-2760 cm-1
4A (Automatized Atmospheric Absorption Atlas); fast and accurate line-by-line radiative transfer model [N.A. Scott and A. Chédin, 1981; Tournier et al. 1995; Chéruy et al. 1995] or STRANSAC line-by-line and layer-by-layer model, in their latest 2000 version [N.A. Scott, 1974]
Mean thermodynamic Parameters for each TIGR air-mass
9th HITRAN conference, 26-28 June 2006, Cambridge, MA, USA
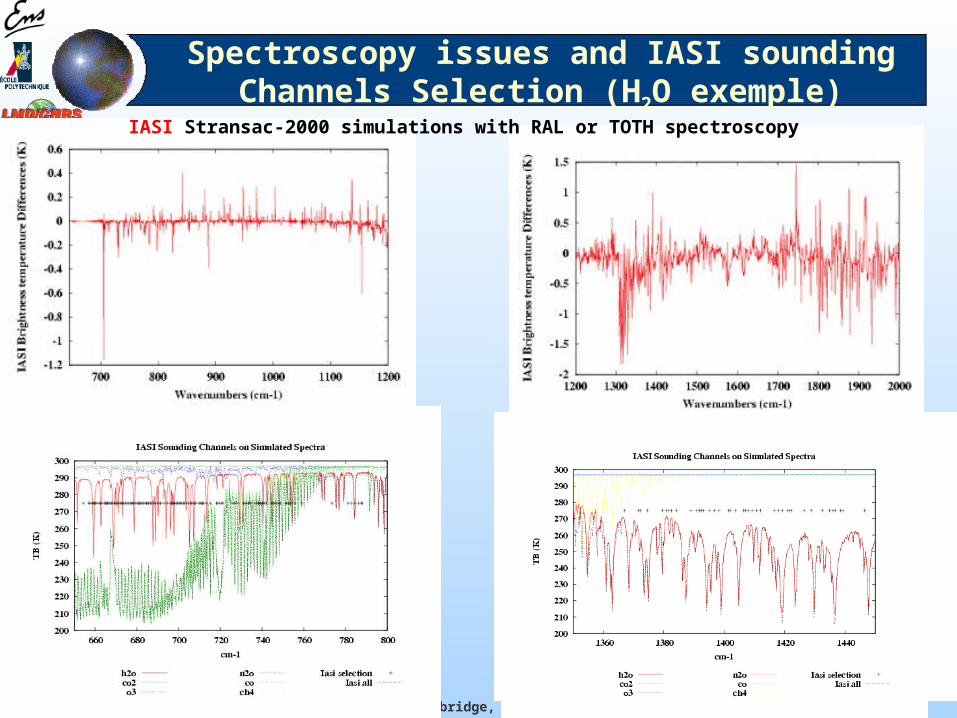
Spectroscopy issues and IASI sounding Channels Selection (H2O exemple)
IASI Stransac-2000 simulations with RAL or TOTH spectroscopy
9th HITRAN conference, 26-28 June 2006, Cambridge, MA, USA
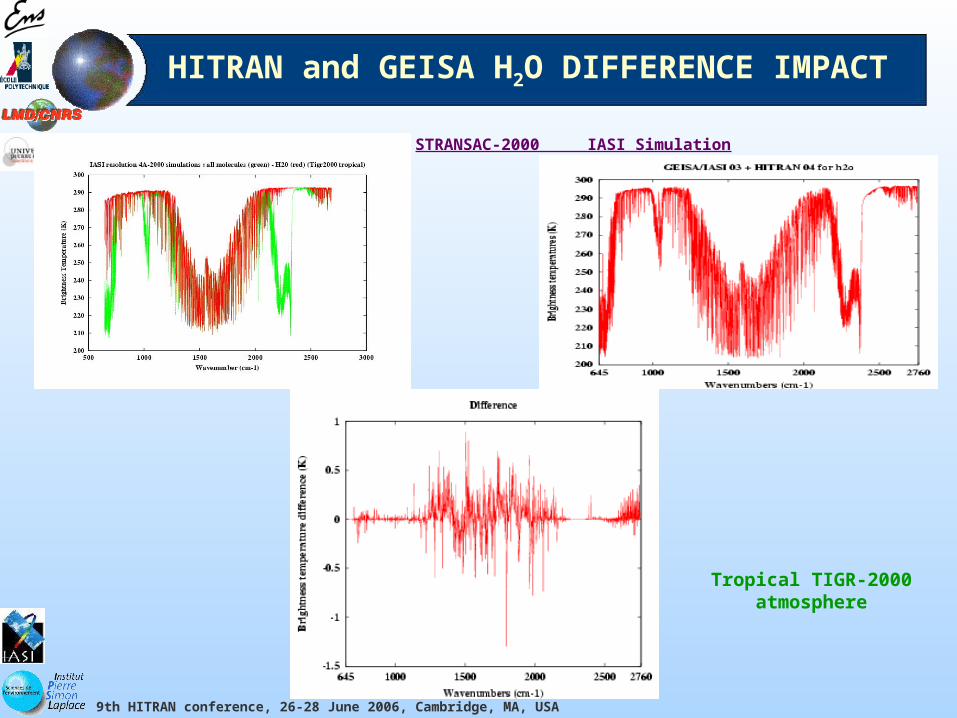
HITRAN and GEISA H2O DIFFERENCE IMPACT
STRANSAC-2000 IASI Simulation
Tropical TIGR-2000atmosphere

9th HITRAN conference, 26-28 June 2006, Cambridge, MA, USA
HITRAN and GEISA O3 DIFFERENCE IMPACT
STRANSAC-2000IASI Simulation
Tropical TIGR-2000atmosphere

9th HITRAN conference, 26-28 June 2006, Cambridge, MA, USA
HITRAN and GEISA N2O DIFFERENCE IMPACT
STRANSAC-2000IASI simulation
Tropical TIGR-2000atmosphere
9th HITRAN conference, 26-28 June 2006, Cambridge, MA, USA
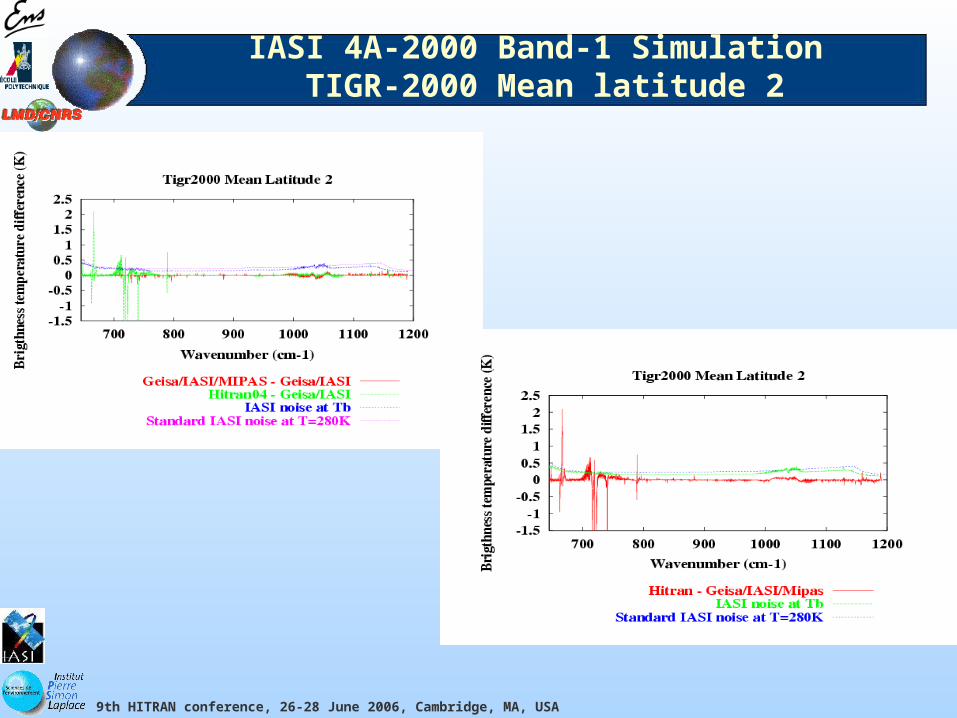
IASI 4A-2000 Band-1 Simulation TIGR-2000 Mean latitude 2
9th HITRAN conference, 26-28 June 2006, Cambridge, MA, USA
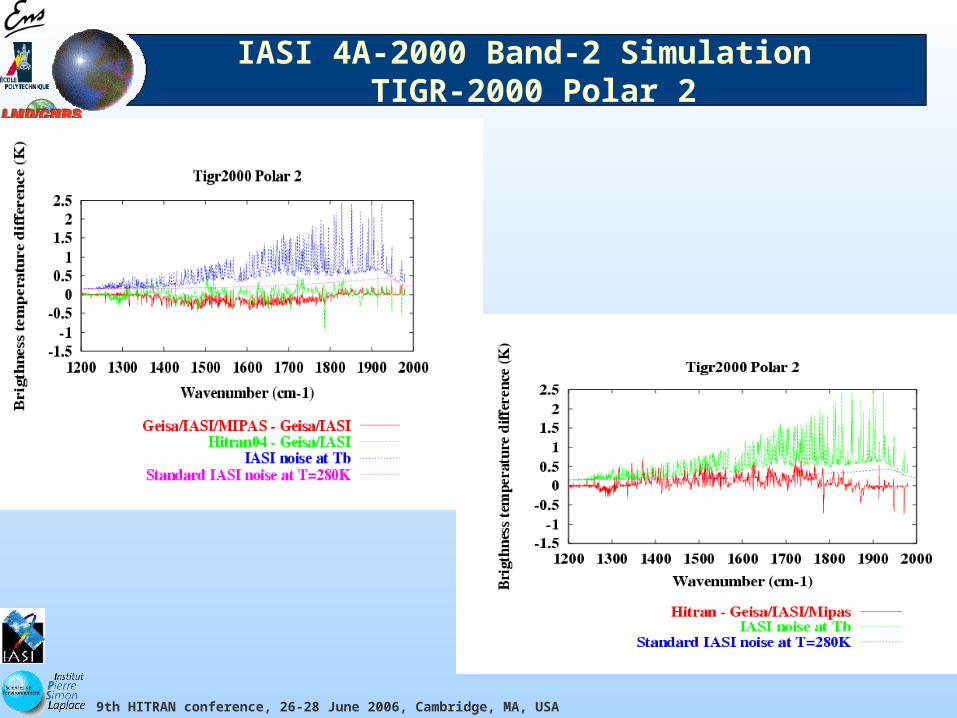
IASI 4A-2000 Band-2 Simulation TIGR-2000 Polar 2

9th HITRAN conference, 26-28 June 2006, Cambridge, MA, USA
IASI 4A-2000 Band-3 Simulation TIGR-2000 Tropical

9th HITRAN conference, 26-28 June 2006, Cambridge, MA, USA
CONCLUDING COMMENTS

9th HITRAN conference, 26-28 June 2006, Cambridge, MA, USA
1. The water vapour spectroscopic parameters: still need to be validated;
2. The water vapour continuum: more tuning to be done when more validation data (especially with high water vapor content) become available;
3. The freons bands at 850 and 920 cm-1: refine the temperature dependence;
4. O3 in the 9.6 micron region: the spectroscopic parameters still need to be validated;
5. Some CO2 – Q branches: further improvement/tuning of the line mixing
Remaining spectroscopy related problems
Some conclusions of validation exercises, using e.g. : the 4A-00/LMD Model, in the case of IASI radiative transfer modelling
9th HITRAN conference, 26-28 June 2006, Cambridge, MA, USA
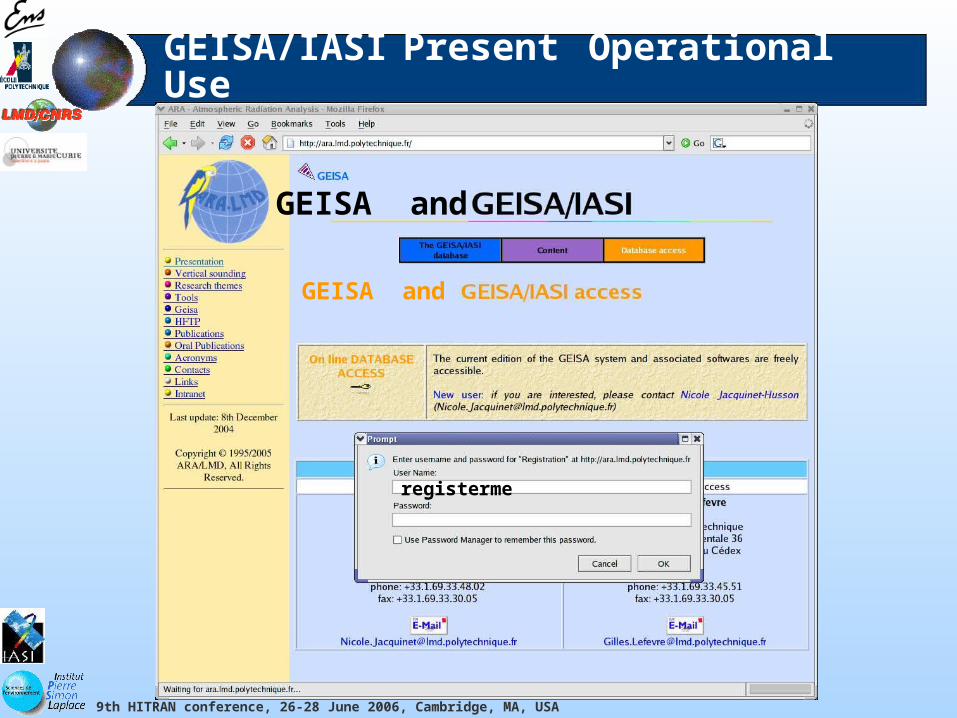
GEISA/IASI Present Operational Use
GEISA and
GEISA and
registerme
9th HITRAN conference, 26-28 June 2006, Cambridge, MA, USA
GEISA/IASI Future Operational Use
Ether Products and Services Centre Facilities:
measurement data from French laboratories, as well as from many international centres, forecasts such as Potential Vorticity, modelling results, downloadable procedures, browse images, on-line processing software (which can be activated through the Ether interface
GEISA/IASI and associated facilities are being implemented on the Ether (CNRS/IPSL) Products and Services Centre (CPS)
Effective fall 2006
9th HITRAN conference, 26-28 June 2006, Cambridge, MA, USA
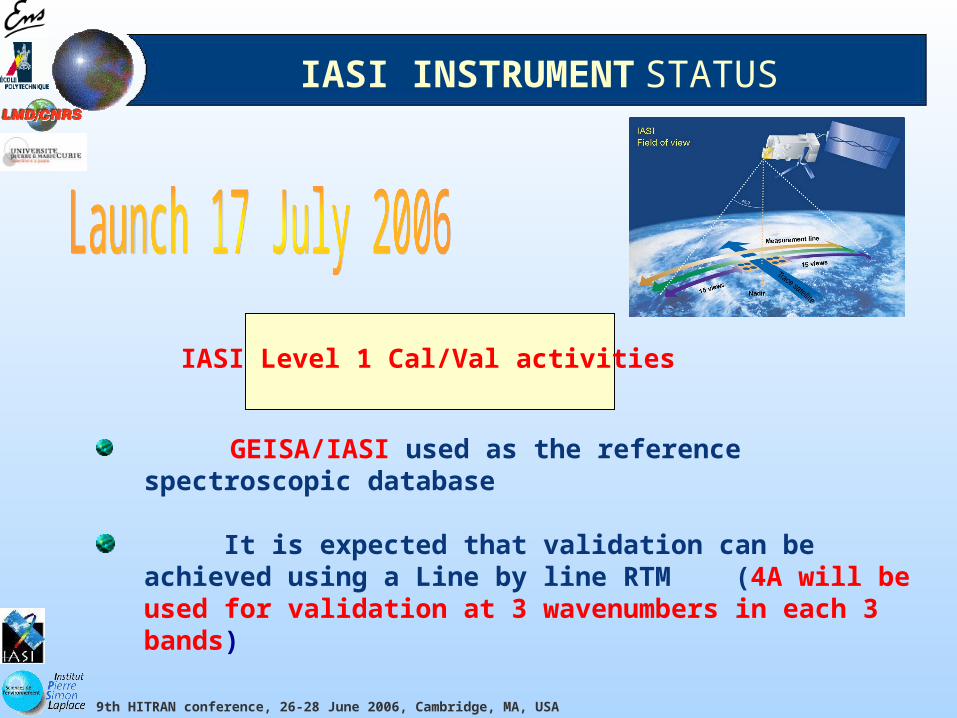
IASI INSTRUMENT STATUS
IASI Level 1 Cal/Val activities
GEISA/IASI used as the reference spectroscopic database
It is expected that validation can be achieved using a Line by line RTM (4A will be used for validation at 3 wavenumbers in each 3 bands)
9th HITRAN conference, 26-28 June 2006, Cambridge, MA, USA
ACKNOWLEDGMENTS
to
CNES and EUMETSAT
for their Encouragements and Supports