99th Annual Report 2017 - Colonial Motor Company€¦ · 1 1 NOTICE OF ANNUAL MEETING Notice is...
43
2017 99 th Annual Report
-
Upload
hoangthien -
Category
Documents
-
view
213 -
download
0
Transcript of 99th Annual Report 2017 - Colonial Motor Company€¦ · 1 1 NOTICE OF ANNUAL MEETING Notice is...

201799th Annual Report

BOARD OF DIRECTORS J P (Jim) Gibbons, Chairman
Graeme D Gibbons
Falcon R S Clouston
Denis M Wood
Matthew J Newman
Stuart B Gibbons
Ashley J Waugh
CHIEF EXECUTIVE
COMPANY SECRETARY
GROUP ACCOUNTANT
Graeme D Gibbons
Nicholas K Bartle
Deirdre F Doyle
AUDITOR
Grant Thornton New Zealand Audit Partnership (Partner Michael Stewart)
BANKERS
ANZ Bank New Zealand Limited
Bank of New Zealand
Westpac New Zealand Limited
SHARE REGISTRY Computershare Investor Services Limited
Level 2, 159 Hurstmere Road
Takapuna, North Shore
Private Bag 92119
Auckland 1142
Website: www.computershare.co.nz/investorcentre
REGISTERED OFFICE AND ADDRESS FOR SERVICE
Level 6
57 Courtenay Place
PO Box 6159
Wellington 6141
New Zealand
Telephone (04) 384-9734
Facsimilie (04) 801-7279
E-mail address [email protected]
Website www.colmotor.co.nz
PROSPECTIVE DATES FOR 2018 Interim Half Year Report Late February
Interim Dividend 16 April
Preliminary Full Year Report Late August
Annual Report Late September
Final Dividend 15 October
Annual Meeting 2 November
Shareholder enquiries can be addressed to the Registered Office or directly to the Share Registry.

11
1
NOTICE OF ANNUAL MEETING
Notice is hereby given that the 99th annual meeting of shareholders ofThe Colonial Motor Company Limited
will be held in theLion Harbourview Lounge, Michael Fowler Centre
111 Wakefield Street, Wellington, New Zealandon Friday, 3 November 2017 commencing at 12:00 midday.
Agenda
1. The Chairman’s introduction2. Address from the Chairman3. Shareholder discussion4. Resolutions (see explanatory notes)
To consider and, if thought fit, pass the following ordinary resolutions(a) To re-elect Mr Stuart Barnes Gibbons as a Director of the Company(b) To re-elect Mr Denis Michael Wood as a Director of the Company(c) To record the on-going appointment of Grant Thornton as Auditor and to authorise the directors to fix the
Auditor’s remuneration5. General business.
By order of the Board
N K BartleCompany Secretary18 September 2017
Explanatory notes to resolutionsOrdinary resolutions are passed by a simple majority of votes.In accordance with the Company’s constitution and the NZX listing rules, one third of the directors are required to retire each year. The directors retiring by rotation at the 2017 Annual Meeting are S B Gibbons and D M Wood. Both continue to be eligible and offer themselves for re-election. Under section 200 of the Companies Act 1993, the Auditor is automatically re-appointed each year unless ineligible or replaced.ProxiesAny shareholder is entitled to attend and vote at the meeting or to appoint a proxy to attend on their behalf. A proxy need not be a shareholder of the Company. A proxy form accompanies this notice. Proxy forms must be received at the registered office of the company not later than 48 hours prior to the scheduled commencement of the meeting.Representatives of CorporationsCorporate bodies appointing a representative to attend the meeting should comply with Clause 23 of the Constitution that reads as follows:
"Appointment of representative: A corporation which is a shareholder may appoint a person to attend a meeting of shareholders on its behalf in the same manner as that in which it could appoint a proxy."

2
3
Directors’ Report
Your Directors have pleasure in presenting the 99th annual report and audited financial statements of The Colonial Motor Company Limited (“CMC” or “Company”) and its subsidiaries (“Group”) for the year ended 30 June 2017.
Revenue and profit Revenue for the year was $854.8m. This is a 1% decrease on the previous year’s $867.2m reflecting the sale of the BMW dealerships. A like-for-like comparison of the two years shows continuing growth in revenue. The trading profit after tax for the year was $22.0m, up 15% on last year’s $19.2m. Trading profit after tax is not specified under Generally Accepted Accounting Practice but is a consistent measure of the underlying trading profitability of the Group before valuation changes of assets and deferred tax. It is also the reference point used by the board when considering dividends. Profit for the year, which included a number of non-trading items such as asset revaluations, impairment of intangibles and deferred tax, was up 4% on last year to $23.5m (2016: $22.6m).
Statement of financial position Total assets rose to $316.9m at year end (2016: $300.9m). The annual independent revaluation of the Group’s property brought about an increase in the revaluation reserve of $7.4m(2016: $7.3m). Capital expenditure, particularly in the Hamilton facility for Southpac Trucks, contributed to the increase in property values. At balance date Shareholders’ equity was $180.9m (2016: $163.8m).
Dividends Dividends paid in respect of this year will total 44.0 cents per share (2016: 40.0 cents per share). An interim dividend of 13.0 cents per share was paid on 18 April 2017 and a final dividend of 31.0 cents per share will be paid on 16 October 2017. Both dividends were fully imputed. The value of the distributions for this year will be $14.4m (2016: $13.1m) representing 65%(2016: 68%) of the trading profit after tax.
Total shareholder returns over the past ten years are shown in the graph on page 2 and the table on page 39. The dividend yield has remained within the range of 8.0% to 12.0% p.a. over the last 10 years.
Directors The independent Directors at 30 June 2017 and the date of this report were F R S Clouston and A J Waugh.The Company’s constitution and the NZX listing rules require one third of the Directors to retire each year. The Directors retiring this year will be Mr S B Gibbons and Mr D M Wood. Both are eligible and are seeking re-election.
Director and company disclosures Information required to be disclosed by the directors and by the Company, to comply with the Companies Act 1993 and the Listing Rules of the New Zealand Stock Exchange, is detailed on pages 36 to 40.
NZX Governance CodeThe NZX has introduced an updated Corporate Governance Code which applies for all reporting periods from October 2017, so for CMC the period ending 30 June 2018.The Company’s current Governance Statement is set out on pages 34 and 35 of this report.The new code covers eight principles with recommendations that must be complied with or explained as to why not and commentary on voluntary additional areas.In big picture terms the company already has all the core requirements of the eight principles in place and will be working through the detail to ensure we comply with the new updated code.
For the Directors18 September 2017
J P Gibbons F R S Clouston
2
2
Facts and Trends at a Glance2017 2016 2015 2014 2013
Revenue ($000) 854,764 867,237 789,377 699,314 614,407Trading profit after tax (excluding non-trading Items) ($000) 22,000 19,207 16,326 18,221 13,867Profit after tax attributable to shareholders ($000) 22,232 21,479 17,597 19,153 13,902Return on average shareholders’ funds
- trading profit 12.8% 12.2% 11.2% 13.4% 10.9%- profit for the year 13.0% 13.7% 12.1% 14.1% 10.9%
Trading profit per dollar of revenue 2.6c 2.2c 2.1c 2.6c 2.3cEarnings per share - trading profit after tax 67.3c 58.7c 49.9c 55.7c 42.4c
- profit for the year 68.0c 65.7c 53.8c 58.6c 42.5cDividend per share 44.0c 40.0c 33.0c 35.0c 30.0cTotal dividends for the year ($000) 14,386 13,078 10,789 11,443 9,808Shares on issue at reporting date 32.695m 32.695m 32.695m 32.695m 32.695mCurrent ratio 1.6 1.5 1.4 1.4 1.4Shareholders' equity as a percent of total assets 57.1% 54.4% 45.9% 49.3% 50.7%Net tangible asset backing per share $5.19 $4.69 $4.33 $4.05 $3.79
(after final dividend is paid)

3
3
Directors’ Report
Your Directors have pleasure in presenting the 99th annual report and audited financial statements of The Colonial Motor Company Limited (“CMC” or “Company”) and its subsidiaries (“Group”) for the year ended 30 June 2017.
Revenue and profit Revenue for the year was $854.8m. This is a 1% decrease on the previous year’s $867.2m reflecting the sale of the BMW dealerships. A like-for-like comparison of the two years shows continuing growth in revenue. The trading profit after tax for the year was $22.0m, up 15% on last year’s $19.2m. Trading profit after tax is not specified under Generally Accepted Accounting Practice but is a consistent measure of the underlying trading profitability of the Group before valuation changes of assets and deferred tax. It is also the reference point used by the board when considering dividends. Profit for the year, which included a number of non-trading items such as asset revaluations, impairment of intangibles and deferred tax, was up 4% on last year to $23.5m (2016: $22.6m).
Statement of financial position Total assets rose to $316.9m at year end (2016: $300.9m). The annual independent revaluation of the Group’s property brought about an increase in the revaluation reserve of $7.4m(2016: $7.3m). Capital expenditure, particularly in the Hamilton facility for Southpac Trucks, contributed to the increase in property values. At balance date Shareholders’ equity was $180.9m (2016: $163.8m).
Dividends Dividends paid in respect of this year will total 44.0 cents per share (2016: 40.0 cents per share). An interim dividend of 13.0 cents per share was paid on 18 April 2017 and a final dividend of 31.0 cents per share will be paid on 16 October 2017. Both dividends were fully imputed. The value of the distributions for this year will be $14.4m (2016: $13.1m) representing 65%(2016: 68%) of the trading profit after tax.
Total shareholder returns over the past ten years are shown in the graph on page 2 and the table on page 39. The dividend yield has remained within the range of 8.0% to 12.0% p.a. over the last 10 years.
Directors The independent Directors at 30 June 2017 and the date of this report were F R S Clouston and A J Waugh.The Company’s constitution and the NZX listing rules require one third of the Directors to retire each year. The Directors retiring this year will be Mr S B Gibbons and Mr D M Wood. Both are eligible and are seeking re-election.
Director and company disclosures Information required to be disclosed by the directors and by the Company, to comply with the Companies Act 1993 and the Listing Rules of the New Zealand Stock Exchange, is detailed on pages 36 to 40.
NZX Governance CodeThe NZX has introduced an updated Corporate Governance Code which applies for all reporting periods from October 2017, so for CMC the period ending 30 June 2018.The Company’s current Governance Statement is set out on pages 34 and 35 of this report.The new code covers eight principles with recommendations that must be complied with or explained as to why not and commentary on voluntary additional areas.In big picture terms the company already has all the core requirements of the eight principles in place and will be working through the detail to ensure we comply with the new updated code.
For the Directors18 September 2017
J P Gibbons F R S Clouston
3

4
5
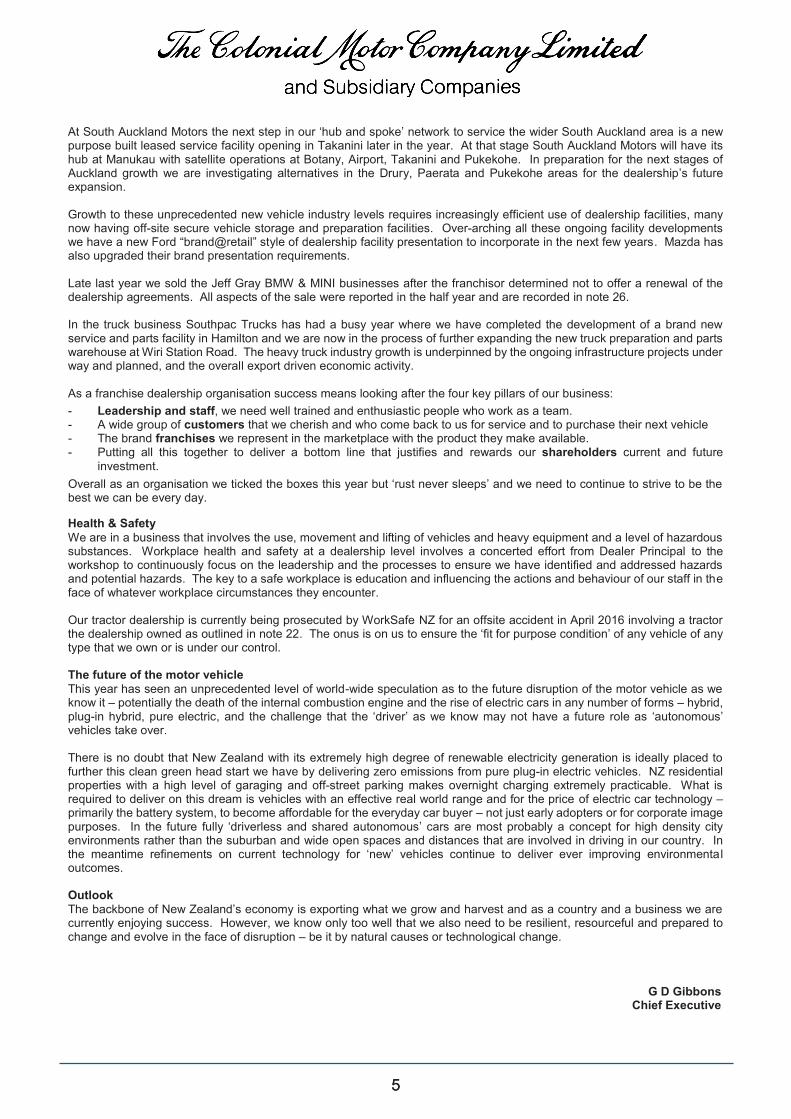
At South Auckland Motors the next step in our ‘hub and spoke’ network to service the wider South Auckland area is a new purpose built leased service facility opening in Takanini later in the year. At that stage South Auckland Motors will have its hub at Manukau with satellite operations at Botany, Airport, Takanini and Pukekohe. In preparation for the next stages of Auckland growth we are investigating alternatives in the Drury, Paerata and Pukekohe areas for the dealership’s future expansion. Growth to these unprecedented new vehicle industry levels requires increasingly efficient use of dealership facilities, many now having off-site secure vehicle storage and preparation facilities. Over-arching all these ongoing facility developments we have a new Ford “brand@retail” style of dealership facility presentation to incorporate in the next few years. Mazda has also upgraded their brand presentation requirements. Late last year we sold the Jeff Gray BMW & MINI businesses after the franchisor determined not to offer a renewal of the dealership agreements. All aspects of the sale were reported in the half year and are recorded in note 26. In the truck business Southpac Trucks has had a busy year where we have completed the development of a brand new service and parts facility in Hamilton and we are now in the process of further expanding the new truck preparation and parts warehouse at Wiri Station Road. The heavy truck industry growth is underpinned by the ongoing infrastructure projects under way and planned, and the overall export driven economic activity. As a franchise dealership organisation success means looking after the four key pillars of our business: - Leadership and staff, we need well trained and enthusiastic people who work as a team. - A wide group of customers that we cherish and who come back to us for service and to purchase their next vehicle - The brand franchises we represent in the marketplace with the product they make available. - Putting all this together to deliver a bottom line that justifies and rewards our shareholders current and future
investment. Overall as an organisation we ticked the boxes this year but ‘rust never sleeps’ and we need to continue to strive to be the best we can be every day. Health & Safety We are in a business that involves the use, movement and lifting of vehicles and heavy equipment and a level of hazardous substances. Workplace health and safety at a dealership level involves a concerted effort from Dealer Principal to the workshop to continuously focus on the leadership and the processes to ensure we have identified and addressed hazards and potential hazards. The key to a safe workplace is education and influencing the actions and behaviour of our staff in the face of whatever workplace circumstances they encounter. Our tractor dealership is currently being prosecuted by WorkSafe NZ for an offsite accident in April 2016 involving a tractor the dealership owned as outlined in note 22. The onus is on us to ensure the ‘fit for purpose condition’ of any vehicle of any type that we own or is under our control. The future of the motor vehicle This year has seen an unprecedented level of world-wide speculation as to the future disruption of the motor vehicle as we know it – potentially the death of the internal combustion engine and the rise of electric cars in any number of forms – hybrid, plug-in hybrid, pure electric, and the challenge that the ‘driver’ as we know may not have a future role as ‘autonomous’ vehicles take over. There is no doubt that New Zealand with its extremely high degree of renewable electricity generation is ideally placed to further this clean green head start we have by delivering zero emissions from pure plug-in electric vehicles. NZ residential properties with a high level of garaging and off-street parking makes overnight charging extremely practicable. What is required to deliver on this dream is vehicles with an effective real world range and for the price of electric car technology – primarily the battery system, to become affordable for the everyday car buyer – not just early adopters or for corporate image purposes. In the future fully ‘driverless and shared autonomous’ cars are most probably a concept for high density city environments rather than the suburban and wide open spaces and distances that are involved in driving in our country. In the meantime refinements on current technology for ‘new’ vehicles continue to deliver ever improving environmenta l outcomes. Outlook The backbone of New Zealand’s economy is exporting what we grow and harvest and as a country and a business we are currently enjoying success. However, we know only too well that we also need to be resilient, resourceful and prepared to change and evolve in the face of disruption – be it by natural causes or technological change.
G D Gibbons Chief Executive
4
4
Chief Executive’s Report
A successful year for the Group with a record trading profit. The increase in profit has come on the back of all-time record new vehicle industry levels. Markets The new vehicle industry has grown every year from its low point of 70,000 in 2009. In 2014 it passed the previous high point set thirty years earlier in 1984, reaching 146,753 vehicles in 2016. 2017 is currently 11% higher than 2016 on a year to date basis. However growth in July and August has been minimal. It takes a strong and functioning economy with consumer confidence to sustain this level of activity. Commercial vehicle sales are the backbone of this growth – be it utes, vans or trucks. Within the passenger market consumer preference has moved from sedans and hatchbacks to SUV’s of all sizes – small, medium and large. Ford Ranger continues its market dominance as the top commercial vehicle as well as being the number one selling vehicle in New Zealand. In the passenger market Mazda has increased its share with its SUV range of CX3, new models CX5 and CX9. This year the heavy truck industry has more than recovered from the dip in 2015-2016. Southpac Trucks have increased their presence with Kenworth and DAF models and their unsurpassed product support through their nationwide branch and independent parts & service dealer network Dealership Developments In Invercargill, Macaulay Motors are close to completing the refurbishment of their workshop and customer service reception facility. In Queenstown we are awaiting the issue of a property title which will finalise the land purchase and trigger construction of a long planned new Macaulay Motors sales and service centre for Ford and Mazda. This new operation will be twice the capacity of the existing facility. At Avon City Ford in Christchurch the commercial service and customer reception upgrade is nearing completion and we continue to review options for the upgrade of the showroom. Team Hutchinson Ford continues to operate well in a sub-optimal Tuam Street facility environment patiently waiting for details of the proposed South Frame ‘greenway’ to be resolved. The ‘greenway’ will split the dealership into two halves with a single crossing and require substantial building work as it requires a 60 metre long slice to be removed from the current workshop. A resource consent is in place for the necessary work however the government authorities have yet to sign off on the agreement. In Nelson where M.S. Motors have leased premises in Haven Road, the dealership is working with the landlord to refresh and improve the sales building, to build a dedicated Kia showroom as well as re-arranging the service area to accommodate separate Kia service bays. In conjunction with this activity at Haven Road the dealership is working on establishing a commercial service facility in the Annesbrook/Stoke area in addition to the existing service outlet at Richmond. Capital City Motors continues to lease the Taranaki Street site (sold in 2015) on a short term basis as we work towards securing property to realign brand representation in the Wellington metropolitan market as “future retail” evolves especially in densely populated city locations. We own a property in upper Taranaki Street which will become the future city retail service outlet.
0
20,000
40,000
60,000
80,000
100,000
120,000
140,000
160,000
180,000
84 85 86 87 88 89 90 91 92 93 94 95 96 97 98 99 00 01 02 03 04 05 06 07 08 09 10 11 12 13 14 15 16 17
Re
gis
tra
tio
ns
Calendar Year
Vehicle Registrations
New Vehicles
Used Imports
0
20,000
40,000
60,000
80,000
100,000
120,000
140,000
160,000
180,000
84 85 86 87 88 89 90 91 92 93 94 95 96 97 98 99 00 01 02 03 04 05 06 07 08 09 10 11 12 13 14 15 16 17
Re
gis
tra
tio
ns
Calendar Year
Vehicle Registrations
New Vehicles
0
20,000
40,000
60,000
80,000
100,000
120,000
140,000
160,000
180,000
84 85 86 87 88 89 90 91 92 93 94 95 96 97 98 99 00 01 02 03 04 05 06 07 08 09 10 11 12 13 14 15 16 17
Re
gis
tra
tio
ns
Calendar Year
Vehicle Registrations
Used Imports
5
5
At South Auckland Motors the next step in our ‘hub and spoke’ network to service the wider South Auckland area is a new purpose built leased service facility opening in Takanini later in the year. At that stage South Auckland Motors will have its hub at Manukau with satellite operations at Botany, Airport, Takanini and Pukekohe. In preparation for the next stages of Auckland growth we are investigating alternatives in the Drury, Paerata and Pukekohe areas for the dealership’s future expansion. Growth to these unprecedented new vehicle industry levels requires increasingly efficient use of dealership facilities, many now having off-site secure vehicle storage and preparation facilities. Over-arching all these ongoing facility developments we have a new Ford “brand@retail” style of dealership facility presentation to incorporate in the next few years. Mazda has also upgraded their brand presentation requirements. Late last year we sold the Jeff Gray BMW & MINI businesses after the franchisor determined not to offer a renewal of the dealership agreements. All aspects of the sale were reported in the half year and are recorded in note 26. In the truck business Southpac Trucks has had a busy year where we have completed the development of a brand new service and parts facility in Hamilton and we are now in the process of further expanding the new truck preparation and parts warehouse at Wiri Station Road. The heavy truck industry growth is underpinned by the ongoing infrastructure projects under way and planned, and the overall export driven economic activity. As a franchise dealership organisation success means looking after the four key pillars of our business: - Leadership and staff, we need well trained and enthusiastic people who work as a team. - A wide group of customers that we cherish and who come back to us for service and to purchase their next vehicle - The brand franchises we represent in the marketplace with the product they make available. - Putting all this together to deliver a bottom line that justifies and rewards our shareholders current and future
investment. Overall as an organisation we ticked the boxes this year but ‘rust never sleeps’ and we need to continue to strive to be the best we can be every day. Health & Safety We are in a business that involves the use, movement and lifting of vehicles and heavy equipment and a level of hazardous substances. Workplace health and safety at a dealership level involves a concerted effort from Dealer Principal to the workshop to continuously focus on the leadership and the processes to ensure we have identified and addressed hazards and potential hazards. The key to a safe workplace is education and influencing the actions and behaviour of our staff in the face of whatever workplace circumstances they encounter. Our tractor dealership is currently being prosecuted by WorkSafe NZ for an offsite accident in April 2016 involving a tractor the dealership owned as outlined in note 22. The onus is on us to ensure the ‘fit for purpose condition’ of any vehicle of any type that we own or is under our control. The future of the motor vehicle This year has seen an unprecedented level of world-wide speculation as to the future disruption of the motor vehicle as we know it – potentially the death of the internal combustion engine and the rise of electric cars in any number of forms – hybrid, plug-in hybrid, pure electric, and the challenge that the ‘driver’ as we know may not have a future role as ‘autonomous’ vehicles take over. There is no doubt that New Zealand with its extremely high degree of renewable electricity generation is ideally placed to further this clean green head start we have by delivering zero emissions from pure plug-in electric vehicles. NZ residential properties with a high level of garaging and off-street parking makes overnight charging extremely practicable. What is required to deliver on this dream is vehicles with an effective real world range and for the price of electric car technology – primarily the battery system, to become affordable for the everyday car buyer – not just early adopters or for corporate image purposes. In the future fully ‘driverless and shared autonomous’ cars are most probably a concept for high density city environments rather than the suburban and wide open spaces and distances that are involved in driving in our country. In the meantime refinements on current technology for ‘new’ vehicles continue to deliver ever improving environmenta l outcomes. Outlook The backbone of New Zealand’s economy is exporting what we grow and harvest and as a country and a business we are currently enjoying success. However, we know only too well that we also need to be resilient, resourceful and prepared to change and evolve in the face of disruption – be it by natural causes or technological change.
G D Gibbons Chief Executive
5

6
6
GROUP DEALERSHIPS
Company name Chief Executive / Dealer Principal
Franchises Location Web address
Southpac Trucks Ltd Maarten Durent Kenworth & DAF
Heavy Trucks Manukau City,
Hamilton, Rotorua &
Christchurch
www.spt.co.nz
South Auckland Motors Ltd
Matthew Newman Michael Tappenden (DP)
Ford & Mazda Manukau City, Auckland Airport,
Botany & Pukekohe
www.southaucklandmotors.co.nz
Southern Autos – Manukau Ltd
Matthew Newman Andrew Craw (DP)
Peugeot, Citroen & Isuzu
Manukau City www.southernautos.co.nz
Energy City Motors Ltd Russell Dempster Ford New Plymouth & Hawera
www.energyford.co.nz
Hertz Rentals New Plymouth
Energy Motors Ltd Shaun Biesiek (DP) Hyundai & Isuzu New Plymouth www.energyhyundai.co.nz www.energymotorsisuzu.co.nz
Ruahine Motors Ltd David Wills Ford Waipukurau www.ruahinemotors.co.nz
The Hawkes Bay Motor Company Ltd
Paul Bond (DP) Nissan Hastings www.hawkesbaynissan.co.nz
Fagan Motors Ltd Keith Allen Ford & Mazda Suzuki Motorcycles
Masterton www.faganmotors.co.nz www.fagansuzuki.co.nz
Stevens Motors Ltd Stuart Gibbons Ford & Mazda Lower Hutt www.stevensmotors.co.nz
Capital City Motors Ltd Matthew Carman Ford & Mazda Wellington, Porirua & Kapiti
www.capitalcitymotors.co.nz
M.S. Motors (1998) Ltd Alan Kirby Ford Nelson www.nelsonford.co.nz KIA Richmond www.nelsonkia.co.nz
Hutchinson Motors Ltd John Hutchinson Ford Christchurch www.thf.co.nz
Avon City Motors Ltd John Luxton Ford Christchurch & Rangiora
www.acford.co.nz
Avon City Motorcycles Ltd
John Luxton Suzuki & BMW Motorcycles
Christchurch www.avoncitysuzuki.co.nz
Timaru Motors Ltd Wayne Pateman Ford & Mazda Timaru www.timarumotors.co.nz
Dunedin City Motors Ltd Robert Bain Ford & Mazda Dunedin, Oamaru & Alexandra
www.dcmotors.co.nz
Macaulay Motors Ltd Grant Price Ford & Mazda Invercargill & Queenstown
www.macaulaymotors.co.nz
Agricentre South Ltd
Grant Price Case IH Tractors & Kuhn Implements
Invercargill, Gore, Milton & Cromwell
www.agricentre.co.nz
New Holland, Kubota Tractors Norwood Ag Equipment
Invercargill & Gore
6

7
7
Consolidated Statement of PROFIT OR LOSS for the year ended 30 June 2017
Note 2017 $000
2016 $000
Revenue
Sale of - products 786,945 801,081 - services 65,915 64,449 Other income - interest 222 180 - other 1,682 1,527
Total revenue 854,764 867,237
Less expenses 1 Cost of products sold 716,611 727,605 Remuneration of staff 69,172 70,082 Depreciation & amortisation 3,750 4,182 Property occupation costs 6,607 7,074 Marketing, promotion & training costs 6,246 6,292 Other operating costs 16,476 19,003 Interest costs 3,852 4,260 Total expenses 822,714 838,498
Trading profit before tax 32,050 28,739
Less: Income tax expense: 18
Current 9,075 8,358 Deferred (328) 68 23,303 20,313 Less: Non-controlling interest 1,303 1,106
Trading profit after tax 22,000 19,207
Fair value revaluation of property (119) 662 Deferred tax on property depreciation 18 113 141 Realised gain on sale of property 9 1,072 Fair value revaluation of investments 544 397 Impairment of intangible assets 12 (315) - Profit for the year attributable to: Shareholders 22,232 21,479 Non-controlling interest 1,303 1,106
PROFIT FOR THE YEAR 23,535 22,585
Statistics per share
Basic & diluted earnings per share 14 Profit for the year 68.0 cents 65.7 cents Trading profit after tax 67.3 cents 58.7 cents Dividend per share 44.0 cents 40.0 cents Dividend declared for the year ($000) 14,386 13,078 Net tangible assets per share (pre dividend) $5.50 $4.96
The statement of accounting policies and the accompanying notes form part of the financial statements
7

8
8
Consolidated Statement of COMPREHENSIVE INCOME for the year ended 30 June 2017 Note 2017
$000 2016 $000
Profit after tax for the year 23,535 22,585 Other comprehensive income: Items that will not be reclassified subsequently to profit or loss: Property revaluation reserve Fair value movement 7,414 7,318 Deferred tax 18 (9) (1,457) Items that may be reclassified subsequently to profit or loss: Foreign exchange reserve Movement in cashflow hedge 789 (4,274) Deferred tax movement 18 (221) 1,196 Other comprehensive income for the year 7,973 2,783 Total comprehensive income for the year 31,508 25,368 Attributable to: Shareholders 30,120 24,724 Non-controlling interest 1,388 644 31,508 25,368
Consolidated Statement of CHANGES IN EQUITY for the year ended 30 June 2017
17
Total equity at beginning of year 165,805 152,576 Comprehensive income Profit for the year 23,535 22,585 Other comprehensive income 7,973 2,783 Total comprehensive income 31,508 25,368 Dividends paid to shareholders 16 (13,078) (10,789) Dividend paid to non-controlling interest (1,350) (1,350) Total equity at end of year 182,885 165,805
Consolidated Statement of CASH FLOWS for the year ended 30 June 2017
Cash flows from operating activities
Receipts from customers 852,463 870,801 Interest received 222 180 Dividends received 147 147 Payments to suppliers & employees (823,646) (821,232) Interest paid (3,852) (4,260) Income taxes paid (9,507) (7,394) Net cash flow from operating activities 21 15,827 38,242 Cash flows from investing activities Proceeds from sale of property, plant & equipment 2,144 16,143 Proceeds from the sale of intangibles & investments 139 - Purchase of property, plant & equipment (14,077) (7,426) Net cash flow (to) / from investing activities (11,794) 8,717 Cash flows from financial activities Increase / (decrease) in borrowings 2,567 (24,683) Increase / (decrease) in deposits 486 (516) Dividends paid to shareholders (14,428) (12,139) Net cash flow (to) / from financing activities (11,375) (37,338) Net increase / (decrease) in cash held (7,342) 9,621 Opening cash brought forward 15,402 5,781 Closing cash balance 11 8,060 15,402
The statement of accounting policies and the accompanying notes form part of the financial statements
8
9
9
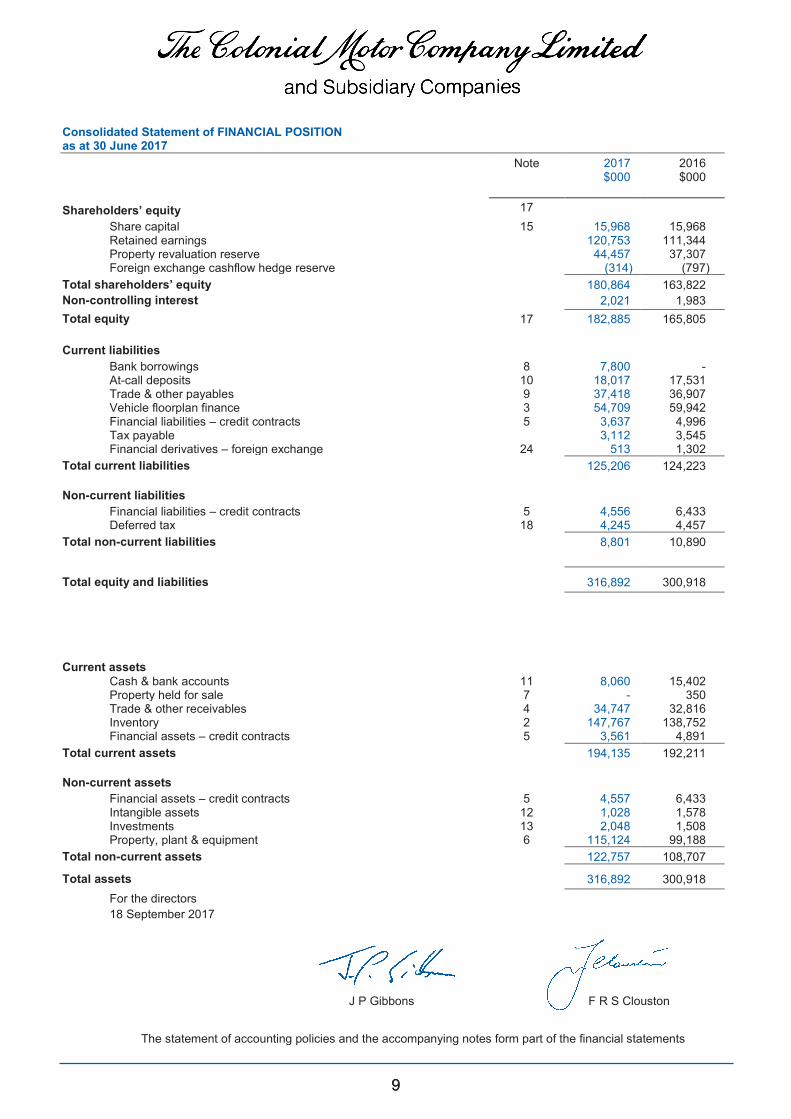
Consolidated Statement of FINANCIAL POSITION as at 30 June 2017 Note 2017
$000 2016 $000
Shareholders’ equity 17 Share capital 15 15,968 15,968 Retained earnings 120,753 111,344 Property revaluation reserve 44,457 37,307 Foreign exchange cashflow hedge reserve (314) (797) Total shareholders’ equity 180,864 163,822 Non-controlling interest 2,021 1,983 Total equity 17 182,885 165,805 Current liabilities Bank borrowings 8 7,800 - At-call deposits 10 18,017 17,531 Trade & other payables 9 37,418 36,907 Vehicle floorplan finance 3 54,709 59,942 Financial liabilities – credit contracts 5 3,637 4,996 Tax payable 3,112 3,545 Financial derivatives – foreign exchange 24 513 1,302 Total current liabilities 125,206 124,223 Non-current liabilities Financial liabilities – credit contracts 5 4,556 6,433 Deferred tax 18 4,245 4,457 Total non-current liabilities 8,801 10,890
Total equity and liabilities 316,892 300,918
Current assets Cash & bank accounts 11 8,060 15,402 Property held for sale 7 - 350 Trade & other receivables 4 34,747 32,816 Inventory 2 147,767 138,752 Financial assets – credit contracts 5 3,561 4,891 Total current assets 194,135 192,211 Non-current assets Financial assets – credit contracts 5 4,557 6,433 Intangible assets 12 1,028 1,578 Investments 13 2,048 1,508 Property, plant & equipment 6 115,124 99,188 Total non-current assets 122,757 108,707
Total assets 316,892 300,918 For the directors
18 September 2017
J P Gibbons F R S Clouston
The statement of accounting policies and the accompanying notes form part of the financial statements
9

10
10
Statement of accounting policies for the year ended 30 June 2017
REPORTING ENTITY The financial statements presented are for The Colonial Motor Company Limited (“The Company”) and its subsidiaries (“The Group”). The Company is an FMC Reporting Entity under the Financial Markets Conduct Act 2013. Where an FMC Reporting Entity prepares consolidated financial statements, parent company disclosures are not required and have not been included in these financial statements. The Group is a Tier 1 For Profit Reporting Entity as set out in the External Reporting Board’s Accounting Standards Framework. The Colonial Motor Company Limited is a New Zealand registered company listed on the New Zealand Stock Exchange. The Group’s principal activity is operating franchised motor vehicle dealerships. BASIS OF PREPARATION Statement of compliance: The Group financial statements have been prepared in accordance with Generally Accepted Accounting Practice in New Zealand (NZ GAAP). They comply with New Zealand Equivalents to International Financial Reporting Standards (NZ IFRS), the Financial Reporting Act 2013 and the Companies Act 1993. They also comply with International Financial Reporting Standards (IFRS) as issued by the International Accounting Standards Board. The financial statements were authorised for issue by the Directors on 18 September 2017. Presentation currency: These financial statements are presented in New Zealand dollars, which is the Group’s functional and presentation currency, rounded to the nearest thousand. Critical accounting assumptions, estimates and judgements: The Group makes assumptions, estimates and judgements concerning the future. They are based on historical experience and other factors including expectations of future events that are believed to be reasonable under the circumstances. Actual results may differ from these estimates. Estimates, judgements and underlying assumptions are reviewed on an ongoing basis. Revisions to accounting estimates are recognised in the period in which the estimate is revised and any future periods affected. Estimates and judgements that have a significant risk of causing a material adjustment to the carrying amount of the assets and liabilities are detailed in relevant notes to the financial statements. Measurement base: The financial statements have been prepared on an historical cost basis, modified by the revaluation of certain assets and liabilities to fair value through profit or loss. ACCOUNTING POLICIES The accounting policies set out below have been applied consistently to all periods presented in these financial statements. Basis of consolidation: Subsidiaries are entities controlled by the Company. Control requires the investor to have exposure or rights to variable returns and the ability to affect those returns through power over the investee. The financial statements of subsidiaries are included in the consolidated financial statements from the date that control commences until the date that control ceases. Non-controlling interests in the results and equity of subsidiaries are shown separately in each of the consolidated financial statements. They represent the portion of the profit or loss, other comprehensive income and net assets of subsidiaries that is not held by the Group based on their respective ownership interests. Intra-group balances, and any income and expenses from intra-group transactions, are eliminated in preparing the consolidated financial statements.
10

11
11
Statement of accounting policies for the year ended 30 June 2017 Revenue recognition: Revenue is measured at the fair value of the consideration received or receivable. It is recognised to the extent that it is probable that the economic benefits will flow to the Group and the revenue can be reliably measured. Amounts disclosed as revenue are net of returns, trade allowances and rebates. The following specific recognition criteria must also be met before revenue is recognised: Sale of products: Revenue from the sale of goods is recognised when the significant risks and rewards of ownership have passed to the buyer and can be reliably measured. Risk and rewards are considered to have passed to the buyer generally upon the delivery of goods to the customer. Rendering of services: Revenue from the rendering of a service is recognised in the period in which the service is provided. Rental income arising from premises rental is accounted for on a straight line basis over the lease term. Interest Income comprises interest on funds invested. Interest income is recognised in profit or loss as it accrues using the effective interest rate method. Trading profit: Trading profit is defined as Group profit excluding fair value adjustments of non-trading assets plus associated tax and material non-recurring items. Impairment: The carrying amounts of the Group’s assets are reviewed at each reporting date to determine whether there is any objective evidence of impairment. An impairment loss is recognised whenever the carrying amount of an asset exceeds its estimated recoverable amount. Impairment losses directly reduce the carrying amount of assets and are recognised as an expense in the statement of profit or loss. The recoverable amount of an asset or cash generating unit is the greater of its value in use and its fair value less costs to sell. In assessing fair value in use, the estimated future cash flows are discounted to their present value using a pre-tax discount rate of the time value of money and risks specific to that asset. In respect of all assets (except goodwill and intangibles with indefinite useful lives) an impairment loss is reversed if there has been a change in the estimate used to determine the recoverable amount. Goods & Services Tax (GST): The financial statements are prepared net of GST with the exception of receivables and payables which are stated including GST.
11

12
12
Notes to the Consolidated FINANCIAL STATEMENTS for the year ended 30 June 2017 1 Expenditure 2017
$000 2016 $000
Expenditure in the statement of profit or loss includes:
Auditor’s remuneration - audit fees 417 421 - prospectus audit - 5 - other services - - Total auditor’s remuneration 417 426 Operating lease expense 3,128 3,089 Directors’ fees 244 223 Bad debts written off 49 131 Donations 29 5 Contributions to retirement savings Contributions to retirement savings schemes are expensed when incurred. CMC Workplace Savings Scheme (previously the Staff Superannuation Fund) 749 736 KiwiSaver 1,094 1,126 Movement in impairment allowance for: Parts inventory obsolescence (decrease) / increase (181) 192 Doubtful debts 81 57 Credit contracts (20) (31) 2 Inventory
2017 $000
2016 $000
Vehicles 130,084 122,142 Parts, accessories, workshop, fuels & gases 19,632 18,747 Impairment allowance for parts obsolescence (1,949) (2,137) 147,767 138,752 Valuation of inventory: New and used vehicles have been valued at the lower of cost or net realisable value.
Parts, accessories, workshop stocks, fuels and gases are recognised at cost, using where applicable, the first in first out method. Cost includes expenditure incurred in acquiring the inventory and bringing it to the existing location and condition. Due allowance has been made for obsolete and slow moving stock. Inventory, particularly of vehicles, is reviewed, on a transaction by transaction basis, as part of normal commercial trading. Estimates and judgement are required to ensure that carrying values do not exceed net realisable value at reporting date. Parts inventory is reviewed regularly for slow-moving or obsolete stock. At each reporting date an impairment allowance is recognised based on the age of stock and historical evidence of inventory held for a similar timeframe. The movement in the parts obsolescence allowance is as a result of a combination of the realisation and scrapping of aged stock during the reporting period. Total inventory write down including parts, parts obsolescence and vehicles for the year ended 30 June 2017 was $0.018m (2016: $0.708m).
12
13 13
3 Vehicle floorplan finance
2017 $000
2016 $000
Bailment facilities 54,709 48,672 Vehicle floorplan facilities - 11,270 Total vehicle floorplan finance 54,709 59,942
Bailment facilities When not purchased outright, new vehicles are funded by bailment arrangements which represent a financial liability accounted for at amortised cost The vehicles are included in inventory at the same value. Most of the subsidiaries have bailment facilities with finance companies to provide funding for new vehicles. The main finance company is UDC Finance Limited. Under these facilities the finance companies own the vehicles that are placed in the control of the subsidiaries as bailees and are available to display for sale to the public in the dealerships. The subsidiaries pay bailment fees (similar to interest) for the use of the vehicles. The bailment agreements are subject to financial limits. The vehicles are purchased from the finance companies when they are sold to customers.
If the subsidiaries breach the bailment agreements, the finance companies retain the right to repossess and sell the vehicles and the subsidiaries must meet any shortfall of the sale proceeds from the purchase price of the vehicles.
Floorplan facilities At 30 June 2016 some new vehicles were funded under vehicle floorplan facilities provided by the distributor. In this case, ownership of the vehicles is transferred on delivery but payment is delayed generally until the vehicle is sold. These facilities were closed at the time of the business disposal described in note 26.
4 Trade and other receivables
Trade receivables 29,120 26,803 Impairment allowance for doubtful debts (94) (53) 29,026 26,750 Other receivables 4,754 5,072 Prepayments 967 994 34,747 32,816 The carrying value of trade receivables and prepayments is considered to be their fair value. Bad debts are written
off as soon as they become evident and amounted to $0.040m (2016: $0.101m). In addition, all receivables are reviewed for indications of impairment and an allowance maintained to cover accounts where there is objective evidence that the amount may not be able to be collected. The Group considers that no material concentration of credit risk exists with trade receivables due to the spread over a large number of customers. Recoverability of receivables Reliance is placed on credit control measures to minimise bad debts but estimates and judgement based on past experience are required in determining the level of possible future impairment of all types of receivables. Amounts owed by customers included in ‘Financial assets and liabilities – credit contracts’ are recoverable over a number of years and involve estimates over longer periods.
13

14 14
4 Trade and other receivables - continued 2017 $000
2016 $000
An analysis of trade receivables that are past due at 30 June 2017 is as follows: Parts & Service Receivables Total outstanding 11,331 10,950 Overdue (not impaired) 30 – 90 1,967 2,082 Overdue (not impaired) 90 Day + 266 270 % Current (not yet due) 80% 79% % overdue 90 days 2% 2% Impaired (written off during the year) 40 101 Vehicle receivables Total outstanding 17,901 15,853 Overdue (not impaired) 514 2,202 Impaired - - Impaired (written off during the year) - - Impairment allowance Opening balance 53 97 Bad debts written off (40) (101) Impairment allowance movement 81 57 Closing balance 94 53 5 Financial assets & financial liabilities - credit contracts
Dealerships arrange finance for customers to buy vehicles with a number of finance companies. Before the customers enter into the finance agreements, checks are made that the customers meet the creditworthiness and other criteria of the finance companies. Dealerships make the initial loans to the customer but instantaneously assign them to the finance company. Arrangements with Motor Trade Finance Limited (MTF) differ from the other finance companies. MTF retains the right of recourse to the dealership if a particular customer defaults on their payments. Accounting for the MTF financing agreements results in creating a receivable from the customer (which is collected by MTF due to the assignment) and an equal and opposite liability for the amount that may become payable to MTF if the customer defaults. There is a risk if customers fail to make the necessary repayments that the receivable will not be recoverable and the liability will remain payable to MTF. This risk is mitigated by the value of the related vehicle which may be repossessed and sold. At the reporting date the Group had outstanding vehicle financing agreements with MTF in potential liabilities and receivables of $8.193m before impairment allowance (2016: $11.428m) with the following repayment schedule:
Repayments are due from financing agreements over the following periods Up to 1 year 3,637 4,996 1 to 2 years 2,770 3,720 2 to 3 years 1,262 2,007 3 to 4 years 461 611 4 to 5 years 64 94 Total 8,194 11,428 Impairment allowance (76) (104) Carrying value of receivable at reporting date 8,118 11,324 Number of loans 568 782 Value of impaired accounts written off in the year ($000) 1 30 Actual arrears/amounts past due at 30 June ($000) 35 41 Arrears as % of total 0.43% 0.36% Total value of accounts in arrears at 30 June ($000) 491 717 Accounts in arrears as % of total 5.99% 6.33% In the normal course of business the receivable and liability for each finance deal reduce in parallel as customers
make routine repayments. Factors that mitigate the risk of customer default include the credit checks that are carried out when the finance is arranged, timely credit control practices and the number of outstanding loans means there is no concentration of credit risk on a restricted number of debtors. The Group and MTF require security over the vehicles that are financed so that, if other measures fail, the vehicles can be sold to offset bad debts.
If customers default and the sale proceeds of the vehicle do not cover the outstanding balance, the deficit is recognised as an expense in profit or loss. The balances are routinely reviewed for impairment and an allowance is made for amounts that are unlikely to be recovered. The impairment allowance is calculated as a percentage of net amounts outstanding under the credit contracts and is based on historical data of contracts in default and impaired.
14

15 15
6 Property, plant & equipment
Land &
buildings
Furniture, fittings &
equipment Service vehicles Total
$000 $000 $000 $000 Cost or fair value at 30 June 2015 50,692 21,557 5,090 77,339 Accumulated depreciation - (14,283) (2,197) (16,480) Revaluation 28,299 - - 28,299 Net book value at 30 June 2015 78,991 7,274 2,893 89,158 Additions 3,968 1,939 1,519 7,426 Disposals (562) (290) (658) (1,510) Depreciation (1,280) (1,714) (871) (3,865) Movement in revaluation 7,979 - - 7,979 Net book value at 30 June 2016 89,096 7,209 2,883 99,188 Cost or fair value at 30 June 2016 52,818 21,992 5,195 80,005 Accumulated depreciation - (14,783) (2,312) (17,095) Revaluation 36,278 - - 36,278 Net book value at 30 June 2016 89,096 7,209 2,883 99,188 Additions 11,034 1,439 1,415 13,888 Disposals (158) (698) (650) (1,506) Depreciation (1,384) (1,452) (904) (3,740) Movement in revaluation 7,294 - - 7,294 Net book value at 30 June 2017 105,882 6,498 2,744 115,124
Comprised of:
Cost or fair value at 30 June 2017 62,565 21,476 5,314 89,355 Accumulated depreciation - (14,978) (2,570) (17,548) Revaluation 43,317 - - 43,317 Net book value at 30 June 2017 105,882 6,498 2,744 115,124
All land & buildings were independently valued at reporting date by QV Asset & Advisory to comply with Property Institute New Zealand Professional Practice Standards and International Valuation Standards. The principal valuer was Andrew Parkyn B Com (VPM) PG Dip Com SPINZ ANZIV Registered Valuer.
All property has been classified as level 2 in the fair value hierarchy specified in NZ IFRS 13 “Fair Value Measurement” because, although there is an active and open market for commercial properties, each property is unique in its location, size, age, condition and many other factors.
All property was valued at its highest and best use by applying a direct sales comparison approach which derives fair values by comparing the property to similar assets that have recently sold on the open market. The revaluation of property to the latest valuation resulted in a loss through profit or loss of $0.1m (2016: gain of $0.7m). Land and buildings owned by the Company are categorised as property, plant & equipment because they are owned specifically for use in the revenue generating operations of its subsidiaries. Net book value of land & buildings at the reporting date includes capital work in progress of $1.3m (2016: $0.2m). Property, plant & equipment other than land and buildings are carried at cost less accumulated depreciation and impairment losses. Cost includes all expenditure that is directly attributable to the acquisition of the asset. Software that is integral to the functionality of the related equipment is capitalised as part of the asset. Land and buildings, other than properties for sale, are revalued annually to fair value based on independent professional valuations. Any revaluation surplus is credited to the asset revaluation reserve unless it reverses a revaluation decrease for the same asset previously recognised in profit or loss. In that case, the surplus is credited to profit or loss to the extent of the decrease previously charged. Any revaluation deficit is recognised through profit or loss unless it directly offsets a previous surplus in the same asset in the property revaluation reserve.
15

16 16
6 Property, plant & equipment - continued
Any accumulated depreciation at revaluation date is eliminated against the gross carrying amount of the asset and the net amount is restated to the revalued amount of the asset. Land is not depreciated. The economic life of buildings has been assessed at between 33 and 100 years and they have been depreciated accordingly. Other plant and equipment have been depreciated over their estimated useful lives on an accounting basis that the Group considers best reflects the decline in the economic service potential of each class of assets. The general rate bands are shown below:-
Service vehicles 18 - 36% of Diminishing Value Furniture, fittings and equipment 7.5 - 60% of Diminishing Value
Carrying values and depreciation rates are reviewed at each reporting date to ensure depreciation rates are appropriate.
7 Property held for sale
Property subject to sale agreements at reporting date are included in current assets at the lower of carrying value and fair value less costs to sell. At 30 June 2016 an area of bare land that was surplus to requirements on the property owned by the Company at Washdyke in Timaru was subject to a conditional agreement for its sale. It was therefore reclassified as property held for sale. The outstanding conditions were subsequently met. The sale was completed and settled in September 2016.
8 Bank borrowings
2017 $000
2016 $000
Bank borrowings 7,800 -
The Group has wholesale facilities with BNZ, ANZ and Westpac, three highly-respected international registered trading banks, which enable it to borrow at any time amounts up to $56.5m in total. Wholesale borrowing is transacted only by the Company. Its indebtedness is guaranteed by its trading subsidiaries to the full extent of the facilities. All borrowing at the reporting date was repayable at call. The agreements with each of the banks are very similar and require the Group to meet financial criteria based on ratios derived from its financial statements. The Group also pledges to the banks not to grant security over any of its assets i.e. a “negative pledge”. The bank facilities are reviewed annually by the banks and have terms that extend up to three years from the date of each review.
Borrowing costs: Interest expense comprises interest on deposits, bank borrowings and bank overdraft facilities. Interest costs are recognised using the effective interest rate method and expensed in the period they are incurred. See note 19 (c) for interest rate disclosures.
9 Trade & other payables Trade payables 24,678 20,921 Employee benefits 6,675 6,450 Other payables 6,065 9,536 37,418 36,907 Trade and other payables are stated at amortised cost. Employee benefits: The Group provides for benefits accruing to employees for salaries and wages, annual leave
and short term incentives under contractual obligation or when it is probable that payment will occur and they can be reliably measured.
16

1717
10 At call deposits
The Company offers for subscription unsecured call debt securities (''Deposits"). Acceptance of Deposits is restricted to shareholders, employees and their associates.
Deposits are financial liabilities recognised at amortised cost.
At the reporting date the Deposits were constituted by, issued under and are described in a trust deed dated 13September 2016 between the Company, its guaranteeing subsidiaries (as therein defined) and Public Trust as trustee for the holders of Deposits (“the Depositors"). Under the terms of the Trust Deed the Guaranteeing Subsidiaries unconditionally guarantee, jointly and severally the repayment of the deposits together with interest thereon by the Company and by each of the other Guaranteeing Subsidiaries. Previously deposits were accepted under the terms of a prospectus issued by the Company and registered on 10 November 2015 with the New Zealand Companies Office.
Transition to comply with the Financial Markets Conduct Act 2013 was effective from 21 September 2016. The replacing governance documents and product disclosure statement are available on the Disclose Register.
The maximum amount of Deposits on offer at 30 June 2017 was $30.0m. Actual Deposits at 30 June 2017 were$18.0m (2016: $17.5m).
Interest is payable on Deposits at rates that vary from time to time as disclosed to the Depositors on the application form or as subsequently notified to Depositors in writing. The interest rate applicable at 30 June 2017 was 3.25%(2016: 3.25%).
11 Cash and bank accounts
2017$000
2016$000
Bank accounts in funds 8,362 15,462Bank accounts in overdraft (302) (60)Net cash and bank balance 8,060 15,402
These balances include all cash and cash equivalents.
The Company guarantees the amounts owing by its subsidiaries under overdraft facilities and the subsidiaries guarantee the indebtedness of the Company. The aggregate limit on bank overdrafts is $7.0m (2016: $7.3m).
17

18 18
12 Intangible assets
Intangibles with indefinite lives Intangibles with
finite lives Total
Goodwill Franchise
rights Customer databases
$000 $000 $000 $000
Balance at 30 June 2016 1,028 450 100 1,578 Impairment loss during the year - (315) - (315) Amortisation during the year - - (100) (100) Sale of franchise rights - (135) - (135) Balance at 30 June 2017 1,028 - - 1,028 Cost 1,028 315 300 1,643 Accumulated amortisation &
impairment
-
(315)
(300)
(615) Balance at 30 June 2017 1,028 - - (1,028) Intangible assets consist of goodwill and other intangibles. Goodwill is recognised on acquisitions of subsidiaries
or purchases of business assets and represents the excess of the acquisition costs over the fair value of the individually identified acquired assets and liabilities at acquisition date. Other intangible assets include franchise rights and customer databases acquired in a business combination and are initially recognised at fair value and subsequently at amortised cost.
The sale and impairment of franchise rights in the year relate to the sale of the dealership business referred to in note 26.
Intangible assets that are considered to have identifiable useful lives are amortised on a straight line basis over those useful lives. Goodwill and intangibles with indefinite useful lives are subject to impairment testing annually or when events indicate that the carrying amount may not be recoverable and are carried at cost less accumulated impairment losses.
The value of intangible assets was reviewed at 30 June 2017. There was no indication of impairment below their carrying amount.
The value of intangibles is compared with the “value in use” of the affected dealerships, which have been identified as the cash generating units associated with the intangibles. Impairment of the intangible assets is recognised if there is considered to be a permanent reduction of the “value in use”.
Impairment testing calculations require the use of estimates and assumptions. The calculations of “value in use” are based on the actual results for the past five reporting periods together with the projected results for the next five reporting periods. It was assumed that there would be no real growth during the period of the forecasts.
Key assumptions relate to the general economic outlook, the level of the new and used vehicle industries and our business unit performance in this environment.
The discount rate used in completing the cash flow forecast to assess value in use was 11.3% (2016: 11.3%).
Management considers that any reasonable change in a key assumption used in the determination of the value in use would not cause the carrying amount of intangible assets to exceed their recoverable amount.
13 Investments
2017 $000
2016 $000
Shares in Motor Trade Finance Limited (MTF) 2,018 1,474 Other 30 34 Total 2,048 1,508 MTF shares are traded in a quoted but restricted market and are categorised as level two in the fair value hierarchy.
Shares are carried at fair value with changes in value recognised through profit or loss.
18

1919
14 Earnings per share
Basic and diluted earnings per share is calculated by dividing the profit after tax attributable to shareholders by the weighted average number of shares outstanding during the year.
There were no dilutive potential ordinary shares outstanding at year end.
Weighted average number of shares 32,694,632 32,694,632Trading profit after tax ($000) 22,000 19,207Profit for the year attributable to shareholders ($000) 22,232 21,479Basic and diluted earnings per share on:
Profit attributable to shareholders 68.0 cents 65.7 centsTrading profit after tax 67.3 cents 58.7 cents
15 Share capital
Total share capital 15,968 15,968
Number of shares
Number of ordinary shares on issue 32,694,632 32,694,632
All shares on issue are fully paid up and have no par value.All ordinary shares have equal voting rights and share equally in dividends and any surplus on winding up.
16 Dividends
2017$000
2016$000
Dividends paid during the year Final for the previous year Paid 17 October 2016 27.0 cps 8,828 6,539Interim for the current year Paid 18 April 2017 13.0 cps 4,250 4,250Amount provided in the financial statements 13,078 10,789
19

20 20
17 Changes in equity
Share capital
Property revaluation
reserve
Foreign exchange cashflow hedge
reserve Retained earnings
Total attributable
to shareholders
Non-controlling interest
Total equity
$000 $000 $000 $000 $000 $000 $000 Balance at 30 June 2015 15,968 37,272 1,819 94,828 149,887 2,689 152,576 Dividends paid - - - (10,789) (10,789) (1,350) (12,139) Total transactions with
shareholders - - - (10,789) (10,789) (1,350) (12,139)
Profit after tax for the year - - - 21,479 21,479 1,106 22,585 Other comprehensive income Property revaluation reserve Fair value movement - 7,318 - - 7,318 - 7,318 Transfer on sale of property - (5,826) - 5,826 - - - Deferred tax effect - (1,457) - - (1,457) - (1,457) Foreign exchange cashflow
hedge reserve Movement in hedged items - - (3,633) - (3,633) (641) (4,274) Deferred tax effect - - 1,017 - 1,017 179 1,196 Total comprehensive income - 35 (2,616) 27,305 24,724 644 25,368 Balance at 30 June 2016 15,968 37,307 (797) 111,344 163,822 1,983 165,805 Dividends paid - - - (13,078) (13,078) (1,350) (14,428) Total transactions with
shareholders - - - (13,078) (13,078) (1,350) (14,428)
Profit after tax for the year - - - 22,232 22,232 1,303 23,535 Other comprehensive income Property revaluation reserve Fair value movement - 7,414 - - 7,414 - 7,414 Transfer on sale of property - (255) - 255 - - - Deferred tax effect - (9) - - (9) - (9) Foreign exchange cashflow
hedge reserve Movement in hedged items - - 671 - 671 118 789 Deferred tax effect - - (188) - (188) (33) (221) Total comprehensive income - 7,150 483 22,487 30,120 1,388 31,508 Balance at 30 June 2017 15,968 44,457 (314) 120,753 180,864 2,021 182,885 Reserves
The property revaluation reserve arises on the revaluation of land and buildings. Where revalued land or buildings are sold, the portion of the revaluation reserve that relates to the asset, and is effectively realised, is transferred directly to retained earnings. The foreign exchange cashflow hedge reserve comprises the cumulative balance of adjustments to uncompleted transactions that qualify as effectively hedged.
20

21 21
18 Income tax expense
2017 $000
2016 $000
Profit after tax for the year 23,535 22,585 Components of income tax expense Current tax expense 9,075 8,358 Deferred tax movement on temporary differences (328) 68 Deferred tax on property depreciation (113) (141) Total tax expense 8,634 8,285
Profit before tax 32,169 30,870
Expected tax charge at the NZ domestic tax rate of 28% 9,007 8,644 Tax adjustments for Non-deductible expenses 474 317 Tax exempt income (155) (597) Changes in unrecognised temporary differences (237) 317 Movement in deferred tax (442) (75) Prior year adjustment (14) (321) Actual tax expense 8,633 8,285 Deferred tax
Opening deferred tax liability (4,457) (4,271) Movement through profit or loss 442 75 Movement through property revaluation reserve (9) (1,457) Movement through foreign currency reserve (221) 1,196 Closing deferred tax liability (4,245) (4,457) Deferred tax assets and liabilities are attributable to the
following:
Trade and other payables 579 537 Trade and other receivables 26 15 Employee benefits 875 964 Inventories 552 197 Financial derivatives 144 364 Impairment allowance for finance bad debts 21 29 Property, plant and equipment (1,782) (1,790) Building depreciation rule change (4,660) (4,773) Closing deferred tax liability (4,245) (4,457) The Group has no deferred tax on unused tax losses to be utilised against future taxable profits. (2016: Nil)
Income tax expense comprises current and deferred tax. Current tax is the tax payable on taxable profit for the period using the existing tax rates.
The calculation of deferred tax uses the liability approach which recognises deferred tax assets and liabilities based on differences between the accounting and tax values of specific items in the statement of financial position.
Deferred tax assets and liabilities are carried at the tax rates expected to apply when the assets are recovered or liabilities settled. on the basis that the Group expects future profits to exceed any reversal of existing temporary differences.
Income tax relating to items recognised directly in the statement of comprehensive income are also recognised in the statement of comprehensive income and not in the statement of profit or loss.
Imputation credit account
Imputation credits available for use in subsequent reporting periods 20,415 14,828
21

22 22
19 Financial instruments
Financial instruments primarily comprise cash at bank, receivables, payables, credit contracts, forward exchange contracts, shares in companies, borrowings and loans. All financial instruments are recognised in the financial statements initially at fair value plus any directly attributable transaction costs. Subsequent measurement is detailed under the accounting policy of each specific financial instrument. A financial instrument is recognised if the Group becomes a party to the contractual provisions of the instrument. Financial instruments are derecognised if the Group’s contractual rights to the cash flows from the financial instrument is cancelled, expires or if the Group transfers substantially all the risks and rewards of the financial instrument to another party.
19(a) Fair value The following methods and assumptions are used to estimate the fair value of each major class of financial instrument for which it is practical to estimate that value. Bank balances, deposits, creditors. The carrying amount is equivalent to a fair value. Shares in other companies The carrying amount is based on the most recent market evidence for the value of those shares and is
considered to be at fair value. The shares are traded in a quoted but restricted market and are categorised as level two in the fair value hierarchy.
Receivables The carrying amount is the recoverable amount for the receivable and is also considered to be at fair value. Credit Contracts The carrying value is the total of the net settlement value of each credit contract agreement.
19(b) Credit risk Financial instruments which potentially subject the Group to concentrations of credit risk consist principally of bank balances, deposits, receivables and credit contracts. The carrying amounts of financial assets represent the Group’s maximum credit exposure. The Group places its cash and short term investments with high credit quality financial institutions (as determined by independent credit rating agencies) and limits the amount of credit exposure to any one financial institution. The Group performs credit evaluations on all customers requiring credit and generally does not require collateral or other security to support financial instruments with credit risk. Concentrations of credit risk with respect to accounts receivable are limited due to the large number of customers included in the Group's customer base. The rate of impairment of amounts receivable under credit contracts (note 4) is low. If the incidence of recourse requiring balances to be written off were to increase by 0.1% it would increase the annual amount written off through profit or loss by $0.01m (2016: - $0.01m).
19(c) Interest rate risk The Group is not exposed to any specific interest rate risk other than normal interest rate movements on a daily basis in the New Zealand market. At each reporting date the specific rates were:
2017 2016 Bank overdraft 5.39% - 11.65% 5.39% - 11.65% At-Call Deposits 3.25% 3.25% - 4.00% Bank facility 2.90% - 3.45% 3.15% - 4.45%
The at-call bank borrowings are unsecured and fall within the agreed committed facility requirements in place with the Group’s bankers. These facilities have maturity dates ranging from March 2017 to December 2018 and are expected to be renewed in the normal course of business. The facilities can be drawn on or repaid at any time and interest rates are variable. The carrying value of these loans is considered to be the fair value. Interest sensitivity The effect of a movement of 1% in interest rates would be to change finance costs in profit or loss and equity by $0.258m per annum. (2016: $0.175m).
22

23 23
19 Financial instruments - continued
19(d) Foreign currency risk The Group enters into fixed rate foreign exchange contracts to create a cash flow hedge for the purchase of trucks on a contract-by-contract basis with firm customer orders and for units ordered for stock. Other short term transactions are covered by forward exchange contracts and accounted for at that rate. Foreign currency transactions are translated into the functional currency using the actual exchange rate at the date of the transaction. Foreign exchange contracts outstanding at each reporting date are adjusted to fair value (marked to market). The market rates used at reporting date to calculate this adjustment are supplied by the bank through which the contracts were established. Adjustments to transactions that qualify as being effectively hedged are recognised through the statement of comprehensive income and those that do not so qualify are recognised through profit or loss. The adjustment to fair value is recorded in the statement of financial position as a financial derivative asset or liability.
The principal values of forward exchange contracts entered into and outstanding at each reporting date were denominated in the following currencies. All forward exchange contracts have value dates of less than 12 months. The values are stated in New Zealand dollars.
2017 2016 Currency $000 $000 Australian dollars (AUD 32.483m) 34,724 24,686 Euros (EUR 26.134m) 41,341 22,774 Total 76,065 47,460
Due to the close association between foreign currency commitments for imported goods, their selling price and the underlying forward exchange contracts, it is estimated that any change in the New Zealand dollar exchange rates against the above currencies would have had minimal impact on the result and equity for the year ended 30 June 2017 or 30 June 2016.
19(e) Liquidity risk Liquidity risk represents the Group’s ability to meet its contractual payment obligations. The Group monitors its cash on an ongoing basis to ensure it has sufficient credit facilities to meet its obligations. The Group obtains funding for its operations from several sources. In addition to its shareholders’ funds (made up of share capital and reserves), funding is also provided by depositors through the At-Call Deposit scheme, from banks and other financial institutions. There is a risk that the banks may reduce or withdraw the facilities or will be unable to provide the level of funding required. The Group would then be required to obtain alternative funding which could cost more. If no alternative funding was available, the consequences would disrupt cash flows and potentially it may not be able to continue to pay suppliers and staff or repay depositors. If the finance companies were to withdraw the bailment facilities described in note 3 or were unable to fund as many vehicles as required, the Group would have to seek alternative methods of funding the vehicles. This could involve bailment agreements with other providers or additional bank funding to purchase the vehicles outright. The consequences could include increased costs and disruption to the supply of new vehicles for sale. The Group mitigates its funding risk by adopting prudent financial management practices (such as closely monitoring its cash flows, regularly checking compliance with the financial ratios) and by maintaining open and honest relationships with the banks and finance companies. The extent of the bank facilities is disclosed in note 9 and bailment facilities in note 3.
19(f) Maturity analysis Financial liabilities in the form of At-Call Deposits and bank borrowings are payable on call. Trade and other payables are due within one year. This arrangement is unchanged from 2016. The amounts payable, including interest, by customers under the financial assets – credit contracts have the following repayment profile which is the maximum amount the Group may be required to pay if subject to recourse under its contractual obligations.
2017 $000
2016 $000
Amount due in Less than one year 4,385 6,127 1 to 2 years 3,119 4,283 More than 2 years 1,940 2,950 Total 9,444 13,360
23

2424
19 Financial instruments - continued
19(g) Capital managementThe Group’s capital includes share capital, retained earnings and property revaluation reserve.
The Group’s policy is to maintain a strong capital base to ensure that it continues as a going concern, to maintain investor, supplier and market confidence and to sustain future development of the business. The board regularly monitors future capital requirements and costs to maintain an appropriate balance of shareholders’ equity and debt. The Group generally maintains the capital structure by setting a sustainable level of dividends.
The Group issues call debt securities and maintains relationships with a number of financial institutions to ensure that adequate debt facilities are available to meet short- to medium-term strategic cash flow requirements and as a buffer for unexpected events. The Group complied with all of the financial covenants incorporated in the bank borrowing facilities (note 9) and the At-Call Deposit trust deed (note 10) at the reporting date and at 30 June 2016. There are no other externally imposed capital requirements.
There has been no change in the Group’s management of capital during the years ended 30 June 2017 and 2016.
20 Financial instruments - category
Fair value through profit
or loss
Loans and receivables
Financial liabilities at amortised
cost
Financial derivatives at
fair value
$000 $000 $000 $0002017AssetsCash& bank balances - 8,060 - -Trade & other receivables - 33,780 - -Credit contracts - 8,118 - -Shares in companies 2,048 - - -
LiabilitiesBank borrowings - - 780 -At-call deposits - - 18,017 -Trade & other payables - - 37,418 -Vehicle floorplan finance - - 54,709 -Credit contracts - - 8,193 -Financial derivatives – foreign exchange - - - 513
2016AssetsCash& bank balances - 15,402 - -Trade & other receivables - 31,192 - -Credit contracts - 11,324 - -Shares in companies 1,507 - - -
LiabilitiesBank borrowings - - - -At-call deposits - - 17,531 -Trade & other payables - - 36,907 -Vehicle floorplan finance - - 59,942Credit contracts - - 11,423 -Financial derivatives – foreign exchange - - - 1,302
24

25 25
21 Cashflow reconciliation
2017 $000
2016 $000
Profit after tax for the year 23,535 22,585 Adjustments for non-cash items Depreciation 3,650 4,082 Amortisation 415 100 Revaluation of property and investments (425) (1,059) Realised gain on sale of property (9) (1,072) Movement in Impairment of credit contracts (29) (46) Deferred tax (441) (73) Movement in working capital Trade & other payables 511 (12,344) Tax payable (433) 964 Receivables & prepayments (1,932) 3,891 Inventory (9,015) 21,214 Net cash flow from operating activities 15,827 38,242
22 Contingent liabilities / capital commitments
Contingent liabilities - - WorkSafe NZ is taking legal action against Agricentre South Limited (Agricentre), a wholly-owned subsidiary,
in relation to an accident in April 2016 at the workplace of a customer involving a tractor owned by Agricentre. As the legal process, which was initiated in March 2017, is still in its early stages, the extent to which Agricentre may be held responsible for the accident remains uncertain and it is not possible to reliably measure the value of penalties (if any) the Court may impose.
Capital commitments for new and developments to dealership facilities 3,726 10,333
23 Operating lease commitments & receivables
Commitments under non-cancellable operating leases are due Within one year 1,674 3,408 Between one and two years 1,181 2,310 Between two and five years 1,911 2,464 Over five years 626 1,192 5,392 9,374 The Group owns most of the property from which it operates. However, some Dealerships operate from sites not
owned by the Group or have additional premises leased from third parties. These operating lease commitments primarily refer to those properties. The leases are negotiated under normal commercial arrangements with varying terms, escalation clauses and renewal conditions. There are no undue restrictions imposed on these leases or contingent rents due. The Group does not carry any material finance leases.
Receivables under non-cancellable operating leases are due Within one year 649 195 Between one and two years 257 133 Between two and five years 229 229 Over five years 129 206 1,264 763
25

26 26
24 Financial derivatives – foreign exchange
2017 $000
2016 $000
Foreign exchange asset / (liability) Opening balance (1,302) 2,973 Movement during the year through Other comprehensive income 789 (4,274) Profit or loss - (1) Closing balance 513 (1,302) Refer note 19(d) for additional details
Foreign currency transactions are translated into the functional currency using the actual exchange rate at the date of the transaction. Forward exchange contracts are recognised initially at fair value. At the inception of a hedge relationship, the Group documents the relationship between the hedging instrument and the hedged item, along with its risk management objectives and its strategy for undertaking various hedge transactions. Furthermore, at the inception of the hedge and on an ongoing basis, the Group documents whether the hedging instruments are effective. Foreign exchange contracts outstanding at reporting date are adjusted to fair value (marked to market). Adjustments that qualify as being effectively hedged are recognised through the statement of comprehensive income and form the foreign exchange cashflow hedge reserve. Those that do not so qualify are recognised through profit or loss.
25 Group companies
All subsidiaries are 100% owned (2016: 100%), with the exception of Southpac Trucks Ltd which is 85% owned (2016: 85%) and all subsidiaries have a reporting date of 30 June. All Group companies are registered in New Zealand. Subsidiary companies operate as motor vehicle dealerships and related or incidental activities. The Company provides administrative and financial services to the subsidiaries as well as leasing them at market rates many of the properties they occupy.
Trading subsidiaries Agricentre South Ltd, Avon City Motorcycles Ltd, Avon City Motors Ltd, Capital City Motors Ltd, Dunedin City Motors
Ltd, Energy City Motors Ltd, Energy Motors Ltd, Fagan Motors Ltd, Hutchinson Motors Ltd, Jeff Gray Ltd, M.S. Motors (1998) Ltd, Macaulay Motors Ltd, Ruahine Motors Ltd, South Auckland Motors Ltd, Southern Autos – Manukau Ltd, Southpac Trucks Ltd, Stevens Motors Ltd, The Hawkes Bay Motor Company Ltd, Timaru Motors Ltd.
Non-trading subsidiaries Avery Motors Ltd, Capital City Paint & Panel Ltd, East City Ford Ltd, Panmure Motors Ltd, Papakura Ford Ltd,
Pukekohe Motors Ltd, South Auckland Ford Ltd, Metro Training Services Ltd, Metro Motors (Porirua) Ltd, Trucks South Ltd, Tower Motors (2012) Ltd, Advance Agricentre Ltd and Southland Tractors Ltd.
Non-controlling interest The Company owns 85% of Southpac Trucks Limited. Its principal place of business is Auckland and it operates
branches and service agencies throughout New Zealand. Its summarised financial position at balance date was as follows:
2017 $000
2016 $000
Shareholders’ equity 13,472 13,219 Current liabilities 52,580 41,647 Total equity and liabilities 66,052 54,866 Current assets 60,937 49,355 Non-current assets 5,115 5,511 Total assets 66,052 54,866
26

27 27
26 Business disposal
During the period Jeff Gray Limited, a wholly-owned subsidiary, entered into unconditional contracts to sell its business with effect on 30 November 2016.
The agreements covered the sale of its assets, settlement of its liabilities, transfer of staff and assignment of the leases relating to four BMW franchise dealerships in Christchurch, Wellington, Palmerston North and Hastings. The Wellington and Christchurch dealerships included MINI Garages.
Settlement as at 30 November 2016 was made up as follows: $’000 Assets sold - Inventory 7,591 - Property, plant & equipment 837 - Intangible assets 508 - Prepaid expenses 38 Total assets 8,974 Less liabilities - Vehicle Floorplan Finance (5,612) - Trade & other payables (319) Total liabilities (5,931) Cash proceeds 2,672 Loss on sale (370)
The intangible assets sold related to franchise rights and customer databases (note 12).
27 Segment reporting
The Group is structured so that each motor vehicle dealership is managed locally under the control of a dealer principal who reports monthly to the Group Chief Executive. The Group Chief Executive is considered to be the Chief Operating Decision Maker in terms of NZ IFRS 8 Operating Segments. The key measures used to assess dealership performance are revenue, trading profit before tax, trade receivables and inventory.
Each of the trading subsidiaries enters into agreements in its own right with the New Zealand distributor to sell and service specific brands of motor vehicle in a defined primary marketing area. As national distributor of two brands of heavy trucks, Southpac Trucks Limited has equivalent agreements with the international suppliers covering the whole country. Most of these agreements (called either dealer or franchise agreements) do not have a specific duration. All of the dealer or franchise agreements contain the right for the distributor/franchisor or the dealer to terminate the arrangements at short notice. Some of these agreements have finite terms from one to three years, usually without automatic rights of renewal. If a dealership or franchise agreement is terminated or not renewed there could be a detrimental effect on the future financial performance of the Group.
The dealerships have similar economic characteristics, financial performance (as measured by their gross profitability), products, services, processes, customers, methods of distribution and all operate in the same regulatory environment. On that basis, all of the Group’s operating segments have been aggregated into a single reporting segment to most appropriately reflect the nature and financial effects of the business activities in which the Group engages and the economic environments in which it operates.
2017 2016 Motor
vehicle dealerships
Corporate and non-
trading units
Total Group
Motor vehicle
dealerships
Corporate and non-
trading units
Total Group
$000 $000 $000 $000 $000 $000 Revenue from external
customers
853,755
1,009
854,764
866,414
823
867,237 Depreciation and
amortisation
2,362
1,388
3,750
2,930
1,252
4,182 Interest income 189 33 222 151 29 180 Interest expense 2,736 1,116 3,852 3,031 1,229 4,260 Trading profit before tax 29,051 2,999 32,050 25,416 3,323 28,739 Total assets 207,163 109,729 316,892 204,896 96,022 300,918
27

28 28
28 New standards, interpretations and amendments At the date of authorisation of these financial statements, certain new standards and interpretations to existing
standards have been published but are not yet effective and have not been adopted early by the Group. Management anticipates that all pronouncements will be adopted in the first accounting period beginning on or after the effective date of the new standard. Information on new standards, amendments and interpretations that are expected to be relevant to the Group financial statements is provided below. Certain other new standards and interpretations issued but not yet effective and not expected to have a material impact on the Group’s financial statements, have not been disclosed.
NZIFRS 16 Leases Effective for CMC Group reporting period beginning 1 July 2019 The standard requires lessees (tenants) to recognise right-of-occupancy assets and lease liabilities in their statements of financial position. It will also re-categorise cash flows associated with leases as financing rather than operational cash flows. The CMC Group is currently tenant in over 20 properties. When recognised in accordance with the standard, the value of the assets, liabilities and cash flows of the Group’s leases will be material. Accounting for leases by lessors (landlords) will be largely unchanged.
NZIFRS 15 – Revenue from contracts with customers Effective for CMC Group reporting period beginning 1 July 2018 This standard changes the principles by which revenue is recognised from contracts with customers. The greatest impact will be for contracts that deliver promised goods and services over time. Given the comparatively short term nature of the supply of vehicles and services, there will not be a material change in the Group’s revenue recognition. The standard will require additional disclosure and potential change in some terminology.
NZ IFRS 9 – Financial instruments Effective for CMC Group reporting period beginning 1 July 2018 This standard addresses the classification and measurement of financial assets, financial liabilities and hedge accounting. Whilst requiring some changes to disclosure for the Group, adoption of the standard is not otherwise expected to have a material effect.
28

29 29
29 Related party transactions
The Group has related party transactions with key management personnel and the CMC Group Workplace Savings Scheme (previously the Staff Superannuation Fund).
Management personnel Transactions with key management personnel were: 2017
$000 2016 $000
Short term benefits (including salary, incentives, profit share, use of motor vehicle and other benefits)
7,502 6,991
Post-employment benefits (including contributions to retirement savings schemes) 263 476 Share related benefits - - Total remuneration benefits 7,765 7,467
Key management personnel includes current directors (executive and non-executive), key management at the Group office and chief executives of all trading subsidiaries. Some key management personnel have funds on deposit with the Company by way of its unsecured call debt securities (see note 10) on the same terms and conditions as all other depositors. Mr G D Gibbons, a director, is also a director of Motor Trade Finance Ltd which provides vehicle finance facilities to operating subsidiaries on normal commercial terms and conditions. Refer note 5. Mr J P Gibbons is a director of the Motor Trade Association. Group operating subsidiaries are members on normal commercial terms and conditions. Also see remuneration of Directors on page 35 and remuneration of employees on page 36.
The CMC Group Workplace Savings Scheme The Company is the sponsoring employer of the CMC Group Workplace Savings Scheme which is a defined contribution scheme. It is categorised as an employer-related restricted workplace savings scheme registered under the Financial Markets Conduct Act 2013 (FMCA). The company ceased to be the trustee of the Scheme when a new trust deed was registered on 18 November 2016 but continues to provide administrative services to the Scheme and received fees of $0.062m (2016: $0.060m) during the year. The Scheme holds 162,196 (2016: 304,196) ordinary shares in the Company and 835,000 (2016: 835,000) MTF perpetual preference shares. The Company and MTF are related parties to the Scheme and FMCA limits investments in related parties to 5% of total assets. The Trustee has reduced its investment in the Company during the year and has undertaken to sell the MTF perpetual preference shares before the statutory deadline of 1 December 2017 in order to ensure that the combined investments fall below the FMCA limit. All transactions between key management personnel, the Scheme and Group companies were in the normal course of business and provided on arm’s length commercial terms.
30 Events subsequent to the reporting date
On 16 August 2017 a dividend was declared of 31 cents per share to be paid fully imputed on 16 October 2017 representing a total payment of $10.1 million.
29

3030 30

3131
31

32
33
3232

33
33
3332
34
34
Governance statement
Governance is the chain of command through which companies are run. Shareholders, as owners of a company, elect a board to direct its long-term strategy and to appoint a chief executive to manage the company. Reporting flows back up the chain to ensure that each link is performing its duties appropriately. The Group is structured so that each motor vehicle dealership is managed locally and reports to the Group Chief Executive. Each dealership also has a direct relationship with each franchisor that it represents. Shareholders The shareholders adopted the current constitution in 2004 that specifies the administration of the Company and the relationship between shareholders. Copies of the constitution are available from the Company or can be downloaded from the Companies Office website. CMC is a public company listed on the New Zealand Stock Exchange operated by NZX Limited. Computershare Investor Services Limited maintains the register of shareholders. A condition of listing is that CMC complies with the listing rules issued by the Stock Exchange. These include the requirement to continuously disclose market sensitive information. The market acts in the position of all current and potential shareholders and disclosure via the Stock Exchange is generally considered adequate notice. However, CMC has a policy of also communicating directly with its shareholders whenever practical. Shareholders meet in person at annual meetings to
consider the Company’s financial performance and financial position elect or re-elect directors record the appointment of an external statutory auditor and set the maximum level of director remuneration following reviews in alternate years. The actual amount paid to each
director is disclosed in annual reports. The board of directors issues three reports annually - a half year report, a preliminary result and a full year report - to provide shareholders with the information they need to monitor their investment in the Company. The CMC reports are designed to deliver that information in a clear, concise manner. The reports are mailed to all shareholders and are available for download from CMC’s website www.colmotor.co.nz. Shareholders may register to receive the interim and preliminary reports electronically. Directors The Board of Directors acts in a stewardship role on behalf of all shareholders. It approves the strategic direction of the Company, oversees the management of its capital resources, monitors its performance and compliance, ensures its assets are safeguarded and its workplaces are safe. New Directors are identified by the nomination committee of the board or may be nominated by shareholders. The constitution specifies that at least one third of the directors must retire each year. Directors who are eligible may stand for re-election. Directors who have been appointed in the year must stand for election at the next annual meeting as must anyone nominated as a director. The constitution also specifies that there should be between five and seven directors. The Board contains a mix of independent, executive and non-executive directors. The Board ensures that, consistent with its history and industry standing, CMC conducts its dealings with all stakeholders with integrity and respect. It maintains a directors’ manual including a code of ethics that extends to all staff and sets out definitive standards of behaviour. In particular, Directors take care to comply with rules requiring disclosure of positions and occupations they have outside of CMC that may involve a conflict of interest. The Directors have established a securities trading policy to comply with prevailing legislation that requires full disclosure by directors and senior executives both before and after buying and selling shares in CMC. All share trades by directors are reported to the market. The statutory registers of directors, their shareholdings and interests are kept at CMC’s registered office. The Board schedules at least eight meetings each year to monitor the progress of management on achieving the targets and objectives that the Board has set. The Board usually meets in Wellington but at least once a year it holds a meeting at a dealership in order to meet front-line staff and experience operations at first hand. Additional ad hoc meetings are held when necessary, sometimes by telephone conference. During the year the Board held ten meetings, eight in person and two by telephone conference.
34

35
35
Governance statement - continued
Board committees Where additional detailed supervision or consideration is required, the Board establishes committees that operate by making recommendations to the full board for final resolution. There are three standing committees with specific written terms of reference.
Audit & Compliance Committee Comprising F R S Clouston (Chairman), D M Wood and A J Waugh, the committee meets regularly with management, the internal auditor and the external auditor to:
review the adequacy of controls to identify and manage areas of potential risk and to safeguard the assets of the Company;
maintain the independence of the external Auditor and review the external audit functions generally; and evaluate the processes to ensure that financial records and accounting policies are properly maintained in
accordance with statutory requirements and financial information provided to shareholders and the board is accurate and reliable.
Members of the committee have relevant financial qualifications and/or commercial experience. The Audit & Compliance Committee met five times. Management is delegated the responsibility for developing, maintaining and enforcing the system of internal controls. The same basic set of controls is applied across the Group. Monthly reports from each dealership form a key element of the financial control mechanism. An Internal Auditor works in conjunction with the external statutory auditor to complete a review of all dealerships every year for maintenance of the standard of accounting practices and for compliance with the internal policies and procedures. The Internal auditor regularly reports to the audit and compliance committee.
Remuneration Committee J P Gibbons, (Chairman) and F R S Clouston make up the remuneration committee the purpose of which is to ensure that the Directors and senior executives are fairly and reasonably rewarded for their individual contributions. The Remuneration Committee met once.
Management and director remuneration is disclosed in the annual report.
CMC has no equity-based remuneration plan and does not require its directors to purchase or hold CMC shares.
Nominations Committee This committee has the task of identifying potential directors with skills that are complementary to the needs of the Company and the board. All Directors serve on the nominations committee. The Nominations Committee was not required to meet during the year.
External auditor The role of the external auditor is to report to shareholders on the truth and fairness of the financial statements prepared by management, authorised by the board and included in the annual report. The audit partner and the chairman of the Audit & Compliance Committee meet twice a year and the auditor attends committee meetings at least three times a year. The scope of discussions is not limited but includes issues identified during audits, audit planning and staffing and the extent of non-audit work by the audit firm. The primary audit partner is changed periodically to provide a fresh perspective and to ensure greater independence. Fees paid for audit and any non-audit work (such as taxation advice) are disclosed in the annual report.
Risk management The range of tools used to mitigate risk includes elements of corporate governance outlined in this report, the system of internal controls and management reporting and accountability. The board reviews the Group insurance programme and assesses which risks to insure with the assistance of an external insurance broker. The Audit and Compliance Committee has particular responsibility for internal audit on which it receives regular reports. Management provides the committee with an annual internal management and regulatory compliance summary report. Health & safety CMC is committed to providing healthy and safe environments for all its customers, workers, contractors and other visitors to its facilities. The board receives reports and considers health and safety issues at each of its meetings and experiences first-hand the practicalities during its regular dealership visits. A group-wide workplace safety management practises programme is operated with a health and safety committee active at each subsidiary. The Group Health and Safety Co-ordinator maintains and is continually improving CMC’s workplace health and safety systems which are based on a comprehensive policy and procedures manual and are subject to independent external audits.
35
36
36
Disclosures as required by the Companies Act 1993
(a) Directors’ interests In relation to sections 140 and 211(1)(e) of the Act, no director has declared any interest in a related party transaction with the Company during the year. The Company has received the following general disclosures of interest pursuant to section 140(2) of the Act that remain in place at the date of this report:
J P Gibbons Director of Motor Trade Association and MTA Group Investments Limited.
G D Gibbons Director of Motor Trade Finance Limited.
F R S Clouston Chairman of Titan Cranes Limited and Titan Group Limited.
D M Wood Chairman of Mercy Healthcare Auckland Limited.
A J Waugh Chairman of Moa Brewery Limited and director of Fonterra Co-operative Group Limited and Seeka Limited.
(b) Remuneration of directors Remuneration and all other benefits received by the directors who held office during the year ended 30 June
2017 are disclosed pursuant to section 211(1)(f) of the Act as follows
Directors’ fees 2017
$
Total remuneration 2017
$
Total remuneration 2016
$ J P Gibbons (Chairman) 84,500 149,134 101,634 F R S Clouston 56,650 56,650 51,700 G D Gibbons - 1,045,848 984,634 S B Gibbons - 270,781 245,814 M J Newman - 893,238 789,662 D M Wood 51,500 51,500 47,000 A J Waugh 51,500 51,500 31,333
Remuneration for the Chairman, additional to directors’ fees, included the provision of a motor vehicle and, in this year, additional direct payment for acting as Chief Executive while the Group Chief Executive was on medical leave during October and November 2016.
F R S Clouston was elected Chairman of the Audit & Compliance Committee in November 2013 and received additional directors’ fees commensurate with the position from that date.
Executive directors do not receive directors’ fees for acting as a director of the Company or of any subsidiary. Executive directors acting in their capacity as employees of the Company or of a subsidiary received total remuneration including salary, incentives, superannuation contributions, use of a motor vehicle and other benefits in the year ended 30 June 2017 as disclosed above. No other employee of the Company, or of any Group subsidiary, retains or receives any remuneration or other benefits as a director.
The remuneration package of the Group Chief Executive (who is also a director) has in the year to 30 June 2017 a fixed component (including salary, motor vehicle and superannuation contributions) of $415,134. (2016: $415,134) and an annual short term incentive component based on the current year’s trading profit performance of $630,714 (2016: $569,500). There are no long term incentives or share schemes in place.
Dealer Principals/CEOs of subsidiary companies receive a profit performance component of their remuneration based on their dealership profit. The remuneration received by M J Newman and S B Gibbons as executives is shown for the twelve months to 30 June 2017 and includes a short term profit performance component of $628,607 and $97,450 respectively (2016: $527,281 for M J Newman and $74,733 for S B Gibbons). In accordance with clause 28.4 of its constitution, the Company may provide for directors retirement benefits. The total provided at 30 June 2017 was $253,500 (2016: $231,000). Directors appointed after 1 May 2004 are not eligible to receive a retirement allowance unless authorised by shareholder resolution. As permitted in clause 29.4 of the Company’s constitution, an insurance policy is in place in relation to directors and officers liability. The policy ensures that generally directors will incur no monetary loss as a result of actions they undertake as directors. Certain actions are specifically excluded, such as incurring penalties and fines that may be imposed in respect of breaches of the law.
36

37
37
Disclosures as required by the Companies Act 1993
(c) Use of company information by directors
During the year the board did not receive any requests from directors to use Company information provided to them in their capacity as an officer or employee that would not otherwise have been available to them.
(d) Share dealings by directors Directors have disclosed under Section 148(2) of the Act the following acquisition of a relevant interest in shares in the Company between 1 July 2016 and 31 August 2017. Director
Number of shares acquired/ (disposed)
Date of transaction
Price per share
Type of interest
M J Newman 2,500 16 September 2016 $7.00 Beneficial A J Waugh 1,850 20 September 2016 $7.50 Beneficial J P Gibbons 24,000 29 September 2016 $6.70 Non-beneficial M J Newman 2,500 28 November 2016 $7.00 Beneficial S B Gibbons 1,902 27 February 2017 $7.50 Beneficial M J Newman 2,500 27 February 2017 $7.50 Beneficial G D Gibbons 1,050,000 22 March 2017 Off-market Non-beneficial D M Wood 150,000 22 March 2017 Off-market Non-beneficial M J Newman 5,000 28 April 2017 $7.69 Beneficial M J Newman 5,000 23 August 2017 $7.92 Beneficial
Directors disclosed no other transactions in the shares of the Company during the period.
(e) Composition of the Board
All 7 of the Directors and the 13 officers (direct reports to the Group Chief Executive) at the reporting date were male (2016: 7 Directors male, 13 officers, male).
(f) Remuneration of employees
During the year to 30 June 2017 the number of employees in the Group, not being directors of The Colonial Motor Company Limited, who received remuneration (including salary, incentives, superannuation contributions, use of a motor vehicle and other benefits) which exceeded $100,000 were as follows:
Remuneration Number of employees Remuneration Number of employees
$ 2017 2016 $ 2017 2016 100,000 - 110,000 29 26 290,001 - 300,000 1 1 110,001 - 120,000 22 27 300,001 - 310,000 - - 120,001 - 130,000 21 16 320,001 - 330,000 1 1 130,001 - 140,000 9 13 250,001 - 360,000 1 - 140,001 - 150,000 10 10 360,001 - 370,000 1 1 150,001 - 160,000 8 6 380,001 - 390,000 1 3 160,001 - 170,000 4 5 390,001 - 400,000 - 2 170,001 - 180,000 5 6 400,001 - 410,000 1 - 180,001 - 190,000 4 6 460,001 - 470,000 1 - 190,001 - 200,000 9 5 470,001 - 480,000 1 - 200,001 - 210,000 5 4 480,001 - 490,000 1 1 210,001 - 220,000 2 4 500,001 - 510,000 - 1 220,001 - 230,000 4 2 530,001 - 540,000 - 1 230,001 - 240,000 1 4 560,001 - 570,000 1 - 240,001 - 250,000 1 1 570,001 - 580,000 1 - 250,001 - 260,000 3 - 1,030,001 - 1,040,000 - 1 270,001 - 280,000 2 2 1,160,001 - 1,170,000 1 - 280,001 - 290,000 1 - Total 152 149
37

38
38
Disclosures as at 30 June as required by the New Zealand Stock Exchange Listing Rules
(a) Director independence
The following directors were Independent Directors at reporting date: F R S Clouston A J Waugh
The following directors were not Independent Directors at reporting date: J P Gibbons G D Gibbons D M Wood M J Newman S B Gibbons
(b) Directors’ relevant interests at 30 June 2017 Shares in which the director
has a beneficial interest solely or jointly
Shares in which the director has a non-beneficial interest
Shares held by associated person of the director
2017 2016 2017 2016 2017 2016 G D Gibbons 1,737,849 1,737,849 1,300,825 250,825 104,250 104,520 J P Gibbons 1,421,081 1,421,081 1,059,849 1,035,849 513.270 513,270 S B Gibbons 1,910,578 1,908,676 176,087 176,087 6,151 6,151 M J Newman 15,000 2,500 - - - - D M Wood 20,000 20,000 168,426 18,426 578,120 578,120 A J Waugh 4,450 2,600 - - 376 376
Substantial security holders
As required by section 26 the Securities Markets Act 1988, the substantial security holders as at 31 August 2017 (from whom a notice under the Act had been received and the date of each such notice) were as follows: Date Shares %
P C Gibbons 27 March 2017 3,477,938 6.83 J P Gibbons 4 October 2013 2,606,084 8.09 S B Gibbons 16 September 2010 2,031,263 6.21 G D Gibbons 27 March 2017 1,865,032 5.70 Issued and fully paid capital as at 30 June 2017 was made up of 32,694,632 ordinary shares. The above disclosures include voting securities arising by reason of joint holdings, powers of attorney and directorships as specifically required by the Securities Markets Act 1988 (sections 4 & 5). No shares have been counted more than once in the determination of Substantial Security Holders.
A number of shares identified under JP Gibbons are also jointly held or have trustees in common with NL, BR Gibbons and PL Bennett.
A number of shares identified under SB Gibbons are also jointly held or have trustees in common with AD Gibbons and LB Rogerson. A number of shares identified under GD Gibbons are also jointly held or have trustees in common with AK Gibbons, SD & DM Wood, RD Gibbons, AD & GV Beaumont, DD & BW Harrison and GD & IW Watson.
38

39
39
Distribution of shareholders and shareholdings
This distribution information reflects the position as at 31 August 2017.
Number of shareholders Number of shares
Number % Number % 1 - 999 259 16.5 127,799 0.4
1,000 - 9,999 975 62.0 3,229,489 9.9 10,000 - 99,999 276 17.6 6,681,485 20.4
100,000 - 999,999 56 3.6 17,458,974 53.4 1,000,000 + 4 0.3 5,196,885 15.9
Total 1,570 100.0 32,694,632 100.0
Five year summary of shareholder return on investment – 30 June year ended
Year Share price Dividends paid - cps Gross
dividend Change
in share Total
gross Gross
shareholder at 30 June Date Net Gross yield
%
price cps
return cps
return %
2017 $7.50 18/04/16 13.0 55.6 9.0 130.0 185.6 29.9 17/10/16 27.0 2016 $6.20 18/04/16 13.0 45.8 8.0 45.0 90.8 15.8 19/10/15 20.0 2015 $5.75 20/04/15 13.0 48.7 9.3 55.0 103.6 19.9 20/10/14 22.0 2014 $5.20 04/04/14 13.0 47.3 12.0 125.0 172.3 43.6 21/10/13 21.0 2013 $3.95 05/04/13 9.0 35.4 11.2 80.0 115.4 36.6 23/10/12 16.0 Note: Yields are calculated on the share price at the beginning of each year. The share price at 30 June 2012 was $3.15.
39

40
40
Fifty largest shareholdings as at 31 August 2017
Shares % AD & SB Gibbons & LB Rogerson 1,677,507 5.1 Florence Theodosia Gibbons 1,287,037 3.9 Peter Craig Gibbons (Trust) 1,173,642 3.6 Peter Craig Gibbons 1,058,699 3.2 JP & BR Gibbons & PL Bennett 683,550 2.1 NL, BR & JP Gibbons & PL Bennett (Estate RC Gibbons Deceased) 664,006 2.0 RJ Field & AJ Palmer 600,000 1.8 PL & LC Bennett & JP Gibbons 567,794 1.7 Graeme Durrad Gibbons 564,207 1.7 MI & C Louisson & RM Carruthers 563,777 1.7 BR & CM Gibbons & PL Bennett 528,971 1.6 Diana Durrad Harrison 523,628 1.6 Gillian Durrad Watson 507,619 1.6 Robert Durrad Gibbons 507,480 1.6 Sara Durrad Wood 506,919 1.6 Alison Durrad Beaumont 497,004 1.5 JP & DM Gibbons & PL Bennett 492,055 1.5 MA Gibbons, AK Cook & PJ Clark 474,348 1.5 JG, J & CG Harrison 458,317 1.4 Citibank Nominees (New Zealand) Limited 381,734 1.2 Nancy Lucy Gibbons 375,710 1.1 May Alice Gibbons 355,196 1.1 RD Gibbons, SD Wood & GD Gibbons 354,810 1.1 CG, AE & JG Harrison 335,244 1.0 Hart Capital Partners Limited 331,918 1.0 JG, KS, SKE & J Bale 324,244 1.0 RB & JG Tait & IJ Craig 305,488 0.9 Rebecca Hope Wilson 300,478 0.9 EA Romans 290,682 0.9 Leanne Barnes Rogerson 281,410 0.9 SH Majors, RH & SJ Wilson 268,556 0.8 K Enright & C Louisson 261,566 0.8 AD & GV Beaumont & GD Gibbons 259,203 0.8 David Grindell 254,000 0.8 Salpean Nominees Limited 245,000 0.7 CM Louisson & N Tarsa 241,804 0.7 Stuart Barnes Gibbons 233,071 0.7 GD & AK Gibbons & SD Wood 209,203 0.6 T A Pegler 188,306 0.6 CG & AJ Harrison & JA Flygenring & P&M Trustees No 2 Limited 188,118 0.6 JH Smith, AF Peake & SB Gibbons 176,087 0.5 CMC Workplace Savings Scheme Trustee Ltd 162,196 0.5 DD & BW Harrison & GD Gibbons 159,203 0.5 GD & IW Watson & GD Gibbons 159,203 0.5 SD & DM Wood & GD Gibbons 159,203 0.5 Maldon Hector Whitwell 150,000 0.5 Judith Gibbons Bale 147,929 0.5 HA Louisson, CJ Warren & JA Piper 140,870 0.4 MC Duurentijdt, JT van Gaal & KD Trustees Ltd 140,000 0.4 Ian Forbes Michie 135,730 0.4
Total of fifty largest shareholdings 21,445,730 63.7
Total shares on issue 32,694,632 100.0
A number of the registered shareholders may hold shares as nominee(s) on behalf of other parties.
40
Today the CMC Group’s core business is the operation of twelve Ford dealerships each holding a franchise in its own right from the Ford Motor Company of NZ Ltd. Seven of these dealerships also hold Mazda franchises. CMC, through Southpac Trucks, is the NZ distributor and retailer of Kenworth and DAF heavy duty trucks and in Southland/Otago, Agricentre South retails New Holland, Case IH and Kubota tractors and equipment.
The Colonial Motor Company originated from William Black’s coach-building factory which started operations in 1859 at 89 Courtenay Place, Wellington. In 1881 it was taken over by Rouse & Hurrell, who expanded the business with new three storied premises calling it Rouse & Hurrell’s Empire Steam and Carriage Works. This partnership was formed into a limited liability company in 1902 with Mr Edward Wade Petherick the first Secretary of the Company. The Ford Motor Car Agency was taken up in 1908 and in August 1911 a new name “The Colonial Motor Company Limited” was registered.
On Ford Canada’s recommendation a dominant shareholding and control was acquired by Mr Charles Corden Larmour and the sale of this majority holding and control to Mr Hope Gibbons and his family interests was concluded in April 1918 after negotiations in 1916. At that time there were 17 Authorised Ford Dealers in New Zealand of which 10 were in the South Island. In 1919 the Company restructured with a new memorandum and articles but the 1911 name was retained and remains the same today.
The nine storied building at 89 Courtenay Place, designed by architect J M Dawson to Ford plans, opened as the tallest Wellington construction in 1922. It was the first motor vehicle assembly plant in New Zealand - vehicles starting in boxes at the top and driving out completed at the bottom. The Company later built assembly plants at Fox Street, Parnell, Auckland and Sophia Street, Timaru. This was the age of the Model T with Ford market share reaching a peak of 27% in 1926. The ‘CMC’ Building was sold in 2005.
In 1936, Ford Motor Company of New Zealand Limited established an assembly plant at Seaview, Lower Hutt, and took over the distribution of Ford products in New Zealand. CMC then concentrated on the retail side of the business, operating the retail garages it then owned. The 1930's and 1940's were a time of survival with the depression, excess stock of new product, and then no new vehicles available during the war years and petrol rationing until 1950. Service became the key to remaining in business.
Shortly after the end of the war the supply of new vehicles was resumed and the 30 years up to 1980 saw the Group consolidate. The Dealer organisation that developed proved to be one of the best retail motor groups in New Zealand. Over this period nearly every Dealership was either rebuilt, fully refurbished or relocated and new Dealerships were opened in East, West and South Auckland to cater for Auckland growth.
For the 50 years up to 1987, New Zealand had import licensing, local assembly of vehicles and heavy additional sales taxes to control overseas funds. The new vehicle industry under this regime peaked in 1973 and again in 1974 at 123,000 units. The dismantling of controls and the arrival of second hand imports from Japan saw the industry fall to just 66,500 new vehicles in 1992. It wasn’t until 2014 30 years later, that the new vehicle industry again reached the level seen in 1984. 2015, 2016 and now 2017 have all seen record industry sales.
The late 1980’s and all through the 1990’s was a period of change and adaptation. Over a decade most smaller Ford dealerships either closed down or merged with their neighbours. This resulted in fewer, but larger, Ford dealerships. CMC closed or sold its smaller dealerships and acquired others to expand its city and provincial locations. Nelson was acquired during this period. Compounding the changes was the Ford NZ decision to first sell its NZ tractor distribution to Norwoods and then later to close its distribution of heavy trucks in New Zealand.
Most of the CMC company tractor departments were closed, with the exception of Southland. This business has since grown to become Agricentre South Ltd, retailing New Holland & Kubota tractors in Southland and Case IH tractors in Southland / Otago.
In 1994 CMC acquired a major interest in Southpac Trucks, the NZ distributor for Kenworth and Foden (since retired) and more recently, DAF, heavy duty trucks which are all part of the USA based PACCAR organisation. Southpac Trucks has since grown into a major player in the NZ heavy truck industry.
Guinness Peat Group plc (GPG) made a takeover offer for CMC in October 1995. Among the sellers who enabled GPG to acquire 33.9% were some original Gibbons Family shareholders. As part of a plan to maximise value to shareholders, Directors resolved to rationalise the Company's non-dealership property holdings, repay the surplus funds to shareholders and focus the Company on its core motor trade activities.
In June 1997, GPG sold its shares to the MBM Group of Malaysia. Over the following years MBM sold down its holding in CMC, with many of the shares acquired by members of the Gibbons family. MBM sold its final block of 24.9% to a large number of individuals in 2003, resulting in the addition of 300 shareholders to CMC.
In 1999, CMC's Auckland Dealerships joined with Ford Motor Company and three other Ford dealerships to form Auckland Auto Collection Limited (AACL). This move represented the biggest change in the Ford franchise arrangements in New Zealand for over 60 years. During 1999, this new business acquired the Mazda Dealerships in Auckland and Mazda Motors joined CMC and Ford as a shareholder. From 2002, the business operated as three Ford and Mazda dealerships - North Harbour, John Andrew and South Auckland. CMC sold its shareholding back to AACL in May 2005 and, in return, acquired the South Auckland Dealership.
On 16 June 2003, Ford Motor Company celebrated its centennial and the production of the original Model A Fordmobile with CMC and its forebears having been actively involved with Ford for 95 of those 100 years. In celebration of this long relationship, a history of the Company's operations and activities "Ford Ahead" was written and published by Roger Gardner.
During the 2000’s CMC also acquired the Mazda franchises in Invercargill, Dunedin, Timaru, Wellington, Lower Hutt and Masterton. These were run as dual dealerships with the existing Ford dealerships. The policy of adding Mazda to Ford dealerships ended when Ford USA sold its interest in Mazda Japan in 2009.
It has been part of the Company's philosophy and success to own property sites from which its retail subsidiary companies operate.
More recent additions to CMC include Case IH tractors in Southland and Otago, Suzuki motorbikes in Christchurch and Masterton, Hyundai cars and Isuzu light commercials in New Plymouth, Nissan cars in Hastings and Kia cars in Nelson. In 2014, Jeff Gray BMW and MINI with four dealerships in Christchurch, Wellington, Palmerston North and Hastings were added but the businesses were sold in November 2016. A new dealership was established in South Auckland, selling Citroen, Peugeot and Isuzu light commercials.
The current major shareholdings in CMC are with individual decendants of Hopeful & Jessie Gibbons, who collectively hold over 60% of the Company shares. There are also many descendants of the original 1902 subscribers to the Rouse & Hurrell Carriage Building Company Limited who remain shareholders today.
Throughout the Company's history, change has always been with us and our ability to adapt in good times and in bad has ensured ongoing wellbeing and prosperity. As well, it has always been recognised that dedicated, skilled and enthusiastic people have been, and will continue to be, the key to the Company's future.