9.5 Mean Absolute Deviation - Big Ideas Math...Section 9.5 Mean Absolute Deviation 421 EXAMPLE 2...
6
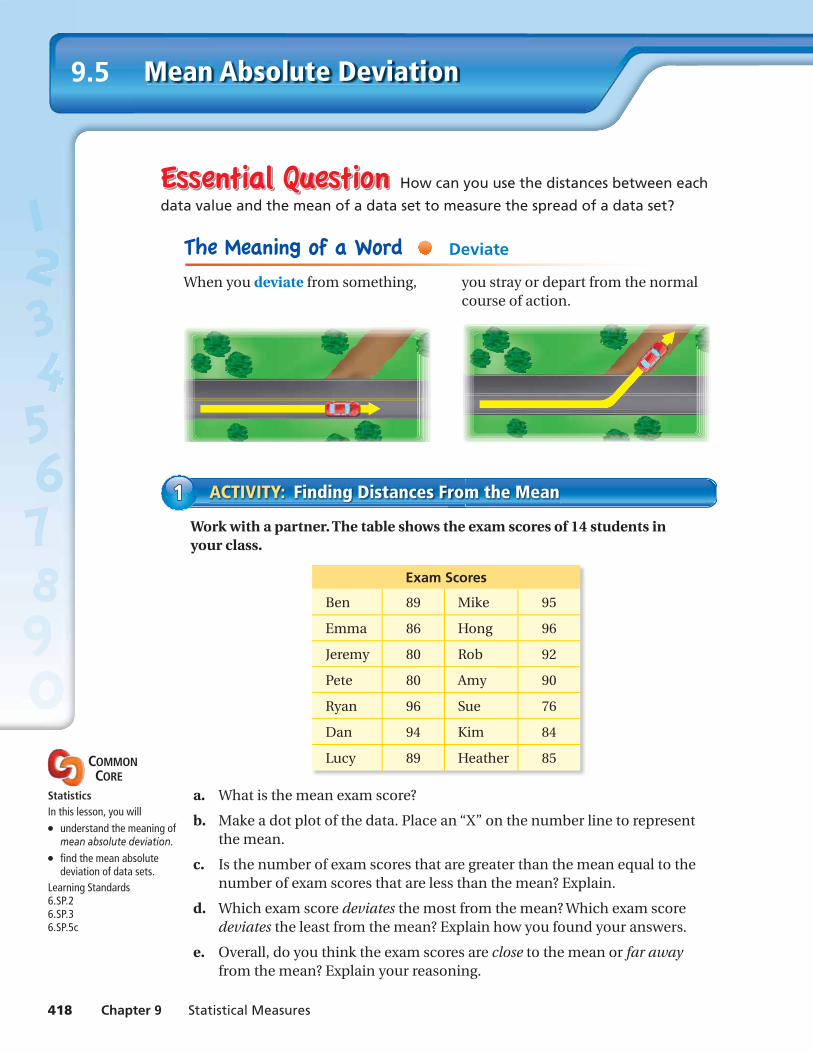
418 Chapter 9 Statistical Measures Work with a partner. The table shows the exam scores of 14 students in your class. Exam Scores Ben 89 Mike 95 Emma 86 Hong 96 Jeremy 80 Rob 92 Pete 80 Amy 90 Ryan 96 Sue 76 Dan 94 Kim 84 Lucy 89 Heather 85 a. What is the mean exam score? b. Make a dot plot of the data. Place an “X” on the number line to represent the mean. c. Is the number of exam scores that are greater than the mean equal to the number of exam scores that are less than the mean? Explain. d. Which exam score deviates the most from the mean? Which exam score deviates the least from the mean? Explain how you found your answers. e. Overall, do you think the exam scores are close to the mean or far away from the mean? Explain your reasoning. How can you use the distances between each data value and the mean of a data set to measure the spread of a data set? ACTIVITY: Finding Distances From the Mean 1 When you deviate from something, you stray or depart from the normal course of action. Deviate Mean Absolute Deviation 9.5 COMMON CORE Statistics In this lesson, you will ● understand the meaning of mean absolute deviation. ● find the mean absolute deviation of data sets. Learning Standards 6.SP.2 6.SP.3 6.SP.5c
Transcript of 9.5 Mean Absolute Deviation - Big Ideas Math...Section 9.5 Mean Absolute Deviation 421 EXAMPLE 2...
418 Chapter 9 Statistical Measures
Work with a partner. The table shows the exam scores of 14 students in your class.
Exam Scores
Ben 89 Mike 95
Emma 86 Hong 96
Jeremy 80 Rob 92
Pete 80 Amy 90
Ryan 96 Sue 76
Dan 94 Kim 84
Lucy 89 Heather 85
a. What is the mean exam score?
b. Make a dot plot of the data. Place an “X” on the number line to represent the mean.
c. Is the number of exam scores that are greater than the mean equal to the number of exam scores that are less than the mean? Explain.
d. Which exam score deviates the most from the mean? Which exam score deviates the least from the mean? Explain how you found your answers.
e. Overall, do you think the exam scores are close to the mean or far away from the mean? Explain your reasoning.
How can you use the distances between each
data value and the mean of a data set to measure the spread of a data set?
ACTIVITY: Finding Distances From the Mean1
When you deviate from something, you stray or depart from the normalcourse of action.
Deviate
Mean Absolute Deviation9.5
COMMON CORE
Statistics In this lesson, you will● understand the meaning of
mean absolute deviation.● fi nd the mean absolute
deviation of data sets.Learning Standards6.SP.26.SP.36.SP.5c
Section 9.5 Mean Absolute Deviation 419
4. IN YOUR OWN WORDS How can you use the distances between each data value and the mean of a data set to measure the spread of a data set?
5. REASONING Find the range and the interquartile range of the data set in Activity 1. What do you think it means when these values are close to 0? Explain.
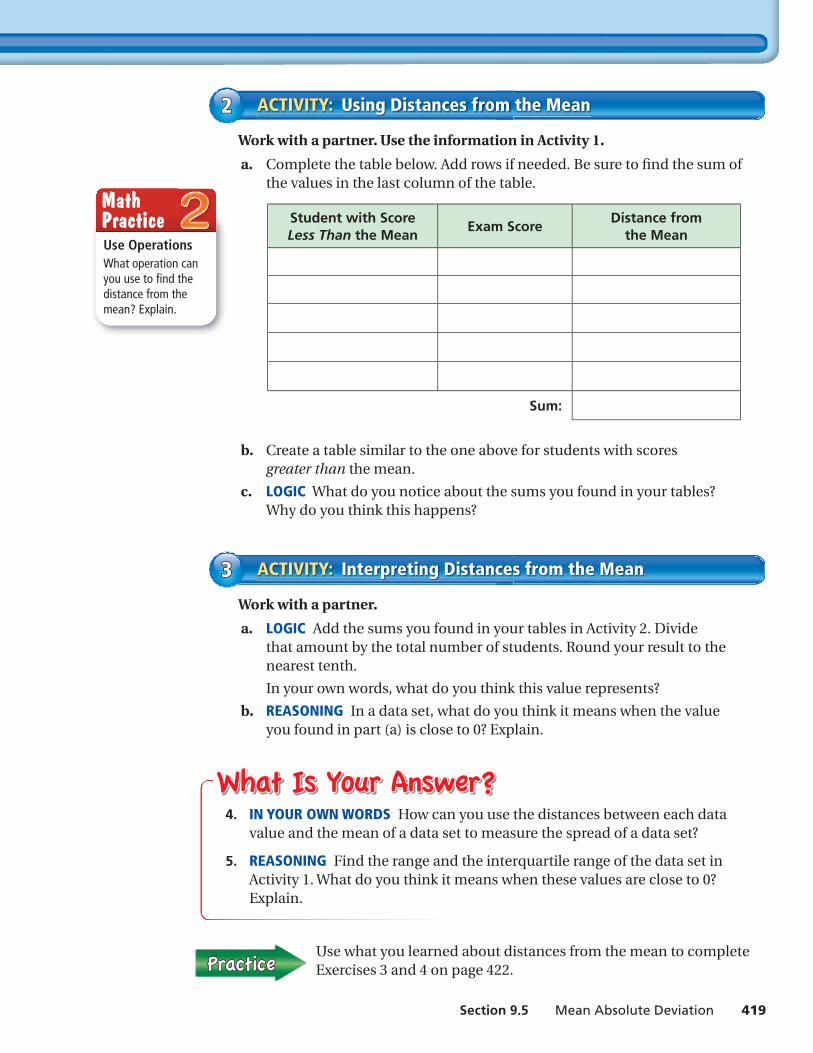
Work with a partner. Use the information in Activity 1.
a. Complete the table below. Add rows if needed. Be sure to fi nd the sum of the values in the last column of the table.
Student with Score Less Than the Mean
Exam ScoreDistance from
the Mean
Sum:
b. Create a table similar to the one above for students with scores greater than the mean.
c. LOGIC What do you notice about the sums you found in your tables? Why do you think this happens?
ACTIVITY: Using Distances from the Mean22
Work with a partner.
a. LOGIC Add the sums you found in your tables in Activity 2. Divide that amount by the total number of students. Round your result to the nearest tenth.
In your own words, what do you think this value represents?
b. REASONING In a data set, what do you think it means when the value you found in part (a) is close to 0? Explain.
ACTIVITY: Interpreting Distances from the Mean33
Use what you learned about distances from the mean to complete Exercises 3 and 4 on page 422.
Use OperationsWhat operation can you use to fi nd the distance from the mean? Explain.
Math Practice
420 Chapter 9 Statistical Measures
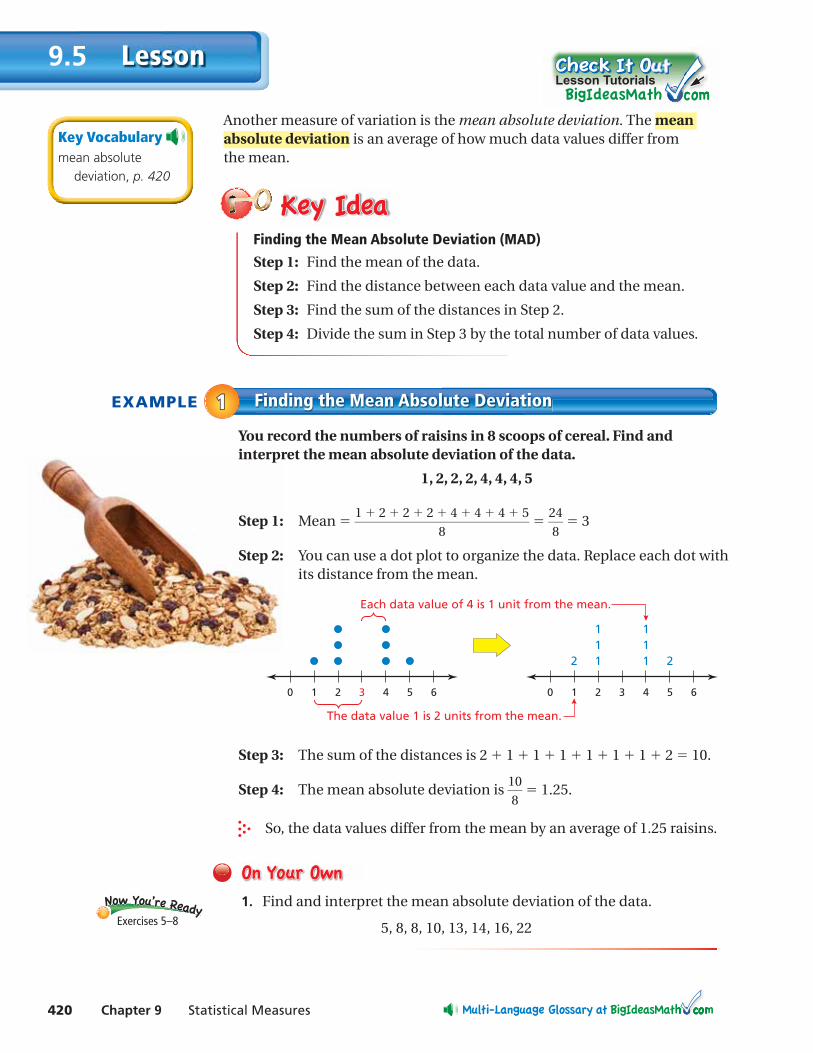
EXAMPLE Finding the Mean Absolute Deviation11You record the numbers of raisins in 8 scoops of cereal. Find and interpret the mean absolute deviation of the data.
1, 2, 2, 2, 4, 4, 4, 5
Step 1: Mean = 1 + 2 + 2 + 2 + 4 + 4 + 4 + 5
——— 8
= 24
— 8
= 3
Step 2: You can use a dot plot to organize the data. Replace each dot with its distance from the mean.
0 1 2 3 4 5 6 0 1 2 3 4 5 6
2 111
111
2
The data value 1 is 2 units from the mean.
Each data value of 4 is 1 unit from the mean.
Step 3: The sum of the distances is 2 + 1 + 1 + 1 + 1 + 1 + 1 + 2 = 10.
Step 4: The mean absolute deviation is 10
— 8
= 1.25.
So, the data values differ from the mean by an average of 1.25 raisins.
1. Find and interpret the mean absolute deviation of the data.
5, 8, 8, 10, 13, 14, 16, 22Exercises 5–8
Lesson9.5
Another measure of variation is the mean absolute deviation. The mean absolute deviation is an average of how much data values differ from the mean.
Key Vocabularymean absolute deviation, p. 420
Finding the Mean Absolute Deviation (MAD)
Step 1: Find the mean of the data.
Step 2: Find the distance between each data value and the mean.
Step 3: Find the sum of the distances in Step 2.
Step 4: Divide the sum in Step 3 by the total number of data values.
Lesson Tutorials
Section 9.5 Mean Absolute Deviation 421
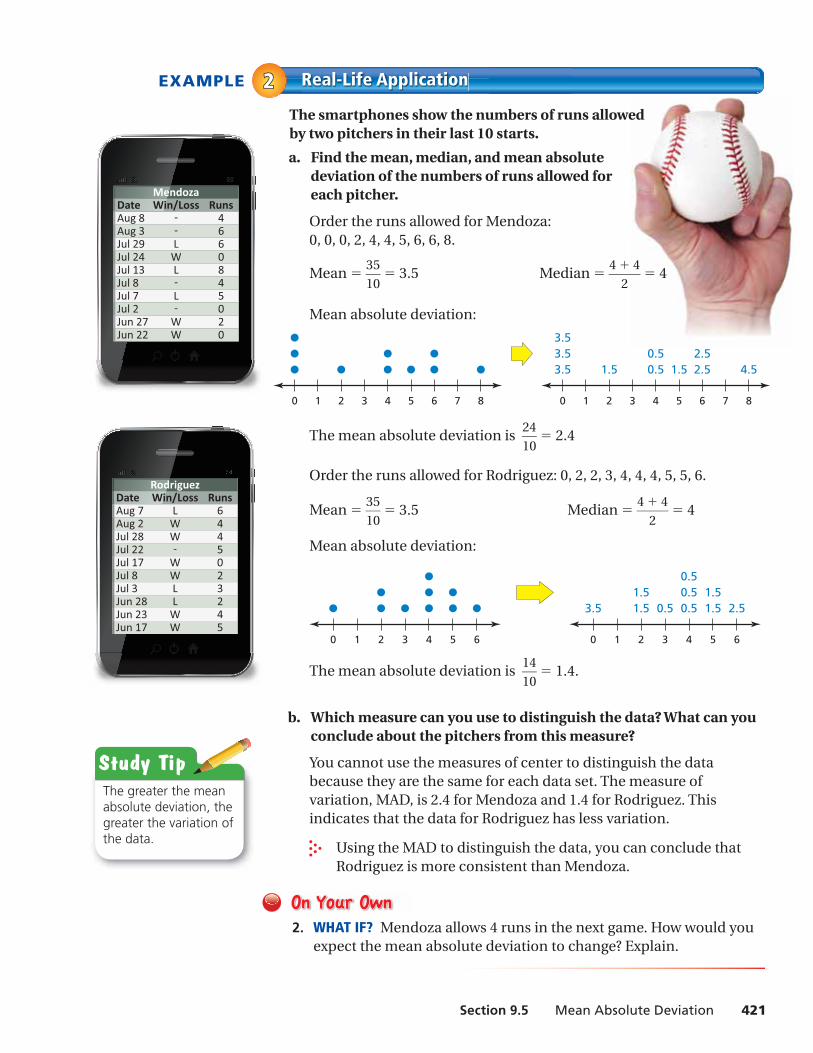
EXAMPLE Real-Life Application22The smartphones show the numbers of runs allowed by two pitchers in their last 10 starts.
a. Find the mean, median, and mean absolute deviation of the numbers of runs allowed for each pitcher.
Order the runs allowed for Mendoza: 0, 0, 0, 2, 4, 4, 5, 6, 6, 8.
Mean = 35
— 10
= 3.5 Median = 4 + 4
— 2
= 4
Mean absolute deviation:
0 1 2 3 4 5 6 7 8 0 1 2 3 4 5 6 7 8
3.53.53.5
1.5 0.50.5
1.5 2.52.5
4.5
The mean absolute deviation is 24
— 10
= 2.4
Order the runs allowed for Rodriguez: 0, 2, 2, 3, 4, 4, 4, 5, 5, 6.
Mean = 35
— 10
= 3.5 Median = 4 + 4
— 2
= 4
Mean absolute deviation:
0 1 2 3 4 5 6 0 1 2 3 4 5 6
1.51.5
0.50.50.5
1.51.5
2.53.5 0.5
The mean absolute deviation is 14
— 10
= 1.4.
b. Which measure can you use to distinguish the data? What can you conclude about the pitchers from this measure?
You cannot use the measures of center to distinguish the data because they are the same for each data set. The measure of variation, MAD, is 2.4 for Mendoza and 1.4 for Rodriguez. This indicates that the data for Rodriguez has less variation.
Using the MAD to distinguish the data, you can conclude that Rodriguez is more consistent than Mendoza.
2. WHAT IF? Mendoza allows 4 runs in the next game. How would you expect the mean absolute deviation to change? Explain.
Study TipThe greater the mean absolute deviation, the greater the variation of the data.
422 Chapter 9 Statistical Measures
9+(-6)=3
3+(-3)=
4+(-9)=
9+(-1)=
Find the average distance each data value in the set is from the mean. Round your answer to the nearest tenth, if necessary.
3. Model years of used cars on a lot: 2010, 2002, 2005, 2007, 2001
4. Prices of kites at a shop: $7, $20, $9, $35, $12, $15, $7, $10, $20, $25
Find and interpret the mean absolute deviation of the data. Round your answer to the nearest tenth, if necessary.
5. Prices of Microphones (dollars)
25 28 20 22 32
28 35 34 30 36
6. Heights of 10-Year-Old Octuplets (inches)
61 61 61 61
61 61 61 61
7. Capacities of Stadiums(thousands of people)
101.5 95.4 109.8
98.7 92.3 104.7
8. Numbers of Visitors to a Website During a Week
103 115 124 125
171 165 170
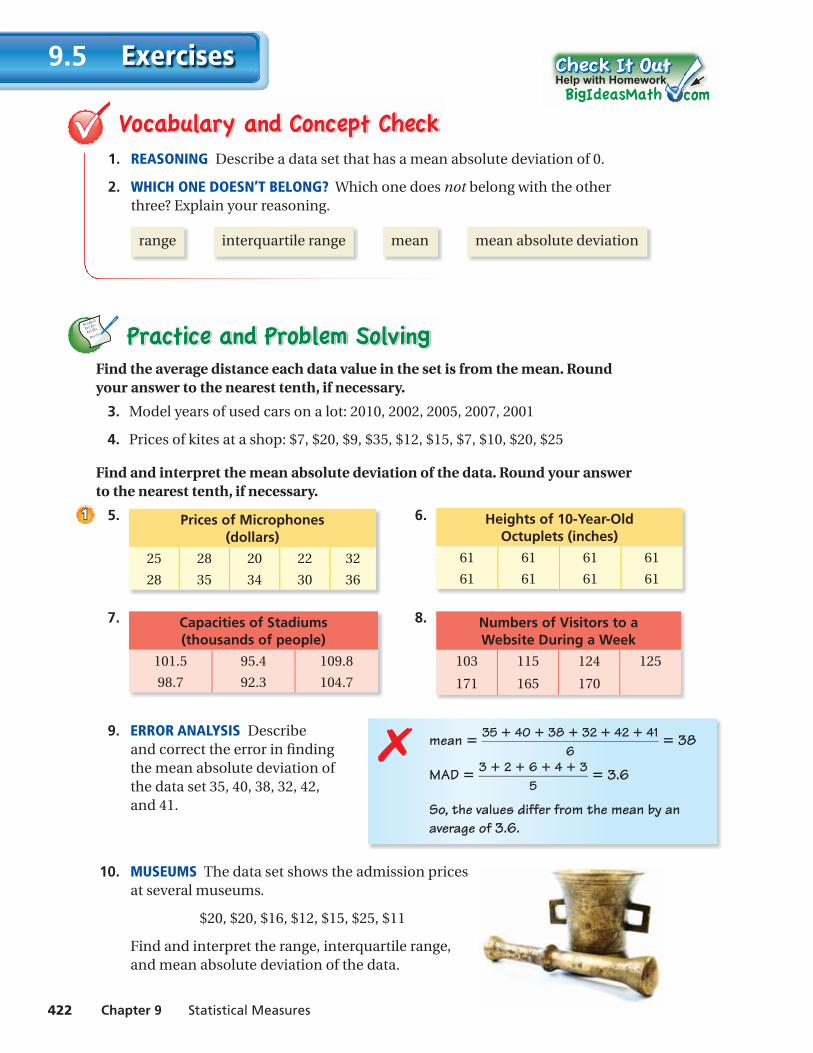
9. ERROR ANALYSIS Describe and correct the error in fi nding the mean absolute deviation of the data set 35, 40, 38, 32, 42, and 41.
10. MUSEUMS The data set shows the admission prices at several museums.
$20, $20, $16, $12, $15, $25, $11
Find and interpret the range, interquartile range, and mean absolute deviation of the data.
1. REASONING Describe a data set that has a mean absolute deviation of 0.
2. WHICH ONE DOESN’T BELONG? Which one does not belong with the other three? Explain your reasoning.
range
interquartile range
mean
mean absolute deviation
Exercises9.5
mean = 35 + 40 + 38 + 32 + 42 + 41 ———
6 = 38
MAD = 3 + 2 + 6 + 4 + 3 ——
5 = 3.6
So, the values differ from the mean by an average of 3.6.
✗
11
Help with Homework
Find the mean, median, and mode(s) of the data. (Section 9.2 and Section 9.3)
18. 4, 6, 7, 9, 6, 4, 5, 6, 8, 10 19. 1.2, 1.7, 1.7, 2.1, 1.4, 1.2, 1.9
20. MULTIPLE CHOICE What is the surface area of the square pyramid? (Section 8.3)
○A 100.8 yd2 ○B 147.2 yd2
○C 211.2 yd2 ○D 368 yd2
Section 9.5 Mean Absolute Deviation 423
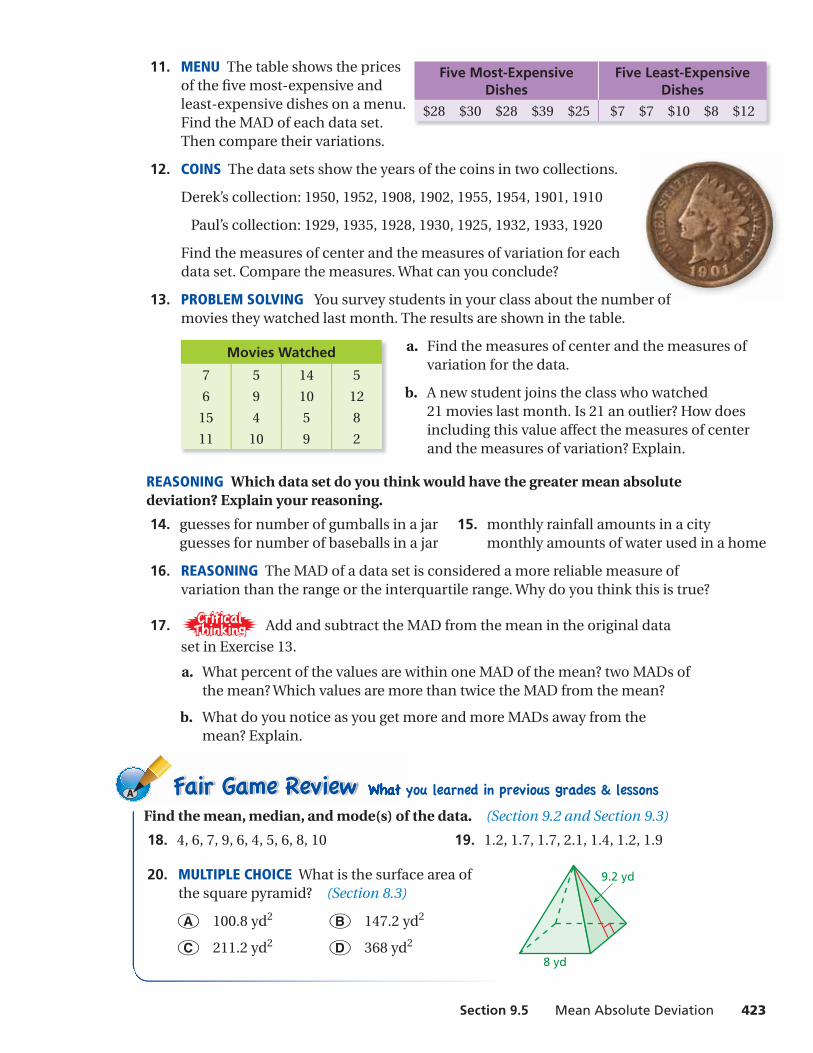
11. MENU The table shows the prices of the fi ve most-expensive and least-expensive dishes on a menu. Find the MAD of each data set. Then compare their variations.
12. COINS The data sets show the years of the coins in two collections.
Derek’s collection: 1950, 1952, 1908, 1902, 1955, 1954, 1901, 1910
Paul’s collection: 1929, 1935, 1928, 1930, 1925, 1932, 1933, 1920
Find the measures of center and the measures of variation for each data set. Compare the measures. What can you conclude?
13. PROBLEM SOLVING You survey students in your class about the number of movies they watched last month. The results are shown in the table.
a. Find the measures of center and the measures of variation for the data.
b. A new student joins the class who watched 21 movies last month. Is 21 an outlier? How does including this value affect the measures of center and the measures of variation? Explain.
REASONING Which data set do you think would have the greater mean absolute deviation? Explain your reasoning.
14. guesses for number of gumballs in a jar 15. monthly rainfall amounts in a city guesses for number of baseballs in a jar monthly amounts of water used in a home
16. REASONING The MAD of a data set is considered a more reliable measure of variation than the range or the interquartile range. Why do you think this is true?
17. Add and subtract the MAD from the mean in the original data
set in Exercise 13.
a. What percent of the values are within one MAD of the mean? two MADs of the mean? Which values are more than twice the MAD from the mean?
b. What do you notice as you get more and more MADs away from the mean? Explain.
Five Most-Expensive Dishes
Five Least-Expensive Dishes
$28 $30 $28 $39 $25 $7 $7 $10 $8 $12
Movies Watched
7 5 14 5
6 9 10 12
15 4 5 8
11 10 9 2
ber of
8 yd
9.2 yd