904 IEEE TRANSACTIONS ON INFORMATION TECHNOLOGY IN
12
904 IEEE TRANSACTIONS ON INFORMATION TECHNOLOGY IN BIOMEDICINE, VOL. 14, NO. 4, JULY 2010 Results of Using a Wireless Inertial Measuring System to Quantify Gait Motions in Control Subjects Iris Tien, Steven D. Glaser, Ruzena Bajcsy, Fellow, IEEE, Douglas S. Goodin, and Michael J. Aminoff Abstract—Gait analysis is important for the diagnosis of many neurological diseases such as Parkinson’s. The discovery and in- terpretation of minor gait abnormalities can aid in early diagnosis. We have used an inertial measuring system mounted on the sub- ject’s foot to provide numerical measures of a subject’s gait (3-D displacements and rotations), thereby creating an automated tool intended to facilitate diagnosis and enable quantitative prognosti- cation of various neurological disorders in which gait is disturbed. This paper describes the process used for ensuring that these in- ertial measurement units yield accurate and reliable displacement and rotation data, and for validating the preciseness and robust- ness of the gait-deconstruction algorithms. It also presents initial results from control subjects, focusing on understanding the data recorded by the shoe-mounted sensor to quantify relevant gait- related motions. Index Terms—Ambulatory measurements, gait analysis, inertial sensing, Parkinson’s disease, physical activity monitoring, wireless sensing. I. INTRODUCTION T HERE is no objective test to confirm the early diagnosis of Parkinson’s disease. Instead, patients rely on the judg- ment of skilled clinicians. Indeed, many neurological diseases are diagnosed by clinical observation of the movements, and in particular, the gait, of patients. Specific characteristics of gait, such as truncal flexion, freezing, ignition characteristics, and stride length, are important in this regard. The diagnostic pro- cess is thus highly subjective, based on the physician’s clinical experience and familiarity with the disease rather than on quan- tifiable measures. This leaves the diagnosis susceptible to the bias of individual clinicians, variability among clinicians based on disparate experiences, and even diagnostic error. Parkinson’s disease currently affects roughly 1.5 million Americans, with Manuscript received September 8, 2008; revised November 25, 2008; ac- cepted April 14, 2009. Date of publication May 5, 2009; date of current version July 9, 2010. This work was supported in part by the Center for Information Technology Research in the Interest of Society (CITRIS) Seed Grant Program under Grant #22. I. Tien is with the Center for Information Technology Research in the Inter- est of Society (CITRIS), University of California, Berkeley, CA 94720 USA (e-mail: [email protected]). S. D. Glaser is with the Center for Information Technology Research in the Interest of Society (CITRIS), University of California, Berkeley, CA 94720 USA, and also with Intel Berkeley Laboratory, Berkeley, CA 94704 USA. He is also with the Energy Resources Department, Lawrence Berkeley National Laboratory, Berkeley, CA 94720 USA (e-mail: [email protected]). R. Bajcsy is with the Electrical Engineering and Computer Sciences Depart- ment, University of California, Berkeley, CA 94720 USA (e-mail: bajcsy@ eecs.berkeley.edu). D. S. Goodin and M. J. Aminoff are with the Neurology Department, University of California, San Francisco, CA 94143 USA (e-mail: douglas. [email protected]; [email protected]). Color versions of one or more of the figures in this paper are available online at http://ieeexplore.ieee.org. Digital Object Identifier 10.1109/TITB.2009.2021650 an estimated 60 000 new cases diagnosed each year. The higher prevalence of the disease among the elderly (85% of sufferers are over the age of 50) means that there will be increased oppor- tunities for aiding the diagnostic process in the coming years as the population ages. We have devised a system that provides an objective analysis of gait that will allow clinicians to easily visualize the body movements of walking patients. The inertial measuring system provides numerical estimates for the parameters defining gait, including 3-D absolute displacement and angular displacement values, attitude, and heading, which can be understood in a phys- ically based model. We intend to use this system to characterize the gait of patients with various neurological disorders in order to facilitate their diagnosis. This system will become a natural component of the telemedical infrastructure, in particular, the one currently being implemented in California. II. RELATED WORK AND BACKGROUND A. Hardware In the past, studies of gait in patients with neurological disor- ders were performed using clinical stride analyzers that consist of force-sensitive insoles placed in the patient’s shoes, with data sent to some collection apparatus attached to the patient [1]–[4], special gait analysis devices [5], or video capture [6]. All of these methods were limited to deployment in clinical settings. The insoles are limited to the collection of data from subjects walk- ing down hallways no more than 10–12 m in length [2]–[4]. The data-collection apparatus (an ankle-worn recorder [1] or backpack [3]) are cumbersome enough to interfere with patient movement. Special gait analysis devices can be complicated and difficult to operate, such as using threads that connect to a pulley, which is then connected to an optical length–voltage transducer [5]. Video capture methods are limited to a fixed motion laboratory location, use multiple cameras (six in [6]), and require precise and involved calibration using a network of wands and markers (15 in [6]) before data collection. An alterna- tive to the insoles has been pressure-sensitive piezoelectric floor sensors that are laid out like tiles along hospital corridors [7]. This again poses limitations as data can be collected only over a relatively short distance and only on flat terrain in a constrained area. Moreover, many aspects of gait (e.g., posture, coordination of body parts, etc.) are not captured by such a system. Rather than tiles, some studies have involved force platforms mounted on a walkway with photocells on either side to measure walking speed [8]. However, with this method, trials where the subjects contact the force platforms improperly must be rejected from the analyses, and the length of two platforms, as used in [8], 1089-7771/$26.00 © 2009 IEEE
Transcript of 904 IEEE TRANSACTIONS ON INFORMATION TECHNOLOGY IN

904 IEEE TRANSACTIONS ON INFORMATION TECHNOLOGY IN BIOMEDICINE, VOL. 14, NO. 4, JULY 2010
Results of Using a Wireless Inertial MeasuringSystem to Quantify Gait Motions in Control Subjects
Iris Tien, Steven D. Glaser, Ruzena Bajcsy, Fellow, IEEE, Douglas S. Goodin, and Michael J. Aminoff
Abstract—Gait analysis is important for the diagnosis of manyneurological diseases such as Parkinson’s. The discovery and in-terpretation of minor gait abnormalities can aid in early diagnosis.We have used an inertial measuring system mounted on the sub-ject’s foot to provide numerical measures of a subject’s gait (3-Ddisplacements and rotations), thereby creating an automated toolintended to facilitate diagnosis and enable quantitative prognosti-cation of various neurological disorders in which gait is disturbed.This paper describes the process used for ensuring that these in-ertial measurement units yield accurate and reliable displacementand rotation data, and for validating the preciseness and robust-ness of the gait-deconstruction algorithms. It also presents initialresults from control subjects, focusing on understanding the datarecorded by the shoe-mounted sensor to quantify relevant gait-related motions.
Index Terms—Ambulatory measurements, gait analysis, inertialsensing, Parkinson’s disease, physical activity monitoring, wirelesssensing.
I. INTRODUCTION
THERE is no objective test to confirm the early diagnosisof Parkinson’s disease. Instead, patients rely on the judg-
ment of skilled clinicians. Indeed, many neurological diseasesare diagnosed by clinical observation of the movements, and inparticular, the gait, of patients. Specific characteristics of gait,such as truncal flexion, freezing, ignition characteristics, andstride length, are important in this regard. The diagnostic pro-cess is thus highly subjective, based on the physician’s clinicalexperience and familiarity with the disease rather than on quan-tifiable measures. This leaves the diagnosis susceptible to thebias of individual clinicians, variability among clinicians basedon disparate experiences, and even diagnostic error. Parkinson’sdisease currently affects roughly 1.5 million Americans, with
Manuscript received September 8, 2008; revised November 25, 2008; ac-cepted April 14, 2009. Date of publication May 5, 2009; date of current versionJuly 9, 2010. This work was supported in part by the Center for InformationTechnology Research in the Interest of Society (CITRIS) Seed Grant Programunder Grant #22.
I. Tien is with the Center for Information Technology Research in the Inter-est of Society (CITRIS), University of California, Berkeley, CA 94720 USA(e-mail: [email protected]).
S. D. Glaser is with the Center for Information Technology Research in theInterest of Society (CITRIS), University of California, Berkeley, CA 94720USA, and also with Intel Berkeley Laboratory, Berkeley, CA 94704 USA. Heis also with the Energy Resources Department, Lawrence Berkeley NationalLaboratory, Berkeley, CA 94720 USA (e-mail: [email protected]).
R. Bajcsy is with the Electrical Engineering and Computer Sciences Depart-ment, University of California, Berkeley, CA 94720 USA (e-mail: [email protected]).
D. S. Goodin and M. J. Aminoff are with the Neurology Department,University of California, San Francisco, CA 94143 USA (e-mail: [email protected]; [email protected]).
Color versions of one or more of the figures in this paper are available onlineat http://ieeexplore.ieee.org.
Digital Object Identifier 10.1109/TITB.2009.2021650
an estimated 60 000 new cases diagnosed each year. The higherprevalence of the disease among the elderly (85% of sufferersare over the age of 50) means that there will be increased oppor-tunities for aiding the diagnostic process in the coming years asthe population ages.
We have devised a system that provides an objective analysisof gait that will allow clinicians to easily visualize the bodymovements of walking patients. The inertial measuring systemprovides numerical estimates for the parameters defining gait,including 3-D absolute displacement and angular displacementvalues, attitude, and heading, which can be understood in a phys-ically based model. We intend to use this system to characterizethe gait of patients with various neurological disorders in orderto facilitate their diagnosis. This system will become a naturalcomponent of the telemedical infrastructure, in particular, theone currently being implemented in California.
II. RELATED WORK AND BACKGROUND
A. Hardware
In the past, studies of gait in patients with neurological disor-ders were performed using clinical stride analyzers that consistof force-sensitive insoles placed in the patient’s shoes, with datasent to some collection apparatus attached to the patient [1]–[4],special gait analysis devices [5], or video capture [6]. All of thesemethods were limited to deployment in clinical settings. Theinsoles are limited to the collection of data from subjects walk-ing down hallways no more than 10–12 m in length [2]–[4].The data-collection apparatus (an ankle-worn recorder [1] orbackpack [3]) are cumbersome enough to interfere with patientmovement. Special gait analysis devices can be complicatedand difficult to operate, such as using threads that connect toa pulley, which is then connected to an optical length–voltagetransducer [5]. Video capture methods are limited to a fixedmotion laboratory location, use multiple cameras (six in [6]),and require precise and involved calibration using a network ofwands and markers (15 in [6]) before data collection. An alterna-tive to the insoles has been pressure-sensitive piezoelectric floorsensors that are laid out like tiles along hospital corridors [7].This again poses limitations as data can be collected only over arelatively short distance and only on flat terrain in a constrainedarea. Moreover, many aspects of gait (e.g., posture, coordinationof body parts, etc.) are not captured by such a system. Ratherthan tiles, some studies have involved force platforms mountedon a walkway with photocells on either side to measure walkingspeed [8]. However, with this method, trials where the subjectscontact the force platforms improperly must be rejected fromthe analyses, and the length of two platforms, as used in [8],
1089-7771/$26.00 © 2009 IEEE
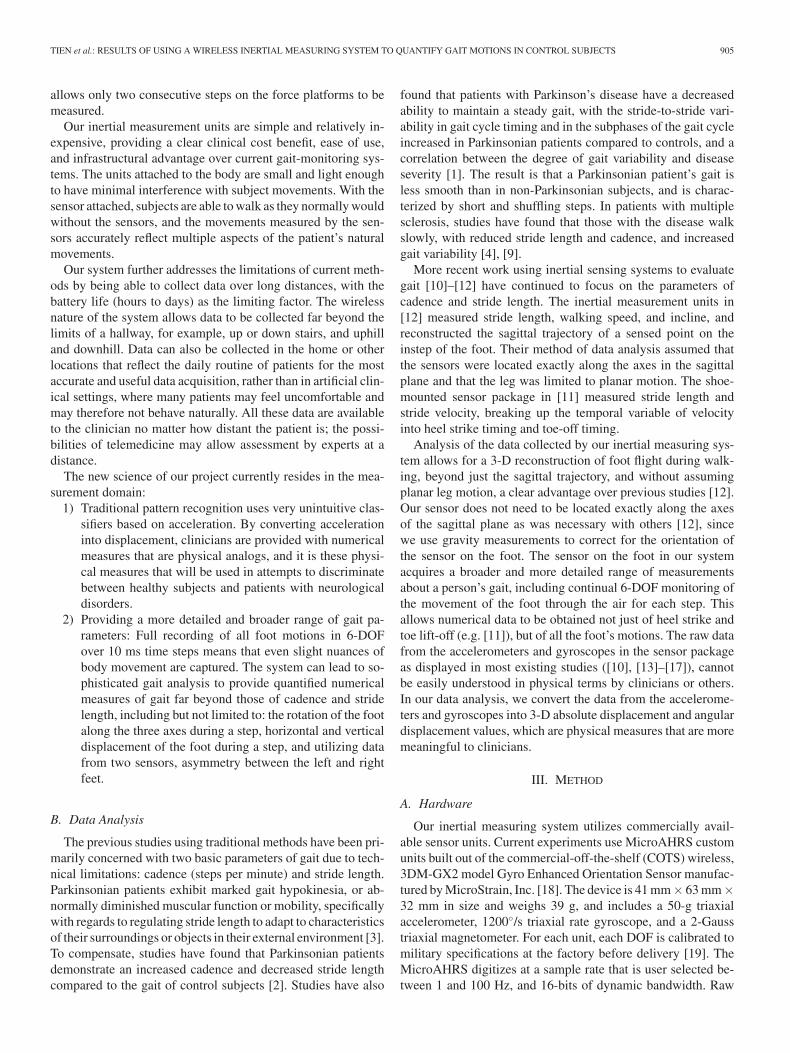
TIEN et al.: RESULTS OF USING A WIRELESS INERTIAL MEASURING SYSTEM TO QUANTIFY GAIT MOTIONS IN CONTROL SUBJECTS 905
allows only two consecutive steps on the force platforms to bemeasured.
Our inertial measurement units are simple and relatively in-expensive, providing a clear clinical cost benefit, ease of use,and infrastructural advantage over current gait-monitoring sys-tems. The units attached to the body are small and light enoughto have minimal interference with subject movements. With thesensor attached, subjects are able to walk as they normally wouldwithout the sensors, and the movements measured by the sen-sors accurately reflect multiple aspects of the patient’s naturalmovements.
Our system further addresses the limitations of current meth-ods by being able to collect data over long distances, with thebattery life (hours to days) as the limiting factor. The wirelessnature of the system allows data to be collected far beyond thelimits of a hallway, for example, up or down stairs, and uphilland downhill. Data can also be collected in the home or otherlocations that reflect the daily routine of patients for the mostaccurate and useful data acquisition, rather than in artificial clin-ical settings, where many patients may feel uncomfortable andmay therefore not behave naturally. All these data are availableto the clinician no matter how distant the patient is; the possi-bilities of telemedicine may allow assessment by experts at adistance.
The new science of our project currently resides in the mea-surement domain:
1) Traditional pattern recognition uses very unintuitive clas-sifiers based on acceleration. By converting accelerationinto displacement, clinicians are provided with numericalmeasures that are physical analogs, and it is these physi-cal measures that will be used in attempts to discriminatebetween healthy subjects and patients with neurologicaldisorders.
2) Providing a more detailed and broader range of gait pa-rameters: Full recording of all foot motions in 6-DOFover 10 ms time steps means that even slight nuances ofbody movement are captured. The system can lead to so-phisticated gait analysis to provide quantified numericalmeasures of gait far beyond those of cadence and stridelength, including but not limited to: the rotation of the footalong the three axes during a step, horizontal and verticaldisplacement of the foot during a step, and utilizing datafrom two sensors, asymmetry between the left and rightfeet.
B. Data Analysis
The previous studies using traditional methods have been pri-marily concerned with two basic parameters of gait due to tech-nical limitations: cadence (steps per minute) and stride length.Parkinsonian patients exhibit marked gait hypokinesia, or ab-normally diminished muscular function or mobility, specificallywith regards to regulating stride length to adapt to characteristicsof their surroundings or objects in their external environment [3].To compensate, studies have found that Parkinsonian patientsdemonstrate an increased cadence and decreased stride lengthcompared to the gait of control subjects [2]. Studies have also
found that patients with Parkinson’s disease have a decreasedability to maintain a steady gait, with the stride-to-stride vari-ability in gait cycle timing and in the subphases of the gait cycleincreased in Parkinsonian patients compared to controls, and acorrelation between the degree of gait variability and diseaseseverity [1]. The result is that a Parkinsonian patient’s gait isless smooth than in non-Parkinsonian subjects, and is charac-terized by short and shuffling steps. In patients with multiplesclerosis, studies have found that those with the disease walkslowly, with reduced stride length and cadence, and increasedgait variability [4], [9].
More recent work using inertial sensing systems to evaluategait [10]–[12] have continued to focus on the parameters ofcadence and stride length. The inertial measurement units in[12] measured stride length, walking speed, and incline, andreconstructed the sagittal trajectory of a sensed point on theinstep of the foot. Their method of data analysis assumed thatthe sensors were located exactly along the axes in the sagittalplane and that the leg was limited to planar motion. The shoe-mounted sensor package in [11] measured stride length andstride velocity, breaking up the temporal variable of velocityinto heel strike timing and toe-off timing.
Analysis of the data collected by our inertial measuring sys-tem allows for a 3-D reconstruction of foot flight during walk-ing, beyond just the sagittal trajectory, and without assumingplanar leg motion, a clear advantage over previous studies [12].Our sensor does not need to be located exactly along the axesof the sagittal plane as was necessary with others [12], sincewe use gravity measurements to correct for the orientation ofthe sensor on the foot. The sensor on the foot in our systemacquires a broader and more detailed range of measurementsabout a person’s gait, including continual 6-DOF monitoring ofthe movement of the foot through the air for each step. Thisallows numerical data to be obtained not just of heel strike andtoe lift-off (e.g. [11]), but of all the foot’s motions. The raw datafrom the accelerometers and gyroscopes in the sensor packageas displayed in most existing studies ([10], [13]–[17]), cannotbe easily understood in physical terms by clinicians or others.In our data analysis, we convert the data from the accelerome-ters and gyroscopes into 3-D absolute displacement and angulardisplacement values, which are physical measures that are moremeaningful to clinicians.
III. METHOD
A. Hardware
Our inertial measuring system utilizes commercially avail-able sensor units. Current experiments use MicroAHRS customunits built out of the commercial-off-the-shelf (COTS) wireless,3DM-GX2 model Gyro Enhanced Orientation Sensor manufac-tured by MicroStrain, Inc. [18]. The device is 41 mm× 63 mm×32 mm in size and weighs 39 g, and includes a 50-g triaxialaccelerometer, 1200◦/s triaxial rate gyroscope, and a 2-Gausstriaxial magnetometer. For each unit, each DOF is calibrated tomilitary specifications at the factory before delivery [19]. TheMicroAHRS digitizes at a sample rate that is user selected be-tween 1 and 100 Hz, and 16-bits of dynamic bandwidth. Raw

906 IEEE TRANSACTIONS ON INFORMATION TECHNOLOGY IN BIOMEDICINE, VOL. 14, NO. 4, JULY 2010
Fig. 1. Diagram of sensor orientation on the shoe.
and corrected data are transmitted by the Bluetooth wirelesscommunication protocol to a nearby handheld personal digitalassistant (PDA, Nokia N810). Fig. 1 shows the sensor orien-tation on the subject’s shoe and the corresponding directionsof the x, y, and z axes for acceleration, rotation, and headingthat are used in this paper. The inertial unit is mounted on theshoe with the foam-padded polymethylmethacrylate (PMMA)plastic foot mount with holes to thread shoelaces through. Thisapparatus allows the sensor to be tied down tightly, reducing the“sensor jolting” documented by others [12] and ensuring thatthe data accurately reflect the movement of the underlying footrather than movement between the sensor and foot.
B. Test to Validate Gyroscope Algorithms
The gyroscope outputs data as an angle rate, in radians persecond. It is easier to understand foot motion in the physicallyrelevant measures of degrees rotated in the three orthogonal di-rections. To obtain this, the angle rate needed to be integratedover time to produce the angle swept during a certain time pe-riod. The trapezoidal rule of integration was used, with subin-tervals of integration equal to the inverse of the sensor samplingrate (∆t = 10 ms).
Rotation is used to create transformation matrices that areused to transfer the coordinate system from the body frame,a moving coordinate system of the sensor and the shoe, to aninertial frame, a fixed reference to the ground [20]. The transfor-mation matrix from the body to the inertial frame, for rotationabout the x axis is
X−1 =
1 0 00 cos θx − sin θx
0 sin θx cos θx
. (1)
The transformation matrix for rotation about the y axis is
Y −1 =
cos θy 0 sin θy
0 1 0− sin θy 0 cos θy
. (2)
And the transformation matrix for rotation about the z axisis:
Z−1 =
cos θz − sin θz 0sin θz cos θz 0
0 0 1
. (3)
To transfer the coordinates in a 3-D space, these three ma-trices need to be multiplied together. In doing so, the order ofrotation matters as rotation, i.e., multiplication, is not commu-tative and multiplying the transformation matrices in differentorders produces different results. For example, an order of trans-formation defined by [Z−1Y −1X−1 ] produces a transformationmatrix, shown in (4), at the bottom of this page.
However, a different order of transformation would producea different transformation matrix. As a result, for large angles,a unique solution to the problem cannot be obtained. However,a small angle approximation can be made, such that
cos dθ ∼= 1
sin dθ ∼= dθ
dθ × dθ ∼= 0. (5)
This is a valid approximation in our application because weare integrating small changes in angle over small time steps of1/100 seconds. Applying this approximation, the 3-D transfor-mation matrix becomes
Z−1Y −1X−1 ∼=
1 −dθz dθy
dθz 1 −dθx
−dθy dθx 1
(6)
where dθ denotes the angle between the body frame and the iner-tial frame. Any order of multiplying the transformation matricesresults in this 3× 3 transformation matrix, producing a uniquesolution to the problem. While total angles covered during a stepmay be large, the integration occurs between individual samples.With the high sampling rate of 100 Hz, and corresponding smalltime steps for integration of 1/100 seconds, then, small-angleapproximation is valid. The changes in angle between when thematrices are multiplied are small, and integration of the gyro-scope rate gives accurate results of the angle covered.
To remove sensor drift in the analysis of data from accelerom-eters, there is a technique known as “zero velocity updating,”which assesses the accelerometer drift with every step to re-move the cumulative effects [21]. In our gyroscope algorithms,
Z−1Y −1X−1 =
cos θy cos θz − cos θx sin θz + sin θx sin θy cos θz sin θx sin θz + cos θx sin θy cos θz
cos θy sin θz cos θx cos θz + sin θx sin θy sin θz − sin θx cos θz + cos θx sin θy sin θz
− sin θy sin θx cos θy cos θx cos θy
. (4)
TIEN et al.: RESULTS OF USING A WIRELESS INERTIAL MEASURING SYSTEM TO QUANTIFY GAIT MOTIONS IN CONTROL SUBJECTS 907
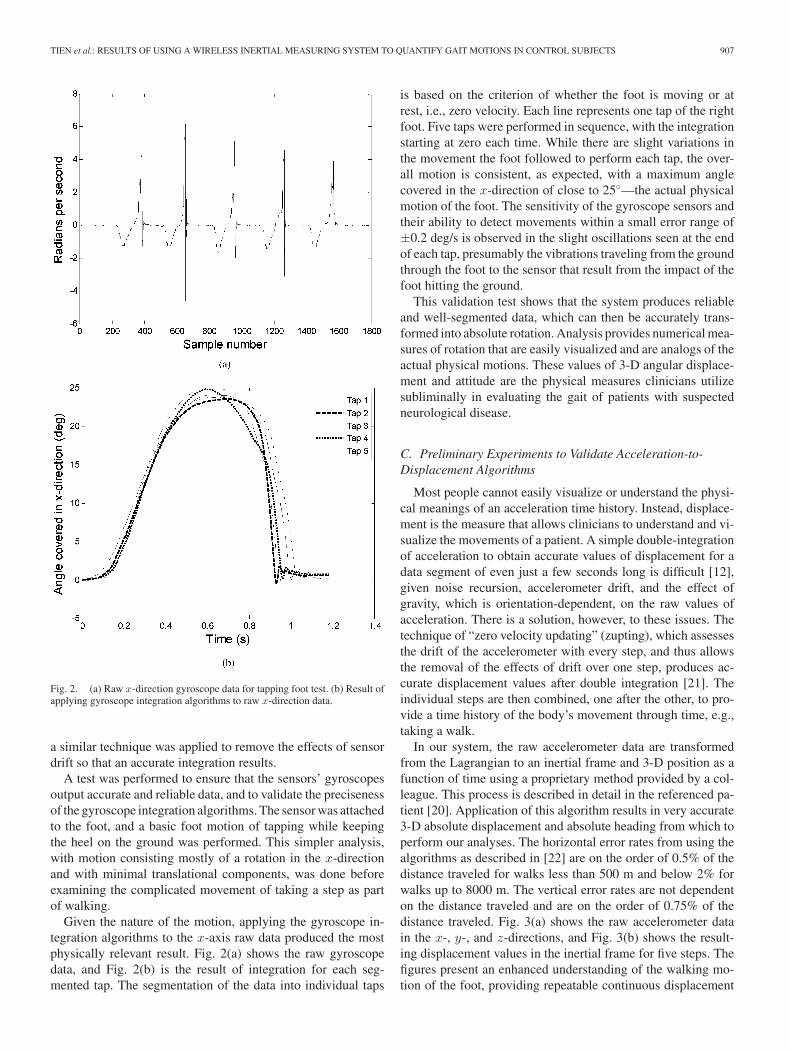
Fig. 2. (a) Raw x-direction gyroscope data for tapping foot test. (b) Result ofapplying gyroscope integration algorithms to raw x-direction data.
a similar technique was applied to remove the effects of sensordrift so that an accurate integration results.
A test was performed to ensure that the sensors’ gyroscopesoutput accurate and reliable data, and to validate the precisenessof the gyroscope integration algorithms. The sensor was attachedto the foot, and a basic foot motion of tapping while keepingthe heel on the ground was performed. This simpler analysis,with motion consisting mostly of a rotation in the x-directionand with minimal translational components, was done beforeexamining the complicated movement of taking a step as partof walking.
Given the nature of the motion, applying the gyroscope in-tegration algorithms to the x-axis raw data produced the mostphysically relevant result. Fig. 2(a) shows the raw gyroscopedata, and Fig. 2(b) is the result of integration for each seg-mented tap. The segmentation of the data into individual taps
is based on the criterion of whether the foot is moving or atrest, i.e., zero velocity. Each line represents one tap of the rightfoot. Five taps were performed in sequence, with the integrationstarting at zero each time. While there are slight variations inthe movement the foot followed to perform each tap, the over-all motion is consistent, as expected, with a maximum anglecovered in the x-direction of close to 25◦—the actual physicalmotion of the foot. The sensitivity of the gyroscope sensors andtheir ability to detect movements within a small error range of±0.2 deg/s is observed in the slight oscillations seen at the endof each tap, presumably the vibrations traveling from the groundthrough the foot to the sensor that result from the impact of thefoot hitting the ground.
This validation test shows that the system produces reliableand well-segmented data, which can then be accurately trans-formed into absolute rotation. Analysis provides numerical mea-sures of rotation that are easily visualized and are analogs of theactual physical motions. These values of 3-D angular displace-ment and attitude are the physical measures clinicians utilizesubliminally in evaluating the gait of patients with suspectedneurological disease.
C. Preliminary Experiments to Validate Acceleration-to-Displacement Algorithms
Most people cannot easily visualize or understand the physi-cal meanings of an acceleration time history. Instead, displace-ment is the measure that allows clinicians to understand and vi-sualize the movements of a patient. A simple double-integrationof acceleration to obtain accurate values of displacement for adata segment of even just a few seconds long is difficult [12],given noise recursion, accelerometer drift, and the effect ofgravity, which is orientation-dependent, on the raw values ofacceleration. There is a solution, however, to these issues. Thetechnique of “zero velocity updating” (zupting), which assessesthe drift of the accelerometer with every step, and thus allowsthe removal of the effects of drift over one step, produces ac-curate displacement values after double integration [21]. Theindividual steps are then combined, one after the other, to pro-vide a time history of the body’s movement through time, e.g.,taking a walk.
In our system, the raw accelerometer data are transformedfrom the Lagrangian to an inertial frame and 3-D position as afunction of time using a proprietary method provided by a col-league. This process is described in detail in the referenced pa-tient [20]. Application of this algorithm results in very accurate3-D absolute displacement and absolute heading from which toperform our analyses. The horizontal error rates from using thealgorithms as described in [22] are on the order of 0.5% of thedistance traveled for walks less than 500 m and below 2% forwalks up to 8000 m. The vertical error rates are not dependenton the distance traveled and are on the order of 0.75% of thedistance traveled. Fig. 3(a) shows the raw accelerometer datain the x-, y-, and z-directions, and Fig. 3(b) shows the result-ing displacement values in the inertial frame for five steps. Thefigures present an enhanced understanding of the walking mo-tion of the foot, providing repeatable continuous displacement

908 IEEE TRANSACTIONS ON INFORMATION TECHNOLOGY IN BIOMEDICINE, VOL. 14, NO. 4, JULY 2010
Fig. 3. (a) Raw three-axis accelerometer data (m/s2 ) for five steps of walking.(b) Three-axis displacement output (m) from accelerometer data.
measurements during each step, a hitherto unappreciated mea-sure of gait.
A set of preliminary experiments that allow examination ofthe better-known numerical gait parameters of cadence andstride length was performed. Two members of the researchteam, one young 19-year-old woman and one elderly 70-year-old woman, participated in this initial round of data collection,before the system was used to collect data from the control co-hort. They were chosen based on their age disparity, so as todemonstrate the ability of the system to reproduce the resultsof previous studies examining the effects of age on gait. With asensor attached to the shoe, both subjects walked along a pre-designated path around the UC Berkeley campus, a distance ofover 1 km, with each trial taking approximately 20 min. Thepath included walking indoors and outdoors, uphill and down-
TABLE IRESULTING GAIT METRICS OF THE MEANS AND STANDARD DEVIATIONS (SD)
OF CADENCE (STEPS PER MINUTE) AND STRIDE LENGTH (IN METERS) FOR
PRELIMINARY GAIT ANALYSIS EXPERIMENTS
hill, and up stairs and down stairs. Data were collected in themorning (AM) and afternoon (PM) of the same day for eachsubject.
Similar to the gyroscope data analysis, the displacement dataare first segmented into individual steps based on when the footcomes to rest, i.e., zero velocity, at the end of each step. Know-ing the sample rate allows the conversion of the sample numberto time, and thus cadence; resolving the x- and y-direction dis-placement data gives the distance traveled in the horizontal planeof the ground (the xy plane), and thus stride length. Calculatingthe cadence and stride length for each step allows for statisti-cal analysis of the data. The results are shown in Table I. Foreach subject, the algorithms compute the mean values of themetrics, allowing for comparison of the metrics between sub-jects. Recording the age of the subject and the time of day ofthe data collection allows conclusions to be drawn between thediffering metrics and the varying subject characteristics. Thestatistical analysis also includes calculations of gait variabil-ity as expressed through the standard deviation (SD) from themean for each metric. These numerical parameters allow for anevaluation of an individual subject’s stride-to-stride variability,where a high variability may indicate an inability of the sub-ject to maintain a steady gait in changing physical settings orespecially challenging terrain. Knowing that there is increasedstride-to-stride variability in, for example, patients with Parkin-son’s disease [1] or multiple sclerosis [4] compared to controls,this capability of the system will be valuable in assessing thepresence of such neurological diseases.
Although the data presented in Table I are only for two sub-jects, a very small cohort, the number of steps over which themeasures were calculated are large (including at least 50 fullgait cycles each for the uphill and downhill segments and 14full gait cycles each for the up stairs and down stairs segments),so that there are sufficient trials to make a robust estimate.
While one may expect the stride lengths up stairs to be al-most equal due to the constant dimensions of the steps of astaircase, the variations shown in Table I can be explained bynoting that only the vertical z-dimension of a step is fixed, whilestride length is a measure of horizontal distance covered in the
TIEN et al.: RESULTS OF USING A WIRELESS INERTIAL MEASURING SYSTEM TO QUANTIFY GAIT MOTIONS IN CONTROL SUBJECTS 909
xy-plane. Thus, our system measures the actual length of thestep taken to go up a stair, rather than just the height of thestep. If, for example, a subject was fatigued, and needed to takea more roundabout route to navigate a step, such as sweepingan arc around the step instead of bending the knee and usingmaximum muscle power to take a straight path up a step, thisaction would be reflected in the stride length results. Comparingthe young AM and young PM results shows this to be the case.In addition, taking a roundabout route up a step lends itself tohigher variations between steps compared to consistently takingthe perpendicular path relative to the step, leading to higher SDvalues in stride length up stairs as well.
D. Experimental Method for Control Subjects
In order to be able to diagnose various neurological diseasesbased on features of a patient’s gait, discriminant features mustbe found for any form of pattern recognition. One of our goalsis to create a system consisting of physically-based measuresthat clinicians will be able to understand and visualize in distin-guishing between normal and disrupted gait.
To begin building such a system, seven control subjects, malesover the age of 50, without history or evidence of neurologicaldisease, were used as a “healthy” cohort. Before the collectionof data, subjects provided their age, height, and weight. Theinertial measurement units were attached to the shoe using thefoam-padded mount, to the wrist using a Velcro elastic wristsupport, and to the sternum using a pair of specially designedelastic suspenders. Wearing these sensors, subjects walked alonga predetermined path on the UC Berkeley campus. This pathincluded a segment of walking outdoors at a constant pace andslightly downhill, before turning around, walking slightly uphill,and going indoors to walk up stairs, then down stairs.
E. Data Analysis
The data analysis for this cohort utilizes both the gyroscopeand accelerometer algorithms that have been validated by theexperiments previously described. Current analyses have beenfocused on the data from the sensor attached to the shoe. Becauseof the susceptibility of the sensors to drift [21], the data from thegyroscope and accelerometer were segmented separately, basedon whether the sensor was moving, to maintain accuracy. Thesmall time differences in each sensor’s start-up were accountedfor in data alignment to obtain time-aligned segmented sets ofdata consisting of individual steps.
IV. INITIAL CONTROL SUBJECT RESULTS
A. 3-D Angular Displacement from Gyroscope Algorithms
With the sensor oriented on the shoe as shown in Fig. 1,the gyroscope algorithms calculate the rotation of the foot, inthree directions, for each step in the inertial frame. Data werecollected for all seven control subjects along the same predesig-nated path. As this path consisted of varying terrain, the analysiswas performed for separate particular portions of the path. Thefollowing results are from the analysis of the outdoors, slightly
uphill, portion, consisting of 20–25 full gait cycles for eachsubject.
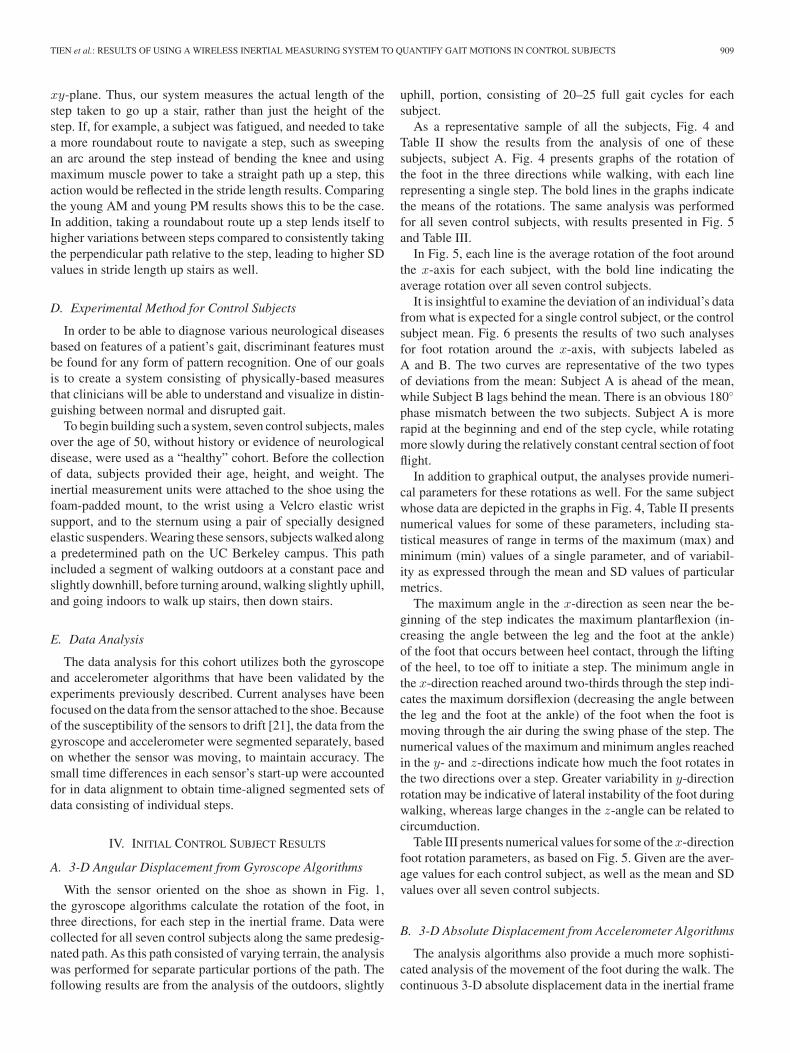
As a representative sample of all the subjects, Fig. 4 andTable II show the results from the analysis of one of thesesubjects, subject A. Fig. 4 presents graphs of the rotation ofthe foot in the three directions while walking, with each linerepresenting a single step. The bold lines in the graphs indicatethe means of the rotations. The same analysis was performedfor all seven control subjects, with results presented in Fig. 5and Table III.
In Fig. 5, each line is the average rotation of the foot aroundthe x-axis for each subject, with the bold line indicating theaverage rotation over all seven control subjects.
It is insightful to examine the deviation of an individual’s datafrom what is expected for a single control subject, or the controlsubject mean. Fig. 6 presents the results of two such analysesfor foot rotation around the x-axis, with subjects labeled asA and B. The two curves are representative of the two typesof deviations from the mean: Subject A is ahead of the mean,while Subject B lags behind the mean. There is an obvious 180◦
phase mismatch between the two subjects. Subject A is morerapid at the beginning and end of the step cycle, while rotatingmore slowly during the relatively constant central section of footflight.
In addition to graphical output, the analyses provide numeri-cal parameters for these rotations as well. For the same subjectwhose data are depicted in the graphs in Fig. 4, Table II presentsnumerical values for some of these parameters, including sta-tistical measures of range in terms of the maximum (max) andminimum (min) values of a single parameter, and of variabil-ity as expressed through the mean and SD values of particularmetrics.
The maximum angle in the x-direction as seen near the be-ginning of the step indicates the maximum plantarflexion (in-creasing the angle between the leg and the foot at the ankle)of the foot that occurs between heel contact, through the liftingof the heel, to toe off to initiate a step. The minimum angle inthe x-direction reached around two-thirds through the step indi-cates the maximum dorsiflexion (decreasing the angle betweenthe leg and the foot at the ankle) of the foot when the foot ismoving through the air during the swing phase of the step. Thenumerical values of the maximum and minimum angles reachedin the y- and z-directions indicate how much the foot rotates inthe two directions over a step. Greater variability in y-directionrotation may be indicative of lateral instability of the foot duringwalking, whereas large changes in the z-angle can be related tocircumduction.
Table III presents numerical values for some of the x-directionfoot rotation parameters, as based on Fig. 5. Given are the aver-age values for each control subject, as well as the mean and SDvalues over all seven control subjects.
B. 3-D Absolute Displacement from Accelerometer Algorithms
The analysis algorithms also provide a much more sophisti-cated analysis of the movement of the foot during the walk. Thecontinuous 3-D absolute displacement data in the inertial frame
910 IEEE TRANSACTIONS ON INFORMATION TECHNOLOGY IN BIOMEDICINE, VOL. 14, NO. 4, JULY 2010
Fig. 4. (a) Rotation of the foot around the x-axis for each step over the walk forcontrol subject A, compared to the mean over all steps (bold line). (b) Rotationof the foot around the y-axis for each step for control subject A, compared tothe mean over all steps (bold line). (c) Rotation of the foot around the z-axis foreach step for control subject A, compared to the mean over all steps (bold line).
TABLE IIMETRICS FOR FOOT ROTATIONS FOR CONTROL SUBJECT A, WITH ANGULAR
DISPLACEMENT VALUES GIVEN IN DEGREES AND TIME IN SECONDS
Fig. 5. Average rotation of the foot around the x-axis for each control subject.The mean is indicated by the bold line.
TABLE IIIMETRICS FOR x-DIRECTION FOOT ROTATIONS FOR ALL CONTROL SUBJECTS

TIEN et al.: RESULTS OF USING A WIRELESS INERTIAL MEASURING SYSTEM TO QUANTIFY GAIT MOTIONS IN CONTROL SUBJECTS 911
Fig. 6. Deviation from control subject mean of foot rotation around x-axis fortwo subjects A and B.
allow reconstruction of the total path traveled by the subject andof specific foot movements over time, both in the horizontal xy-plane of the ground as expressed by the distance traveled, and inthe vertical z-direction. Again, this analysis was carried out forall seven control subjects, and for the same particular portion ofthe path. Fig. 7 shows, as a representative sample, one of theseanalyses that was performed for the same control subject A asin Fig. 4. In the graphs, each line represents a single step, andthe means of the displacements are indicated by the bold lines.
Fig. 7(a) shows the horizontal distance traveled in the xy-plane of the ground for each step. As the subjects did not walkin a straight line, but followed the curve of the path, the distanceis calculated by resolving the x- and y-direction displacementvalues. The maximum distance reached for a particular stepis the stride length for that step. Fig. 7(b) is the plot of thedisplacement of the foot in the vertical z-direction for each step.
In Fig. 8, each line represents the average rotation distancetraveled in the horizontal xy-plane of the ground for each sub-ject, with the bold line indicating the average distance traveledover all seven control subjects.
Similar to Fig. 6, it is productive to look at the deviation ofan individual’s data from what is expected for a control subject,or the control subject mean. Fig. 9 presents the results of theanalyses for distance traveled in the xy-plane for the same twosubjects as in Fig. 6, labeled as Subjects A and B. The twocurves are representative of the two types of deviations fromthe mean, with Subject A once again ahead of the mean, andSubject B lagging behind the mean.
Similar to the gyroscope algorithms, the displacement al-gorithms provide detailed numerical parameters. For the samesubject whose data are depicted in Fig. 7, Table IV providessome important gait parameters, including statistical measuresof range in terms of the maximum (max) and minimum (min)values of a single parameter, and of variability as expressedthrough the mean and SD values of particular metrics.
Fig. 7. (a) Distance traveled in the xy- plane for each step over the walk forcontrol subject A, compared to the mean over all steps. (b) Displacement of thefoot in the z-direction for each step for subject A, compared to the mean overall steps.
Fig. 8. Average distance traveled in the xy-plane for each control subject.

912 IEEE TRANSACTIONS ON INFORMATION TECHNOLOGY IN BIOMEDICINE, VOL. 14, NO. 4, JULY 2010
Fig. 9. Deviation from control subject mean of distance traveled in thexy-plane for two subjects A and B.
TABLE IVMETRICS FOR THE DISPLACEMENTS OF CONTROL SUBJECT A, WITH
DISPLACEMENT VALUES GIVEN IN METERS AND TIME IN SECONDS
The maximum displacement in the vertical z-direction is themaximum rise of the foot as it moves through the air duringthe swing phase of a step. Cadence (steps per minute) givesthe frequency of steps, while stride length gives the distancecovered in a single step. Looking at a full gait cycle, velocitycombines both the cadence and stride length variables into anoverall measure of how fast the subject is moving while walking.Breaking down a step into a percentage of time when the foot ismoving compared to when it is stationary shows how long thesubject is in the swing phase compared to the stance phase of astep.
Table V presents numerical values for some of the parametersof displacement in the xy-plane, as based on Fig. 8. Given arethe average values for each control subject, as well as the meanand SD over all seven control subjects.
C. Physically-Based Model of the Foot for Visualization
Combining the gyroscope and displacement algorithms givesthe rotational and translational components necessary to fully
TABLE VMETRICS FOR DISPLACEMENT IN THE xy-PLANE FOR ALL CONTROL SUBJECTS
Fig. 10. Still shots from a video of a foot while walking and the correspondinganimation output by our algorithms to create a model for visualization.
describe the motion of the foot as it moves through the airfor each step. Our algorithms use this information to allowvisualization of the foot while walking. Using an ellipsoid asa model of the foot, Fig. 10 shows, top and bottom, still shotsfrom a video of a foot while walking and the corresponding stillsfrom the animation of the ellipsoid based on the analyzed data.
V. DISCUSSION
The data presented here have shown that the increased gran-ularity of measurements of gait motions makes a more physicalinterpretation of walking motions possible. Analysis of Table Ifrom the preliminary experiments shows that the young subjecthad a higher cadence and longer stride length in the morningthan afternoon in the uphill and downhill segments, perhaps theresult of fatigue of the subject through the course of the day.The decreased cadence between morning and afternoon is es-pecially pronounced for the young subject when walking downstairs. In walking up and down stairs, the elderly subject hada lower cadence compared to the young subject, as stairs are amore difficult and complex terrain for the aged to navigate. Inwalking uphill and downhill, the elderly subject had a highercadence and shorter stride length than the young subject, a find-ing consistent with previous studies of the effect of aging ongait [23]. With higher SD values, the elderly subject displayedgreater variability than the young subject in both cadence andstride length when walking up stairs. Studies have postulatedthat increased variability in gait among the elderly is the resultof decreased strength and flexibility [24]. As walking up stairsrequires a significant amount of strength to lift the mass of thebody up the height of a step and flexibility to lift the leg upthe height of a step, the increased variability shown in Table Ifor the elderly subject is consistent with past results. Due tothe physical challenge of walking up stairs, it is probable that,unlike walking along smooth slopes, a subject’s gait metrics are

TIEN et al.: RESULTS OF USING A WIRELESS INERTIAL MEASURING SYSTEM TO QUANTIFY GAIT MOTIONS IN CONTROL SUBJECTS 913
determined in large part by balance-control mechanisms as op-posed to the gait-patterning mechanism. It has been found thatthe gait variables determined by balance-control mechanismshave increased variability with age [23], a result shown here.The consistency of the experimental results with previous workprovides validation for the accuracy of both the initial conversionof acceleration to displacement, and the subsequent analysis ofthe displacement data.
From the control subject experiments, for a given individual,the graphs of rotation of the foot in three orthogonal directions(see Fig. 4) show consistency in both shape and amplitude acrossmany steps. People are quite constant in their gait from step tostep, and therefore analyses of the subtleties on an individuals’gait can be made. The y-rotation graph [see Fig. 4(b)] showsthe most variation among the 6-DOF measurements. The ampli-tudes of the motions are relatively small but significant becausethe degree of pronation of the foot is a strong indicator betweensubjects, for example, it is an important parameter for choosingrunning shoes. The three graphs allow for a straightforward un-derstanding of the flight motion of the foot through the air foreach step. The aligned zero-points for the rotations around thex-axis [see Fig. 4(a)] and z-axis [see Fig. 4(c)] show that thetransition from plantarflexion of the foot to dorsiflexion (x-axisrotation) occurs simultaneously as the transition from a clock-wise rotation from center to counterclockwise (z-axis rotation),a fact not distinguishable by the naked eye.
The graphs of foot displacement (see Fig. 7) provide muchmore detailed spatiotemporal information for the walking footthan the cadence and stride length examined in previous stud-ies. The displacement graphs show consistency in both shapeand amplitude for a single subject across steps for the walkingmotion, both in the xy-plane of the ground in terms of distancetraveled [see Fig. 7(a)] and in the z-direction displacement [seeFig. 7(b)].
The graphs of rotation of the foot around the x-axis (seeFig. 5) and of distance traveled in the horizontal xy-plane ofthe ground (see Fig. 8) for each subject show consistency in theoverall motion for all control subjects, with only slight variationbetween individual subjects. Taking the mean to obtain theseresults introduces some artifacts, such as the rounding of thepeak in Fig. 5. However, we are looking at the overall shapes ofthe curves, and thus these artifacts are relatively insignificant.In addition, the averaging is necessary to establish a modelfor the healthy cohort. The consistency for the healthy cohortshown in Figs. 5 and 8, along with the data to be collected frompatients with neurological disease, will allow the two groups tobe distinguished.
The numerical parameters obtained by the gyroscope algo-rithms (Table II) are medically relevant variables as found inprevious studies on neurological disease. A smaller magnitudeof the minimum angle reached in the x-direction shows de-creased dorsiflexion, which is an indicator of foot drop. In mul-tiple sclerosis, foot drop has been shown to be due to decreasedmuscle endurance of the legs and reduced dorsiflexor controlduring walking [25]. While the magnitudes of the maximumand minimum angles in the y-direction are the smallest of thethree coordinates, they display the highest SD values. Greater
variability in these y-angle parameters coordinates with insta-bility of the foot, an inability to keep the foot level to the ground,and reduced muscle strength in the ankle, during the motion oftaking a step. Such muscle weakness in the ankle has been foundto be one of the causes for postural instability in patients withParkinson’s disease [26]. Greater magnitudes of the maximumand minimum angles in the z-direction, or larger differencesbetween the high and low extremes of z-direction rotation ofthe foot during a step, are a way to measure foot circumduction,a known feature of certain gait disorders [27].
Comparison of Figs. 6 and 9 provides insight into how anindividual’s motion deviates from the motion expected for acontrol subject, as determined by the mean calculated over allcontrol subjects. Subject A is ahead of the mean for both footrotation around the x-axis (see Fig. 6) and distance traveledin the xy-plane (see Fig. 9). These two deviations are relatedin that because he reaches his maximum angle in the x-directionsooner, as evidenced by the peak at the beginning of the step inFig. 6, he is able to initiate the swing phase of his step sooner,and cover the distance of the step sooner, as evidenced by thepositive deviation from the control subject mean in Fig. 9. Thisphysical explanation also accounts for the negative deviation inthe middle of the step for the rotation around the x-axis. SinceSubject A reached his maximum x-angle earlier, he is also aheadof the mean during the dorsiflexion of the foot, with a foot angleless than the mean during this phase of the step. Conversely,Subject B lags behind the mean in both measures. It takes himlonger to reach his maximum angle in the x-direction, so it islater when he begins the swing phase of his step, leaving himbelow the mean for distance traveled for the duration of the step.The positive deviation seen in Fig. 6 for foot rotation around thex-axis during the middle of the step is due to a later beginningof the dorsiflexion phase of the step compared to the mean.
A thorough literature review has shown that these rotationparameters of gait have not been studied previously. Thus, nopublished reference data are available with which to compareour results for validation. Gait analysis has consistently focusedon cadence, stride length, and velocity. As clinicians take intoaccount a much broader range of gait characteristics when eval-uating patients, this shows the importance of the new science ofour system in providing quantified measurements of these gaitparameters as well, including rotation.
The metrics obtained from the displacement algorithms(Table IV) are medically relevant variables used in the eval-uation of gait. A larger magnitude of the maximum verticalz-direction displacement of a foot during the swing phase ofa step is indicative of steppage gait, which occurs in a varietyof neurological disorders. The common metrics of cadence andstride length have been studied widely in previous work on gaitdisruptions in patients with neurological disease [2]; patientswith multiple sclerosis, for example, walk with reduced cadenceand stride length [9]. Velocity is a variable of gait that has beenfound to be influenced strongly by the onset of disease [27].Measuring the percentage of time during walking that the footis moving or stationary gives a measure of gait cycle timing.Variability in this timing correlates with severity of Parkinson’sdisease [1].

914 IEEE TRANSACTIONS ON INFORMATION TECHNOLOGY IN BIOMEDICINE, VOL. 14, NO. 4, JULY 2010
The results tabulated in Table V are consistent with previousstudies of gait. The control subject means for stride length andvelocity fall within the range found for controls using an alter-nate method of force-sensitive insoles [28], providing validationfor our system. However, force-sensitive insoles are unable toprovide information on the flight of the foot between whenthe foot leaves the ground and when the foot hits the groundagain. Similar to the case for rotation parameters, then, thereis no previous published data with which to validate the verti-cal z-direction displacement measurements obtained using oursystem, as presented in Table IV.
The visualization models (see Fig. 10) allow clinicians to seethe slight movements of the foot while walking that might oth-erwise not be apparent. For example, instead of giving a fixedpoint in time when the foot hits the ground, the algorithms pro-duce an animation over time of how exactly the foot moves asit makes contact with the ground. The models can be scaled toslow down or speed up motions in order to focus on particularrelevant portions of a step, such as how the foot makes con-tact with the ground. These details, which are what clinicianscurrently observe, are important in distinguishing between pa-tients and healthy controls. Our system is able to visualize andquantify these minutiae.
VI. CONCLUSION AND FUTURE WORK
The control subject results presented in this paper illustrate theability of our sensor and algorithms system to provide a detailedquantitative understanding of the movement of the foot whilewalking, an improvement over existing gait analysis systems.What is new and important in this paper is a presentation of the6-DOF (3-D angular displacement and 3-D absolute displace-ment) analysis from our system. The results of the differencesfound between young and aged subjects, and between data takenin the morning and afternoon, are supported by existing gait lit-erature. The results from our set of control subjects quantifyfeatures of gait currently used by clinicians to diagnose andevaluate neurological disease. The analysis was done both forsingle subjects to determine the values of gait parameters spe-cific to an individual, and over the cohort to develop a controlset of data with which diseased patients can be compared.
In the next step in our investigations, we can begin to decidewhether this system can be used to enhance the subjective judg-ments made by clinicians in evaluating patients. We are workingon integrating the data from the wrist and sternum sensors intothe analyses of the foot sensor data currently collected. A chal-lenge in doing so is aligning the data in space and time from thedifferent sensors to create a synchronized model.
Another challenge is in segmentation of the wrist and sternumsensor data, because while the foot comes to a stop every stepwhile walking, which allows for straightforward segmentationbased on whether the sensor is moving, the arm and upper bodyhave an additional rigid-body velocity (drift in the data) thatrapidly becomes overpowering through integration. Thus, thezupting technique cannot be directly utilized in the segmentationof the wrist and sternum sensor datasets. We are investigatingsegmentation within a moving reference frame relative to the
center of gravity (COG), and the COG relative to the foot, whichwill allow for analysis of the position and movement of the armand torso relative to the feet during walking.
Two variables of gait that may pose a challenge to analysisare the width of the base (distance between feet) during walkingand how a patient holds the arms. These variables require us tobe able to ascertain the position of the sensors relative to eachother. A possible solution to this issue is to have subjects startan experiment with their arms to their sides and feet together.Then, the data from consequent motions will give the numericalmeasures of a subject’s natural position while walking.
An additional application for our system is in physical activ-ity monitoring. We are currently working to obtain numericaldata on boys with Duchenne muscular dystrophy so as to char-acterize features such as the amount of mobile versus sedentarybehavior; the degree of activity, such as running versus walking;and the type of activity, including indoors versus outdoors ac-tivity. These characterizations may provide numerical measuresof drug efficacy in improving quality of life.
As we collect data from control subjects in order to performpattern recognition, data from patients with neurological diseaseare required to distinguish between healthy and ill. Examiningboth sets of data will lead to further robustness of feature ex-traction. An advantage of our algorithms is that they are fullyautomated to minimize the effort needed to perform many tests.The analyses that have been performed so far, and that havebeen described in this paper, show our system to be a viableway forward in attempting to quantify gait. We will continue todevelop the system by acquiring more data, analyzing it further,and refining our algorithms.
ACKNOWLEDGMENT
The authors thank L. Hutchings for his contributions to thisproject.
REFERENCES
[1] J. M. Hausdorff, M. E. Cudkowicz, R. Firtion, J. Y. Wei, and A. L.Goldberger, “Gait variability and basal ganglia disorders: Stride-to-stridevariations of gait cycle timing in Parkinson’s disease and Huntington’sdisease,” Movement Disord., vol. 13, no. 3, pp. 428–437, May 1998.
[2] M. E. Morris, R. Iansek, T. A. Matyas, and J. J. Summers, “The pathogen-esis of gait hypokinesia in Parkinson’s disease,” Brain, vol. 117, no. 5,pp. 1169–1181, 1994.
[3] M. E. Morris, R. Iansek, T. A. Matyas, and J. J. Summers, “Stride lengthregulation in Parkinson’s disease: Normalization strategies and underlyingmechanisms,” Brain, vol. 119, no. 2, pp. 551–568, 1996.
[4] M. E. Morris, C. Cantwell, L. Vowels, and K. Dodd, “Changes in gait andfatigue from morning to afternoon in people with multiple sclerosis,” J.Neurol. Neurosurg. Psychiatry, vol. 72, no. 3, pp. 361–365, 2005.
[5] P. Thoumie, D. Lamotte, S. Cantalloube, M. Faucher, and G. Amarenco,“Motor determinants of gait in 100 ambulatory patients with multiplesclerosis,” Multiple Sclerosis, vol. 11, no. 4, pp. 485–491, 2005.
[6] A. Peppe, C. Chiavalon, P. Pasqualetti, D. Crovato, and C. Caltagirone,“Does gait analysis quantify motor rehabilitation efficacy in Parkinson’sdisease patients?” Gait Posture, vol. 26, no. 3, pp. 452–462, 2007.
[7] L. Middleton, A. A. Buss, A. Bazin, and M. S. Nixon, “A floor sensorsystem for gait recognition,” in Proc. 4th IEEE Workshop Autom. Identi-fication Adv. Technol., 2005, pp. 171–176.
[8] T. Liikavainio, T. Bragge, M. Hakkarainen, J. Jervelin, P. Karjalainen,and J. Arokoski, “Reproducibility of loading measurements with skin-mounted accelerometers during walking,” Arch. Phys. Med. Rehabil.,vol. 88, no. 7, pp. 907–915, Jul. 2007.
TIEN et al.: RESULTS OF USING A WIRELESS INERTIAL MEASURING SYSTEM TO QUANTIFY GAIT MOTIONS IN CONTROL SUBJECTS 915
[9] M. G. Benedetti, R. Piperno, L. Simoncini, P. Bonato, A. Tonini, andS. Giannini, “Gait abnormalities in minimally impaired multiple sclerosispatients,” Multiple Sclerosis, vol. 5, no. 5, pp. 363–368, 1999.
[10] S. J. Morris and J. A. Paradiso, “A compact wearable sensor package forclinical gait monitoring,” Offspring, vol. 1, no. 1, pp. 7–15, Jan. 2003.
[11] S. J. Morris, “A shoe-integrated sensor system for wireless gait analysisand real-time therapeutic feedback,” Doctoral thesis, Massachusetts Inst.Technol., Cambridge, MA, Jun. 2004.
[12] A. M. Sabatini, C. Martelloni, S. Scapellato, and F. Cavallo, “Assessmentof walking features from foot inertial sensing,” IEEE Trans. Biomed.Eng., vol. 52, no. 3, pp. 486–494, Mar. 2005.
[13] B. Auvinet, G. Berrut, C. Touzard, L. Moutel, N. Collet, D. Chaleil,and E. Barrey, “Reference data for normal subjects obtained with anaccelerometric device,” Gait Posture, vol. 16, no. 2, pp. 124–134, Oct.2002.
[14] J. J. Kavanagh, S. Morrison, D. A. James, and R. Barrett, “Reliabilityof segmental accelerations measured using a new wireless gait analysissystem,” J. Biomech., vol. 39, no. 15, pp. 2863–2872, 2006.
[15] S. Lord, L. Rochester, K. Baker, and A. Nieuwboer, “Concurrent validityof accelerometry to measure gait in Parkinson’s disease,” Gait Posture,vol. 27, no. 2, pp. 357–359, Feb. 2008.
[16] I. P. Pappas, M. R. Popovic, T. Keller, V. Dietz, and M. Morari, “Areliable gait phase detection system,” IEEE Trans. Neural Syst. Rehabil.Eng., vol. 9, no. 2, pp. 113–125, Jun. 2001.
[17] W. Zijlstra, “Assessment of spatio-temporal parameters during uncon-strained walking,” Eur. J. Appl. Physiol., vol. 92, no. 1/2, pp. 39–44, Jun.2004.
[18] MicroStrain. (2007). 3DM-GX2 product datasheet [Online]. Available:http://www.microstrain.com/pdf/3dm-gx2_datasheet_v1.pdf (accessedJun. 25, 2008).
[19] Certificate of Calibration and Conformance. Model name: MicroStrainISD, model number: 3065-0006, serial number: 1032, firmware ver-sion: 116, technician: JTH, MicroStrain. (2008). [Online]. Available:http://www.microstrain.com
[20] L. Hutchings, “Rotational sensor system,” U.S. Patent 6 305 221, 2001.[21] L. Ojeda and J. Borenstein, “Non-GPS navigation with the personal dead-
reckoning system,” presented at the SPIE Defense Security Conf., Un-manned Syst. Technol. IX, Orlando, FL, Apr. 9–13, 2007.
[22] P. W. Kasameyer, L. Hutchings, M. F. Ellis, and R. Gross, “MEMS-basedINS tracking of personnel in a GPS-denied environment,” in Proc. IONGPS/GNSS, Long Beach, CA, Sep. 13–16, 2005, pp. 949–955.
[23] A. Gabell and U. S. Nayak, “The effect of age on variability in gait,” J.Gerontol., vol. 39, no. 6, pp. 662–666, 1984.
[24] H. G. Kang and J. B. Dingwell, “Separating the effects of age and walkingspeed on gait variability,” Gait Posture, vol. 27, no. 4, pp. 572–577, May2008.
[25] J. Mount and S. Dacko, “Effects of dorsiflexor endurance exercises on footdrop secondary to multiple sclerosis: A pilot study,” NeuroRehabilitation,vol. 21, no. 1, pp. 43–50, 2006.
[26] M. Nallegowda, U. Singh, G. Handa, M. Khanna, S. Wadhwa, S. L. Yadav,G. Kumar, and M. Behari, “Role of sensory output and muscle strength inmaintenance of balance, gait, and posture in Parkinson’s disease: A pilotstudy,” Amer. J. Phys. Med. Rehabil., vol. 83, no. 12, pp. 898–908, Dec.2004.
[27] L. Sudarsky, “Geriatrics: Gait disorders in the elderly,” New Engl. J.Med., vol. 322, no. 20, pp. 1441–1446, May 1990.
[28] R. Baltadjieva, N. Giladi, L. Gruendlinger, C. Peretz, and J. M. Hausdorff,“Marked alterations in the gait timing and rhythmicity of patients with denovo Parkinson’s disease,” Eur. J. Neurosci., vol. 24, no. 6, pp. 1815–1820, 2006.
Iris Tien received the B.S. degree in civil engineer-ing in 2007 from the University of California (UC),Berkeley, where she is currently working toward thePh.D. degree in civil systems engineering.
Since 2007, she has been a Researcher with theCenter for Information Technology Research in theInterest of Society (CITRIS), UC. Her current re-search interests include applying engineering to solvemedical problems. She is a recipient of the Chan-cellor’s Fellowship for Graduate Study from UC,Berkeley.
Ms. Tien is a National Science Foundation Graduate Research Fellow.
Steven D. Glaser received the B.A. degree in phi-losophy from Clark University, Worcester, MA, in1975, and the B.S., M.S., and Ph.D. degrees in civilengineering from the University of Texas, Austin, in1984, 1986, and 1990, respectively.
He graduated the apprentice training programof the International Union of Operating Engineersin 1977. He was a journeyman operating engi-neer/driller in the USA and Iraq for eight years. Hewas a Fulbright Scholar at the Technion, Israel. Since1996, he has been a Professor at the University of
California, Berkeley, where he is also the Intelligent Infrastructure ThemeLeader at the Center for Information Technology Research in the Interest of So-ciety. He is a Faculty Scientist with the Energy Resources Department, LawrenceBerkeley National Laboratory, Berkeley. He is also a Research Associate of IntelBerkeley Laboratory, Berkeley.
Prof. Glaser has been a member of the National Research Council (NRC)Report Committee, and a recipient of a National Science Foundation (NSF)Young Investigator Award. Since 1996, he has been a Research Engineer at theNational Institute of Standards and Technology.
Ruzena Bajcsy (M’81–SM’88–F’92) received theMaster’s and Ph.D. degrees in electrical engineer-ing from Slovak Technical University, Bratislava,Slovakia, in 1957 and 1967, respectively, and thePh.D. degree in computer science from Stanford Uni-versity, Stanford, CA, in 1972.
She was a Professor of computer science and engi-neering at the University of Pennsylvania until 1998.She was the Assistant Director of the Computer Infor-mation Science and Engineering (CISE) Directorate,National Science Foundation. In 2004, she became
the Director Emeritus at the Center for Information Technology Research in theInterest of Society (CITRIS), University of California (UC), Berkeley, wherehe is currently a Full-Time Professor of electrical engineering and computersciences.
Dr. Bajcsy is a member of the National Academy of Engineering, as well asthe Institute of Medicine.
Douglas S. Goodin, photograph and biography not available at the time ofpublication.
Michael J. Aminoff was born in U.K. He receivedthe M.D. and D.Sc. degrees from the University ofLondon, London, U.K.
In 1974, he joined the School of Medicine, Uni-versity of California, San Francisco (UCSF), SanFrancisco, where he has been a Professor of neu-rology since 1982, and is also the Director of theParkinson’s Disease Clinic and Research Center,where he is involved in a number of clinical trialsand physiological studies of patients with movementdisorders. He is the author or coauthor of more than
200 published medical or scientific articles, as well as the author or editor ofabout 27 books, many of which have gone into several editions, and of numerouschapters on topics related to neurology.