90148 Graphs 2006. Question 1 Use the grids to draw the graphs of:
35
90148 Graphs 2006
-
Upload
mae-charles -
Category
Documents
-
view
216 -
download
0
Transcript of 90148 Graphs 2006. Question 1 Use the grids to draw the graphs of:
90148
Graphs 2006

Question 1
• Use the grids to draw the graphs of:

y = 2x − 5

x = 4

y = (x − 2)(x + 4)
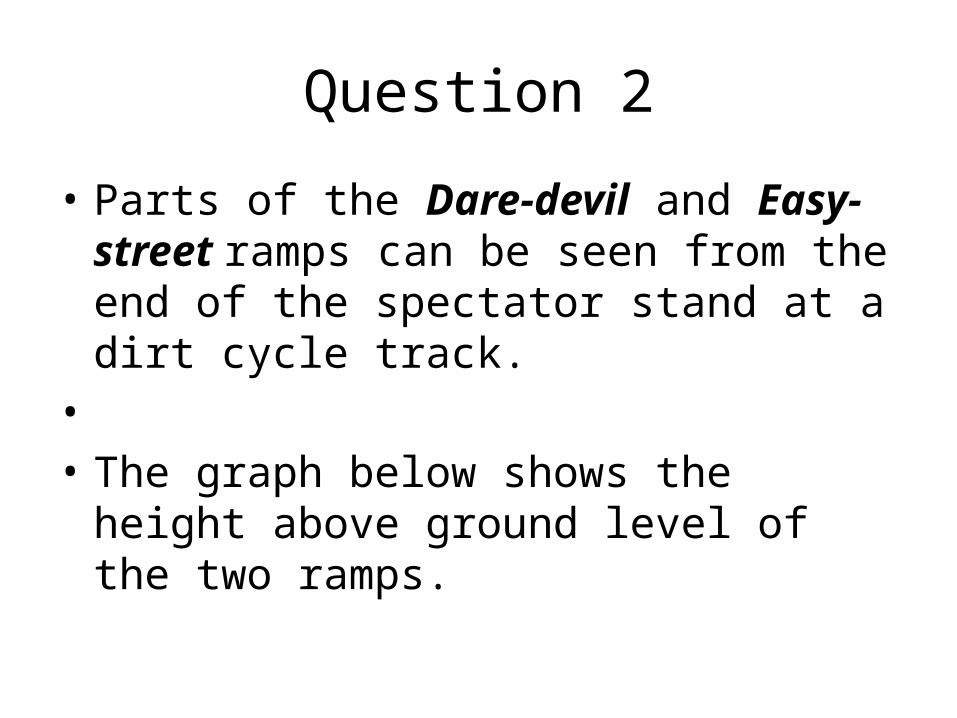
Question 2
• Parts of the Dare-devil and Easy-street ramps can be seen from the end of the spectator stand at a dirt cycle track.
• • The graph below shows the height above
ground level of the two ramps.

What is the height of the Dare-devil ramp at the end of the spectator stand?

What is the height of the Dare-devil ramp at the end of the spectator stand?
0.5m

What is the increase in height of the Easy-street ramp over the 15 m from the end of the spectator stand?

What is the increase in height of the Easy-street ramp over the 15 m from the end of the spectator stand?
0.5m for every 5 m1.5m for 15 m

At what distance, from the end of the spectator stand, are the two ramps the same height?

At what distance, from the end of the spectator stand, are the two ramps the same height?
5 m
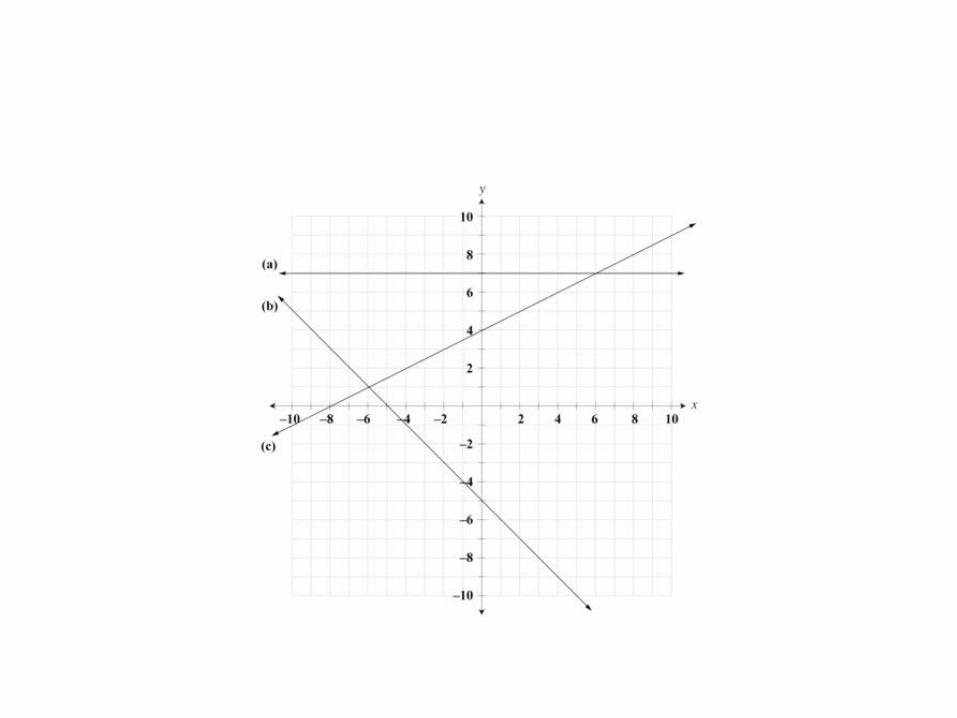
Question 3
• Write the equations of the lines drawn on the grid below:


Question 4
• Use the grids to draw the graphs of:

4y − 2x = 8

y = 3 − 2x − x2
= (1 − x)(3 + x)

y = x2 − 6x

Question 5
• Part of the dirt cycle track is shown on the graph below.
• The first section, AB, is a straight line and the second section, BCD, is part of a parabola.

The equation of the second section, BCD, isIt begins at B, a horizontal distance of 40 metres from the
start.
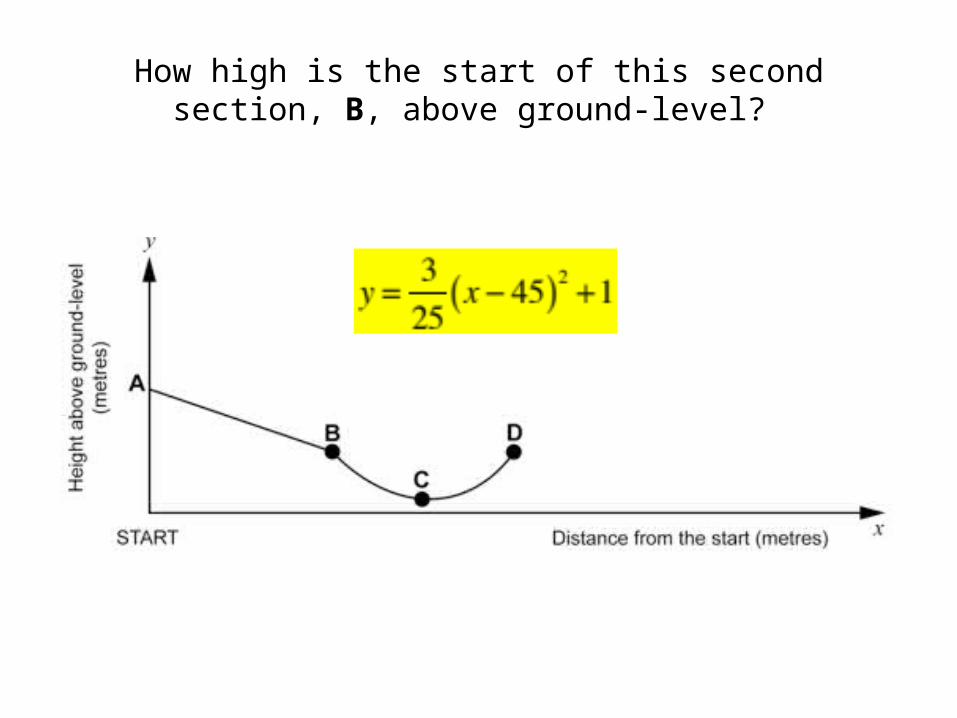
How high is the start of this second section, B, above ground-level?

Substitute in x = 40 gives y = 4

The point A is 6 metres above the ground.What is the gradient of the first section AB?

The point A is 6 metres above the ground.What is the gradient of the first section AB?

How high above ground-level is the lowest point, C?

How high above ground-level is the lowest point, C?
1 metre

• In the graph below, the dotted line DEF shows the path of a rider performing a jump.
• The rider leaves the track at D, jumps to maximum height at E, and lands on a platform at F.
• • This jump can also be modelled by a parabola. • • E is 8 metres above the ground and a horizontal
distance of 60 metres from the start.• • B and D are both the same height above the
ground.• • F is a horizontal distance of 72 metres from the
start.
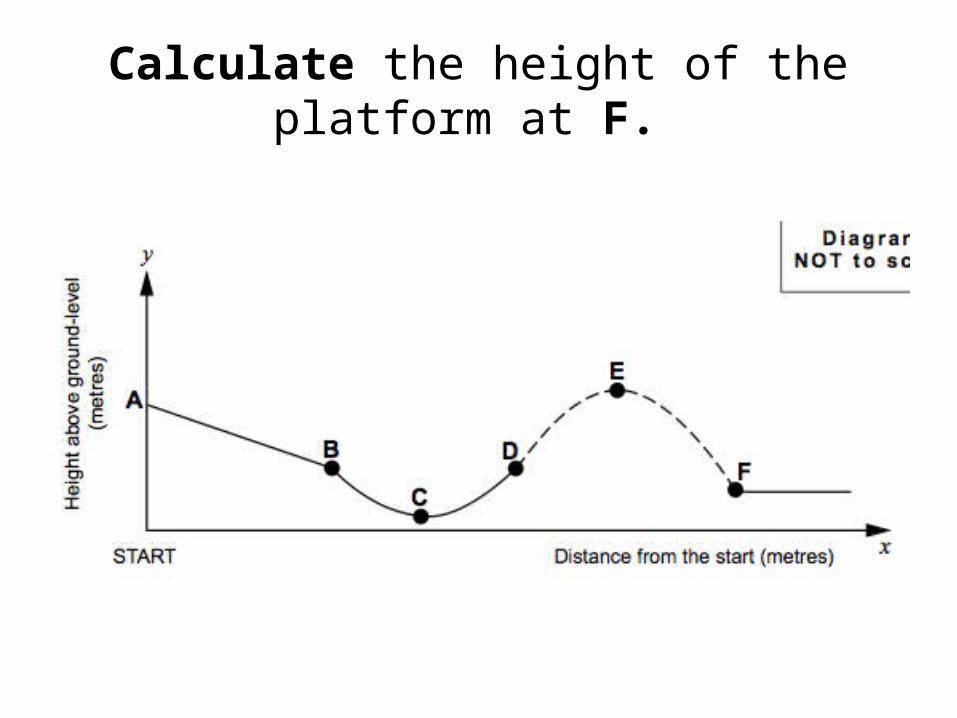
Calculate the height of the platform at F.

Calculate the height of the platform at F.

Point D (50, 4) lies on this parabola
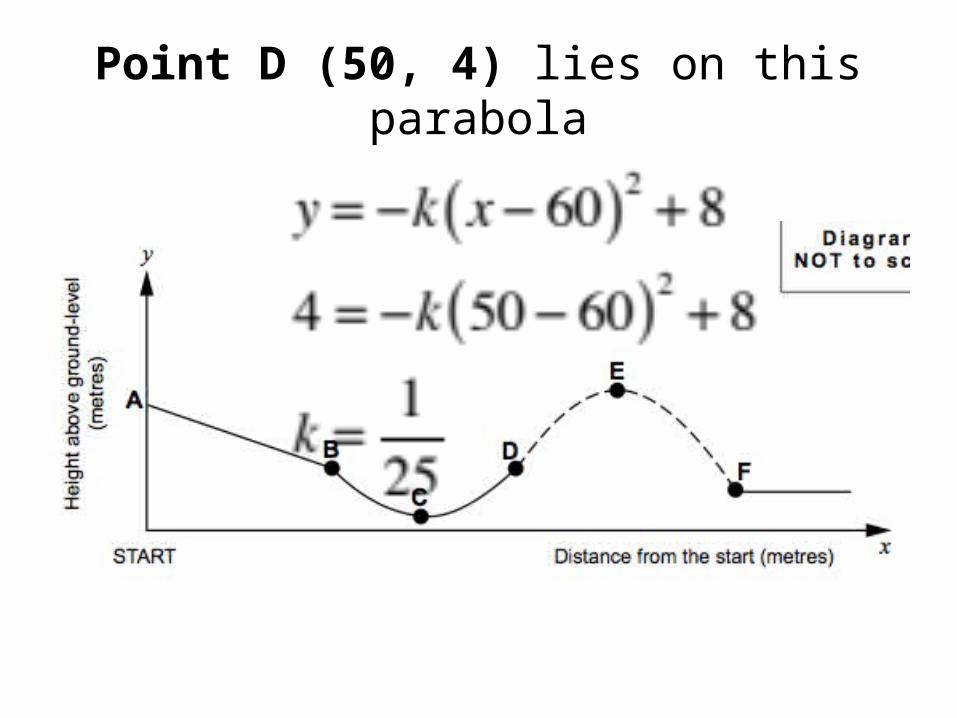
Point D (50, 4) lies on this parabola

Point D (50, 4) lies on this parabola