![INDEX []ART. NR. SW013 EAN 3838851360700 ART. NR. SW018 EAN 3838851360762 ART. NR. SW011 EAN 3838851360755 ART. NR. SW003 EAN 3838851360243 ART. NR. SW005 EAN 3838851360267 DISPLAY](https://static.fdocuments.us/doc/165x107/5f4984ad9c7ca71e5f7c2d5b/index-art-nr-sw013-ean-3838851360700-art-nr-sw018-ean-3838851360762-art.jpg)
90% Renewable by 2050 - Vermont...
34
90% Renewable by 2050: Exploring Vermont’s Efficiency & Renewable Energy Pathways Prepared for: Vermont Energy Investment Corporation and Energy Action Network December 2013 By: Leigh W. Seddon
Transcript of 90% Renewable by 2050 - Vermont...

90% Renewable by 2050:
Exploring Vermont’s Efficiency & Renewable Energy Pathways
Prepared for:
Vermont Energy Investment Corporation
and Energy Action Network
December 2013
By:
Leigh W. Seddon
Table of Contents
Page
Acknowledgements 1
EAN Energy Analysis Introduction 2
Vermont’s Renewable Energy Goal: 90% by 2050 3
Technology Adoption & Energy Milestones 4
Analysis of Key Pathways
Transport Sector 5
Thermal Sector 6
Electric Sector 7
Transformative Effects of Efficiency & Renewables
Transportation: Electric Vehicles 9
Thermal: Efficiency & Heat Pumps 10
Electricity: Distributed Renewable Generation 11
Achieving the First Milestone: 20% by 2020 12
Technical Appendix
EAN Model Methodology 15
The Energy/Sector Matrix 17
2010 Baseline Data by Sector & Class 18
Renewable Electric Technologies 22
2020 Milestone Energy Data by Sector 25
2030 Milestone Energy Data by Sector 26
2040 Milestone Energy Data by Sector 27
2050 Milestone Energy Data by Sector 28
Bibliography 29

EAN 2050 Energy Analysis p. 1
Acknowledgements
The author would like to acknowledge the financial support of the High Meadows Fund in making this report
possible. The High Meadows Fund has supported the energy analysis and modeling work that Energy Action
Network has undertaken since 2010. This continuing support has enabled on-going refinement and expansion of
the initial energy scenario model completed in 2011.
The author would also like to acknowledge the assistance that the Vermont Energy Investment Corporation
(VEIC) has provided. VEIC staff, with expertise in transportation, thermal efficiency, biomass fuels, and electrical
efficiency, have provided input and peer review for this report. The findings of the report and any errors and
omissions, however, are the sole responsibility of the author.
About Energy Action Network
In 2009, a diverse group of Vermonters came together to think about how to advance a transition to a
sustainable energy future. The result of this discussion and two years of work to understand and document
Vermont’s energy economy as a system lead to the founding of Energy Action Network (EAN). EAN is now a
powerful multi-stakeholder network that provides a forum for diverse organizations to align goals, develop
collaborative strategies, and facilitate collective learning. EAN’s goal is to end Vermont’s reliance on fossil fuels
and to create clean, affordable and secure electric, heating, and transportation systems for the 21st Century.

EAN 2050 Energy Analysis p. 2
EAN Energy Analysis Introduction
In 2011, Energy Action Network (EAN) developed a detailed energy accounting model to document Vermont’s
2010 energy use and then develop a scenario where 80% of Vermont’s 2030 energy needs could be met through
aggressive efficiency and renewable energy investments. The model looked at energy use broken out into three
energy sectors - transportation, thermal heating and cooling, and electricity use. These three sectors were
further broken into 3 classes - residential, commercial, and industrial end use.
The EAN scenario was intended to explore possible technology pathways that could lead Vermont to a
predominantly renewable energy economy. The purpose of creating a scenario was to identify key barriers and
opportunities inherent in the 80% renewable energy goal, offer a framework for discussion about energy
choices, and support and stimulate discussion of the 2011 Comprehensive Energy Plan (CEP) recommendations.
The EAN goal of “80% renewable by 2030” was adopted in 2010 before the CEP was written or released. In 2011,
the CEP was released and established the goal of sourcing 90 percent of the state’s total energy from renewable
resources by 2050. The CEP’s goal of meeting 90% of Vermont’s 2050 energy needs through renewable sources
is now the current framework for EAN’s energy modeling.
EAN’s model and scenario was specifically not intended to serve as a proscriptive or rigid “roadmap” but rather,
to frame core questions, examine critical assumptions and support public dialogue about Vermont’s future
energy mix. The model was developed with input and partnership from Vermont Energy Investment Corporation
(VEIC), Green Mountain Power (GMP), Biomass Energy Resource Center (BERC), Renewable Energy Vermont
(REV), Vermont Public Interest Research Group (VPIRG), and others.
In 2013, EAN launched a collaborative effort with University of Vermont’s Gund Institute for Ecological
Economics and state agencies partners to develop a dynamic energy simulation model for VT that built on
previous modeling efforts. This dynamic energy simulation model would be used to support implementation of
the CEP and its goal of meeting 90% of the state’s 2050 energy needs with renewable energy sources. The new
dynamic model will aid decision-makers in weighing energy choices and options, modeling costs and economic
implications, and providing a platform to track state-wide energy metrics over time.
With financial support from the High Meadows Fund and technical support from the Vermont Energy
Investment Corporation, EAN undertook to update its energy analysis and analyze key technology and policy
pathways that could lead to attaining the CEP’s goal of 90% renewable by 2050. This work was designed to
assist in the development and preparation of the more complex dynamic energy model. This report summarizes
the further development of the EAN model, discusses the key technology drivers that emerged as the essential
pathways toward a renewable energy economy, and gives an example of actions required to meet a first interim
milestone of 20% renewable by 2020.
For those interested in how energy statistics were gathered, what metrics were used to make comparisons
across different sectors and fuel types, and how the EAN energy model was constructed, a technical appendix is
included that covers these topics. This appendix also includes sector specific energy projections for EAN’s 2020,
2030, 2040, and 2050 milestones.

EAN 2050 Energy Analysis p. 3
Vermont’s Renewable Energy Goal: 90% by 2050
Vermont’s 2011 Comprehensive Energy Plan (CEP) established the goal of sourcing 90 percent of the state’s total
energy from renewable resources by 2050. This goal was set in response to both economic and environmental
needs, as well as legislative directives. Act 168 (2006) set the goal of achieving a 50 percent reduction in carbon
levels from a 1990 baseline by 2028 and a 75 percent reduction by 2050. Act 92 (2008) set the goal of producing
25% of total energy from in-state renewables by 2025, and providing 20% of total statewide electric retail sales
with SPEED Program (renewable) resources by 2017.
In 2012, the Legislature passed Act 170, The Vermont Energy Act of 2012. This Act requires the Public Service
Department (PSD) to start work on a Total Energy Study that explores the ramifications and pathways to getting
to the CEP goal of 90% renewable energy across all sectors by 2050. It also sets a 55% renewable electricity
target by 2017 and a 75% renewable electricity target by 2032.
EAN has been analyzing the CEP’s 90% by 2050 goal for several years and exploring technology pathways and
energy policies that would allow Vermont to achieve this goal. The first requirement was to understand where
Vermont stands currently in its renewable energy use across all sectors – transport, thermal heating and cooling,
and electrical demand.
A 2010 energy “baseline” was developed to document Vermont’s actual energy use and supply sources. At a
high-level aggregated view, the chart below shows energy use in each sector in TBTUs (1 trillion British Thermal
Units). In addition, it shows the 2010 amount that came from renewable resources (green) and the amount that
came from fossil or nuclear energy sources (grey). Hydro Quebec system power (HQ), which provides a
significant percentage of our electrical supply (32%), is included as a renewable resource.

EAN 2050 Energy Analysis p. 4
Technology Adoption & Energy Milestones
If Vermont’s renewable energy portion is just 12% today, can we reach the goal of 90% by 2050, and if so, what
might that look like? Vermont’s progress toward 90% renewable energy will likely follow a “sigmoid” or S-curve
that is typical of technological and social change in a society.
Adoption curves start off rising rapidly as new technology or ways of behaving (which exist but have been
overlooked by the marketplace) are quickly adopted by consumers for both economic and social reasons.
Halfway through a transition, adoption is still growing rapidly but the rate of change is starting to slow as
fundamental structural barriers (economic, technical, and social) present themselves and take time to resolve.
Finally, at the end stages of a transition, growth slows dramatically due to diminishing economic returns and
social benefits of achieving the last few percent of the transition.
To further define what the adoption curve for 90% by 2050 might look like, EAN devised a series of decade
milestones that could illustrate a snap shot of where we might be in 2020, 2030, and 2040 as we approach 90%
renewable in 2050. These milestones are not meant to be a “roadmap”, but rather to identify the known
technology pathways, key policy drivers, and most important questions for policy makers to consider.
A very important insight gained during the creation of these decade milestones was the importance of balancing
the transition across the three sectors of transportation, thermal heating and cooling, and electrical generation.
For example, additional renewable electricity does not have much impact until it can be used to power electric
vehicles or thermal heat pumps. The rate of adoption of certain technologies, such as electric vehicles, will really
be the “gatekeepers” as Vermont moves towards a renewable energy future.

EAN 2050 Energy Analysis p. 5
Analysis of Key Pathways
To identify and quantify the energy changes necessary to reach these milestones, EAN analyzed a series of
potential technology pathways and policy options that could change Vermont’s renewable energy percentage.
These relate either to conservation and efficiency efforts or to the development of specific renewable energy
sources. From this analysis, policies or resources emerged that are clearly the most important elements of a
renewable energy transition. While Vermont should not discount any potential pathway or policy to implement
the goals of the CEP, focusing initial attention on “key pathways” makes sense to kick-start implementation and
do so in a highly leveraged way.
The tables below list technology or policy pathways for each sector that were considered by EAN. They are
classified as either low (< 3%), medium (4-10%), or high (>10%) impact based on their relative effect on
increasing Vermont’s total renewable energy percentage over the 2010 baseline.
Table 1. Transportation Sector
Pathway Impact
1. 1. Electric Vehicles/Plug-in Hybrid Vehicles (EV/PHEV) EV/PHEVs currently account for less than 1/10 of 1% of VT’s vehicle fleet. But EV adoption is growing at about 50% per year. The EAN scenario assumes that 70% of VT’s Light Vehicle Fleet are EVs or PHEVs by 2050 and powered by renewable electricity and biofuels.
High
2. Corporate Average Fuel Economy (CAFE) Standards 2025 national fuel economy standards set an increase of fleet-wide average efficiency (for that year’s models) to 54.5 mpg, a doubling of 2010 efficiency standards. This will have an impact on VT’s fleet efficiency that is dependent on the rate of new car purchases. The EAN scenario assumes these standards will result in a 20% fuel reduction for VT’s entire Light Vehicle Fleet by 2030 and a 40% reduction by 2050.
Med
3. Light Vehicle Biofuel Access to liquid biofuels (other than ethanol) for the light vehicle fleet will be important to achieving the CEP’s goals. While pilot efforts to produce biodiesel on VT farms have been successful, limited available agricultural land area may keep in-state production of biofuels under 10M gal/year versus the 50M gals/year needed for hybrids and internal combustion engine (ICE) vehicles in 2050.
Med
4. Vehicle Miles Traveled (VMT) Reduction Vermonters traveled approximately 7,250 million miles in 2010. While VMT increased 10% from 2000 to 2010, for the last few years it has remained constant. Promotion of telecommuting, downtown development, and smart growth settlement patterns in the next few decades could result in VMT reduction for first time in VT’s history. The EAN scenario assumes that a 10% reduction in VMT is possible by 2050.
Low
5. Light Vehicle Fleet (LVF) Reduction In 2010, there were approximately 550,000 light vehicles registered in VT. Increased public transport and carpooling options could result in fewer vehicles. EAN assumes that LVF numbers will remain largely unchanged from 2010 to 2050 as additional vehicles needed to support VT’s population growth (0.5% per year) and economic growth are offset by alternative transport modes.
Low
6. Heavy Duty Fleet (HDF) Fuel Standards Current HD truck fuel efficiency standards will decrease 2017 model year fuel consumption by up to 20% over 2010 standards. In 2010, there were approximately 22,000 heavy duty trucks (diesel) registered in VT. Since energy consumption of trucks accounted for less than 10% of VT’s 2010 transportation energy use, these fuel efficiency improvements will have limited overall impact on the CEP’s 2050 goal, but will help eliminate 25% or more of this sub-sector’s energy use over time.
Low
7. Heavy Duty Vehicle Biofuel While energy consumption of trucks accounts for less than 10% of VT’s transportation energy use, introduction and use of biofuels in this sub-sector is important because a significant portion of the HD fleet will continue to use internal combustion engines rather than electric power. The EAN scenario assumes that 80% of the HD fleet is run on biofuels by 2050, and that biofuels will be less expensive than petro fuels.
Med
8. Aviation Biofuel Aviation fuel accounts for 2.5% of energy use in VT’s transportation sector. Aviation bio-fuels are already being tested under FAA approval. While EAN assumes biofuel penetration will reach 50% by 2050, the overall impact on CEP goals is negligible due to the small energy footprint of this sub-sector.
Low

EAN 2050 Energy Analysis p. 6
Table 2. Thermal Sector
Pathway Impact
1. Building Energy Efficiency VT has approximately 300,000 residential buildings and 50,000 commercial ones. The thermal heating and cooling load from these buildings accounts for over 25% of VT’s total energy demand (all sectors). Experts at Efficiency Vermont estimate that 30% of this energy could be saved by comprehensive retrofits of 300,000 of these buildings. EAN’s scenario assumes efficiency efforts are ramped up quickly in the near term resulting in 15% sector reduction by 2030 and then reaching 30% reduction by 2050.
High
2. Building Heat Pumps In 2010, 70% of the heating energy for VT buildings was supplied by fuel oil and propane. Ground source and cold-weather air source heat pumps can offset the majority of this energy with customer savings of 30-40% over today’s price of these fossil fuels. EAN’s scenario assumes heat pumps powered by renewable electricity will supply 25% of the thermal energy demand in VT buildings by 2050.
Med
3. Building Biomass Heat In 2010, wood biomass supplied about 12% of residential and commercial heat loads. Given the relatively low and stable price of biomass fuels, its local availability, and its use as a backup fuel, the EAN scenario assumes that building energy supplied by biomass (cord wood and pellets) will more than double (135%) over 2010 levels by 2050.
Med
4. Industrial/District Biomass Heat In 2010, BERC’s Fuel Wood Supply Model analysis indicated a harvesting potential in VT for an additional 900,000 tons of low-grade fuel wood per year above what is currently used under its “moderate” scenario. If the 10 surrounding counties in MA, NH, and NY are also included, this figure grows to over 3M tons per year. This limited resource base and the complex relationship of biomass combustion to the State’s GHG emission targets, leads EAN to conclude that only a limited number of highly efficient thermal biomass plants (including ORC combined heat & power plants) should be built to reserve forest resources for thermal heating. EAN’s scenario assumes that commercial building and industrial process heat supplied by large scale biomass plants will more than double by 2050 over 2010 levels, supplying approximately 40% of commercial building and industrial process heat.
Med
5. Liquid Biofuels for Heating As noted above, while VT’s potential to make biofuels is limited both by land availability and short growing season, availability of biofuels nationally made from both cellulosic and algal feed stocks is growing rapidly. U.S. renewable fuel standards currently call for a production capacity of 36 billion gallons per year by 2022. These same transportation fuels can be used to replace #2 fuel oil. The EAN scenario assumes that 30% of the heat demand in the thermal sector is meet by liquid biofuels in 2050.
Med
6. Solar Thermal Systems (Heat & AC) Active solar thermal systems are cost-effective today for supplying domestic hot water, radiant heating systems, and low-temperature process heat for industrial applications. By 2030, high temperature solar thermal systems should be available to power air conditioning. EAN’s scenario assumes 12% of the thermal sector’s energy demand will be met by solar thermal in 2050. This assumption may be conservative given technology improvements that are on the horizon and the potential volatility of fossil fuel prices.
Low

EAN 2050 Energy Analysis p. 7
Table 3. Electrical Sector
Pathway Impact
1. VT Photovoltaic (PV) Generation In 2013, PV generation in VT accounted for approximately 1% of electrical end-use GWH load (32 MW installed capacity). However, its growth is outpacing all other renewable technologies and this will likely continue and accelerate due to rapidly declining costs, ease of permitting, and minimal resource constraints. The EAN scenario assumes that in-state PV generation will grow to 1,000 MW by 2050. At a capacity factor of 15%, this will produce 18% of VT’s end-use electricity in 2050.
High
2. VT Wind Generation VT currently has 120 MW of installed wind capacity (2013). 98% of this wind capacity is located four utility-scale projects that account for over 99% of wind energy produced in state on a GWH basis. Utility-scale wind plants currently have the lowest levelized life-cycle energy cost (about $.09/kwh in 2012 dollars) of non-combustion renewable generators, but face considerable permitting barriers. The EAN scenario assumes that an additional 200 MW of wind will be built by 2050, supplying 12% of our end-use electricity.
Med
3. VT Biomass Generation VT currently has two conventional steam-cycle biomass plants (72 MW total capacity), which consume 750,000 tons of wood and sawmill residues annually. Biomass generation potential is constrained in VT, both by limited forest resources that can be sustainable harvested and also by the emerging recognition that biomass fuels should be used primarily for thermal heating. New combined heat and power (CHP) technologies using Organic Rankine Cycle (ORC) technology have the promise to efficiently supply industrial or municipal-scale heat with ancillary electrical generation. Typically constructed in the 1 to 4 MW range, these plants can operate at 70% to 80% combined thermal and electrical efficiency. The EAN scenario assumes that 150 MW of ORC CHP will be built by 2050, supplying 30 MW of electricity or 6% of our total electrical demand.
Low
4. VT Small Hydro Generation Small-scale hydro also has limited growth potential in VT as documented in the PSD 2007 study The Undeveloped Hydro Potential of Vermont. The report identified over 93 MW of undeveloped hydroelectric capacity at 332 existing dams. Given the requirements of the Clean Water Act and the difficult and lengthy FERC permitting process, it is likely only a fraction of this potential will ever be developed. The EAN scenario assumes that an additional 30 MW of run of the river hydro will be developed (capacity factor = 40%), bringing VT’s total capacity to 173 MW in 2050, supplying 7% of VT’s end-use electricity.
Low
5. HQ Power Imports Hydro Quebec power imports currently supply approximately 35% of VT’s electrical energy on a GHW basis (2011). HQ generation consists predominantly (98%) of large hydro and wind facilities and is classified as renewable by the State of Vermont. HQ imports are also “firm” system power, providing VT with a “dispatchable” renewable base load resource to supplement intermittent generation from wind and solar farms. The EAN scenario assumes our current contract for 400 MW remains in place and is extended under a new contract to 2050. Under this scenario, assuming HQ’s current capacity factor of 50%, HQ imports will supply 22% of our end-use electricity in 2050.
High
6. Regional RE Market Imports In 2011, VT utilities relied on New England market power for about 12% of our electricity. The majority of this power comes from natural gas generators. The EAN scenario sees an important role for purchases of renewable regional market power, and phasing out purchases on non-renewable market power. In the six New England states, wind power is growing rapidly. In 2013, there was approximately 700 MW of installed capacity, up from 2 MW in 2005. 2,000 MW of additional wind capacity were in ISO-NE interconnection queue as of April 2013. The EAN scenario assumes that 200 MW of regional wind (at a capacity factor of 32%) is added by 2050. This will account for 8% of VT’s end-use electricity.
Med
7. Electrical Efficiency For the period 2010-2012, Efficiency Vermont was able to save 1.8% of VT’s total electrical energy annually through investments in end-use appliance efficiency. The EAN scenario assumes this level of annual efficiency improvement will continue, using a nominal 1.5% annual efficiency savings factor. By 2050, this will have resulted in 25% electrical energy savings over the 2010 baseline use.
Med
8. Transmission & Distribution Efficiency Given the increase in in-state distributed generation, the EAN analysis assumes there will be a 15% decrease in transmission and distribution losses by 2050, lowering the current T&D loss factor of 6.7% to 5.7% of end use. Smart Grid improvements could lower loss factors further, but were not considered in the EAN analysis.
Low

EAN 2050 Energy Analysis p. 8
Based on this key pathway analysis and consideration of commercialization “roadmap” projections (DOE, NREL,
USDA) for technologies such as solar, wind, and biofuels, EAN developed a series of renewable energy and
efficiency implementation curves that would eventually move VT to 90% renewable by 2050. This analysis was
based on decade milestones, starting in 2020, that set targets for the introduction and adoption of key policies
and resources.
EAN’s pathway analysis was not guided by an econometric model or dynamic energy model, but relies on
current knowledge about the potential for efficiency, new electric technologies, and renewable energy
resources to enter the marketplace over time and displace non-renewable fossil and nuclear fuels. EAN has
launched a collaborative effort with the University of Vermont’s Gund Institute for Ecological Economics and
state partners to develop a dynamic energy simulation model for VT. When this model becomes operational in
2014, it will be used to test out the assumptions and effects in the current EAN non-dynamic “accounting”
model.
EAN’s initial analysis, however, clearly shows that there are certain key technologies and pathways to achieving
the CEP’s 2050 goal. These are shown in the graph below which documents the relative impact of each on
reducing fossil fuel use.
0
2
4
6
8
10
12
14
16
18
20
EV/PHEV TransportBiofuels
CAFE & HDStandards
BuildingEfficiency
Building HeatPumps
BuildingBiomass Heat
DistributedPV*
VT & MarketWind*
HQ SystemPower*
Trill
ion
BTU
(TB
TU)
Fossil Fuel Displacement by Key Pathways
2010 2020 2030 2040 2050
* Offsets NG generation at a 2.69 source energy factor
Transportation Thermal Electricity

EAN 2050 Energy Analysis p. 9
Transformative Effects of Combining Efficiency with Renewables
Investments in transportation, thermal, and electrical efficiency have been and will remain our lowest cost
resource for meeting the goals of the CEP. Efficiency investments deliver a triple “bottom line” return of reduced
energy use, reduced capital investment and operating cost, and reduced environmental impact of energy
production and use.
Efficiency needs to be considered in a much broader context than the traditional focus on more efficient
appliances and thermal insulation for our buildings. When the synergistic effects of increased electrification
through renewables and efficiency improvements are considered together, each sector will experience profound
transformation in terms of the efficiency of energy use, the cost of energy services, and the impact of energy
production and consumption on natural resources. Below are three examples from EAN’s energy model.
Transportation: Electric Vehicles
Electric (EV) and plug-in hybrid (PHEV) vehicles offer the promise of greatly reduced energy use and operating
cost per vehicle mile. This is true today (2013) and will become more so as EV/PHEV vehicle capital costs decline
rapidly in the next decade. By transitioning 70% of our automobiles (known as the Light Vehicle Fleet, or LVF) to
EV and PHEV vehicles run on renewable fuels, Vermonters could save $500M annually at today’s gasoline prices
and cut LVF greenhouse gas emissions to less than a third of 2010 levels.
Assumptions:
5,500 M vehicle miles driven annually in 2010 (UVM TRC). Remains unchanged to 2050.
Electricity cost = $.15/ kWh (2010 VT average)
All EVs powered with renewable electricity. EVs require 3 kWh/mile (UVM TRC) = $.052/mile in 2010.
VT 2010 fleet fuel cost = $.20/mile (based on $1.1B for 5,500M miles in 2010, UVM TRC)
Fuel costs held constant in 2010 nominal dollars.

EAN 2050 Energy Analysis p. 10
Thermal: Efficiency & Heat Pumps
Vermonters spend over $625 M every year on oil, propane, and natural gas to heat residential and commercial
buildings. Most of this money leaves the state to pay for extracting, refining, and transporting these fuels to VT
and is lost to our state and local economy. Efficiency Vermont estimates it is possible to save at least one-third
of this energy if 85% of Vermont’s 350,000 homes and businesses receive building audits and cost-effective
efficiency retrofits. Achieving an average of 30% heating load reduction in 300,000 buildings would save
Vermonters $200 M a year at today’s fuel prices, giving Vermont’s economy a profound boost.
Electric heat pump (HP) technology has progressed rapidly in the last decade, and cold climate air source heat
pumps (ASHP) are now available that can efficiently supply up to 75% of a building’s heat load and do so at a
40% savings over the current price of oil. If heat pumps are run with electricity from renewable sources, then
75% of the building’s heat has become renewable and greenhouse gas (GHG) emissions have been cut by 75%.
The chart below shows the impact of combining a statewide efficiency program that reaches 300,000 homes by
2050 (with 30% average savings) and heat pump retrofits of 60,000 buildings (20% penetration rate). At today’s
fuel and electricity cost, this would save Vermonters $260 M per year when fully implemented. It would also cut
GHG emissions by over 40% from current levels.
$625 M in heating cost in 2010 for residential & commercial purchases of oil, LPG, and NG (EIA)
Efficiency retrofits have average energy reduction of 30%. Individual building range = 20% to 50%. (VEIC)
Heat pumps are cold climate air-source units that provide 75% of annual building load.
ASHP save 40% of energy cost with electricity at $.146/kWh, oil at $3.99/gal and LPG at $2.99/gal (Letendre)

EAN 2050 Energy Analysis p. 11
Electricity: Distributed Renewable Generation
Revamping our existing electric grid through investments in renewable distributed generation (DG) offers the
promise of zero-emission electricity, greatly reduced source fuel losses associated with nuclear and fossil fuel
generators, and reduced transmission and distribution losses. EAN’s analysis of Vermont’s 2010 electric sector
determined that 49% of the energy consumption in this sector is waste, thermal losses at generating plants
(44%) and losses in the transmission system (5%). Renewable generators such as solar, wind, and hydro facilities
have no source losses because they do not consume fuel.
Transitioning our electric system to rely predominantly on these renewable sources of power is the foundation
of achieving 90% by 2050. Not only will it allow for electrification of transportation and a portion of our heating
needs, but it is the single most important element to reduce waste in our overall energy system and reduce GHG
emissions. EAN’s 90% by 2050 scenario shows that despite increasing our end-use electrical consumption by
45% in 2050 to power transportation and thermal sectors, the electrical sector overall source energy
consumption will actually decrease over 20% because of new more efficient renewable generation that has no
source energy losses.
The chart below shows the impact of transitioning Vermont’s electric system to over 90% renewable generation
by 2050. While the state’s electric system today is approaching 30% renewable (counting Hydro Quebec), in
2010 Vermont’s reliance on nuclear energy (VT Yankee) and natural gas market power contributed to large
source energy losses and made the electric sector 80% non-renewable.

EAN 2050 Energy Analysis p. 12
Achieving the First Milestone: 20% by 2020
For the 2020 milestone, EAN set a target goal of 20% renewable energy use across all sectors. Given available
technology, Vermont’s current energy programs, and where the state should be on the transformation S-curve,
achieving 20% (roughly a 2/3 increase of our 2010 renewable percentage) appears achievable and cost-effective.
To illustrate the actions that might allow Vermont to reach this goal, EAN has compiled a list of targets from our
key pathway analysis.
Transport Sector
Electric vehicles: increase to 5% of light vehicle fleet
• Requires adding 28,000 EVs and PHEVs
Biofuels: increase by an additional 3% of liquid fuels for light vehicle fleet
• Requires an additional 10 M gallons biofuels annually
Increase vehicle fleet efficiency by 5%
• Requires support of CAFE & HD standards by encouraging new efficient vehicle purchases
Thermal Sector
Efficiency: Reduce building heat loses by 5%
• Requires retrofitting 50,000 buildings with 30% average energy savings
Biomass: increase by additional 7% of building sector heat load
• Requires installation of 20,000 new pellet stoves or boilers
Provide 2% building heat & hot water through solar thermal systems
• Requires installation of 3,000 residential-scale (10 sq. m) SHW systems
Biomass Combined Heat & Power (CHP)
• Requires building 60 MW of highest‐efficiency combined heat and power plants, providing 50
MW thermal and 10 MW electric generation
Electric Sector
Hydro Electric: Build or refurbish 5 MW small‐scale hydro capacity at existing dam sites
o Requires active support of Agency of Natural Resources to streamline permitting
Solar Energy: Build 100 MW new PV capacity (50 “Solar Farms”)
o Requires setting enhanced goals for the Standard Offer Program
Wind Power: Build 30 MW new in‐state capacity and contract for 50 MW regional wind capacity
o Requires siting guidelines and permit process reform
As the above list indicates, getting from 2010’s 12% renewable to a 2020 goal of 20% is a large undertaking.
Making headway in the transport sector stands out as the greatest challenge because of the current “immature”
state of both the electric vehicle and biofuels industry. That said, national and state studies confirm that electric
and hybrid vehicles have a significant cost benefit advantage over ICE vehicles even at today’s early stage of
development. Removing market barriers including consumer awareness, public charging infrastructure, and
availability of the vehicles are the key policies that will kick start EV adoption and bring large benefits to both
individual consumers and the state’s overall economy. The adoption rate of EV/PHEV automobiles is the primary
gate-keeper on how fast Vermont can move toward a renewable economy. It is also important to understand
that accelerating early stage adoption plays out for decades in significantly higher penetration rates as we
approach 2050. Drive Electric Vermont (DEV) is the statewide entity engaged in promoting the adoption of EVs
and eliminating barriers to their rapid adoption (www.driveelectricvermont.com). Support for this stakeholder

EAN 2050 Energy Analysis p. 13
group, comprised of state agencies, utilities, regional and municipal planners, and NGOs, is critical to increasing
EV adoption rates.
In the thermal sector, Vermont is a leader in both efficiency and biomass technologies. It also can boast of
having some of the world’s leading efficiency and biomass practitioners and businesses. However, without new
business models to overcome market barriers and increase annual penetration rates, these low-cost, proven
energy resources will continue to be underutilized. Efficiency Vermont, for all its success, is retrofitting less
than half the number of housing units annually that are necessary to reach the legislative efficiency goals set in
the Vermont Energy Efficiency and Affordability Act of 2008. The recommendations laid out in the 2013 Thermal
Efficiency Task Force Report to the Legislature provide a clear set of policy recommendations to get back on
track. The report calls for a $27M annual increase in the state’s current efficiency program budget. Given that
this additional public investment will leverage an additional $38M in private investment and provide an overall
return of $6M for every $1M of public funds invested, finding a source of funds for this public investment is the
near-term priority for the thermal sector.
The electric sector is currently over 25% renewable, in large part due to our 400 MW system power contract
with Hydro Quebec. Solar photovoltaics (PV) is Vermont’s fastest growing distributed generation (DG)
technology, though its current installed capacity is only 20% of Vermont’s installed wind capacity. On an end-use
electrical supply basis (GWHs), PV’s contribution is only one-tenth of that of wind due to its lower capacity factor
(15% versus 32%). Despite this small installed base and lower capacity factor, the rapidly declining technology
costs of PV and its minimal resource constraints mean that solar PV is poised to rapidly expand in VT. Two key
policies drivers will determine how fast PV generation grows in VT. A third policy issue, the handling of
Renewable Energy Credits (RECs) will determine whether distributed generation, such as PV, can contribute to
our renewable energy goals:
1. Revised targets need to be set for Vermont’s SPEED Program along with an expansion of the Standard
Offer Program. The Standard Offer program (offering 25-year levelized price contracts for qualifying PV
facilities of 2.2 MW or less) has been instrumental in the development of community-scale solar in VT and
reducing the cost per kWh of PV. The current 5 MW annual Legislative cap on the Standard Offer program
needs to be revisited in light of market changes and the state’s energy, economic, and climate goals.
2. Solar net metering installations are now approaching 20 MW of installed capacity, most of this installed in
just the past few years. Several of VT’s smaller utilities have now hit the 4% statutory cap on net metering
and have ceased to allow new, customer-owned, net metered generation to connect to their distribution
systems. A statutory cap on net metering is unnecessary if utility rate structures and billing practices are
revised to reflect the true added system benefits and costs associated with each type of net metering
generation. The Department of Public Service should update its 2012 study of the benefits and costs of
net metering to reflect current research and also initiate a PSB docket to explore alternative rate
structures. It is important to note that the federal 30% investment tax credit for solar energy is due to
expire at the end of 2016, providing a 3-year window where VT can take advantage of below market cost
installations. PSD and PSB efforts to resolve the longer term structural net metering issues should not
interfere or substitute for prompt legislative action on the 4% statutory cap.
3. Retirement of Renewable Energy Credits (RECs). RECs, generated by SPEED Program facilities, are currently
being sold by Vermont into the New England market. Since RECs embody the renewable energy attributes
(such as carbon reduction) of renewable generation, their sale means that technically and legally the
entire output of the SPEED program (832 GWH or 15% of retail electric sales in 2012) cannot be counted
as renewable. While REC sales have lowered the price of building distributed generation in VT, this
practice is incompatible with the state’s CEP goals, its climate goals, and furthering renewables in the

EAN 2050 Energy Analysis p. 14
region. CT recently closed its market to VT RECs and the remainder of New England states will likely follow
suit. Between now and 2020, VT can phase in the retirement of RECs with the goal of having all SPEED
program RECs retired and off the market by 2020.
EAN 2050 Energy Analysis p. 15
Technical Appendix
EAN Model Methodology
In order to determine the current and future mix of energy resources and the level of achievement in meeting
renewable energy targets, an accounting framework was set up to tally the renewable and non-renewable
portions of Vermont’s energy supply mix. The goal was to provide a consistent and transparent framework,
accurately account for all fuel types, and to rely on existing data from published, reliable sources. All energy use
data was converted into British Thermal Units (BTU) to allow numerical and percentage comparison between
fuels and sectors. The standard model unit is Trillion BTUs (TBTU). This can easily be converted to gigawatt-hours
(GWH) for a “metric model” by dividing TBTUs by .003412.
EAN chose to start with a 2010 energy baseline compiled primarily from data published by the U.S. Energy
Information Agency (EIA). This data was doubled checked against reports from Vermont’s Public Service
Department (PSD), Public Service Board (PSB), and UVM’s Transportation Research center (TRC). Small
differences were noted in the 2010 baseline, especially in the transportation sector. None of these differences
were large enough to effect the general conclusions of the scenario analysis.
An “accounting” energy model was then developed using the same matrix of fuel sources and energy sectors, so
that the 2010 baseline and future years could be compared side by side. The renewable energy fraction of the
model in 2050 was set to 90% to reflect the goals of the state’s Comprehensive Energy Plan (CEP). To reach this
90% goal, different technologies pathways, levels of energy efficiency and penetration of renewable resources
were iteratively tried and vetted. The model makes no claim to representing an “optimum resource” case, rather
it shows how based on existing commercialized technologies, VT could achieve 90% renewable energy supply by
2050.
The CEP goal of “90% renewable” has been interpreted by EAN members to mean that 90% of the total energy
use in 2050 will come from renewable resources. Promoting energy conservation and investing in efficiency
were included as key elements to achieving this renewable energy goal. While this seems straightforward,
several accounting questions arise:
1. What is meant by total energy? Is it just VT’s end-use energy, i.e. energy that is used by the residential,
commercial, and industrial sectors? Or is it Vermont’s total energy “footprint” that would include energy
used in the processing, transportation, and transformation of the energy sources used in VT?
2. How should energy efficiency and conservation be accounted for? Is efficiency an “energy source” that
should be tallied just like renewable energy resources and count toward the state’s renewable energy
goals? Or do efficiency and conservation reduce our energy demand, making it easier to meet our energy
needs with renewables, but should not be counted as part of the renewable energy goal?
To resolve the first question, EAN has adopted the methodology of using “source energy” data. Source energy
factors for liquid or solid fuels include the pre-combustion effects, which is the energy associated with
extracting, processing, and delivering the primary fuels to the point of conversion in an electrical power plants
or directly in buildings. For electricity, source energy factors additionally account for the conversion
inefficiencies at the power plant and the transmission and distribution losses from the power plant to the
building.
While use of source energy factors necessarily includes assumptions and generalizations about the production of
fuels and electricity, these factors are now well documented and available based on regional inputs, such as for
the Northeast U.S. More importantly, use of a “source” energy framework rather than an “end-use” energy

EAN 2050 Energy Analysis p. 16
framework is the only accurate and honest way to judge how “renewable” VT’s energy economy is or will
become. Even though EAN’s model focuses on energy use within VT’s political borders, the State’s energy
footprint is regional and global in extent. As an example, to supply 1 unit of electricity to Vermont from a natural
gas power plant in Massachusetts requires the combustion of approximately 3 units of natural gas. We need to
count the 3 units of “source” energy if we want to account for all fossil/nuclear fuels required to support VT’s
energy demand. Using source energy is also important if we want to be able to understand the impact and full
benefit of an energy transition to renewables that includes distributed generation and more localized energy
sources.
For EAN’s work, we relied on the publication, Source Energy and Emission Factors for Energy Use in Buildings, M.
Deru and P. Torcellini, National Renewable Energy Laboratory Report NREL/TP-550-38617, Revised June 2007.
These source energy factors were applied to EIA end-use data to provide greater transparency and avoid
potential double counting that could occur using EIA’s “primary energy” data. For renewable energy sources
that rely on the combustion or transformation of renewable fuels, such as ethanol, biodiesel, and biomass heat
and electricity, we relied on information found in specific “energy balance” studies for these fuels. For
renewables that do not consume a fuel, such as photovoltaic and wind energy, we assumed a unity source
energy factor.
One of the interesting issues that arise when using “source energy” accounting is how to treat source energy
losses for renewable fuels. Should these losses (for instance the 70% energy lost when generating electricity
from biomass with a conventional steam cycle turbine) be counted as adding to the percentage of renewable
energy use in Vermont? The logical disconnect of having wasteful energy transformation processes support our
progress toward our renewable energy goals argues for treating these losses as a separate category. For the
purposes of the EAN model, renewable source energy inefficiencies are documented and accounted for in total
energy use, but are excluded from the calculation of overall state percentage of renewable energy use.
To answer the second question about accounting for efficiency, EAN chose not to treat it as an energy “source”
that bolsters the renewable energy fraction. This would have required creating a hypothetical “business as
usual” 2050 energy scenario to which increased amounts of efficiency are applied and counted. Rather EAN
chose to apply all efficiency and conservation as demand reduction measures that lowered the amount of future
energy use. Aggressive building energy retrofits, national vehicle CAFE standards, improved efficiency of the
electric grid, etc., were all considered, analyzed, and assigned a demand reduction factor. These demand
reduction factors are applied to the 2010 baseline to produce new future energy “baselines” that renewable
energy options could then be applied. This framework helps simplify the model complexity and improve
transparency, but it does result in a “higher bar” than models that treat efficiency improvements as adding to
the percentage “renewable”.

EAN 2050 Energy Analysis p. 17
The Energy/Sector Matrix
The model creates a matrix of energy sources and end-use sectors.
The energy source categories are:
Energy Source Description/ EIA Code Source Energy Factor
Distillate Fuel Oil Distillate fuel oil total end-use consumption Transport and Thermal sectors, (DFTXB)
1.158
Gasoline Transport sector only (MMTCB) 1.187
Jet Fuel Aviation fuel (JFXTB) 1.205
Other Oils Residual fuel oil total end-use consumption. (RFTXB), Lubricants (LUTCB)
1.191
Natural Gas Natural Gas (thermal sector only) (NGCCB, NGICB, NGRCB). NG transport sector from UVM data
1.092
Propane (LPG) LPG total end-use consumption. (LGTXB) 1.151
Nuclear Nuclear electricity (PSB/utility data used) 3.075
Non-Renewable Market Power
ISO-NE market power (mostly NG generation) 2.629
Biomass - electric Wood for electric generation (PSB/utility data) 3.333
Biomass- thermal Wood for thermal heat (WDCCB, WDCIB, WBCRB) 1.096
Biofuels Liquid biodiesel and fuel oil, bio-gas (no EIA data) 1.150
Ethanol Fuel ethanol consumed by transport sector. (EMACB) 1.700
Hydro Hydro electricity (PSB/utility data used) 1.000
Solar Photovoltaic electricity and solar thermal heat. (SOTCB) PSB data used to calculate electric portion.
1.000
Wind Wind electricity (WYTCB) 1.000
Renewable Market Power
ISO-NE market power that is renewable 1.000
RE Losses Generation losses from renewable combustion generation
n/a
Non-RE Losses Generation losses from non-renewable generation n/a
The total energy use from a particular source is equal to the “end-use consumption” multiplied by the source
energy factor. Because electric generation losses from combustion or nuclear sources are so large (typically 2.5
to 3x end-use consumption), two separate energy categories were included to track losses for renewable and
non-renewable generation. This allows greater transparency about the overall effect on Vermont’s energy
intensity and energy footprint if a greater portion of our electricity is derived from non-combustion technologies
such as photovoltaics, wind, and hydro-power.
To account for population change and its impact on energy use, the model incorporates population estimates
based on Vermont and Federal estimates. The analysis assumes VT’s population and energy consumption
growth is 0.6% per year through 2020, 0.4% per year through 2030. 0.2% per year from 2030 to 2050.
EAN 2050 Energy Analysis p. 18
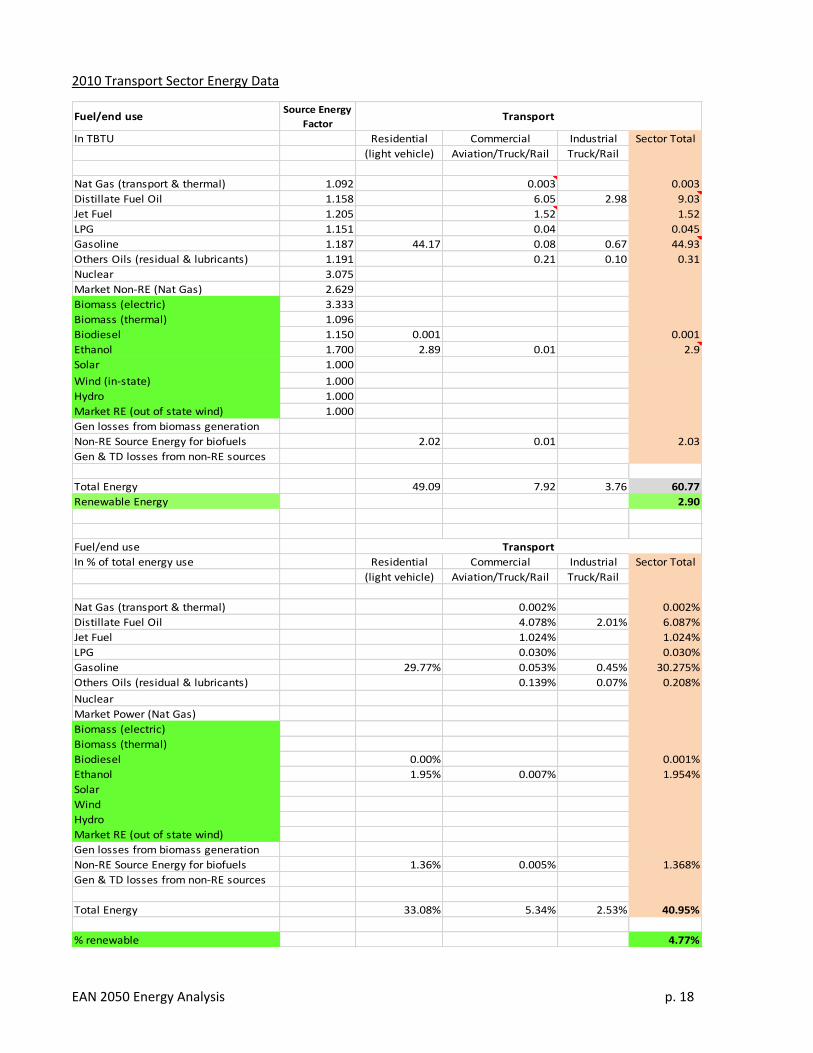
2010 Transport Sector Energy Data
Fuel/end use Source Energy
Factor
In TBTU Residential Commercial Industrial Sector Total
(light vehicle) Aviation/Truck/Rail Truck/Rail
Nat Gas (transport & thermal) 1.092 0.003 0.003
Distillate Fuel Oil 1.158 6.05 2.98 9.03
Jet Fuel 1.205 1.52 1.52
LPG 1.151 0.04 0.045
Gasoline 1.187 44.17 0.08 0.67 44.93
Others Oils (residual & lubricants) 1.191 0.21 0.10 0.31
Nuclear 3.075
Market Non-RE (Nat Gas) 2.629
Biomass (electric) 3.333
Biomass (thermal) 1.096
Biodiesel 1.150 0.001 0.001
Ethanol 1.700 2.89 0.01 2.9
Solar 1.000
Wind (in-state) 1.000
Hydro 1.000
Market RE (out of state wind) 1.000
Gen losses from biomass generation
Non-RE Source Energy for biofuels 2.02 0.01 2.03
Gen & TD losses from non-RE sources
Total Energy 49.09 7.92 3.76 60.77
Renewable Energy 2.90
Fuel/end use
In % of total energy use Residential Commercial Industrial Sector Total
(light vehicle) Aviation/Truck/Rail Truck/Rail
Nat Gas (transport & thermal) 0.002% 0.002%
Distillate Fuel Oil 4.078% 2.01% 6.087%
Jet Fuel 1.024% 1.024%
LPG 0.030% 0.030%
Gasoline 29.77% 0.053% 0.45% 30.275%
Others Oils (residual & lubricants) 0.139% 0.07% 0.208%
Nuclear
Market Power (Nat Gas)
Biomass (electric)
Biomass (thermal)
Biodiesel 0.00% 0.001%
Ethanol 1.95% 0.007% 1.954%
Solar
Wind
Hydro
Market RE (out of state wind)
Gen losses from biomass generation
Non-RE Source Energy for biofuels 1.36% 0.005% 1.368%
Gen & TD losses from non-RE sources
Total Energy 33.08% 5.34% 2.53% 40.95%
% renewable 4.77%
Transport
Transport

EAN 2050 Energy Analysis p. 19
2010 Thermal Sector Energy Data
Fuel/end use Source Energy
Factor
In TBTU
Nat Gas (transport & thermal) 1.092
Distillate Fuel Oil 1.158
Jet Fuel 1.205
LPG 1.151
Gasoline 1.187
Others Oils (residual & lubricants) 1.191
Nuclear 3.075
Market Non-RE (Nat Gas) 2.629
Biomass (electric) 3.333
Biomass (thermal) 1.096
Biodiesel 1.150
Ethanol 1.700
Solar 1.000
Wind (in-state) 1.000
Hydro 1.000
Market RE (out of state wind) 1.000
Gen losses from biomass generation
Non-RE Source Energy for biofuels
Gen & TD losses from non-RE sources
Total Energy
Renewable Energy
Fuel/end use
In % of total energy use
Nat Gas (transport & thermal)
Distillate Fuel Oil
Jet Fuel
LPG
Gasoline
Others Oils (residual & lubricants)
Nuclear
Market Power (Nat Gas)
Biomass (electric)
Biomass (thermal)
Biodiesel
Ethanol
Solar
Wind
Hydro
Market RE (out of state wind)
Gen losses from biomass generation
Non-RE Source Energy for biofuels
Gen & TD losses from non-RE sources
Total Energy
% renewable
Residential Commercial Industrial Sector Total
3.39 2.62 3.20 9.21
11.63 4.63 3.78 20.05
6.82 3.25 0.26 10.33
0.53 0.88 1.41
3.84 0.64 1.27 5.75
0.15 0.15
0.37 0.06 0.12 0.55
26.19 11.75 9.52 47.45
5.90
Residential Commercial Industrial Sector Total
2.28% 1.77% 2.16% 6.20%
7.84% 3.12% 2.55% 13.51%
4.59% 2.19% 0.18% 6.96%
0.36% 0.59% 0.95%
2.59% 0.43% 0.86% 3.88%
0.10% 0.10%
0.25% 0.04% 0.08% 0.37%
17.65% 7.92% 6.41% 31.98%
12.44%
Thermal Energy
Thermal Heat

EAN 2050 Energy Analysis p. 20
2010 Electric Sector Energy Data
Fuel/end use Source Energy
Factor
In TBTU
Nat Gas (transport & thermal) 1.092
Distillate Fuel Oil 1.158
Jet Fuel 1.205
LPG 1.151
Gasoline 1.187
Others Oils (residual & lubricants) 1.191
Nuclear 3.075
Market Non-RE (Nat Gas) 2.629
Biomass (electric) 3.333
Biomass (thermal) 1.096
Biodiesel 1.150
Ethanol 1.700
Solar 1.000
Wind (in-state) 1.000
Hydro 1.000
Market RE (out of state wind) 1.000
Gen losses from biomass generation
Non-RE Source Energy for biofuels
Gen & TD losses from non-RE sources
Total Energy
Renewable Energy
Fuel/end use
In % of total energy use
Nat Gas (transport & thermal)
Distillate Fuel Oil
Jet Fuel
LPG
Gasoline
Others Oils (residual & lubricants)
Nuclear
Market Power (Nat Gas)
Biomass (electric)
Biomass (thermal)
Biodiesel
Ethanol
Solar
Wind
Hydro
Market RE (out of state wind)
Gen losses from biomass generation
Non-RE Source Energy for biofuels
Gen & TD losses from non-RE sources
Total Energy
% renewable
Residential Commercial Industrial Sector Total
0.20 0.19 0.13 0.52
2.76 2.61 1.80 7.17
0.79 0.75 0.51 2.05
0.41 0.39 0.27 1.06
0.05 0.05
0.02 0.02 0.01 0.04
2.72 2.57 1.77 7.05
0.04 0.03 0.02 0.095
0.95 0.90 0.62 2.48
7.57 7.16 4.94 19.66
15.50 14.61 10.07 40.18
8.30
Residential Commercial Industrial Sector Total
0.14% 0.13% 0.09% 0.35%
1.86% 1.76% 1.21% 4.83%
0.53% 0.50% 0.35% 1.38%
0.28% 0.26% 0.18% 0.72%
0.03% 0.03%
0.01% 0.01% 0.01% 0.03%
1.83% 1.73% 1.19% 4.75%
0.02% 0.02% 0.02% 0.06%
0.64% 0.61% 0.42% 1.67%
5.10% 4.82% 3.33% 13.25%
10.44% 9.84% 6.79% 27.08%
20.66%
Electricity
Electricity

EAN 2050 Energy Analysis p. 21
2010 Total Energy Data
Fuel/end use Source Energy
Factor
In TBTU
Nat Gas (transport & thermal) 1.092
Distillate Fuel Oil 1.158
Jet Fuel 1.205
LPG 1.151
Gasoline 1.187
Others Oils (residual & lubricants) 1.191
Nuclear 3.075
Market Non-RE (Nat Gas) 2.629
Biomass (electric) 3.333
Biomass (thermal) 1.096
Biodiesel 1.150
Ethanol 1.700
Solar 1.000
Wind (in-state) 1.000
Hydro 1.000
Market RE (out of state wind) 1.000
Gen losses from biomass generation
Non-RE Source Energy for biofuels
Gen & TD losses from non-RE sources
Total Energy
Renewable Energy
Fuel/end use
In % of total energy use
Nat Gas (transport & thermal)
Distillate Fuel Oil
Jet Fuel
LPG
Gasoline
Others Oils (residual & lubricants)
Nuclear
Market Power (Nat Gas)
Biomass (electric)
Biomass (thermal)
Biodiesel
Ethanol
Solar
Wind
Hydro
Market RE (out of state wind)
Gen losses from biomass generation
Non-RE Source Energy for biofuels
Gen & TD losses from non-RE sources
Total Energy
% renewable
Total Energy
Residential Commercial Industrial Total TBTU
3.39 2.62 3.20 9.21
11.63 10.69 6.76 29.08
1.52 1.52
6.82 3.30 0.26 10.38
44.17 0.08 0.67 44.93
0.20 0.93 1.11 2.24
2.76 2.61 1.80 7.17
0.79 0.75 0.51 2.05
0.41 0.39 0.27 1.06
3.84 0.64 1.27 5.75
0.00 0.00
2.89 0.01 2.90
0.20 0.20
0.02 0.02 0.01 0.04
2.72 2.57 1.77 7.05
0.04 0.03 0.02 0.09
0.95 0.90 0.62 2.48
2.39 0.07 0.12 2.58
7.57 7.16 4.94 19.66
90.78 34.27 23.35 148.40
13.76
Total Energy
Residential Commercial Industrial Total %
2.28% 1.77% 2.16% 6.20%
7.84% 7.20% 4.56% 19.60%
1.02% 1.02%
4.59% 2.22% 0.18% 6.99%
29.77% 0.05% 0.45% 30.28%
0.14% 0.63% 0.75% 1.51%
1.86% 1.76% 1.21% 4.83%
0.53% 0.50% 0.35% 1.38%
0.28% 0.26% 0.18% 0.72%
2.59% 0.43% 0.86% 3.88%
0.00% 0.00%
1.95% 0.01% 1.95%
0.13% 0.13%
0.01% 0.01% 0.01% 0.03%
1.83% 1.73% 1.19% 4.75%
0.02% 0.02% 0.02% 0.06%
0.64% 0.61% 0.42% 1.67%
1.61% 0.05% 0.08% 1.74%
5.10% 4.82% 3.33% 13.25%
61.17% 23.10% 15.73% 100.00%
11.53%
Total
Total
EAN 2050 Energy Analysis p. 22
Renewable Electric Technologies
In 2010, VT’s electrical sector was approximately 20% renewable when analyzed on the basis of utility power
contracts and with source energy losses included. The majority of this renewable power (68%) is from Hydro-
Quebec. The remainder comes from in-state hydro (16%), biomass (13%), wind (2%), solar PV (1%), and
farm/landfill methane (1%).
EAN’s analysis assumes that by 2050, the electrical sector will have to be over 90% renewable and that end-use
consumption in VT will have to increase by approximately 45% to achieve the renewable electrification goals
necessary in the transport and thermal sectors. Based on current energy price forecasts and research reports
about renewable technologies and their projected cost curves, the EAN analysis identifies the following
generation technologies and sources as having the greatest likelihood of supplying this increased energy:
A. Photovoltaics
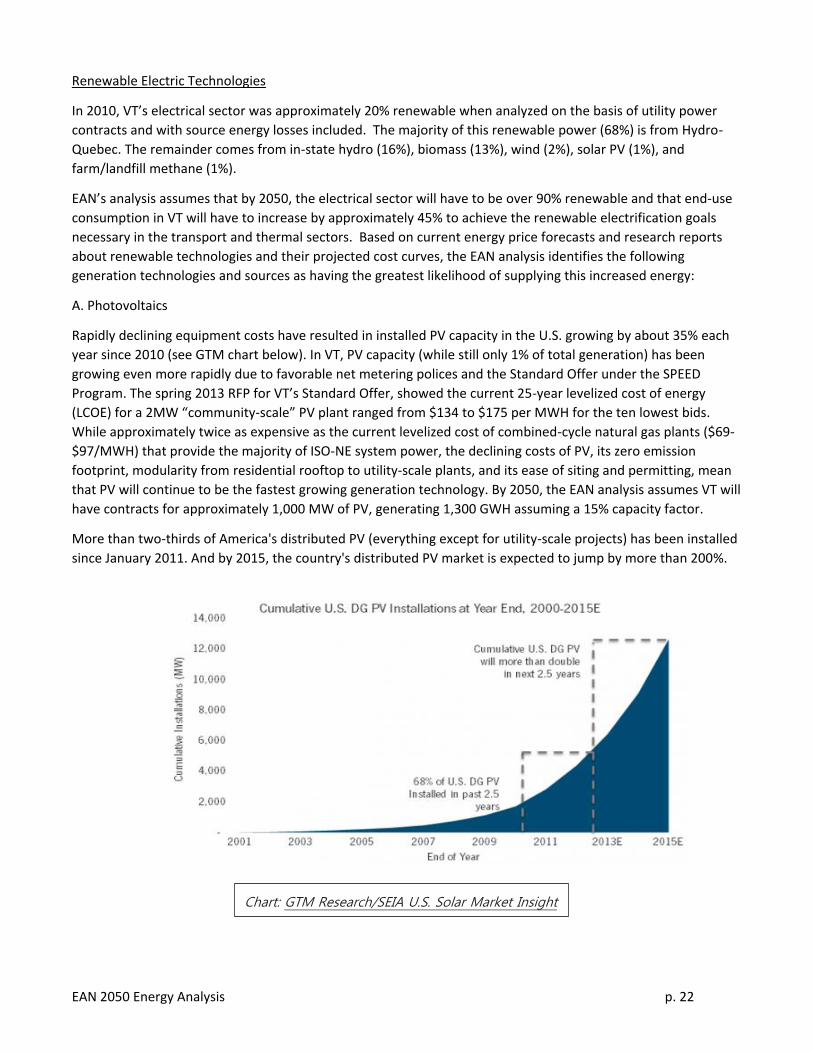
Rapidly declining equipment costs have resulted in installed PV capacity in the U.S. growing by about 35% each
year since 2010 (see GTM chart below). In VT, PV capacity (while still only 1% of total generation) has been
growing even more rapidly due to favorable net metering polices and the Standard Offer under the SPEED
Program. The spring 2013 RFP for VT’s Standard Offer, showed the current 25-year levelized cost of energy
(LCOE) for a 2MW “community-scale” PV plant ranged from $134 to $175 per MWH for the ten lowest bids.
While approximately twice as expensive as the current levelized cost of combined-cycle natural gas plants ($69-
$97/MWH) that provide the majority of ISO-NE system power, the declining costs of PV, its zero emission
footprint, modularity from residential rooftop to utility-scale plants, and its ease of siting and permitting, mean
that PV will continue to be the fastest growing generation technology. By 2050, the EAN analysis assumes VT will
have contracts for approximately 1,000 MW of PV, generating 1,300 GWH assuming a 15% capacity factor.
More than two-thirds of America's distributed PV (everything except for utility-scale projects) has been installed
since January 2011. And by 2015, the country's distributed PV market is expected to jump by more than 200%.
Chart: GTM Research/SEIA U.S. Solar Market Insight

EAN 2050 Energy Analysis p. 23
B. Wind
Aside from traditional hydro-electric generation, utility-scale wind is currently the lowest cost renewable
generation source in New England. Currently, VT has 4 utility-scale operating wind farms – Kingdom Community
Wind (Lowell, 63 MW), Sheffield (40 MW), Georgia Mountain (10MW), and Searsburg (6 MW). In addition, VT
utilities have contracts with other New England wind farms. In total, wind supplies approximately 550 GWH or
about 9% of VT’s end-use electrical demand.
The current 25-year levelized cost for wind plants in the 100 MW range is approximately $85/MWH. Smaller
plants, such as Kingdom Community Wind, have a LCOE in the $95/MWh range. Given that the LCOE of a 100
MW wind farm is currently just about 10% higher than a combined cycle NG plant, and that wind is on a
declining cost curve as opposed to an escalating one for NG, it is expected that the majority of new renewable
market power in New England for at least the next decade will come from wind.
While small-scale wind systems (<100 kW) continue to be installed in VT, declining net metered installations and
zero installation in the Standard Offer program are evidence of the market and regulatory hurdles facing this
technology. In the absence of a declining cost curve for small-scale wind technology (as is the case with PV), it is
likely that small wind will play an insignificant role in renewable electrification.
The EAN analysis assumes that by 2050 VT will have 520 MW of wind power capacity, or an additional 400 MW
over 2013 levels. 200 MW might come from in-state wind farms and 200 MW from larger regional farms that VT
utilities contract with. At a capacity factor of 33%, this 520 MW will supply approximately 1,500 GWH or about
20% of VT’s 2050 projected total electrical end-use energy.
C. Biomass Combined Heat & Power (CHP)
Biomass electric generation potential is constrained in VT, both by limited forest resources that can be
sustainable harvested and also by the emerging recognition that our biomass fuel resources should be used
primarily for thermal heating. EAN assumes that efficiency standards will be set for all new biomass generation,
similar to standards currently in place for biomass projects in the Standard Offer program. (See Biomass Energy
Development Working Group Final Report, January 2012).
VT currently has two conventional steam-cycle biomass plants (McNeil, 50 MW and Ryegate, 22MW) which
together consume 750,000 tons of wood annually. These traditional steam-cycle generating plants are less than
30% efficient. Without add-on thermal cogeneration equipment, 70% of the biomass resource used to fuel these
plants is wasted. For reasons of resource efficiency, market economics, and environmental impact, EAN believes
this type of traditional steam cycle technology will not and should not be built in the future. The EAN analysis
assumes both McNeil and Ryegate will continue to operate in the future, but notes that large efficiency gains
could be achieved by retrofitting McNeil for thermal cogeneration and supplying Burlington, UVM, or the
Fletcher Allen Hospital with heat.
The 2010 Wood Fuel Supply Update (BERC, 2010) estimates that under a “moderate” harvesting scenario there
are approximately an additional 900,000 green tons of available low-grade wood fuel supply in VT. The EAN
scenario assumes that any future biomass generation will be supplied by small combined heat and power (CHP)
plants that are primarily thermal plants with ancillary generators that convert up to 20% of the plant’s capacity
as electrical generation. Organic Rankine Cycle (ORC) plants, operating at over 80% combined thermal and
electrical efficiency, have been used in Europe for years and will likely be the technology of choice for small-
scale distributed biomass generation in Vermont. While new combined heat and power (CHP) technologies have
the promise to efficiently supply industrial or municipal-scale heat with ancillary electrical generation (typically

EAN 2050 Energy Analysis p. 24
in the less than one MW range), this technology has not entered the U.S. market due to our low thermal and
electrical energy costs.
An intriguing idea is that ORC plants could be combined with wood pellet production to produce both pellets
and renewable electricity. The chart below is typical of ORC plant size in Europe, though it should be noted that
modular ORC units can be ganged together to provide multi-MW scale plants if desired.
D. Small Hydro Generation
Small-scale hydro also has limited growth potential in VT as documented in the PSD 2007 study The
Undeveloped Hydro Potential of Vermont (Barg, L.). The author’s analysis identified over 93 MW of undeveloped
hydroelectric capacity at 332 existing dams. Given the requirements of the Clean Water Act and the difficult and
lengthy FERC permitting process, it is likely only a fraction of this potential, perhaps 50 MW, will ever be
developed. Current installation costs for small (<500 kW) run-of-river hydro retrofits are in the $2,500/kW
range, exclusive of permitting. At sites where permitting costs are low, net metered hydro generation using
Vermont’s Group Net Metering (GNM) rules is currently cost-effective.
The EAN analysis assumes that 30 MW of additional small hydro capacity will be developed by 2050 at existing
dam sites.
Chart & figures courtesy of PRODESA, Zaragoza, Spain

EAN 2050 Energy Analysis p. 25
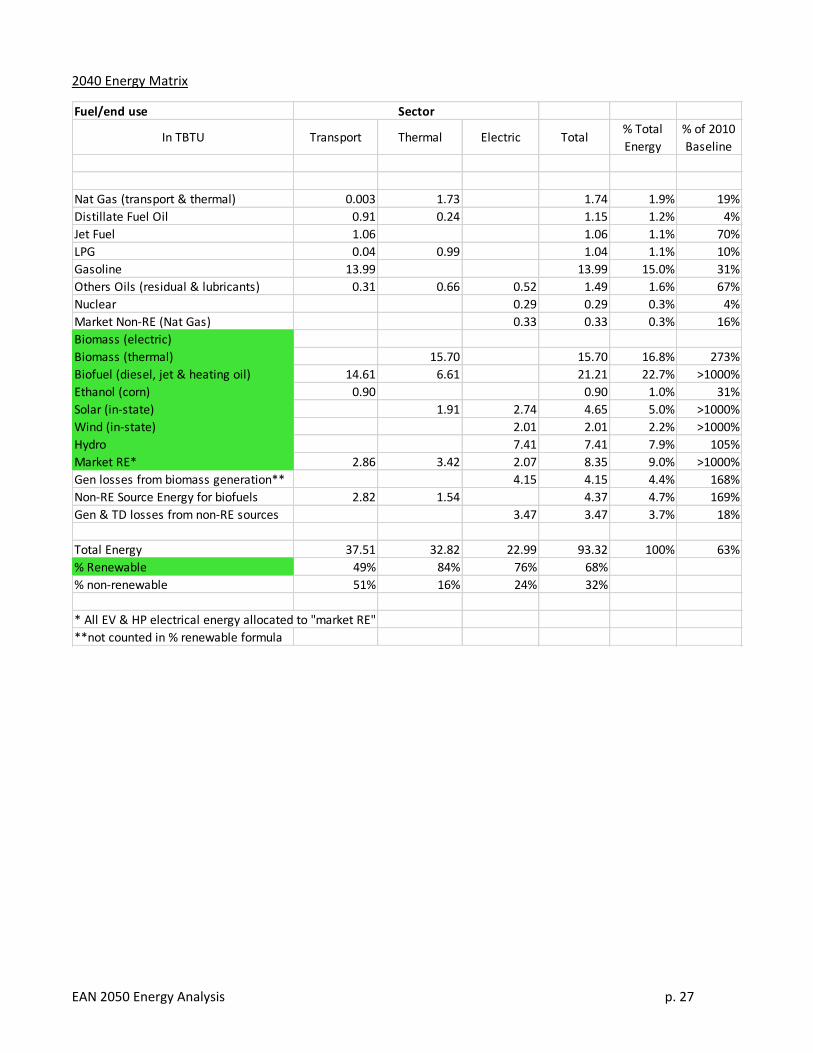
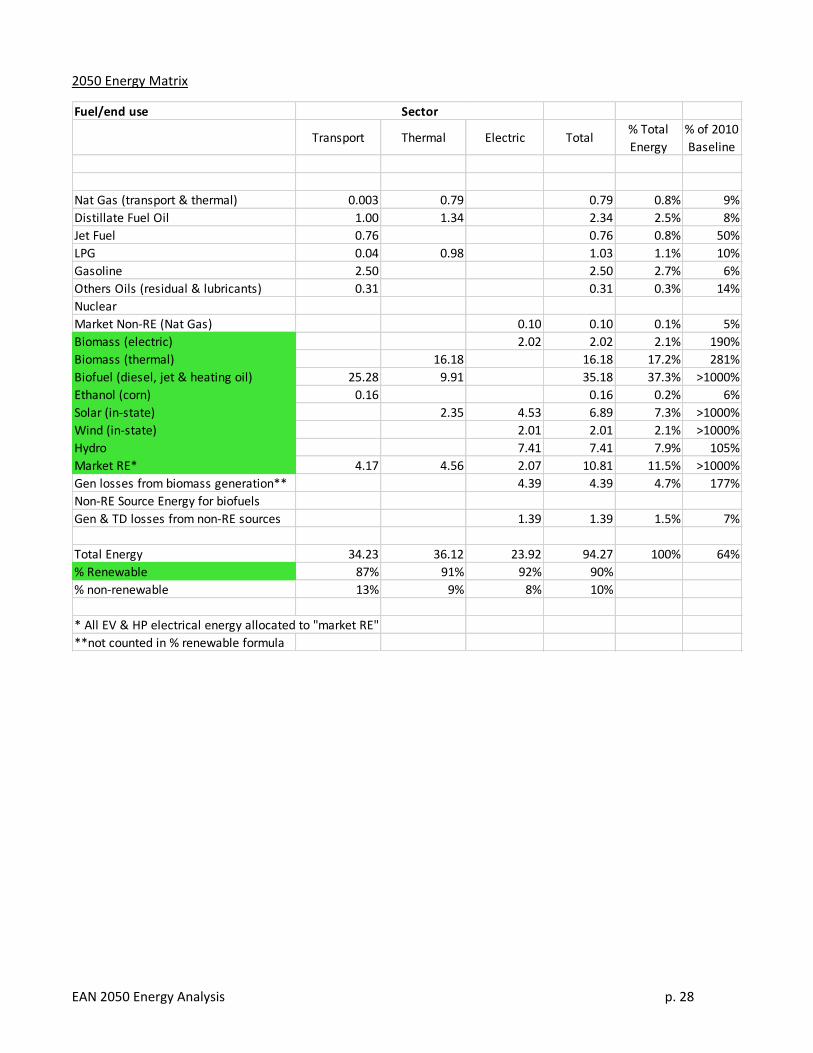
Decade Milestone Energy Use
The spreadsheets below indicate energy source by sector at each decade milestone leading to 2050. Far right
column indicates change over 2010 baseline.
2020 Energy Matrix
Fuel/end use
In TBTU Transport Thermal Electric Total% Total
Energy
% of 2010
Baseline
Nat Gas (transport & thermal) 0.003 9.21 9.21 6.7% 100%
Distillate Fuel Oil 8.43 17.30 25.73 18.8% 88%
Jet Fuel 1.52 1.52 1.1% 100%
LPG 0.04 6.21 6.26 4.6% 60%
Gasoline 39.53 39.53 28.9% 88%
Others Oils (residual & lubricants) 0.31 1.41 0.52 2.24 1.6% 100%
Nuclear 5.54 5.54 4.1% 77%
Market Non-RE (Nat Gas) 1.35 1.35 1.0% 66%
Biomass (electric) 1.21 1.21 0.9% 114%
Biomass (thermal) 8.66 8.66 6.3% 151%
Biofuel (diesel, jet & heating oil) 1.50 1.50 1.1% >1000%
Ethanol (corn) 2.55 2.55 1.9% 88%
Solar (in-state) 0.59 0.50 1.09 0.8% 544%
Wind (in-state) 1.52 1.52 1.1% >1000%
Hydro 7.11 7.11 5.2% 101%
Market RE* 0.57 0.57 1.08 2.22 1.6% >1000%
Gen losses from biomass generation** 2.77 2.77 2.0% 112%
Non-RE Source Energy for biofuels 2.01 0.55 2.56 1.9% 99%
Gen & TD losses from non-RE sources 14.05 14.05 10.3% 71%
Total Energy 56.46 44.50 35.66 136.62 100% 92%
% Renewable 8% 22% 35% 20%
% non-renewable 92% 78% 65% 80%
* All EV & HP electrical energy allocated to "market RE"
**not counted in % renewable formula
Sector

EAN 2050 Energy Analysis p. 26
2030 Energy Matrix
Fuel/end use
In TBTU Transport Thermal Electric Total% Total
Energy
% of 2010
Baseline
Nat Gas (transport & thermal) 0.003 9.21 9.21 7.9% 100%
Distillate Fuel Oil 5.98 5.88 11.86 10.2% 41%
Jet Fuel 1.29 1.29 1.1% 85%
LPG 0.04 0.89 0.93 0.8% 9%
Gasoline 23.74 23.74 20.4% 53%
Others Oils (residual & lubricants) 0.31 1.41 0.52 2.24 1.9% 100%
Nuclear 3.75 3.75 3.2% 52%
Market Non-RE (Nat Gas) 0.91 0.91 0.8% 44%
Biomass (electric) 1.60 1.60 1.4% 151%
Biomass (thermal) 12.86 12.86 11.0% 224%
Biofuel (diesel, jet & heating oil) 8.20 3.30 11.50 9.9% >1000%
Ethanol (corn) 1.53 1.53 1.3% 53%
Solar (in-state) 1.25 1.40 2.65 2.3% >1000%
Wind (in-state) 2.01 2.01 1.7% >1000%
Hydro 7.29 7.29 6.3% 103%
Market RE* 1.91 2.28 1.08 5.27 4.5% >1000%
Gen losses from biomass generation** 3.55 3.55 3.0% 143%
Non-RE Source Energy for biofuels 2.30 1.05 3.35 2.9% 130%
Gen & TD losses from non-RE sources 11.07 11.07 9.5% 56%
Total Energy 45.31 38.12 33.18 116.61 100% 79%
% Renewable 26% 52% 45% 40%
% non-renewable 74% 48% 55% 60%
* All EV & HP electrical energy allocated to "market RE"
**not counted in % renewable formula
Sector
EAN 2050 Energy Analysis p. 27
2040 Energy Matrix
Fuel/end use
In TBTU Transport Thermal Electric Total% Total
Energy
% of 2010
Baseline
Nat Gas (transport & thermal) 0.003 1.73 1.74 1.9% 19%
Distillate Fuel Oil 0.91 0.24 1.15 1.2% 4%
Jet Fuel 1.06 1.06 1.1% 70%
LPG 0.04 0.99 1.04 1.1% 10%
Gasoline 13.99 13.99 15.0% 31%
Others Oils (residual & lubricants) 0.31 0.66 0.52 1.49 1.6% 67%
Nuclear 0.29 0.29 0.3% 4%
Market Non-RE (Nat Gas) 0.33 0.33 0.3% 16%
Biomass (electric)
Biomass (thermal) 15.70 15.70 16.8% 273%
Biofuel (diesel, jet & heating oil) 14.61 6.61 21.21 22.7% >1000%
Ethanol (corn) 0.90 0.90 1.0% 31%
Solar (in-state) 1.91 2.74 4.65 5.0% >1000%
Wind (in-state) 2.01 2.01 2.2% >1000%
Hydro 7.41 7.41 7.9% 105%
Market RE* 2.86 3.42 2.07 8.35 9.0% >1000%
Gen losses from biomass generation** 4.15 4.15 4.4% 168%
Non-RE Source Energy for biofuels 2.82 1.54 4.37 4.7% 169%
Gen & TD losses from non-RE sources 3.47 3.47 3.7% 18%
Total Energy 37.51 32.82 22.99 93.32 100% 63%
% Renewable 49% 84% 76% 68%
% non-renewable 51% 16% 24% 32%
* All EV & HP electrical energy allocated to "market RE"
**not counted in % renewable formula
Sector
EAN 2050 Energy Analysis p. 28
2050 Energy Matrix
Fuel/end use
Transport Thermal Electric Total% Total
Energy
% of 2010
Baseline
Nat Gas (transport & thermal) 0.003 0.79 0.79 0.8% 9%
Distillate Fuel Oil 1.00 1.34 2.34 2.5% 8%
Jet Fuel 0.76 0.76 0.8% 50%
LPG 0.04 0.98 1.03 1.1% 10%
Gasoline 2.50 2.50 2.7% 6%
Others Oils (residual & lubricants) 0.31 0.31 0.3% 14%
Nuclear
Market Non-RE (Nat Gas) 0.10 0.10 0.1% 5%
Biomass (electric) 2.02 2.02 2.1% 190%
Biomass (thermal) 16.18 16.18 17.2% 281%
Biofuel (diesel, jet & heating oil) 25.28 9.91 35.18 37.3% >1000%
Ethanol (corn) 0.16 0.16 0.2% 6%
Solar (in-state) 2.35 4.53 6.89 7.3% >1000%
Wind (in-state) 2.01 2.01 2.1% >1000%
Hydro 7.41 7.41 7.9% 105%
Market RE* 4.17 4.56 2.07 10.81 11.5% >1000%
Gen losses from biomass generation** 4.39 4.39 4.7% 177%
Non-RE Source Energy for biofuels
Gen & TD losses from non-RE sources 1.39 1.39 1.5% 7%
Total Energy 34.23 36.12 23.92 94.27 100% 64%
% Renewable 87% 91% 92% 90%
% non-renewable 13% 9% 8% 10%
* All EV & HP electrical energy allocated to "market RE"
**not counted in % renewable formula
Sector

EAN 2050 Energy Analysis p. 29
Bibliography
Bastani, P., Heywood, J., Hope, C. Potential for Meeting Light-duty Vehicle Fuel Economy Targets, 2016-2025. An
MIT Energy Initiative Report, January 2012. http://web.mit.edu/sloan-auto-
lab/research/beforeh2/files/CAFE_2012.pdf
Barg, L. The Undeveloped Hydroelectric Potential of Vermont. Report for the VT Public Service Department.
Montpelier, VT. 2007. http://www.vtenergyatlas-info.com/wp-content/uploads/2010/02/DPS-
Undeveloped-Hydro-Potential-FINAL-VERSION.pdf
Biomass Energy Development Working Group. Biomass Energy Development Working Group Final Report.
Vermont Legislative Council, Montpelier, VT. 2012
http://www.leg.state.vt.us/REPORTS/2012LegislativeReports/272678.pdf.
Biomass Energy Resource Center. Grass Energy: The Basics of Production, Processing, and Combustion of Grasses
for Energy. Biomass Energy Resource Center, Montpelier, VT.
http://www.biomasscenter.org/resources/fact-sheets/grass-energy.html
Biomass Energy Resource Center. Vermont Wood Fuel Supply Study: 2010 Update. Biomass Energy Resource
Center, Montpelier, VT, 2011. http://www.biomasscenter.org/images/stories/VTWFSSUpdate2010_.pdf
Cadmus Group. Electric Energy Efficiency Potential For Vermont. Cadmus Group, Mariette, GA. April 2011.
http://publicservice.vermont.gov/sites/psd/files/Topics/Energy_Efficiency/Energy Efficiency Potential
2011.pdf
Cold Climate Housing Research Center. Small-Scale Biomass Combined Heat and Power Demonstration Project.
Final report to the Denali Commission, Anchorage, AK. March 2012.
http://cchrc.org/docs/reports/Combined_Heat_Power_report.pdf
Dallinger, D., Schubert, G. & Wietschel, M. Grid Integration of Intermittent Renewables Using Price Responsive
Plug-in Electric Vehicles. Fraunhofer Institute for Systems and Innovation Research, Karlsruhe, Germany,
2012. http://eetd.lbl.gov/sites/all/files/wp04-2012_integration-of-intermittent-renewable-power-
supply_.pdf.
Deru, M. & Torcellini, P., Source Energy and Emission Factors for Energy Use in Buildings, National Renewable
Energy Laboratory Report NREL/TP-550-38617, Revised June 2007.
http://www.nrel.gov/docs/fy07osti/38617.pdf
Dowds, J., P. Hines, C. Farmer, R. Watts, and S. Letendre. Plug-in Hybrid Electric Vehicle Research Project: Phase
II Report, UVM TRC Report # 10001, 2010.
http://www.uvm.edu/~transctr/pdf/PHEV-Final-Report-April2010.pdf
Efficiency Vermont. Cold-Climate Heat Pumps - Overview. Efficiency Vermont, Burlington, VT, 2013.
http://www.efficiencyvermont.com/for_my_home/ways-to-save-and-
rebates/energy_improvements_for_your_home/Cold-climate-heat-pump/overview.aspx.
Hadley, S. & Tsvetkova, A. Potential impacts of plug-in hybrid electric vehicles on regional power generation. Oak
Ridge National Laboratory, ORNL/TM2007/1502008, January 2008.
http://web.ornl.gov/info/ornlreview/v41_1_08/regional_phev_analysis.pdf
EAN 2050 Energy Analysis p. 30
Hamilton, Blair. A Vermont Case Study and Roadmap to 2050. Regulatory Assistance Project, September 2010.
http://transatlanticenergyefficiency.eu/sites/default/files/Vermont Case Study and Roadmap_final.pdf
Hansen, L., Lacy, V., & Glick, D. (2013). A Review of Solar PV Benefits & Cost Studies (2nd ed., Rep.). Boulder:
Rocky Mountain Institute Electricity Innovation Lab. http://www.rmi.org/Content/Files/eLab-
DER_cost_value_Deck_130722.pdf
Harrington, W. & Krupnick, A. Improving Fuel Economy in Heavy-Duty Vehicles, RFF DP 12-02, Resources for the
Future, March 2012. http://www.rff.org/documents/RFF-DP-12-02.pdf
Hornby, R. et al. Avoided Energy Supply Costs in New England: 2013 Report. Synapse Energy Economics,
Cambridge, MA, July 2013. http://www.synapse-energy.com/Downloads/SynapseReport.2013-
07.AESC.AESC-2013.13-029-Report.pdf
Hydro-Quebec. (2009). Strategic Plan: 2009-2013.
http://www.hydroquebec.com/publications/en/strategic_plan/pdf/plan-strategique-2009-2013.pdf
ISO-New England. (2010). Final Report: New England Wind Integration Study. Schenectady, NY: General Electric
International, Inc. http://iso-
ne.com/committees/comm_wkgrps/prtcpnts_comm/pac/reports/2010/newis_report.pdf.
Jacobson, M., et al. Examining the feasibility of converting New York State’s all-purpose energy infrastructure to
one using wind, water, and sunlight. Energy Policy, 57 (2013) 585–601. 2013.
http://www.stanford.edu/group/efmh/jacobson/Articles/I/NewYorkWWSEnPolicy.pdf.
Larson, E. & Kenwood, A. A Roadmap to Climate-Friendly Cars, Climate Central, September 2013.
http://assets.climatecentral.org/pdfs/ClimateFriendlyCarsReport_Final.pdf
Lazard. Levelized Cost of Energy Analysis (7th ed., Rep.). Lazard, 2013.
http://www.wecc.biz/committees/BOD/TEPPC/SPSG/Lists/Events/Attachments/692/Lazard V7.0 - lcoe
analysis.pdf
Letendre, S., R. Watts, & M. Cross, Plug-In Hybrid Vehicles and the Vermont Grid: A Scoping Analysis, UVM TRC
Report # 08-006, UVM Transportation Research Center, Burlington, VT, 2008.
http://www.uvm.edu/~transctr/pdf/Final_PHEV.pdf
Letendre, S. Hyper-Efficient Devices: Assessing the Fuel Displacement Potential in Vermont of Plug-In Vehicles
and Heat Pump Technology, Report for Green Mt. Power, May 2013.
Lew, D., & Brinkman, G. The Western Wind and Solar Integration Study Phase 2: Executive Summary (United
States, Department of Energy, Office of Energy Efficiency & Renewable Energy). Washington, DC:
National Renewable Energy Laboratory, 2013. http://www.nrel.gov/docs/fy13osti/58798.pdf
Lovins, A., Reinventing Fire. White River Junction, VT: Chelsea Green Publishing Company, 2010.
http://www.rmi.org/reinventingfire
Maine, Governor, Office of Energy Independence and Security. (2012). Maine Wind Energy Development
Assessment. http://maine.gov/energy/pdf/Binder1.pdf
Matley, R. Heat Pumps: An alternative to oil heat for the Northeast—input for planners and policy makers. Rocky
Mountain Institute. March 2013.
http://www.rmi.org/PDF_heat_pumps_an_alternative_to_oil_heat_in_the_northeast

EAN 2050 Energy Analysis p. 31
Morgan, Trevor. Smart grids and electric vehicles: Made for each other? Discussion Paper No. 2012-02,
International Transportation Forum, April 2012.
http://www.internationaltransportforum.org/jtrc/DiscussionPapers/DP201202.pdf
National Renewable Energy Laboratory. Renewable Electricity Futures Study. Golden, CO: National Renewable
Energy Laboratory, 2012 http://www.nrel.gov/analysis/re_futures/
Perez, R., & Hoff, T. E. Energy and Capacity Valuation of Photovoltaic Power Generation in New York (Rep.). Solar
Alliance and the New York Solar Energy Industry Association, 2008.
http://www.asrc.cestm.albany.edu/perez/publications/Utility Peak Shaving and Capacity Credit/Papers
on PV Load Matching and Economic Evaluation/Energy Capacity Valuation-08.pdf
Sherman, A. The Vermont Wood Fuel Supply Study: An Examination of the Availability and Reliability of Wood
Fuel for Biomass Energy in Vermont. Biomass Energy Resource Center, Montpelier, VT, 2007.
http://www.biomasscenter.org/pdfs/VT_Wood_Fuel_Supply_Study.pdf
U.S. Dept. of Energy. National Algal Biofuels Technology Roadmap, May 2010.
http://www1.eere.energy.gov/bioenergy/pdfs/algal_biofuels_roadmap.pdf
U.S. Dept. of Energy, Sunshot Vision Study, Chapters 3 and 4, February 2012.
http://www1.eere.energy.gov/solar/pdfs/47927.pdf
U.S. Dept. of Agriculture. Regional Roadmap to Meeting the Biofuels Goals of the Renewable Fuels Standard by
2022. USDA Biofuels Strategic Production Report. June 23, 2010.
http://www.usda.gov/documents/USDA_Biofuels_Report_6232010.pdf
VT Department of Environmental Conservation Air Pollution Control Division. Vermont Greenhouse Gas
Emissions Inventory Update 1990-2009. Vermont Agency of Natural Resources, Montpelier, VT.
November 2012, revised April 2013. http://www.anr.state.vt.us/anr/climatechange/Pubs/Vermont GHG
Emissions Inventory Update 1990-2009_REVISED_041213.pdf
Vermont Department of Public Service, Comprehensive Energy Plan 2011, Vermont’s Energy Future: Volume I.
Vermont Department of Public Service, Montpelier, VT, 2011.
http://publicservice.vermont.gov/sites/psd/files/Pubs_Plans_Reports/State_Plans/Comp_Energy_Plan/
2011/2011 CEP_Volume 1%5B1%5D.pdf
Vermont Department of Public Service. Comprehensive Energy Plan 2011 Facts Analysis & Recommendations:
Volume II and Appendices. Vermont Department of Public Service, Montpelier, VT, 2011.
http://publicservice.vermont.gov/sites/psd/files/Pubs_Plans_Reports/State_Plans/Comp_Energy_Plan/
2011/2011 CEP_Volume 2%5B1%5D.pdf
http://publicservice.vermont.gov/sites/psd/files/Pubs_Plans_Reports/State_Plans/Comp_Energy_Plan/
2011/2011 CEP_Appendixes%5B1%5D.pdf
Vermont Energy Generation Siting Policy Commission. Energy Generation Siting Policy Commission Final Report.
Montpelier, VT, 2013.
http://sitingcommission.vermont.gov/sites/cep/files/Siting_Commission/Publications/FinalReport/Final
Report - Energy Generation Siting Policy Commission 04-30-13.pdf
Vermont Legislative Council. Biomass Energy Development Working Group Final Report. Montpelier, VT, 2012.
http://www.leg.state.vt.us/REPORTS/2012LegislativeReports/272678.pdf.

EAN 2050 Energy Analysis p. 32
VT Public Service Board. Study on Renewable Electricity Requirements (Pursuant to Section 13a of Public Act
159). Vermont Public Service Board, Montpelier, VT, 2011.
http://www.leg.state.vt.us/reports/2011ExternalReports/271962.pdf
VT Public Service Department. Policy Options for Achieving Vermont’s Renewable Energy and Carbon Targets.
Regulatory Assistance Project, Montpelier, VT. June 2013.
http://publicservice.vermont.gov/sites/psd/files/Pubs_Plans_Reports/TES/Total_Energy_Study_RFI_and
_Framing_Report.pdf
VT Public Service Department. Evaluation of Net Metering in Vermont Conducted Pursuant to Act 125 of 2012
(Rep.). Montpelier, VT. Dec 2013. http://www.leg.state.vt.us/reports/2013ExternalReports/285580.pdf
VT Thermal Energy Task Force. A Report to the Vermont General Assembly Meeting the Thermal Efficiency Goals
for Vermont Buildings, January 2013.
http://www.leg.state.vt.us/reports/2013ExternalReports/285749.pdf
White, N., Callahan, C. Vermont On-Farm Oilseed Enterprises: Production Capacity and Breakeven Economics, VT
Sustainable Jobs Fund, Montpelier, VT, July 2013. http://www.vsjf.org/assets/files/VBI/VT Oilseed
Enterprises_July_2013.pdf
Sawyer, Scott. Cellulosic Ethanol in the Vermont Context. VT Sustainable Jobs Fund, Montpelier, VT, October
2006. http://www.vsjf.org/assets/files/VBI/Cellulosic_Ethanol.pdf