9 Uranium-series Dating of Marine and Lacustrine...
43
1529-6466/00/0052-0009$05.00 Uranium-series Dating of Marine and Lacustrine Carbonates R.L. Edwards 1 , C.D. Gallup 2 , and H. Cheng 1 1 Department of Geology and Geophysics University of Minnesota, Twin Cities Minneapolis, Minnesota, 55455, U.S.A. 2 Department of Geological Sciences University of Minnesota, Duluth Duluth, Minnesota, 55812, U.S.A. 1. HISTORICAL CONSIDERATIONS Of the possible uranium-series dating schemes, the most important and most widely applied to marine carbonates is 230 Th dating, with 231 Pa dating playing an increasingly important role. For this reason, this review will focus on these two methods. 230 Th dating, also referred to as U/Th dating or 238 U- 234 U- 230 Th dating, involves calculating ages from radioactive decay and ingrowth relationships among 238 U, 234 U, and 230 Th. 232 Th is also typically measured as a long-lived, essentially stable index isotope (over the time scales relevant to 230 Th dating). At present 230 Th dating can, in principle, be used to date materials as young as 3 years and in excess of 600,000 years (Edwards et al. 1987a, 1993; Edwards 1988; see Stirling et al. 2001 for an example of dating corals in excess of 600,000 years old). 231 Pa dating, also referred to as U/Pa dating, involves calculating ages from the ingrowth of 231 Pa from its grandparent 235 U. At present 231 Pa dating can be used to date materials as young as 10 years and as old 250,000 years (Edwards et al. 1997). 230 Th dating covers all of the 231 Pa time range and more, with somewhat higher precision, and is therefore the method of choice if a single method is applied. However, the combination of 231 Pa and 230 Th dating is of great importance in assessing possible diagenetic mobilization of the pertinent nuclides, and thereby, the accuracy of the ages (Allegre 1964; Ku 1968). Even if the primary age exceeds the 250,000 year limit of 231 Pa dating, the combined methods can be used to assess the degree to which the samples have remained closed over the past 250,000 years (e.g., Edwards et al. 1997). Thus 231 Pa analysis can play an important role in assessing age accuracy. Taken together, 230 Th and 231 Pa dating cover a critical time period in earth history, which often cannot be accessed with other radiometric dating techniques. Other reviews that may be of interest to the reader include a review of dating of marine sediments by Ku (1976), a review of disequilibrium dating methods (Ivanovich and Harmon 1992), and portions of the lead author’s doctoral thesis (Edwards 1988), which includes a review of 230 Th dating from the discovery of radioactivity (Becquerel 1896) until 1988, a detailed discussion of mass spectrometric techniques for measurement of 230 Th and 234 U, and the first in depth discussion of models of marine uranium isotopic composition. Marine and lacustrine carbonates that have been particularly amenable to 230 Th dating (and in some cases 231 Pa dating) include coralline aragonite (Barnes et al. 1956), aragonitic ooliths (Veeh 1966), aragonitic carbonate bank sediments (Slowey et al. 1996), and lacustrine tufas (Kaufmann and Broecker 1965) and other lacustrine precipitates (e.g., Ku et al. 1998; Schramm et al. 2000). Because of the large amount of work that has been done with coralline aragonite, this review will focus on dating of corals that live in shallow waters. We will then discuss dating of some of the other materials with regard to the surface coral discussion. 9 9 9
Transcript of 9 Uranium-series Dating of Marine and Lacustrine...

1529-6466/00/0052-0009$05.00
Uranium-series Dating of Marine and Lacustrine Carbonates
R.L. Edwards1, C.D. Gallup2, and H. Cheng1
1Department of Geology and Geophysics University of Minnesota, Twin Cities
Minneapolis, Minnesota, 55455, U.S.A.
2Department of Geological Sciences University of Minnesota, Duluth
Duluth, Minnesota, 55812, U.S.A.
1. HISTORICAL CONSIDERATIONS Of the possible uranium-series dating schemes, the most important and most widely
applied to marine carbonates is 230Th dating, with 231Pa dating playing an increasingly important role. For this reason, this review will focus on these two methods. 230Th dating, also referred to as U/Th dating or 238U-234U-230Th dating, involves calculating ages from radioactive decay and ingrowth relationships among 238U, 234U, and 230Th. 232Th is also typically measured as a long-lived, essentially stable index isotope (over the time scales relevant to 230Th dating). At present 230Th dating can, in principle, be used to date materials as young as 3 years and in excess of 600,000 years (Edwards et al. 1987a, 1993; Edwards 1988; see Stirling et al. 2001 for an example of dating corals in excess of 600,000 years old). 231Pa dating, also referred to as U/Pa dating, involves calculating ages from the ingrowth of 231Pa from its grandparent 235U. At present 231Pa dating can be used to date materials as young as 10 years and as old 250,000 years (Edwards et al. 1997). 230Th dating covers all of the 231Pa time range and more, with somewhat higher precision, and is therefore the method of choice if a single method is applied. However, the combination of 231Pa and 230Th dating is of great importance in assessing possible diagenetic mobilization of the pertinent nuclides, and thereby, the accuracy of the ages (Allegre 1964; Ku 1968). Even if the primary age exceeds the 250,000 year limit of 231Pa dating, the combined methods can be used to assess the degree to which the samples have remained closed over the past 250,000 years (e.g., Edwards et al. 1997). Thus 231Pa analysis can play an important role in assessing age accuracy. Taken together, 230Th and 231Pa dating cover a critical time period in earth history, which often cannot be accessed with other radiometric dating techniques. Other reviews that may be of interest to the reader include a review of dating of marine sediments by Ku (1976), a review of disequilibrium dating methods (Ivanovich and Harmon 1992), and portions of the lead author’s doctoral thesis (Edwards 1988), which includes a review of 230Th dating from the discovery of radioactivity (Becquerel 1896) until 1988, a detailed discussion of mass spectrometric techniques for measurement of 230Th and 234U, and the first in depth discussion of models of marine uranium isotopic composition. Marine and lacustrine carbonates that have been particularly amenable to 230Th dating (and in some cases 231Pa dating) include coralline aragonite (Barnes et al. 1956), aragonitic ooliths (Veeh 1966), aragonitic carbonate bank sediments (Slowey et al. 1996), and lacustrine tufas (Kaufmann and Broecker 1965) and other lacustrine precipitates (e.g., Ku et al. 1998; Schramm et al. 2000). Because of the large amount of work that has been done with coralline aragonite, this review will focus on dating of corals that live in shallow waters. We will then discuss dating of some of the other materials with regard to the surface coral discussion.
999

364 Edwards, Gallup & Cheng
Historically, the most important applications of uranium-series dating techniques of marine and lacustrine carbonates have followed soon after important technical breakthroughs. Two factors have generated this close link. First, such dating methods are important because they can elucidate a broad range of processes including the timing, nature, and causes of climate change, oceanographic processes, and tectonic and seismic processes. 230Th dating has also played a central role in calibration of the radiocarbon time scale and in elucidating atmospheric radiocarbon history. In some cases, 230Th or 231Pa dating has been the only way to characterize some aspect of these processes. Second, for most of the last century the field has been limited by measurement capabilities, which have, in turn limited the degree to which we can characterize these important processes. Thus, technical advances have generally been followed, soon thereafter by uranium-series dating applications.
The reasons for the technical limitations are the vanishingly small concentrations of the key intermediate daughter nuclides. For example, a relatively high concentration material (a 50,000 year old coral) typically has a 230Th concentration of about 100 femtomoles/gram (60 billion atoms/g) and a 231Pa concentration of about 3 femtomoles/gram (2 billion atoms/g). An intermediate concentration material (a 100 year old coral) has a 230Th concentration of about 200 attomoles/gram (100 million atoms/g) and a 231Pa concentration of about 8 attomoles/gram (5 million atoms/gram). At the extreme low end of the concentration range, surface seawater contains about 4 yoctomoles (yocto = 10 21) of 230Th/g (3000 atoms of 230Th/g) and about 80 zeptomoles (zepto = 10 24) of 231Pa/g (50 231Pa atoms/g). Although we are still limited by analytical capabilities for some applications and are actively pursuing analytical improvements, measurements of 230Th and 231Pa in all of the above materials can now be made with relatively small samples and relatively high precision, despite these low concentrations.
Historically this was not always the case. 230Th was first identified by Boltwood (1907), prior to the discovery of isotopes and was initially called “ionium.” However, direct measurements of 230Th concentrations in natural materials were not made until half a century later when Isaac and Picciotto (1953) applied nuclear track techniques to deep-sea sediments. The first demonstration that 230Th could be used to date carbonates (corals) was by Barnes et al. (1956), using alpha-counting techniques to measure the pertinent nuclides. This work spawned a whole field that depended upon alpha-counting uranium-series measurements of natural materials. The field flourished in the 1960’s and 1970’s. A large portion of this effort focused on 230Th dating of marine carbonates, principally corals (e.g., Veeh 1966; Broecker et al. 1968; Mesolella et al. 1969; Bloom et al. 1974; Chappell 1974; Ku et al. 1974). The field ultimately languished because of the technical limitations of alpha-counting techniques, in terms of sample size and precision (see Edwards 1988, 2000; Wasserburg 2000). The basic problem was a limit on the fraction of atoms that can be detected by decay counting techniques given the large difference between the half-lives of the pertinent nuclides (on the order of 105 years or more) and reasonable laboratory counting times (weeks). This problem was solved with the development of mass spectrometric methods for the measurement of 234U (Chen et al. 1986) and 230Th (Edwards et al. 1987a) in natural materials. Mass spectrometric measurements obviate the need to wait for the nuclides of interest to decay as mass spectrometers detect the ions/atoms of interest directly. In this regard, the development of mass spectrometric techniques for 230Th and 234U measurement is analogous to the development of accelerator mass spectrometer techniques for 14C measurement, which improved upon traditional beta-counting techniques. Mass spectrometric methods for measuring 230Th and 234U greatly reduced sample size requirements and improved analytical precision. These technical improvements reinvigorated uranium-series studies and spawned a new era of in the full range of fields discussed in this book. With regard to

U-series Dating of Marine & Lacustrine Carbonates 365
dating of carbonates, the technique improved the precision of 230Th ages, extended the range of 230Th dating to both older and younger age, improved our ability to detect diagenetic alteration of nuclides used in 230Th dating, and generated substantial activity (see below) in 230Th dating applications to paleoclimatology, paleoceanography, 14Ccalibration and atmospheric 14C history, and tectonics. Today, the original mass spectrometric technique (Edwards et al. 1987a) is still the preferred method for analyzing 238U, 235U, 234U, 230Th, and 232Th, with a number of modifications applied by different laboratories.
231Pa measurements and their relationship to carbonate dating follow a similar history. Protactinium was discovered by Fajans and Gohring in 1913 in studies of 234Pa. Protactinium was initially called “brevium” reflecting 234Pa’s short half-life (6.7 hours). Meitner and Hahn identified 231Pa in 1918 and renamed the element protoactinium, as 231Pa (the longest-lived isotope of protactinium) is the parent of 227Ac, the longest-lived isotope of actinium. The team of Soddy, Cranson, and Fleck and independently, Fajans, also isolated 231Pa at about the same time as Meitner and Hahn. “Protoactinium” was later shortened to “protactinium.” Early decay-counting methods for direct measurement of 231Pa in natural materials were presented by Potratz and Bonner (1958) and Sackett (1960). Rosholt (1957), Koczy et al. (1957), and Sackett et al. (1958) present early decay-counting methods for indirect determination of natural levels of 231Pa via measurement of 227Th as a proxy for its grandparent 231Pa. Early applications of 231Pa to the dating of marine carbonates include contributions by Rosholt and Antal (1962), Sakanoue et al. (1967), and Ku (1968). The method was applied in conjunction with 230Th dating to make key tests of open system behavior in marine carbonates (e.g., Ku 1968; Rosholt 1967; Szabo and Rosholt 1969; Kaufmann et al. 1971). Analogous to the development of mass spectrometric techniques for 230Th and 234U, similar techniques were developed for the measurement of 231Pa (Pickett et al. 1994). This method has already begun to fuel activity in the full range of fields discussed in this book. The first application of the Pickett et al. (1994) mass spectrometric techniques to the dating of carbonates was performed by Edwards et al. (1997). As with 230Th, the use of mass spectrometric 231Pa measurement techniques (as opposed to traditional decay counting techniques) improves the precision of ages, reduces sample size requirements, and extends the range of 231Pa dating to both older and younger times. As discussed below, 231Pa dating has and will play a critical role in combination with 230Th dating in testing for diagenesis and age accuracy.
2. THEORY 2.1. Decay chains
238U decay chain. 230Th dating is based on the initial portion of the 238U decay chain (see Bourdon and Turner 2003). 238U decays by alpha emission with a half-life of 4.4683 ± 0.0048 × 10⁹ years (Jaffey et al. 1971) to 234Th, which in turn decays (half-life = 24.1 days) by beta emission to 234Pa, which decays (half-life = 6.7 hours) by beta emission to 234U, which decays (half-life = 245,250 ± 490 years, Cheng et al. 2000b) by alpha emission to 230Th (half-life = 75,690 ± 230, Cheng et al. 2000b), which decays through a series of intermediate daughters ultimately to stable 206Pb. Because of their short half-lives compared to the timescales in question, 234Th and 234Pa can be ignored in carbonate dating applications, and from a mathematical standpoint, we can view 238U as decaying directly to 234U. (Despite our slight herein, 234Th does have the important distinction of being one the radionuclides that was originally used to determine the decay law dN/dt = λN or N = N°e λt, where N is the present number of a parent atom, N° is the initial number of parent atoms, t is time and λ is the decay constant. Rutherford and Soddy 1902). For carbonate dating, the pertinent nuclides are: 238U, 234U, and 230Th.
366 Edwards, Gallup & Cheng 235U decay chain. 231Pa dating is based on the initial portion of the 235U decay chain.
235U decays by alpha emission (half-life = 7.0381 ± 0.0096 × 10⁸ years; Jaffey et al. 1971) to 231Th, which decays (half-life = 1.06 days) to 231Pa, which decays (half-life = 32760 ± 220 y, Robert et al. 1969) through a set of intermediate daughters ultimately to 207Pb. Because of its short half-life, 231Th can be ignored for 231Pa dating applications. Thus, the pertinent nuclides for 231Pa dating are 235U and 231Pa.
2.2. Secular equilibrium and uranium-series dating In decay chains like the 238U and 235U chains, if a system remains closed to chemical
exchange for time scales that are long compared to the half-lives of the intermediate daughters, the system reaches a state of secular equilibrium (see Bourdon and Turner 2003) in which the activities of all of the nuclides in a particular decay chain are equal. All U-series dating methods depend on some natural process that fractionates nuclides in the decay chain and thereby disrupts this secular equilibrium state. In the case of 230Th and 231Pa dating of marine and lacustrine carbonates, this event is the extreme fractionation of the parent (uranium, which is generally soluble in natural waters) from the daughter (thorium or protactinium, which generally have low solubilities in natural waters) during weathering and the hydrologic cycle. If one knows isotope ratios immediately after the fractionation event, the subsequent approach to secular equilibrium is a function of time, which can be calculated from the equations of radioactive decay and ingrowth (Bateman 1910).
2.3. 230Th, 231Pa, and 230Th/231Pa age equations Initial daughter isotope abundances. A fundamental issue in many radiometric
dating systems is the ability to quantify the initial amount of daughter isotope, permitting a determination of the relative fractions of radiogenic and initial daughter. The age is then calculated from the amount of radiogenic daughter. Ideally the initial amount of radiogenic daughter is negligible and correction for initial daughter is not necessary. If the initial amount of daughter is small but significant, it may be possible to make the correction by estimating the initial ratio of the daughter isotope to a stable isotope of the same element as the daughter. This ratio is then multiplied by the present abundance of the stable isotope as an estimate of the initial daughter abundance. If the initial amount of daughter is yet higher, then isochron techniques may be required in order to resolve the initial and radiogenic components (see below and Ludwig 2003).
Fractionation of Th and Pa daughter isotopes from U parent isotopes. One of the great advantages of 230Th and 231Pa dating of corals is that initial daughter concentrationsare extremely low, in most cases negligible. This results from the extreme fractionation of uranium from both thorium and protactinium during the weathering process. All are actinides, but have different valences under oxidizing conditions. Uranium is typically +6 under oxidizing conditions, protactinium, +5, and thorium, +4. Uranium is soluble as uranyl ion and in various uranyl carbonate forms. Thorium has extremely low solubility in virtually all natural waters (extremely alkaline waters being the exception). Protactinium also has low solubility in natural waters, although its solubility is generally slightly higher than for thorium. A striking illustration of the extreme solubility difference between uranium and the other two elements is the fact that surface sea water has 230Th/238U values 105 times lower than secular equilibrium values (Moore 1981), and 231Pa/235U values 104 times lower than secular equilibrium (Nozaki and Nakanishi 1985). The initial fractionation of uranium from thorium and protactinium takes place during weathering and soil formation (see Chabaux et al. 2003) where a significant proportion of the uranium tends to dissolve in the aqueous phase and both thorium and protactinium tend to remain associated with solid phases. This process is initially responsible for the

U-series Dating of Marine & Lacustrine Carbonates 367
relatively high surface water concentrations of uranium and low concentrations of thorium and protactinium (see Porcelli and Swarzenski 2003).
Uranium in solution decays to produce both 230Th and 231Pa. Nevertheless, the aqueous concentrations of 230Th and 231Pa in surface seawater do not build up because of they are continuously removed by adsorption onto solid particles and complexation with organic molecules associated with solid particles (see Cochran and Masque 2003). Most of this 230Th and 231Pa is removed from the water column as the particles with which they are associated settle to the seafloor. However, as the particles settle through the water column, the adsorbed/complexed thorium and protactinium continuously re-equilibrate with seawater (see the reversible exchange model of Bacon and Anderson, 1982). The process is analogous to an ion exchange column (particles equivalent to the solution passing through an exchange column and sea water equivalent to the ion exchange resin). As a result, both 230Th and 231Pa generally increase with depth in the ocean. Thus, with regard to dating of marine carbonates, surface carbonates are less likely to have significant initial 230Th and 231Pa than deep water carbonates. This is the main difference between the dating of surface corals and dating of deep-sea corals (see below).
When coralline aragonite forms from surface seawater, there is potential to fractionate uranium, thorium, and protactinium yet again. As it turns out, however, these elements do not fractionate by large amounts during this process, incorporating the three elements in approximately their proportions in seawater. Molar uranium/calcium ratios of surface corals are within about 30% (Fig. 1, see Shen and Dunbar 1995; Min et al. 1995; see discussion below on primary uranium concentrations in corals and other marine carbonates) of the seawater value of 1.3 × 10 6 (see Broecker and Peng 1982). Molar 232Th/238U values of young surface corals (Fig. 2, Edwards et al. 1987a) are typically somewhat lower than typical seawater values of 3 × 10 5 (Fig. 2, Chen et al. 1986), but within a factor of 3 of this value. 231Pa values for modern corals have not been measured directly because of their extremely low concentrations; however, a measurement on one coral has placed an upper limit on initial 231Pa/235U of 5 × 10 10 (Edwards et al. 1997). This upper limit agrees with the very limited number of surface seawater 231Pa/235Useawater measurements (see Edmonds et al. 1998 and references therein). Thus, existing data suggests that surface corals initially have 231Pa/235U ratios that are similar to or lower than seawater values. Taken together, this data indicates that the main fractionation (several orders of magnitude) leading to low initial 231Pa/235U and 230Th/238U in corals is that between solids and natural waters prior to the precipitation of coralline aragonite. Fractionation during precipitation of aragonite is small (less than a factor of a few).
The 230Th age equation. Because of extremely low initial 230Th/238U ratios in surface corals, we first present the version of the 230Th age equation calculated assuming an initial condition of 230Th/238U = 0. Below, we present tests that indicate that this assumption holds for most surface corals. We then present a variant of this equation, which relaxes the criterion that initial 230Th/238U = 0, but requires some knowledge of initial 230Th/232Th values. It may be necessary to employ this second equation in unusual cases involving surface corals, with deep-sea corals, and in some other marine and lacustrine carbonates. The 230Th age equation, calculated assuming (1) initial 230Th/238U = 0, (2) all changes in isotope ratios are the result of radioactive decay and ingrowth (no chemical/diagenetic shifts in isotope ratios), and (3) 238U (half life of several billion years) has not decayed appreciably over the timescales (several hundred thousand years or less) of interest is:
( )( )230 234230
234230tt 230m
238230 234
UTh 1 e 1 eU 1000
− −−− = − + −−
(1)

368 Edwards, Gallup & Cheng
Figure 1. Histogram of measurements of molar U/Ca ratio in a number of samples of reef-building corals and one giant clam sample (after Edwards 1988). Also indicated is the U/Ca ratio of seawater. This illustrates the point that corals do not fractionate U from Ca by large amounts when they make their skeletons. U/Ca ratios of corals are similar to values from inorganically precipitated marine aragonite. Mollusks along with most other biogenic minerals exclude uranium. Note that the horizontal axis is on a log scale and that the U/Ca ratio of the clam is almost 5 orders of magnitude lower than that of the corals. This difference is the fundamental reason why there are difficulties with uranium-series dating of mollusks.
Figure 2. Histogram of measurements of molar 232Th/238U for a number of corals and a giant clam sample (after Edwards 1988). Also indicated are the 232Th/238U value of sea water and of chondrites. This illustrates the fact that corals do not fractionate thorium from uranium by large amounts during growth. The chondritic value is approximately that of the bulk earth and similar to the crustal value. Thus the large fractionation of uranium from thorium, which makes 230Th dating possible, takes place during the weathering process and hydrologic cycle. Note the log scale of the horizontal axis and the 5 order of magnitude difference between chondrites and sea water. The giant clam has a much higher 232Th/238U ratio than corals because clams exclude uranium during growth (see Fig. 1).

U-series Dating of Marine & Lacustrine Carbonates 369
The brackets around 230Th/238U indicate that this is an activity ratio. λ’s are decay constants; t is age; and δ234Um is the present deviation in parts per thousand (per mil) of the 234U/238U ratio from secular equilibrium: δ234U = ([234U/238U] – 1) × 1000. Given measured 230Th/238U and 234U/238U, the only unknown is age, which can be calculated from Equation (1). Because age appears twice, the equation must be solved graphically (Fig. 3) or by iteration (by substituting δ234Um and then different values of “t” until the measured 230Th/238U is calculated). The general form of this equation was first solved by Bateman (1910).
A specific form of this equation was solved by Barnes et al. (1956) when he presented the first decay counting 230Th data for corals. The equation of Barnes et al. (1956) did not include the second term on the right side
( )230 234 t234m 230 230 234{( U 1000)( ( ))(1 e )}− −− − of Equation (1). This term accounts
for initial 234U/238U values different from equilibrium. At the time of the Barnes et al. (1956) work, it was not known that seawater is out of equilibrium with respect to 234U/238U, and the discovery that 234U/238U can be out of equilibrium in natural waters was only made one year earlier (Cherdyntsev 1955; by analysis of river water). This actually came as a surprise since there is no obvious chemical mechanism for this. 234U is linked to its great-grandparent, 238U by two very short-lived intermediate daughters, and isotopes of the same element, 234U and 238U should not fractionate appreciably from each other. The discovery that natural waters generally have higher 234U/238U values than secular equilibrium (and soils generally have lower 234U/238U values than secular equilibrium), led to the conclusion that a higher proportion of 234U atoms than 238U atoms
Figure 3. Plot of measured δ234U versus measured [230Th/238U] (after Edwards 1988). Two sets of contours indicate solutions to the 230Th age equation (Eqn. 1, lines with steep positive slope) and solutions to the initial δ234U equation (Eqn. 2, curves labeled “150” per mil, “ 150” per mil, etc.). As sea water likely has had δ234U values close to the modern value (145.8 ± 1.7 per mil, Cheng et al. 2000b), corals that maintain their primary marine uranium isotopic composition should plot close to the “150” curve. Isotopic compositions represented by the stippled band labeled “altered” and the area to the right of this band cannot be reached by closed-system decay and ingrowth. Thus any isotopic compositions that plot in this area are indicative of open-system behavior.

370 Edwards, Gallup & Cheng
are available for leaching from minerals undergoing weathering. The rationale was that 234U atoms are produced from decay of 238U, a process that involves alpha emission. Recoil from alpha-emission can damage chemical bonds that hold the nuclide in a particular site, thereby causing 234U to be more susceptible to leaching into the aqueous phase than 238U. Thurber (1962) first showed that the 234U/238U ratio of seawater was out of secular equilibrium (about 15% higher than secular equilibrium). Immediately thereafter, Broecker (1963) presented the specific equation (Eqn. 1) that includes the term for disequilibrium in initial 234U/238U. Derivations of Equation (1) that include numerous intermediate steps can be found in Edwards (1988) and Ivanovich and Harmon (1992). Disequilibrium initial 234U/238U ratio is a happy complication. As is clear from Equation (1), this phenomenon requires measurements of both 234U/238U and 230Th/238U to solve for age. However, given both measured values, we can solve for age uniquely given the assumptions presented above. Furthermore, a second equation that relates measured and initial 234U/238U can be calculated from the equations of radioactive production and decay, subject only to the assumption that chemical reactions (diagenesis) involving uranium have not occurred since precipitation of the aragonite:
( ) 234t234 234m iU U e−= (2)
where the subscript “i” refers to the initial value and the decay constant is that of 234U.Thus, Equations (1) and (2) constitute two equations that can be solved for two unknowns (age and initial δ234U). As it turns out, for marine samples, knowledge of initial δ234U is of great importance in assessing dating accuracy. A number of arguments and supporting data suggest that marine δ234U has been constant within fairly tight bounds (see below and Henderson and Anderson 2003). If so, deviations from marine values would indicate diagenetic shifts in uranium and potential inaccuracy in the 230Th age. Figure 3 shows a graphical solution to both the 230Th age equation (Eqn. 1) and the initial δ234U equation (Eqn. 2). Plotted on the ordinate and abscissa are the two measured quantities δ234Um and [230Th/238U]. Contoured with sub-vertical lines is one of the calculated unknowns, age; the ordinate is coincident with the age = zero contour. Emanating from the ordinate are a set of curves (sub-horizontal near the ordinate), which contour the other unknown, δ234Ui. Secular equilibrium is represented by the point (0,1). The age contours get closer together with increasing age and increasing [230Th/238U], reflecting the exponential approach of [230Th/238U] to secular equilibrium. Beyond about 50 ky analytical errors in [230Th/238U] are more or less constant. Thus, as age increases beyond 50 ky, error in age increases because of the compression of age contours. Eventually the age contours become so close that, for a given analytical error, one can no longer distinguish between the isotopic composition of a particular age sample and the isotopic composition of an infinite age sample. This is the upper limit of the 230Th age range, which given current analytical errors is about 700,000 years (Edwards et al. 1987; Edwards et al. 1993; Stirling et al. 2001). Note that there are no age or initial δ234Ucontours in the right portion of the diagram (“altered region”). Isotopic compositions in this region of the diagram cannot be reached through closed-system decay and ingrowth of materials that initially have zero 230Th/238U. Thus, samples that plot in this region have undergone diagenetic alteration.
Modifications of the 230Th age equation. We show below that surface corals generally satisfy the 230Th/238U = 0 assumption used in calculating Equation (1). However, in unusual cases involving surface corals, most deep-sea corals, and other marine and lacustrine dating applications, correction for non-zero 230Th/238U may be necessary. With some knowledge of the initial 230Th/232Th ratio, age can be calculated with the following equation:

U-series Dating of Marine & Lacustrine Carbonates 371
( )
( )( )
230
230 234230
230 232 230t
238 238 232i
234tt 230m
230 234
Th Th Th e 1 =U U Th
U e 1 e1000
−
− −−
− −
− + −−
(3)
The second term on the left side ([232Th/238U] [230Th/232Th]i (e λ230t)) corrects for initial 230Th. If this term is negligible compared to measured [230Th/238U], Equation (1) can be used. Included in this term is initial 230Th/232Th, which must be known independently in order to calculate age. For this reason, Equation (3) is typically used when the magnitude of the second term on the left is small but significant. In this case, even if 230Th/232Th is not known precisely, the contribution to error in age is small. Low 232Th/238U, low initial 230Th/232Th, or large “t” will contribute to small values for this term. For surface corals there is a limited range of 238U concentrations and initial 230Th/232Th values. Thus, this term is only significant if the sample is young (< a few thousand years) and the sample has unusually high 232Th concentrations. For deep sea corals, the same parameters are important; however the term is generally larger and increases with depth as 230Th/232Thgenerally increases with depth in the ocean. For most other materials discussed here, this term should be evaluated on a case by case basis. To estimate the magnitude of this term, several strategies have been employed. Zero-order estimates have been made by calculating an initial 230Th/232Th value (4.4 × 10 6 byatom) assuming a bulk earth 232Th/238U value (3.8 by atom) and presuming secular equilibrium. Estimates of initial 230Th/232Th can also be made by analyzing modern analogues to the samples in question, analyzing samples with ages that are known independently, or by applying development diagrams (see Cheng et al. 2000a) or isochron techniques (see below, Ludwig 2003).
Isochrons. In cases where the initial 230Th term in Equation (3) is large enough that 230Th/232Th must be established precisely, isochron methods can be used. Such methods consider the sample to be composed of a mixture of two components. By analyzing sub-samples of the same age with different proportions of the components, one can extrapolate to an endmember that includes only radiogenic daughter and establish an age on the basis of that endmember. The extrapolation also establishes an initial 230Th/232Thratio, assumed to be the same in both components, and the initial 234U/238U value for the radiogenic endmember. Isochron methods generally require that the sample only contain two components, although methods that deconvolve more than two components have been developed (see Henderson et al. 2001).
As an example, imagine a carbonate-rich sediment that contains a small but significant fraction of detrital silicate. The sediment might be a lake sediment, a surface coral, a deep-sea coral, a carbonate-rich bank sediment, or a speleothem (see for example, Richards and Dorale 2003). The carbonate has a very high 238U/232Th ratio (on the order of 104 by atom) and the detrital material has a lower 238U/232Th ratio of about 100. The carbonate and detrital materials each have specific δ234U values that differ from each other. Both have the same initial 230Th/232Th ratio. Through time, the mixture evolves following the laws of radioactive ingrowth and decay. Sub-samples of the sediment with different proportions of carbonate and detrital material, and therefore different 238U/232Th,234U/238U, and present day 230Th/232Th ratios, are measured. If the sub-samples started with the same initial 230Th/232Th, their isotopic compositions will evolve so that they lie on a line in three-dimensional isotope ratio space. If the points do not lie on a line, there must be an additional thorium or uranium component represented in the mixture or the

372 Edwards, Gallup & Cheng
sediment has been altered. Different choices for the three axes can be made (see Ludwig and Titterington 1994); however, a convenient set for illustrative purposes is 230Th/232Th,238U/232Th, and 234U/232Th [see Hall and Henderson (2001) for a recent example of use of these types of axes]. Regardless of the choice of axes, the resultant line is termed an isochron. The equation of the line can be used to extrapolate to a hypothetical uranium-free end member, from which initial 230Th/232Th can be calculated, and to a 232Th-free (radiogenic) end member, from which age and initial 234U/238U of the end member can be calculated, essentially from Equations (1) and (2).
The isochron approach is powerful, but ultimately limited by the degree to which the constant initial 230Th/232Th assumption holds in a particular sample. There are indications from different settings (e.g., Lin et al. 1996; Cheng et al. 2000a; Slowey et al. 1996; Henderson et al. 2001) for two distinct sources of initial thorium, a “hydrogenous” source (from solution or colloids) and a “detrital source.” The co-linearity (or lack thereof) of data points is an important test of this phenomenon. Even in cases where there are two initial sources of thorium, there may be methods to correct for this additional source (Henderson et al. 2001). Ideally one would physically separate the carbonate-rich fraction from the thorium-rich fraction, but often this cannot be done because of cementation or small grain size. Methods of chemical separation of these components have been attempted (e.g., acid dissolution of the carbonate component leaving the detrital silicate component behind); however, differential adsorption of uranium and thorium onto the solid residue and/or differential leaching of uranium and thorium from the residue have proven to cause problems (Bischoff and Fitzpatrick 1991; Luo and Ku 1991). Thus, in cases where physical separation is not possible, isochron techniques with total sample dissolution are recommended. Further discussion of isochron approaches can be found in Bischoff and Fitzpatrick (1991), Luo and Ku (1991), Ludwig and Titterington (1994) and Ludwig (2003).
The 231Pa age equation. The 231Pa age equation, calculated assuming no chemical shifts in protactinium or uranium and an initial 231Pa/235U = 0, is analogous to the 230Thage equation (Eqn. 1), but simpler. There is no term analogous to the δ234U term because there is no long-lived intermediate daughter isotope between 235U and 231Pa:
231
231t
235
Pa 1 eU
−− = − (4)
We will show below that the initial 231Pa/235U = zero assumption holds for a number of corals that have typical low 232Th concentrations. Initial 231Pa/235U values for most other carbonates have not been studied in detail. Furthermore, in contrast to thorium, there is no long-lived isotope of protactinium that can be used as an index isotope although some work has employed corrections for initial 231Pa. Such corrections essentially assume that 232Th is an isotope of protactinium and assume a bulk earth 232Th/238U ratio and secular equilibrium between 231Pa and 235U. The term for applying this correction is analogous to the initial 230Th term in Equation (3).
The 231Pa/230Th age equation. Equation (4) can be divided by Equation (1) to give the following 231Pa/230Th age equation:
( )( )( )
231
230 234230
t231
230 234238tt 230m
235230 234
1 ePaTh UU 1 e 1
U 1000e
−
− −−
−=
− + −−
(5)
[238U/235U] is not a variable because it is constant in nature; our present best estimate of

U-series Dating of Marine & Lacustrine Carbonates 373
its value is: (238U/235U)(λ238/λ235) = 137.88 (1.5513 × 10 10 y 1/9.8485 × 10 10 y 1) = 21.718. As opposed to Equations (1) and (4), Equation (5) does not depend explicitly on 238U or 235U abundance. 231Pa/230Th ages are analogous to 207Pb/206Pb ages in this respect and many others. 231Pa/230Th ages are not sensitive to very recent uranium loss; nor are they sensitive to very recent uranium gain if the added uranium has the same δ234Um as the sample. This is clear from Equation (5). On the other hand 231Pa/230Th ages are sensitive to uranium gain or loss at earlier times, as these processes affect the subsequent ingrowth and decay of 231Pa and 230Th. Nevertheless, 231Pa/230Th can be used in conjunction with 230Th and 231Pa ages to characterize, and potentially “see through” certain types of diagenesis.
2.4. Tests for 231Pa-230Th age concordancy Perhaps the greatest strength of 231Pa/235U data is its use in concert with 230Th-234U-
238U data in testing age accuracy (see Cheng et al. 1998). A good method for interpreting this data is through a 231Pa/235U vs. 230Th/234U concordia diagram (Fig. 4; Allegre 1964; Ku 1968; see Cheng et al. 1998). The ordinate is the key isotopic ratio for 231Pa dating and the abscissa is the key isotopic ratio for 230Th dating. Plotted parametrically is age along the locus of isotopic compositions for which 231Pa and 230Th age are identical: concordia. This plot is analogous the U-Pb concordia plot (Wetherill 1956a; 1956b) except that the 231Pa/235U vs. 230Th/234U diagram has different concordia for different initial δ234U values. If a data point plots off of concordia, the sample must have been
Figure 4. 231Pa/235U vs. 230Th/234U concordia diagram (after Cheng et al. 1998). Concordia represent the locus of isotopic compositions for which the 231Pa age (see Eqn. 4) and the 230Th age (see Eqn. 1) are equal. Two concordia curves are indicated, one for an initial δ234U = 0 and one for an initial δ234U = 1500. Age is depicted parametrically along the concordia curves (horizontal line segments). The concordia curves are analogous to U/Pb concordia curves used in zircon dating.
374 Edwards, Gallup & Cheng
altered chemically and one or both of the ages are not accurate. If a data point plots on concordia, then the sample’s isotopic composition is consistent with closed-system behavior of the pertinent nuclides. This constitutes a robust test for age accuracy.
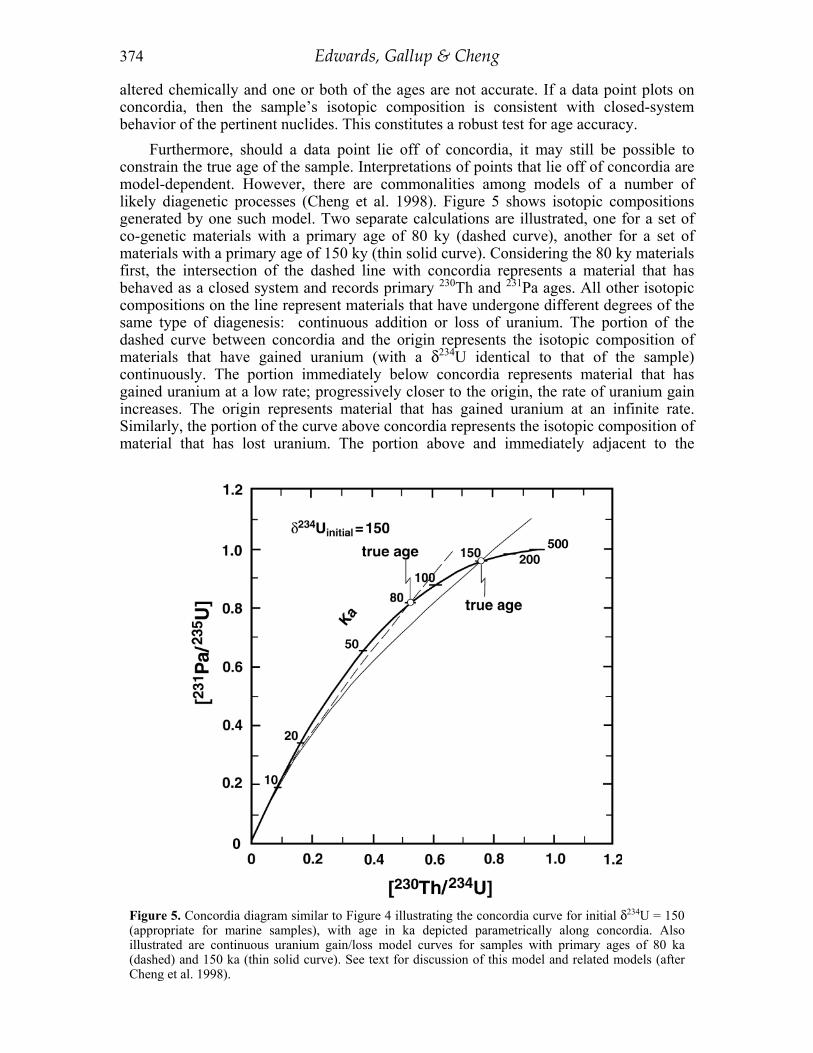
Furthermore, should a data point lie off of concordia, it may still be possible to constrain the true age of the sample. Interpretations of points that lie off of concordia are model-dependent. However, there are commonalities among models of a number of likely diagenetic processes (Cheng et al. 1998). Figure 5 shows isotopic compositions generated by one such model. Two separate calculations are illustrated, one for a set of co-genetic materials with a primary age of 80 ky (dashed curve), another for a set of materials with a primary age of 150 ky (thin solid curve). Considering the 80 ky materials first, the intersection of the dashed line with concordia represents a material that has behaved as a closed system and records primary 230Th and 231Pa ages. All other isotopic compositions on the line represent materials that have undergone different degrees of the same type of diagenesis: continuous addition or loss of uranium. The portion of the dashed curve between concordia and the origin represents the isotopic composition of materials that have gained uranium (with a δ234U identical to that of the sample) continuously. The portion immediately below concordia represents material that has gained uranium at a low rate; progressively closer to the origin, the rate of uranium gain increases. The origin represents material that has gained uranium at an infinite rate. Similarly, the portion of the curve above concordia represents the isotopic composition of material that has lost uranium. The portion above and immediately adjacent to the
Figure 5. Concordia diagram similar to Figure 4 illustrating the concordia curve for initial δ234U = 150 (appropriate for marine samples), with age in ka depicted parametrically along concordia. Also illustrated are continuous uranium gain/loss model curves for samples with primary ages of 80 ka (dashed) and 150 ka (thin solid curve). See text for discussion of this model and related models (after Cheng et al. 1998).

U-series Dating of Marine & Lacustrine Carbonates 375
concordia represents the isotopic composition of material that has lost uranium at a low rate. Points progressively higher on the curve represent progressively higher rates of uranium loss. The thin solid curve is analogous to the dashed curve, but pertains instead to a set of materials with a primary age of 150 ky.
Both of these curves approximate a line in the vicinity of concordia. This is one of the commonalities between this continuous uranium gain/loss model and a number of other open system models (e.g., instantaneous uranium gain/loss models, continuous daughter (thorium and protactinium) gain/loss models, or instantaneous daughter gain/loss models; see Cheng et al. 1998). This has led to the idea that if one can identify a set of equal-age materials affected by the same diagenetic process, but to different extents, the isotopic compositions of this set of materials should approximate a line. By extrapolating or interpolating this line to concordia, one may be able to establish the primary age of the material (see Fig. 6). This possibility exists even if the specific diagenetic process is not known, as long as the diagenetic process includes one of the modeled processes discussed above.
In the model that we illustrate (Fig. 5), points above concordia indicate continuous uranium loss and points below concordia indicate uranium gain. Models of instantaneous uranium loss/gain plot in the same sense relative to concordia. Similarly, models of instantaneous or continuous daughter loss generally (but not always depending on the ratio of lost 231Pa to lost 230Th) yield isotopic compositions below concordia, whereas models of daughter gain generally (but not always) give isotopic compositions above
Figure 6. A portion of the concordia curve for initial δ234U = 150 and four data points (Edwards et al. 1997) for coral samples from the last interglacial terrace in Barbados. The points lie along a line, and illustrate the possibility of using best-fit lines through discordant points to extrapolate to concordia and possibly the true age of a set of samples (after Cheng et al. 1998).

376 Edwards, Gallup & Cheng
concordia. Thus, isotopic compositions above concordia are consistent with uranium loss or daughter gain, whereas those below concordia are consistent with uranium gain or daughter loss. If so, isotopic compositions above concordia yield 231Pa and 230Th ages that are maximum ages, whereas those below concordia yield minimum ages. In sum, isotopic compositions that yield discordant ages place constraints on both diagenetic mechanisms and age. Isotopic compositions that yield concordant ages provide some confidence that the ages are accurate. These two statements, in a nutshell embody the power of combined 230Th-231Pa dating.
3. TESTS OF DATING ASSUMPTIONS
3.1. Are initial 230Th/238U and 231Pa/235U values equal to zero?One of the keys in 230Th and 231Pa dating is establishing initial 230Th/238U and
231Pa/235U values. Upper limits were originally placed on these ratios in surface corals by analyzing modern corals by alpha-counting techniques (Barnes et al. 1956; Broecker 1963 for 230Th/238U and Ku 1968 for 231Pa/235U). With the advent of mass spectrometric techniques, tighter bounds on initial values were needed. In this regard, the first data that suggested that initial 230Th/238U values of surface corals were extremely low were the 232Th/238U values measured by mass spectrometric techniques (Edwards et al. 1987a). The values were three orders of magnitude lower than the upper limits from the earlier alpha-counting measurements. When multiplied by typical 230Th/232Th ratios of surface sea water, these measurements yielded initial 230Th/238U values equivalent to about 1 year’s worth of radiogenic ingrowth (negligible compared to analytical errors of >2 years).
This calculation was further tested by dating portions of a coral with ages known a priori from the counting of annual density bands (Fig. 7). A plot of 230Th age calculated
Figure 7. 230Th age vs. growth band age for three coral sub-samples, all younger than 200 years old (after Edwards 1988 and Edwards et al. 1988). All three points lie on a 1:1 line indicating that the 230Th ages are accurate and that initial 230Th/238U is negligible, justifying the use of Equation (1) to determine 230Th age.

U-series Dating of Marine & Lacustrine Carbonates 377
with Equation (1) vs. band counting age (Edwards 1988; Edwards et al. 1988) for three such coral sub-samples is shown in Figure 7. Errors are indicated by boxes, with the vertical dimension equivalent to analytical error in 230Th age and the horizontal dimension equivalent to the number of annual bands encompassed by the sub-sample. Equation (1) has no term for correcting for initial 230Th. Thus, if there were significant initial 230Th, the 230Th age would be older than the band counting age. This is not the case as all three points plot within error of a 45° line, indicating that initial 230Th is not significant within errors of about 3 years. All three Figure 7 samples have 232Thconcentrations less than 100 pg/g. Thus, this study suggested that initial 230Th levels were negligible in surface corals with 232Th levels below about 100 pg/g. Subsequent work has demonstrated that most surface corals have 232Th levels of about 100 pg/g or less, leading to the conclusion that initial 230Th/238U is negligible for typical surface corals.
However, subsequent work has also shown that a small fraction of surface corals can have elevated 232Th values. 232Th levels of several hundred to 1000 pg/g have been reported from the central Pacific (Cobb et al. in review) and in extreme cases levels of several thousands of pg/g (Zachariasen 1998; Zachariasen et al. 1999) for a small subset of corals from Sumatra. For coralline samples older than several thousand years, even levels of 232Th as high as a few thousand pg/g are not likely to be associated with levels of initial 230Th that are significant compared to analytical error. However, for samples less than several thousand years old, such samples are best avoided, as initial 230Th is likely to be significant. In the very highest 232Th samples from Sumatra, the corals were visibly discolored with a brown stain, and thus could easily be identified. The stain could be partially removed in an ultrasonic bath, a procedure that also lowered 232Th levels. Thus, the thorium is associated with the discoloration, quite likely organic matter. In both the Cobb et al. (in review) and Zachariasen et al. (1999) studies, samples with the highest 232Th levels could be avoided. However, in both studies, it was important to obtain ages on coralline material with somewhat elevated 232Th levels (hundreds of pg/g). In both studies, this was accomplished using Equation (3) with 230Th/232Th determined by analyzing local corals of known age or for which there were constraints on age. In the Sumatra study, initial atomic 230Th/232Th values between 0 and 1.3 × 10 5 were determined and in the central Pacific values covered a similar range from 0 to 2.0 × 10 5,broadly consistent with values for surface seawater. In each of these studies, corrections for initial 230Th using these isotopic values were on the order of 20 years or less, even for samples with several hundred pg/g of 232Th.
In sum, for surface corals, the assumption that initial 230Th/238U values are negligible holds in most cases, satisfying one of the assumptions used in deriving Equation (1). However, in unusual cases corals younger than several thousand years may have significant initial 230Th/238U compared to analytical errors. In those cases, corrections for initial 230Th/238U can be made accurately with some knowledge of the range of possible 230Th/232Th values.
Initial 231Pa/235U levels are more difficult to assess, primarily because there is no long-lived or stable isotope of protactinium that can be used as an index isotope. Edwards et al. (1997) analyzed a set of surface coral sub-samples younger than 1000 years by both 230Th and 231Pa techniques. For all samples, 232Th concentrations were less than 100 pg/g so that initial 230Th/238U values were negligible. Each sub-sample yielded 230Th and 231Paages identical within analytical errors (Fig. 8), indicating that initial 231Pa/235U was negligible. This suggests that surface corals with typical 232Th values do not require corrections for initial 231Pa. Whether or not corals with elevated 232Th require such corrections is an open question.

378 Edwards, Gallup & Cheng
3.2. Tests of the closed-system assumption The second assumption, used in deriving Equations (1) through (4) is that the system has remained closed to chemical exchange. Testing this assumption is more difficult. A number of different approaches have been used to assess this assumption. Perhaps the most powerful of these is combined 231Pa and 230Th dating, but most of the methods discussed below play a role.
Concerns that diagenetic alteration could affect measured 230Th ages of corals have existed since the early applications using alpha-counting methods. Thurber et al. (1965) offered the following list for reliable coral 230Th ages: a) no evidence of recrystallization, b) uranium concentration of ~3 ppm, c) [230Th/232Th] of > 20, d) [234U/238U] of 1.15 ± 0.02, and e) stratigraphically consistent ages. These phenomena are still applied today, but numerical limits have changed drastically, reflecting higher precision measurement techniques and better understanding of the processes that result in primary and diagenetic values for these parameters.
Initial mineralogy, petrology, and associated elemental concentrations. Corals create an aragonitic skeleton in a seawater environment. Because sea levels are low during glacial and interstadials periods, most fossil corals have been exposed to meteoric waters for a significant portion of their post-depositional history. This exposure creates the potential for these corals to be recrystallized to the more stable calcium carbonate, calcite, by dissolution/reprecipitation reactions associated with percolating waters (Matthews 1968). X-ray diffraction is commonly used to screen for calcite, where the heights of aragonite and
Figure 8. 231Pa age vs. 230Th age for a set of corals all younger than 1000 years old (after Edwards et al. 1997). All points lie along a 1:1 line indicating that the corals record identical 230Th and 231Pa ages, suggesting that the 231Pa ages are accurate and that initial 231Pa/235U is negligible, justifying the use of Equation (4) to determine 231Pa age.

U-series Dating of Marine & Lacustrine Carbonates 379
calcite peaks of a sample are compared to the peak heights of a series of standards, from 100% calcite and 0% aragonite down to the detection limits of the instrument, usually 1-2% calcite. As Thurber et al. (1965) suggested, a measurable calcite peak indicates that the sample has been recrystallized to some degree, which suggests that the 230Th age is not reliable. However, where samples with and without detectable calcite have been measured that are from the same terrace, and presumably are the same age, there is no clear systematic effect on the 230Th age (e.g., Bloom et al. 1974). Matthews (1968) documented that the frequency of exposed coral recrystallization generally increases with coral age on Barbados. Chappell and Polach (1972) had similar results for corals from the Huon Peninsula in Papua New Guinea, but with thin section work showed that the microscopic bundles of aragonite that make up the coral skeleton become fused or thickened as recrystallization proceeds (see Figs. 9 and 10). Bar-Matthews et al. (1993) attempted to correlate such petrologic changes (where the thickening is due to secondary aragonite) with shifts in uranium-series isotopes in last interglacial corals from the Bahamas, but could find no clear correlation with the presence of secondary precipitation features and δ234U value or 230Th age. In addition, thin section work can detect precipitation of aragonite cements in pores within the coral skeleton. As aragonite cements initially have similar isotopic characteristics to coralline aragonite, the presence of aragonite cement does not necessarily pose a problem. However, if the cement has a different age than the coral skeleton, the apparent age of the coral-cement mixture will differ from the true age of the coral. Bloom et al. (1974) measured Sr and Mg concentrations as a possible measure of recrystallization of coral skeletons. Sr concentrations in calcite are less than in aragonite and high-Mg calcite has higher Mg concentrations than aragonite (e.g., Edwards 1988 for Sr and Mg measurements of cements in fossil corals). Consistent with this difference, Bloom et al. (1974) found that samples with detectable calcite had slightly lower Sr concentrations and those with high-Mg calcite had Mg concentrations ~5 times higher than aragonitic corals. Bar-Matthews et al. (1993) did not find a correlation between Sr and Mg concentrations in corals with secondary aragonite and initial δ234U value. However, they did find a distinguishable negative correlation between Na and SO3concentrations and initial δ234U value, which they interpreted as suggesting diagenetic alteration in a marine environment (many of the samples were within a few meters of sea level). This correlation has not been explored in uplifted corals that have spent most of their history many meters above sea level. Primary coralline aragonite generally has extremely low 232Th concentrations (tens of parts per trillion, Edwards et al. 1987a). Thus, 232Th values significantly higher than this indicate contamination from detrital sources, organic-thorium complexes, or unusual growth settings (e.g., Zachariasen et al. 1999; Cobb et al., in review). In some cases, limiting sample to denser portions of the coral, with little pore space and low macroscopic surface to volume ratio has proven to improve the sample in terms of a number of the measures of diagenesis (Stirling et al. 1995) discussed above and below (e.g., δ234U, 232Th content).
Initial 234U/238U. Corals incorporate marine uranium into their skeleton without isotopic fractionation. The modern marine δ234U value as measured in marine waters is 140-150 (Chen et al. 1986) and in modern corals is 145.8 ± 1.7‰ (using updated half-lives; Cheng et al. 2000b). The marine δ234U value does not vary more than the analytical error with depth or geographic location (Chen et al. 1986; Cheng et al. 2000a), consistent with the long marine residence time of uranium (200,000 to 400,000 years; Ku et al. 1977) and the long half-life of 234U, compared to the mixing time of the ocean (about 103 y). If the uranium isotopic composition of the ocean also remained constant with time, the δ234U value would add a second chronometer in the 238U decay chain for corals

380 Edwards, Gallup & Cheng
Figu
re 9
. SE
M p
hoto
grap
hs o
f po
lishe
d, e
tche
d th
in s
ectio
ns o
f m
oder
nAc
ropo
ra p
alm
ata
cora
l (a
fter
Edw
ards
198
8).
The
scal
e ba
r in
“a”
is 1
00 m
icro
ns. V
isib
le
in
“a”
are
larg
e m
acro
scop
ic
pore
s in
the
skel
eton
and
wel
l as
the
text
ure
of
the
very
fin
e ar
agon
ite
crys
tals
. “b
” is
th
e sa
me
sect
ion
as “
a” b
ut a
t hig
her
mag
nific
atio
n. T
he s
cale
bar
is
10 m
icro
ns.
Indi
vidu
al a
rago
nite
cr
ysta
l fib
ers a
re v
isib
le in
“b.
”
Figu
re 1
0. S
EM p
hoto
grap
hs o
f po
lishe
d, e
tche
d th
in s
ectio
ns o
f fo
ssil
Acro
pora
pa
lmat
a co
ral
(afte
r Ed
war
ds 1
988)
. Th
e sc
ale
bar
in “
a” i
s 10
mic
rons
. “a
” de
pict
s sa
mpl
e A
FS-1
2, a
las
t in
terg
laci
al c
oral
fro
m B
arba
dos.
The
crys
tal
mor
phol
ogy
in t
his
wel
l-pre
serv
ed
sam
ple
is
indi
stin
guis
habl
e fr
om t
hat
of a
m
oder
n sa
mpl
e (s
ee F
ig. 9
b). T
he
scal
e ba
r in
“b”
is
100
mic
rons
. “b
” de
pict
s sa
mpl
e PB
-5B
, a
foss
il co
ral c
olle
cted
fro
m N
orth
Po
int
Shel
f on
B
arba
dos.
The
crys
tal
mor
phol
ogy
of
this
sa
mpl
e sh
ows
clea
r ev
iden
ce o
f al
tera
tion,
in
clud
ing
a la
rge
calc
ite
crys
tal
fillin
g in
a
mac
rosc
opic
por
e (d
ark
area
in
uppe
r rig
ht
porti
on
of
phot
ogra
ph).
FIG
URE
9FI
GU
RE 1
0

U-series Dating of Marine & Lacustrine Carbonates 381
(Ku 1965). However, the wide range in riverine δ234U values (0 to 2000; Cochran 1982) suggests that the elevation of the marine δ234U value above secular equilibrium results from a complex combination of weathering and alpha-recoil processes (see above). Thus, it is possible that the marine δ234U value has changed by small amounts with time. In practice, the main impediment to a δ234U chronometer is the sensitivity of δ234U to diagenesis (see below).
When dating corals, there are two results when Equations (1) and (2) are solved: the 230Th age and the initial δ234U value. If all corals remained closed to diagenetic alteration, the initial δ234U value would reflect changes in the marine δ234U value with time. Early studies indicated that there is substantial variation in the initial δ234U value and that, in general, higher initial δ234U value corresponds with higher 230Th ages (Bender et al. 1979). The question was, did these variations reflect changes in the marine uranium isotopic composition or represent the effects of diagenesis?
Given that the long residence time of uranium should place limits on how much the marine δ234U value could change over Late Quaternary time scales, several workers have used models to determine what these limits should be (see Henderson and Anderson 2003). Chen et al. (1986) and Edwards (1988) used a simple one-box model and assumed steady state conditions. They showed that:
( )234
234 rss
U 234
UU =1+
(6)
where δ234Uss is the steady state marine δ234U value, δ234Ur is the average δ234U value of the input to the ocean, assumed to be rivers, τU is the residence time of uranium in the ocean, and τ234 is the mean-life for 234U. To a first approximation, the δ234Uss is ~1/2 of the δ234Ur, as the residence time of the ocean is roughly equal to the mean-life of 234U,which makes U 234 ~1. The modern ocean satisfies this equation, as the average riverine δ234U value is ~300‰ and the modern δ234U value is ~150‰. To evaluate how much the marine δ234U value could change, Edwards (1988) assumed that the input would have an instantaneous jump to a new value and showed that the transition to a new steady state marine δ234U value would be an exponential function (Henderson, 2002, has recently presented a similar equation):
( ) ( ) ( )U 2341 1 t234 234 234 234marine ss2 ss1 ss2U = U U U e− ++ − (7)
where the subscripts “1” and “2” refer to steady state marine values before and after the shift in riverine δ234U (calculated from Eqn. 6). However, for timescales short compared to 1/(1/τU + 1/τ234) (~160,000 years) the shift in the marine δ234U value can be approximated by:
( )234 234marine r UU U t≈ (8)
where the ∆δ234Umarine and the ∆δ234Ur are the shifts from their initial (steady state in the marine case) values. Thus, for a shift of a quarter of the modern-day range of δ234U for most rivers (a range of about 400‰, ∆δ234Ur = 80‰) for 50,000 years, the shift in the δ234Umarine would be ~13‰. If a 50% shift lasted 20,000 years, the shift in the δ234Umarinewould be ~10‰. Thus, Edwards (1988) concluded that the δ234Umarine should have remained within 10-20‰ of its modern value during the last several hundred thousand years.
Hamelin et al. (1991) came to similar conclusions regarding the magnitude of shifts in the δ234Umarine value caused by instantaneous shifts in the δ234Ur, using computer

382 Edwards, Gallup & Cheng
simulation as opposed to solving the specific differential equations. They also investigated periodic changes in δ234Ur and found that with a 30% shift in the value (100‰) with a 100,000 year period the change in the δ234Umarine value was only ~1% (or 10‰ if the modern δ234Umarine is used) and was out of phase with the forcing.
Richter and Turekian (1993) also assumed a simple one-box model for the ocean. They derived a set of equations with the assumption that 1) the volume of the ocean does not change, 2) mass is conserved, i.e., the change in the marine U concentration with time equals the flux in from rivers minus the flux out, and 3) that the marine U concentration does not change with time, which implies that the flux in equals the flux out. This results in the equation:
oU 234 o r
d A (1+ ) A Adt
+ =′
(9)
where δ here represents small changes in Ao, the marine uranium activity, and Ar, the average riverine uranium activity and t´ = t/τU. At steady state (dδAo/dt´=0), this reduces to Edwards’ first equation (Eqn. 6). To test the simple system’s response to periodic forcing, Richter and Turekian let Ar vary according to:
r(t ) r(0) nn n
2 tA A a sinP′
′= + (10)
where Ar(0) is the initial riverine uranium activity, an is the amplitude of the change in Ar,and Pn is the period. The results of solving Equation (9) for δAo for various an (using the most simple case, where n = 1) are shown in Figure 11 (similar to Richter and Turekian’s Fig. 3). As Richter and Turekian concluded, a change of ± 0.1 in Ar (equivalent to a change in δ234Ur of 100‰, ~30% of the modern value) would produce barely detectable changes (~5‰) in the marine uranium isotopic composition for a period of 100,000 years (similar to the Hamelin et al. results) and undetectable changes at shorter periods. They point out that 1) a change of 0.1 in Ar is equivalent to a ~25% change in the flux of uranium into the ocean, given its current isotopic composition and 2) one could include changes in the flux of uranium into the ocean in the equations as well, but, as the flux and the isotopic composition of uranium in modern rivers is generally inversely correlated, the addition would not significantly change the results. Figure 11 shows that to get clearly detectible changes (~10‰) in the marine uranium isotopic composition would require a change in Ar of 0.2 (or 200‰, ~66% of the modern value) with a period of 100,000 years or longer; to get marine changes from forcing at periods of less than 100,000 years would require even greater changes in Ar. These results are consistent with Edwards’ estimate of an outside envelope of a 10-20‰ change in the marine uranium isotopic composition on a 105-year time scale.
Within the 10-20‰ envelope, it was less clear if samples at the higher end of this range had been altered or reflected small changes in the marine δ234U value. Hamelin et al. (1991) made a histogram of initial δ234U values of apparently well-preserved last interglacial corals and showed that the mean was 160 (157 with new half-lives), ~11‰ above the modern value. However, an extensive data set of corals that grew during the last deglaciation show no deviation from the modern value at a 2σ precision of ± 1‰ (Fig. 12; Edwards et al. 1993), suggesting that glacial/interglacial changes do not affect the marine δ234U value on a 104-year time scale. What was missing was a constraint on how the diagenetic effects that lead to elevated initial δ234U values in corals affect their 230Th age.
While many models have been proposed for changes in uranium-series isotopic composition with diagenetic alteration (e.g., Hamelin et al. 1991), documentation of a

U-series Dating of Marine & Lacustrine Carbonates 383
Figure 11. Results from Richter and Turekian (1993) model (Eqns. 9 and 10) for the simplest case, where n = 1. Similar to Figure 3 in Richter and Turekian (1993), but with multiple values for an.
Figure 12. Plot of measured δ234U vs. measured [230Th/238U] for a set of samples collected from the Huon Peninsula, Papua New Guinea (after Edwards et al. 1993). Open ellipses are data for samples collected from outcrop; closed ellipses are data for samples collected from drill core. All points plot along the initial δ234U =150 contour, indicating that all samples have maintained a primary marine uranium isotopic composition, consistent with closed-system behavior. Relatively young samples such as these are more likely to satisfy the closed-system assumption whereas older corals such as those depicted in Figure 13 are not as likely to satisfy this assumption.

384 Edwards, Gallup & Cheng
correlation between initial δ234U values and 230Th ages was made possible by the extensive dating that has been done on Barbados corals. Gallup et al. (1994) demonstrated that for corals from the same terrace, and presumably the same age, δ234Uvalues and 230Th ages co-vary. This can best be observed in a plot of measured δ234U vs. [230Th/238U] (similar to Fig. 3). Figure 13 shows TIMS data for Barbados corals available in 1994, coded by terrace. For each terrace, there is a range of initial δ234U values, where the lowest value is within error of the modern marine δ234U value or above it. The data for each terrace are not randomly scattered but form a rough line that goes to higher 230Thage with higher initial δ234U value. Gallup et al. modeled this process assuming continuous addition of 230Th and 234U. In their model, the rate of addition was allowed to vary, but the ratio of 230Th to 234U addition was fixed. The value of this ratio (230Th/234U= 0.71) was chosen so that the model would reproduce the isotopic composition of VA-1 (Fig. 13) an altered coral of known age (from U/He dating, Bender et al. 1979). They integrated the differential form of the age equation, modified to include 230Th and 234Uaddition terms in the calculated ratio. This yielded an equation that describes the isotopic composition resulting from adding 234U and 230Th in a fixed ratio and to varying degrees to samples of a given true age (dashed lines on Fig. 13). These “addition lines” follow the trends in the data from each terrace, suggesting that addition is broadly continuous and that it involves both 234U and 230Th in a ratio of about 0.71. This ratio of addition corresponds to an increase of 230Th age of 1 ka for every 4‰ rise in initial δ234U value. This provided a semi-quantitative criterion for reliable 230Th ages for corals that have similar trends in isotopic composition. It has been used for corals from many areas, including the Western Atlantic (e.g., Blanchon et al. 2001), the Western Pacific (e.g., Stirling et al. 1995, 1998; Esat et al. 1999), and the Eastern Pacific (e.g., Szabo et al. 1994; Stirling et al. 2001). However, it is often difficult to demonstrate that corals have a similar diagenetic trend where there are a limited number of terraces to sample, or in some cases, such as in Papua New Guinea, corals do not seem to show the same diagenetic trend. Thus, the criterion should be used in conjunction with other measures of diagenesis.
Thompson et al. (in review) have followed up on the Gallup et al. (1994) work with additional analyses and more in depth modeling. The new coral analyses, from the same Barbados terraces, confirm the original Gallup et al. diagenetic trends. Thompson et al. surmised that 230Th and 234U addition could have taken place as 230Th and 234Thadsorption from ground water, prior to decay of 234Th (half-life = 24.1 days to 234U). Although they consider a number of possible sources for aqueous 230Th and 234Th, a likely possibility is recoil ejection from solids into solution during decay of 238U and 234U. This follows a similar idea proposed by Henderson and Slowey (2000) in the context of dating of carbonate bank sediments. Thompson et al. model 230Th and 234Uaddition on this basis. The model results are a set of calculated addition lines that are numerically similar to the Gallup et al. lines. Their model confirms the Gallup et al. suggestion of broadly continuous addition of both 234U and 230Th. Furthermore, the Thompson et al. model suggests a genetic tie to recoil phenomena. In addition, Thompson et al. suggest that their model can be used to correct ages of samples with non-marine δ234U, and term these “open-system ages.” These ages (perhaps better be termed “model ages” as they are model-dependent) essentially use a refined version of the Gallup et al. (1994) addition lines to correct for age as a function of δ234U. This approach may prove useful for certain applications. For example, the empirical trends at Barbados and elsewhere do generally increase in apparent age, with progressive increase in δ234U.Thus, (1) in localities where trends can be demonstrated to be particularly robust and (2) for scientific problems that allow significant error in age, the addition lines may provide the basis for an age correction. However, the trends observed at different localities

U-series Dating of Marine & Lacustrine Carbonates 385
Figu
re 1
3. P
lot o
f m
easu
red
δ234 U
ver
sus
230 Th
/238 U
act
ivity
rat
io (
from
Gal
lup
et a
l. 19
94)
of a
ll TI
MS
Bar
bado
s da
ta p
ublis
hed
thro
ugh
1994
(se
e G
allu
p et
al.
1994
for
ref
eren
ces)
. D
ata
are
grou
ped
by t
erra
ce,
whe
re a
ge a
nd e
leva
tion
incr
ease
fro
m l
eft
to r
ight
; no
te s
ymbo
ls a
re r
euse
d fo
r in
crea
sing
ly o
lder
terr
aces
. The
size
of t
he sy
mbo
ls ro
ughl
y re
pres
ents
the
2σ e
rror
elli
pse.
The
cur
ved
lines
are
con
tour
s of i
nitia
l δ23
4 U v
alue
(the
hea
vy
cont
our
is f
or a
n in
itial
equ
al to
the
mod
ern
mar
ine
valu
e) a
nd li
nes
with
ste
ep p
ositi
ve s
lope
are
con
tour
s of
230 Th
age
. The
are
a w
ithou
t con
tour
s re
pres
ents
isot
opic
com
posi
tions
that
are
inac
cess
ible
thro
ugh
clos
ed-s
yste
m d
ecay
. Das
hed
lines
are
234 U
-230 Th
add
ition
line
s, as
dis
cuss
ed in
the
text
, ca
lcul
ated
with
age
s of
83,
100
, 120
, 200
, 300
, and
520
ka.
With
add
ition
al d
ata
from
Bar
bado
s, Th
omps
on e
t al.
(in re
view
) hav
e co
nfirm
ed th
e lin
ear
trend
s orig
inal
ly e
stab
lishe
d by
Gal
lup
et a
l. (1
994)
. Stir
ling
et a
l. (1
998,
200
1) h
ave
obse
rved
sim
ilar t
rend
s els
ewhe
re.

386 Edwards, Gallup & Cheng
worldwide are not the same, and in general, the data points from a given terrace are not all co-linear within analytical error (Fig. 13), as required for an exact correction using either the Gallup et al. or Thompson et al. models. Thus, some diagenetic process in addition to the modeled process must affect certain samples. Recent combined 231Pa and 230Th measurements on Barbados corals bear this out (Gallup et al. 2001; Cutler et al. 2003). For example, of 14 corals all with δ234Ui values within 8 per mil of the marine value, 6 had discordant 231Pa and 230Th ages, demonstrating without ambiguity, diagenetic processes that have affected Pa, Th, and/or U, but not δ234U.
In sum, initial δ234U values place important constraints on diagenesis. We are beginning to understand some of the most important processes whereby diagenesis affects δ234U and 230Th age. However, we still do not understand a number of important aspects of this process and δ234U does not appear to respond to all diagenetic processes. This suggests that, in addition to initial δ234U considerations, we need to apply the full range of diagenetic tests.
The above analysis of Barbados corals also places constraints on the history of the marine δ234U value. Empirical evidence suggests that diagenesis generally acts to raise the δ234U value of Barbados fossil corals, which makes the lowest initial δ234U value for each terrace the best estimate of the marine value at the time the terrace was formed. This makes it possible to extend evidence for a stable marine δ234U value beyond the last deglaciation (Fig. 12; Edwards et al. 1993) to Marine Oxygen Isotope Sub-stage 5a (Fig. 13, Gallup et al. 1994), the last interglacial (Henderson et al. 1993) and the penultimate interglacial, 200,000 years ago (Fig. 13; Gallup et al. 1994). Similar arguments can be applied to coral data from East Pacific corals (Stirling et al. 2001) and aragonitic carbonate bank sediments from the Bahamas (Henderson 2002), extending evidence that the marine δ234U value has remained within error of its present value for interglacial periods in the last ~325 ka and ~360 ka, respectively. Initial U concentration. If uranium concentration has changed as a result of diagenetic reactions, one may, in principle detect this by comparison between uranium concentrations in modern corals and their fossil counterparts. Early work documenting and studying uranium concentrations in corals is extensive (e.g., Barnes et al. 1956; Tatsumoto and Goldberg 1959; Veeh and Turekian 1968; Schroeder et al. 1970; Thompson and Livingston 1970; Gvirtzman et al 1973; Amiel et al. 1973; Swart 1980; Swart and Hubbard 1982; Cross and Cross 1983). This broad body of data shows that primary surface coral uranium concentrations lie between 1.5 and 4 ppm (see Fig. 1). Concentrations appear to be species dependent (Cross and Cross 1983). Furthermore, uranium concentrations vary within individual coral skeletons (Schroeder et al. 1970; Shen and Dunbar 1995; Min et al. 1995).
Shen and Dunbar (1995) and Min et al. (1995) showed that uranium concentrations in individual skeletons and between colonies anti-correlate with sea surface temperature, with a shift in U/Ca ratio of about 4.7% per degree Celsius for Porites lobata. At the higher latitudes of the tropics and in the sub-tropics, this may result in variation in uranium concentration in excess of 20% within a single skeleton (Shen and Dunbar (1995); Min et al (1995)). Even in localities with seasonal amplitudes in temperature of one or two degrees, U/Ca varies by several percent seasonally. Thus, primary uranium concentrations in Porites lobata vary seasonally by large amounts compared to analytical errors. Because of this temperature-related variation, it is difficult to compare fossil uranium concentrations to primary uranium concentrations in detail, as the true primary concentrations are not known. On the other hand, the Shen and Dunbar (1995) and Min et al. (1995) works suggest that seasonal variation in U/Ca is a general feature of reef-building coral skeletons. Thus, a possible test for diagenetic shifts in uranium is whether

U-series Dating of Marine & Lacustrine Carbonates 387
a fossil coral maintains its primary annual variation in U/Ca ratio. Although this test has been suggested (Shen and Dunbar 1995; Min et al. 1995), it has yet to be applied, but may well become an important tool in future dating and diagenesis studies. Concordancy tests. Combined 231Pa and 230Th dating of corals provides perhaps the most rigorous test for closed-system behavior. Because mass spectrometric 231Patechniques are still fairly new and because the measurements themselves are not easy, there is still limited data of this sort. In coming years, 231Pa measurements will play a major role in assessing the accuracy of 230Th-based chronologies, such as the late Quaternary sea level curve. The few such data sets on reef-building corals include data reported by Edwards et al. (1997), Gallup et al. (2002), and Cutler et al. (2003), and Koetsier et al. (1999). These data sets have helped in establishing with high probability the accuracy of the ages of key corals that record important aspects of climate change (Gallup et al. 2002; Cutler et al. 2003). They have also demonstrated that coral samples that might otherwise be considered pristine are, in fact, altered. Data from these samples, which plot off of concordia include those that plot above concordia and those that plot below concordia. Shown in Figure 14 (Edwards et al. 1997) are a set of samples from the Huon Peninsula, Papua New Guinea (left graph) and from Barbados (right graph). The younger (around 10 ka old) Huon Peninsula samples are all on or very close to concordia suggesting that these ages are affected little by diagenetic processes. Older Huon Peninsula samples (10’s to more than 100 ka old) from the Huon Peninsula generally plot on, below, and above concordia (Cutler et al. 2003). This indicates a variety of diagenetic conditions on the Huon Peninsula can result in daughter loss/parent gain as well as daughter gain/parent loss. In general this contrasts with Barbados samples of about the same age, which have isotopic compositions that generally plot on or above concordia (Fig. 14). Thus, Barbados diagenetic processes tend to be characterized by parent loss/daughter gain. Combined 231Pa–230Th studies will be important in understanding diagenetic processes, and perhaps using this knowledge to constrain age even in cases where the data are discordant (e.g., Fig. 6). However, given our present state of knowledge regarding these issues, the most immediate benefit of these measurements is the identification, along with other tests, of material that has remained a closed to chemical exchange and therefore records accurate 230Th and 231Pa ages. The relatively small number of analyses that have been made so far indicate that concordant material can be identified and can be used to establish solid chronologies.
4. SOURCES OF ERROR IN AGE A quick glance at Equations (1) through (5) shows sources of error that contribute to
error in age, presuming that the assumptions used in calculating the equations hold (initial condition assumptions and the closed-system assumption). These include errors in the decay constants/half-lives, errors in the measurement of the pertinent isotope ratios, and in the case of Equation (3), the error in our estimate of initial 230Th/232Th. Relationships among error in half-lives, laboratory standardization procedures, and 230Th age are discussed in detail by Cheng et al. (2000b).
4.1. Errors in half-lives and decay constantsHalf-lives have typically been determined by measuring the activity (rate of decay)
of a sample containing a known number of atoms of the nuclide in question and calculating the decay constant via the equation: Nλ = a, where “a” is the measured activity. The half-lives of all of the nuclides pertinent to 230Th and 231Pa dating have been determined in this fashion. Among those that are known most precisely are those of 238U

388 Edwards, Gallup & Cheng
Figu
re 1
4. C
oral
isot
opic
dat
a fr
om th
e H
uon
Peni
nsul
a, P
apua
New
Gui
nea
(left
diag
ram
) an
d B
arba
dos
(rig
ht d
iagr
am)
plot
ted
in c
onco
rdia
dia
gram
s (a
fter E
dwar
ds e
t al.
1997
). Th
e yo
unge
r Pap
ua N
ew G
uine
a da
ta a
ll pl
ots c
lose
to c
onco
rdia
, sug
gest
ing
that
thes
e sa
mpl
es h
ave
beha
ved
as c
lose
d-sy
stem
s. Th
e rig
ht d
iagr
am in
clud
es tw
o co
ncor
dia
curv
es. T
he u
pper
cur
ve (
initi
al δ
234 U
= 1
50)
is a
ppro
pria
te f
or th
e co
ral s
ampl
es (
ellip
ses)
, whe
reas
the
low
er
curv
e (δ
234 U
= 1
800)
is
appr
opria
te f
or D
evils
Hol
e sa
mpl
es (
Ludw
ig e
t al
. 19
92;
depi
cted
by
open
rec
tang
les)
. M
any
of t
he B
arba
dos
cora
ls h
ave
conc
orda
nt is
otop
ic c
ompo
sitio
ns, s
ugge
stin
g cl
osed
-sys
tem
beh
avio
r. Th
ose
that
are
dis
cord
ant p
lot a
bove
con
cord
ia, c
onsi
sten
t with
ura
nium
loss
and
/or
daug
hter
gai
n. O
lder
sam
ples
from
Pap
ua N
ew G
uine
a (n
ot il
lust
rate
d he
re) p
lot o
n co
ncor
dia,
abo
ve c
onco
rdia
, and
bel
ow c
onco
rdia
(Cut
ler e
t al.
2003
). Th
us d
iage
netic
reac
tions
aff
ectin
g th
e Pa
pua
New
Gui
nea
sam
ples
app
ear t
o be
mor
e co
mpl
ex th
an th
ose
affe
ctin
g th
e B
arba
dos s
ampl
es.

U-series Dating of Marine & Lacustrine Carbonates 389
and 235U, with errors close to ± 0.1% at the 2σ level. For this reason an alternate method for determining half-lives of geologically important radio-nuclides has emerged (Renne et al. 1998). This method starts by establishing the age of a material very precisely using U-Pb dating. As the half-lives of 238U and 235U are known very well, they contribute little error to the age. The known-age material can then be “dated” by another method. As the age is known a priori, one can choose the decay constant as an unknown, and in some cases determine its value more precisely than in a pure laboratory study.
Ludwig et al. (1992) and Cheng et al. (2000b) have applied a similar approach to re-determination of the half-lives of some uranium-series nuclides. This method involves identifying materials that have behaved a closed systems for times long compared to the half-lives of uranium-series intermediate daughters. As such materials are in secular equilibrium, λ230 = (λ238) 238U/230Th and λ234 = (λ238) 238U/234U, where the isotope ratios are atomic ratios. In these two cases the only sources of error in the calculated λ230 and λ234 values are the error in λ238 and the error in the appropriate measured isotope ratio of the secular equilibrium material. As the error in λ238 is small, the errors in the calculated decay constants are dominated by errors in the measured isotope ratios, which in turn are dominated by uncertainty in our knowledge of isotope ratios in uranium and thorium isotopic standards. Nevertheless, errors in λ234 and λ230, determined in this fashion (Cheng et al. 2000b) are small compared to existing determinations in pure laboratory studies, and are therefore the recommended decay constant (half-life) values given in this volume (Table 1, Bourdon and Turner 2003).
Of note are the values for 230Th and 234U as the revised values postdate the development of mass spectrometric techniques for measurement of 234U and 230Th in natural materials. Data published prior to Cheng et al. (2000b) does use not use the revised values whereas data published subsequently may or may not use the new values. The revised half-lives do have a small, but significant effect on calculated 230Th ages, particularly ages older than about 100 ka. Furthermore, the new value for the 234U half-life changes δ234U values as these are calculated from measured 234U/238U atomic ratios using the secular equilibrium 234U/238U value: λ238/λ234. δ234U values calculated with the new λ234 are about 3 per mil lower than those calculated with commonly used λ234 values, hence the revised modern sea water δ234U of 145.8 ± 1.7 per mil (Cheng et al. 2000b), compared to earlier values about 3 per mil higher. In general half-lives are now known precisely enough so that their contribution to error in age is comparable to or smaller than typical errors in isotope ratios (determined with mass spectrometric techniques).
4.2. Errors in measurement of isotope ratios As discussed above, mass spectrometric techniques are the methods of choice for
measurement of nuclides pertinent to this study. They supercede earlier decay-counting techniques because of their ability to detect a much larger fraction of the nuclides of
Table 1. Preferred half life values.
Isotope Half Life (years) Decay Constant (year 1) Reference238U 4.4683 ± 0.0048 × 10⁹ 1.5513 ±0.0017 × 10 10 Jaffey et al. (1971) 235U 7.0381 ± 0.0096 × 10⁸ 9.8485 ± 0.0134 × 10 10 Jaffey et al. (1971) 234U 245,250 ± 490 2.8263 ± 0.0057 × 10 6 Cheng et al. (2000b)
230Th 75,690 ± 230 9.1577 ± 0.0278 × 10 6 Cheng et al. (2000b) 231Pa 32760 ± 220 2.1158 ± 0.0014 × 10 5 Robert et al. (1969)

390 Edwards, Gallup & Cheng
interest, thereby reducing sample size and counting statistics error by large amounts. Historical aspects of this transition are discussed by Wasserburg (2000) and Edwards (2000). In terms of precision, the capabilities of mass spectrometric measurements were clear from the very first measurements of the sort (Chen et al. 1986 for 234U; Edwards et al. 1987a for 230Th). Then, as now, the measurements were limited by counting statistics. From a practical standpoint, given typical sample sizes, natural abundances, and ionization efficiencies, measurements of 230Th and 234U are limited to 2σ precisions of about 1 per mil. For this reason, 230Th precisions have not improved by large amounts since the original mass spectrometric measurements. Precisions in 234U have improved modestly from about ± 5 per mil in the original measurements (Chen et al. 1986; Edwards et al. 1987a) to about ± 1 per mil (Edwards et al. 1993). This latter improvement resulted from modest changes to the original procedures, including removal of reflected peaks from the spectrum, changing from the single-filament graphite loading technique to the double-filament technique to stabilize the ion beam, and a modest increase in sample size to increase the number of ions counted.
Mass spectrometric measurements on corals typically result in errors in 238U, 234U,235U, and 230Th of ± 2 per mil or better (2σ), with the exception that fractional error in 230Th typically increases progressively from this value for samples progressively younger than several ka. This results from the low concentrations of 230Th in very young corals. Errors in 231Pa are typically somewhat larger than those of the other isotopes, with errors of ± several per mil, except for corals younger than a few ka.
Errors age resulting from to analytical errors are given in Figure 15. Considering 230Th ages, samples a few hundred years old have errors in age of about ± 3 years, 10,000 year-old samples have errors in age of about ± 30 years, and 100,000 year-old samples
Figure 15. Error in age vs. age, both on log scales (after Edwards et al. 1997). Each data point represents data from a particular sample analyzed by thermal ionization mass spectrometric techniques. Solid circles represent 231Pa ages. Contours of analytical error in 231Pa/235U pertain to the 231Pa data points. Shaded squares represent 230Th ages. See text for discussion.

U-series Dating of Marine & Lacustrine Carbonates 391
have errors in age of ± 1 ka. Samples as young as 3 years have ages distinguishable from zero and samples as old as 700 ka have ages distinguishable from infinity. Considering 231Pa ages, samples younger than 1000 years have errors in age of several to 10 years, 10,000 year-old samples have errors in age of several tens to 100 years, and 100,000 year-old samples have errors in age of a few ka. Samples as young as 7 years have ages distinguishable from zero and samples as old as 250 ka have ages distinguishable from infinity. In sum, 230Th ages can be measured precisely for materials younger than about 600,000 years, and 231Pa analyses can be used to test the closed system assumption and age accuracy over the past 250,000 years.
4.3. Error in initial 230Th/232ThErrors in 230Th/232Th only contribute to error in 230Th if the initial 230Th term in
Equation (3) ([232Th/238U] [230Th/232Th]i e λ230t) is significant compared to measured [230Th/238U]. As discussed above, this term is insignificant for most surface corals and can be ignored, along with any error in this term. However, for some of the unusual samples from the central Pacific (Cobb et al. in review) and Sumatra (Zachariasen et al. 1999) this term is significant and errors in age are limited not by analytical error, but instead by the ability to constrain the 230Th/232Th values to a specific range. Although not generally a source of error for surface corals, error in initial 230Th/232Th is more likely to contribute error in 230Th ages of some of the other marine or lacustrine materials discussed below.
5. LATE QUATERNARY SEA LEVELS FROM CORAL DATING One of the real successes of 230Th dating (and to a lesser degree 231Pa dating) has
been its application to the study of sea level change and the causes of the Quaternary glacial cycles. Early work in this area suggested that sea level followed Milankovitch cycles (Broecker et al. 1968; Mesolella et al. 1969). The degree to which this relationship holds and the details of this relationship have been the subject of intense research ever since. The development of mass spectrometric techniques for determining 230Th ages promised to resolve some of these issues. Some of that promise has been realized and more will be forthcoming. Some of the delay has resulted from our incomplete knowledge of diagenetic processes and the fairly recent development of high precision 231Pa techniques. Nevertheless a picture is beginning to emerge from coral dating efforts, in which glacial cycles are partly forced by changes in orbital and rotational geometry, but also respond to other factors, including those responsible for millennial-scale change and perhaps atmospheric CO2 values. In addition, the timing and rates of sea level change during both glaciation and melting have been established for certain times, and bear on the causes of glaciation and melting. A more extensive review of late Quaternary sea level studies can be found in Edwards et al. (2003).5.1. Deglacial sea level
One of the major successes of high-precision 230Th dating has been the establishment of a detailed deglacial sea level history (Fig. 16). This has been accomplished directly and indirectly through 230Th dating of corals. One of the main impediments has been the difficulty in recovering sequences of corals that formed during times of low sea level. Fairbanks (1989) first overcame this problem by drilling offshore near Barbados, recovering the full deglacial sequence back to the Last Glacial Maximum (LGM), and dated the corals with 14C techniques. Because the 14C timescale was not yet calibrated in the deglacial time range, the curve was not yet on an absolute timescale. Bard et al. (1990a) dated the same sequence using 230Th techniques. Combined with the 14C data, this yielded an absolute deglacial sea level curve and a 14C calibration. Chappell and Polach (1991) and

392 Edwards, Gallup & Cheng
Edwards et al. (1993) obtained a similar sequence of corals by drilling on land into the uplifted deglacial sequence on the Huon Peninsula, Papua New Guinea. Corals were recovered from the portion of deglacial sequence subsequent to 14 ky B.P. 230Th and 14Cdating confirmed and increased the resolution of the Barbados results, both in terms of sea level and 14C calibration (Edwards et al. 1993). Similar studies from Tahiti (Bard et al. 1996a) and additional work from the Huon Peninsula (Cutler et al. 2003) have largely confirmed the earlier work. In addition, based in large part upon the 14C calibration work in the 230Th-based coral studies, additional 14C-based sea level studies have contributed further sea level information (Hanebuth et al. 2000; Yokayama et al. 2000). The combined data (Fig. 16) show that sea level reached a minimum during the LGM between 20 and 22 ky ago. The rate of subsequent sea level rise was not constant, with relatively rapid rise (melt water pulses) at about 19 ky, between 15 and 14 ky and at about 11 ky, with intervals of little or no rise in sea level immediately before each of these pulses. The latter two of these low sea level rise-melt water pulse pairs correspond
Figure 16. Direct sea level data (23 ky to present) from the indicated references. The data from different sites generally agree, suggesting that different far-field sites have not been affected differentially by isostatic effects. Note also the apparent rapid rises (melt water pulses) in sea level at about 19 ky, 14.6 ky, and 11 ky. The latter two correspond to times of abrupt rise in Greenland temperature (Dansgaard et al. 1993) and East Asian Monsoon intensity (Wang et al. 2001), supporting the idea that sea level can be affected by millennial-scale events. The general rise in sea level observed in this figure corresponds in time to an interval of relatively high insolation at high northern latitudes during summer (see Fig. 17), relatively low insolation at low northern latitudes during winter, and relatively low northern latitudinal gradients during winter. Thus, this curve demonstrates correlations between orbital geometry and sea level, as well as millennial-scale climate change and sea level.

U-series Dating of Marine & Lacustrine Carbonates 393
to distinct climate events recorded as temperature change in Greenland ice (Dansgaard et al. 1993) and as change in the intensity of the East Asian Monsoon in Chinese Caves (Wang et al. 2001). The most recent pair corresponds to the Younger Dryas and the warming at the end of the Younger Dryas whereas the earlier of the two pairs corresponds to the interval prior to the Bolling-Allerod and the transition into the Bolling-Allerod. Most the most recent deglaciation took place during a time of increasing summer insolation in the high northern latitudes. Thus, the detailed deglacial sea level curve demonstrates sea level response to both insolation and to millennial-scale climate change (e.g., Younger Dryas, Bolling-Allerod).
5.2. Sea level during the last interglacial/glacial cycle and earlier Figure 17 summarizes coral sea level data since the last interglacial period and illustrates the current state of sea level reconstructions over the timescale of a full glacial-interglacial cycle. The inset in part b shows all available 230Th data coded so that solid points have initial δ234U values within 8 per mil of the marine value and open points have non-marine δ234U. There are clear inconsistencies for the complete dataset, as well as some inconsistencies for the subset of data with marine δ234U values, likely caused by diagenesis. If the dataset is screened further, largely on the basis of 231Pa-230Th concordancy (see Cutler et al. 2003 for details), one obtains a self-consistent dataset, albeit with a limited number of points (Fig. 17b, main portion). The curve shows a clear correlation with high northern latitude summer insolation, supporting the idea that a significant portion of sea level variability results from changes in orbital geometry. The curve also constrains the rate of sea level drop for specific times during the last glacial cycle. The largest and most rapid drop took place between 76 and 71 ky, when sea level dropped 60 m at a rate in excess of 10 m/ky. This and other times of sea level fall correspond to times of low summer insolation at the high northern latitudes, supporting the conventional view of the Milankovitch Theory. However, these intervals also correspond to times of high winter insolation at low northern latitudes and high winter insolation gradients between low and high northern latitudes. These relationships suggest that glacial growth may have been facilitated by high water vapor pressures in the atmospheric source areas for glacial ice, coupled with efficient moisture transport. Thus, insolation clearly has played a role in controlling sea level, from a number of different perspectives. Further support for insolation control of sea level comes from a large number of studies employing mass spectrometric 230Th dating of corals, carbonate bank sediments, and speleothems, including dating of Marine Oxygen Isotope Stage 5a (e.g., Edwards et al. 1987b, Li et al. 1991; Gallup et al. 1994; Richards et al. 1994; Ludwig et al. 1996; Edwards et al. 1997; Toscano and Lundberg 1999; Cutler et al. 2003), the Last Interglacial high stand (e.g., Edwards et al. 1987a,b, 1997; Li et al. 1989; Bard et al. 1990b, Chen et al. 1991; Henderson et al. 1993; Zhu et al. 1993; Collins et al. 1993a,b; Stein et al. 1993; Muhs et al. 1994, 2002; Szabo et al. 1994; Gallup et al. 1994; Stirling et al. 1995, 1998; Slowey et al. 1996; Eisenhauer et al. 1996; Esat et al. 1999; McCulloch et al. 2000; Cutler et al. 2003), the Penultimate Interglacial high stands (e.g., Li et al. 1989, Bard et al. 1991; Gallup et al. 1994; Lundberg and Ford 1994; Richards 1995; Slowey et al. 1996; Bard et al. 1996b; Edwards et al. 1997; Robinson et al. 2002; Bard et al. 2002), and earlier interglacial periods (Richards 1995; Stirling et al. 2001). However, there is mounting evidence for sea level change that cannot be caused directly by insolation forcing. In addition to the deglacial evidence for millennial-scale changes in sea level, Chappell (2002) has demonstrated millennial-scale variation in sea level, with an amplitude of about 40 m, during Marine Isotope Stages 3 and 4. The frequency of these changes is much higher than orbital frequencies and cannot result directly from insolation changes. Furthermore, there is now mounting evidence that Termination II sea level rise

394 Edwards, Gallup & Cheng
preceded high northern latitude summer insolation rise (Stein et al. 1993; Broecker and Henderson 1998; Henderson and Slowey 2000; Gallup et al. 2002). The cause of this apparent early rise is not clear; however, possibilities include insolation changes other than high northern latitude changes, indirect insolation forcing modulated by glacio-isostatic factors, a response to atmospheric CO2 rise, or a tie to millennial-scale changes. In sum, uranium-series dating of corals and other marine carbonates have demonstrated that sea level responds directly to changes in insolation resulting from changes in orbital geometry. There is also strong evidence that sea level responds to other processes, such as those responsible for millennial-scale climate change, changes in atmospheric CO2levels, and/or insolation forcing modulated in some fashion.
6. DATING OF OTHER MARINE AND LACUSTRINE MATERIALS 6.1. Deep sea corals
Deep sea corals are known to live at depths ranging from 60 to 6000 m. Deep sea corals with aragonitic skeletons have uranium concentrations similar to surface corals. Although the literature on uranium-series dating of deep-sea corals is very limited compared to that on surface corals, both mass spectrometric 230Th ages (Smith et al. 1997; Adkins et al. 1998; Mangini et al. 1998; Lomitschka and Mangini 1999; Cheng et al. 2000a; and Goldstein et al. 2001) and 231Pa ages (Goldstein et al. 2001) have been determined on deep-sea corals. Deep sea corals are of great importance because they are
Figure 17 (on facing page). Coral sea-level record (after Cutler et al. 2003) compared to insolation (Berger 1978) and benthic δ18O records (Shackleton et al. 1983). a.) 65°N summer half-year insolation curve. Gray bars delineate periods of rapid sea-level fall. (left inset) Winter half-year insolation gradients: top curve is 35-50°N, middle is 50-65°N, and bottom is 20-35°N. (right inset) 15°N winter half-year insolation curve. b.) Coral sea-level record. Circles in inset are data from Edwards 1988; Bard et al. 1990a,b; 1996a; Chen et al. 1991; Edwards et al. 1993; 1997; Stein et al 1993; Collins et al. 1993; Szabo et al. 1994; Gallup et al. 1994; Stirling et al. 1995; 1998; Ludwig et al. 1996; Chappell et al. 1996; Esat et al. 1999; Toscano and Lundberg 1999; Cabioch and Ayliffe 2001; Yokoyama et al. 2001; and Cutler et al 2003. Data presented in main portion of (b) are a subset of the samples from the inset, which show no evidence of diagenesis (see Cutler et al. 2003). Triangles are from Cutler et al. 2003; circles from earlier publications. Papua New Guinea samples are upright and Barbados samples inverted. Light gray symbols are data that satisfy both concordancy and δ234U criteria (see Cutler et al. 2003). Solid black symbols are a subset of the data that satisfy one of the two criteria (see Cutler et al. 2003). Replicate samples were combined using a weighted average and error bars are 2σ (if not visible, they are smaller than the symbol). Boxes enclose samples older than 15 ky of the genus Acropora,known to track sea level closely. Black bars give the duration of MIS 5e sea-level high according to the δ234Ui-screened, coral data sets of Stirling et al. (1995, 1998; upper) and Chen et al. (1991; lower). The dark gray curve provides Cutler et al.’s best estimate of past sea-level change. The portion of the curve immediately before the Last Interglacial (no data shown) is based on data from Gallup et al. (2002). Numbers give average rates of sea-level fall for each of 4 sea level drops. The inset shows all coral sea-level data presently available for times subsequent to the Last Interglacial period, measured with high-precision 230Th dating methods. Solid symbols represent samples having δ234Ui values that match the modern marine value, open symbols represent samples that do not. c.) Benthic δ18O record for Carnegie Ridge core V19-30 (Shackleton et al. 1983). Numbers are marine oxygen isotope sub-stages. Dotted tie lines match similar features in the coral and δ18O records. Note that sea-level broadly correlates with 65oN summer insolation and broadly anti-correlates both with winter insolation at low latitudes (15oN)of the northern hemisphere and with latitudinal insolation gradient during northern hemisphere winters. This observation supports the idea that a number of aspects of orbitally-controlled insolation change affect sea level. Not shown are high-resolution, high-frequency sea level changes during Marine Isotope Stage 3 and 4 (Chappell 2002), indicating response of sea level to millennial-scale events. Note also high sea level at about 135 ky, preceding the rise in insolation during Termination II (see Henderson and Slowey 2000 and Gallup et al. 2002). This suggests that the beginning of Termination II was not forced directly by insolation changes.

U-series Dating of Marine & Lacustrine Carbonates 395
Figure 17. (caption on facing page)

396 Edwards, Gallup & Cheng
one of a very limited number of archives that record deep-sea conditions at very high resolution. For example, individuals of the deep sea coral species, Desmophyllum cristagalli live for on the order of a century or two (Cheng et al. 2000a) and can be sampled at sub-decadal resolution for many proxies. One of the goals of all of the deep-sea coral studies referenced above has been to characterize some aspect of deep ocean circulation and the timing of changes in deep ocean circulation. The principles of 230Th and 231Pa dating of deep-sea corals are the same as those of surface corals. However, the correction for initial 230Th/238U and 231Pa/235U is generally significant for deep sea corals and the error in the age is generally limited by our ability to quantify initial values for these isotope ratios. This stems from the fact that (1) 230Th/232Th values, 230Th concentrations, and 231Pa concentrations generally increase with depth in the oceans and (2) deep sea corals generally age in the presence of sediments with high 230Th and 231Pa contents, having scavenged these nuclides from the water column. Often the surfaces of deep sea coral skeletons are covered with Mn oxide-rich crusts mixed with detrital sediments. Chemical cleaning techniques (modifications of those used by Shen and Boyle 1988) can remove almost all of this material (Cheng et al. 2000a). Nevertheless, typically fossil deep sea corals have 232Th concentrations (several hundred to thousands of pg/g) significantly higher than their surface counterparts. As the 230Th/232Th ratio of this thorium is also significantly higher than that for surface corals, the initial 230Th term ([232Th/238U] [230Th/232Th]i (e λ230t)) in Equation (3) is generally significant. Thus, all of the principles and issues discussed for surface corals apply to deep-sea corals, with the added requirement that initial levels of 230Th and 231Pa must be carefully quantified. The following strategies for minimizing the error in the {[232Th/238U] [230Th/232Th]i(e λ230t)}-term have been applied. Chemical cleaning techniques can remove much of the thorium and protactinium on surfaces, lowering 232Th/238U dramatically. Potentially, modifications of cleaning procedures can further reduce 232Th levels. 230Th/232Th values have been determined with isochron techniques and by analyzing young samples. Cheng et al. (2000a) determined a 230Th/232Th value of (85 ± 80) × 10 6 for a suite of corals, largely from the Atlantic. Using isochron techniques, Goldstein et al. (2001) determined a 230Th/232Th value within the Cheng et al. range for a Southern Ocean sample. Goldstein et al. (2001) also applied a two component mixing model to correct for initial 231Pa/235U, in essence using 232Th as an index isotope of protactinium and isochron techniques. After correcting for initial 231Pa/235U and 230Th/238U, they were able to obtain a concordant age on a 16 ka sample from the Southern Ocean. In sum, by using cleaning techniques and carefully characterizing initial isotope ratios, ages with errors approaching those of surface corals can be obtained for some deep sea coral samples (e.g., ± several to 10 years for samples that are few hundred years old and ± 100 to 400 years for samples that are between 10 and 20 ka old).
6.2. Carbonate bank sediments Given the high uranium and generally low Th concentrations of aragonite
precipitated biogenically from shallow seawater, carbonate bank sediments, which are dominated by fine aragonite needles formed by Halimeda algae, are good targets for U-series dating. Halimeda lives on shallow banks and breaks into fine aragonite needles after death, which then accumulate on the shallow banks and are also transported to nearby basins (Glaser and Droxler 1991). Early efforts to date such sediments were mixed (Slowey et al. 1995; Gallup et al. 1995). Attempts to date sediment from the Nicaragua Rise in the Walton Basin were unsuccessful (Gallup 1997) because the sediments were deposited in 900 to 1100 m of water (Droxler et al. 1991), resulting in a long settling path that resulted in high Th concentrations (232Th from 0.2 to 0.6 ppm) due

U-series Dating of Marine & Lacustrine Carbonates 397
to adsoption of Th in the water column. Washing and leaching techniques were unable to remove this adsorbed thorium and it did not appear to be of a uniform composition that would allow a correction to be made (Gallup 1997).
However, the Slowey et al. (1995) work on shallower carbonate bank sediments (off of the Bahamas) was successful and led to the dating of a number of important events in the marine oxygen isotope record (including the timing of the Last Interglacial (Slowey et al. 1996), Termination II (Henderson and Slowey 2000) and portions of the Penultimate Interglacial (Slowey et al. 1996, Robinson et al. 2002). The shallower depths obviate the most serious of the initial thorium problems encountered in the Nicaragua Rise work.
However, the quantification of initial 230Th values was still the most important hurdle in establishing precise and accurate ages. Carbonate deposition rates are much higher during interglacial periods as compared to glacial periods. Thus, the fraction of detrital material (along with the 230Th contained in the detrital component) is higher during glacial periods and lower during interglacial periods. Because of the relatively low initial 230Thconcentrations in interglacial sediments, bulk sediment dating is possible (Slowey et al. 1996; Robinson et al. 2002). In this case initial 230Th is quantified using a variant of Equation (3), using two initial 230Th terms, one for 230Th in the detrital fraction, one for 230Th in the marine (also referred to as “hydrogeneous” or “adsorbed”) fraction. The fraction of 232Th associated with the detrital component is determined from the aluminum concentration and reasonable estimates of the Al/232Th ratio in the detrital component. The detrital 230Th is then determined using estimates of the 230Th/232Th ratio in the detrital component. The 232Th in the marine component is determined from the difference between measured bulk 232Th and calculated detrital 232Th. The marine or hydrogenous 230Th is then calculated using an estimate of the marine 230Th/232Th ratio. Using this method, fractional errors in initial 230Th are large. However, for interglacial sediments with low initial 230Th, the contribution to error in age is small. Therefore, this bulk sediment approach has been successful in dating Last Interglacial (Slowey et al. 1996) and Penultimate Interglacial (Slowey et al. 1996; Robinson et al. 2002) bank sediments.
Because of higher initial 230Th contents, different techniques were necessary to date Termination II carbonate bank sediments (Henderson and Slowey 2000). In this case, the detrital fraction was quantitatively removed with washing techniques. Aragonite and calcite fractions were then separated with heavy liquid techniques. The carbonate fractions were then used to obtain ages using isochron techniques. However, patterns in the uranium-isotopic composition of the sediments made it clear that an additional correction was necessary. While the bulk sediment gave a δ234U value consistent with the isochron age, subsamples upon which the isochron were based did not. This suggested mobility of uranium-series isotopes within the sediment column, which the authors attributed to recoil processes. A model of this process made it possible to correct for this mobilization by assuming that the subsample should have a δ234U value consistent with the isochron age. The resulting corrected isochron ages have a precision of ~3 ka and agree with ages for the penultimate deglaciation determined by combined 231Pa and 230Thmethods on Barbados corals (Gallup et al. 2002).
6.3. Mollusks and foraminifera Whereas surface corals, deep sea corals, inorganically precipitated marine aragonite, and algal-precipitated aragonite all have U/Ca ratios within a factor of a few of sea water (e.g., Fig. 1 for surface corals), and consequently uranium concentrations in the ppm range, most biologically precipitated minerals have much lower U/Ca ratios. Mollusks and forminifera are good examples of the latter. Low U/Ca ratios in and of themselves do not preclude 230Th or 231Pa dating. Present analytical techniques have sufficient sensitivity to

398 Edwards, Gallup & Cheng
date low U/Ca materials precisely. However, it has been demonstrated that both mollusks and forams pick up and exchange uranium diagenetically, precluding their use for 230Th or 231Pa dating, unless the history of uranium uptake and exchange can be determined. Broecker (1963) first documented low uranium concentrations in modern mollusks, reporting values in the range of 10 ng/g. Edwards et al. (1987b) published a value about a hundred times lower (75 pg/g) from the aragonitic portion of a giant clam shell (see Fig. 1). The Broecker (1963) values and the Edwards et al. (1987b) value are all well below uranium concentrations of fossil mollusks, which typically lie in the 100’s of ng/g to µg/grange. Thus, uranium in fossil mollusks is virtually all diagenetic, violating one of the main assumptions used in solving the 230Th and 231Pa age equations. Two key early studies (Szabo and Rosholt 1969; Kaufman et al. 1971) evaluated 230Th and 231Pa dating of mollusks. Both documented a diagenetic origin for uranium. Szabo and Rosholt (1969) proposed an open system model for determining molluscan ages using combined 230Th-231Pa analyses. Kaufman showed that even with combined 230Th-231Pa analyses, general models for uranium uptake could not be used to accurately determine the true age. Given these studies, there is little possibility that even combined 230Th-231Pa analyses will yield ages similar in precision and accuracy to ages of most of the other materials discussed here. However, there may be a glimmer of hope for using combined 230Th-231Paanalyses to at least constrain ages in some fashion. The sensitivity of mass spectrometric methods may allow focused 230Th-231Pa studies that constrain local diagenetic processes and age. Such studies might require numerous analyses of groups of shells from the same stratigraphic horizon or multiple analyses of the same shell, and would only be worthwhile if broad age constraints on the particular deposit would be of importance. Dating of forams is perhaps even less viable than dating of mollusks. Forams are similar to mollusks in that primary uranium concentrations are low. Ku (1965) showed that calcitic forams have uranium concentrations of about 20 ng/g, about 100 times lower than corals. Delaney and Boyle (1983), Henderson and O’Nions (1995), and Russell et al. (1996) obtained more extensive data, all broadly within this range of tens of ng/g. In addition to their low uranium concentrations, forams have the disadvantage of being associated with deep sea sediments that have high 230Th concentrations scavenged from the water column above. Delaney and Boyle (1983) showed that even after chemical cleaning techniques were applied, foram samples had [230Th/234U] values in excess of 1 (plot in the “altered” portion of Fig. 3), and therefore had undergone diagenetic addition of 230Th, violating the closed system assumption. Henderson and O’Nions (1995) showed that chemically cleaned foram samples had both elevated uranium concentrations and elevated δ234U values, indicating diagenetic addition and likely exchange of uranium, again violating the closed system assumption. Thus, direct 230Th dating of forams is not presently possible.
6.4. Lacustrine carbonates Lacustrine carbonates with relatively high uranium concentrations include tufas and
inorganically precipitated calcite and aragonite sediments, sometimes rich in organic matter. As with deep sea corals and aragonite bank sediments, the basic dating principles are the same as for surface corals. As with deep sea corals and aragonite bank sediments the initial 230Th term ([232Th/238U] [230Th/232Th]i (e λ230t) term in Eqn. 3) is generally significant. This results from the general association of the carbonates with detrital sediments containing significant levels of thorium. As a consequence isochron techniques are often necessary when dating lacustrine carbonates. Because uranium residence times in lakes are much shorter than in the ocean, lacustrine uranium concentrations and uranium isotopic compositions vary from lake to lake and temporally. Thus, neither initial δ234U values nor uranium concentrations yield information about possible

U-series Dating of Marine & Lacustrine Carbonates 399
diagenetic reactions, as they would in the marine realm. Because these tools are not available for testing the closed system assumption, future work may well move toward combined 230Th-231Pa dating for tests of the sort. At present only 230Th dating, typically using isochron techniques, has been applied to this sort of sediment. Early work on lacustrine tufas was done by Kaufman and Broecker (1965). This work characterized times of relatively moist climate in the western U.S., and is also one of the first papers to place constraints on Pleistocene atmospheric 14C levels. Lin et al. (1996) followed up on this work using modern techniques and carefully characterizing two different initial thorium components, detrital thorium with low 230Th/232Th values and hydrogenous thorium with higher 230Th/232Th values. Israelson et al. (1997) dated Holocene bulk lake sediment, which was composed of organic-rich carbonate. They were able to obtain 230Th ages without large initial 230Th corrections because of extremely high uranium concentrations in their samples (up to 76 ppm). Schramm et al. (2000) analyzed an extensive sequence of aragonitic lacustrine sediments deposited from Lake Lisan, the last glacial analogue of the Dead Sea. This study is one of a very limited number of studies that constrains atmospheric 14C levels over the first half of the radiocarbon time range. Hall and Henderson (2001) dated early Holocene carbonate lake sediments from Antarctica using detailed isochron techniques. They showed that 14C dating in these lakes was not viable because of large reservoir effects. In addition to dating of lacustrine carbonates, some recent studies have applied 230Th techniques to the dating of lacustrine salts, using the same principles discussed above. As with lacustrine carbonates, isochron approaches are necessary. One such study elucidates the timing of climate change over the last two glacial cycles from Death Valley sediments (Ku et al. 1998), whereas another study characterizes climate change in northern Chile over the last glacial cycle (Bobst et al. 2001). Additional studies such as these are needed in order to characterize and understand climate change on glacial-interglacial time scales at continental sites.
7. CONCLUSIONS As 230Th and 231Pa dating are among few methods available for dating natural materials that formed in the past 600,000 years, these methods play an important role in the Earth Sciences. In addition to the ongoing efforts to characterize sea level, these methods have been important in, calibrating the 14C time scale, characterizing recent tectonic movement, characterizing ocean circulation changes, and characterizing climate change. The 14C calibration literature can be accessed through references cited in Beck et al. (2001). Although the 230Th and 231Pa dating literature is extensive and this field has made major contributions to the Earth Sciences, major questions remain. For example, there are still major questions regarding the Late Quaternary sea level curve that may require combined 230Th–231Pa techniques to resolve (see Cutler et al. 2003). There are major questions regarding 14C calibration, which again will likely required combined 230Th–231Pa techniques to resolve (see Beck et al. 2001). These and other important problems will likely be tackled using combined 230Th–231Pa dating, and to some degree relying on new inductively-coupled plasma mass spectrometric techniques for increasing throughput and in some instances modestly enhancing precision (see Stirling et al. 2001; Shen et al. 2002; Stirling and Goldstein 2003).
ACKNOWLEDGMENTS We thank G. Henderson and C. Stirling for careful reviews of an earlier version of
this manuscript. This work was supported in part by National Science Foundation Grant ESH 9809459.

400 Edwards, Gallup & Cheng
REFERENCES Adkins JF, Cheng H, Boyle EA, Druffel ERM, Edwards RL (1998) Deep-sea coral evidence for rapid
change in ventilation of the deep north Atlantic at 15.4 ka. Science 280:725-728 Allegre MC (1964) De l’extension de la méthode de calcul graphique Concordia aux mesures d’âges
absolus effectués à l’aide du déséquilibre radioactif. Cas des minéralisations secondaires d’uranium. Note (*) de. C. R. Acad. Sc. Paris, t. 259 p. 4086-4089
Amiel AJ, Miller SD, Friedman GM (1973) Incorporation of uranium in modern corals. Sedimentology 20:523-528
Bacon MP, Anderson RF (1982) Distribution of thorium isotopes between dissolved and particulate forms in the deep sea. J Geophys Res 87:2045-2056
Bar-Matthews M, Wasserburg GJ, and Chen JH (1993) Diagenesis of fossil coral skeletons - correlation between trace-elements, textures, and U-234/U-238. Geochim Cosmochim Acta 57(2):257-276
Bard E, Antonioli F, Silenzi S (2002) Sea-level during the penultimate interglacial period based on a submerged stalagmite from Argentarola Cave (Italy) Earth Planet Sci Lett 196:135-146
Bard E, Fairbanks RG, Hamelin B, Zindler A, Chi Trach H (1991) Uranium-234 anomalies in corals older than 150,000 years. Geochim Cosmochim Acta 55:2385-2390
Bard E, Hamelin B, Fairbanks RG (1990b) U-Th ages obtained by mass spectrometry in corals from Barbados: sea level during the past 130,000 years. Nature 346:456-458
Bard E, Hamelin B, Arnold M, Montaggioni L, Cabioch G, Faure G, Rougerie F (1996a) Deglacial sea-level record from Tahiti corals and the timing of global meltwater discharge. Nature 382:241-244
Bard E, Hamelin B, Fairbanks RG, Zindler A(1990a) Calibration of 14C time scale over the last 30,000 years using mass spectrometric U-Th ages from Barbados corals. Nature 345:461-468
Bard E, Jouannic C, Hamelin B, Pirazzoli P, Arnold M, Faure G, Sumosusastro P, Syaefudin (1996b) Pleistocene sea levels and tectonic uplift based on dating of corals from Sumba Island, Indonesia. Geophys Res Lett 23:1473-1476
Barnes JW, Lang EJ, Potratz HA (1956) The ratio of ionium to uranium in coral limestone. Science 124:175-176
Bateman H (1910) The solution of a system of differential questions occurring in the theory of radioactive transformations. Proc Cambridge Phil Soc 15:423-427
Bender ML, Fairbanks RG, Taylor FW, Matthews RK, Goddard JG, and Broecker WS (1979) Uranium-series dating of the Pleistocene reef tracts of Barbados, West Indies. Geol Soc Amer Bull 90:577-594
Berger AL (1978) Long-term variations of caloric insolation resulting from the earth’s orbital elements. Quat Res 9:139-167
Beck JW, Richards DA, Edwards RL, Smart PL, Donahue DJ, Hererra-Osterheld S, Burr GS, Calsoyas L, Jull AJT, Biddulph D ( 2001) Extremely large variations of atmospheric C-14 during the last glacial period. Science 292:2453-2458
Bischoff JL, Fitzpatrik JA (1991) U-series dating of impure carbonates: An isochron technique using total-sample dissolution. Geochim Cosmochim Acta 55:543-554
Blanchon P, Eisenhauer A (2001) Multi-stage reef development on Barbados during the last interglaciation. Quat Sci Rev 20(10):1093-1112
Bloom AL, Broecker WS, Chappell JMA, Matthews RK, Mesolella KJ (1974) Quaternary sea level fluctuations on a tectonic coast: new 230Th/234U dates on the Huon Peninsula, New Guinea. Quat Res 4:185-205
Boltwood BB (1907) Note on a new radio-active element. Amer J Sci 24:370-372 Broecker WS (1963) A preliminary evaluation of uranium series inequilibrium as a tool for absolute age
measurements on marine carbonates. J Geophys Res 68:2817-2834 Broecker WS, Henderson GM (1998) The sequence of events surrounding Termination II and their
implications for the cause of glacial-interglacial CO2 change. Paleoceanography 13:352-364 Broecker WS, Peng T-H (1982) Tracers in the Sea. Eldigio, Palisades, NY, 1982 Broecker WS, Thurber DL, Goddard J, Ku TK, Matthews RK, Mesolella KJ (1968) Milankovich
hypothesis supported by precise dating of coral reefs and deep sea sediments. Science 159:297-300 Cabioch G, Ayliffe, LK (2001) Raised coral terraces at Malakula, Vanuatu, southwest Pacific, indicate high
sea level during Marine Isotope Stage 3. Quat Res 56:357-365 Chabaux F, Riotte J, Dequincey O (2003) U-Th-Ra fractionation during weathering and river transport. Rev
Mineral Geochem 52:533-576 Chappell J (1974) Geology of coral terraces, Huon Peninsula, New Guinea: A study of Quaternary tectonic
movements and sea-level changes. Geol Soc Am Bull 85:553-570 Chappell J (1996) Reconciliation of late Quaternary sea levels derived from coral terraces at Huon
Peninsula with deep sea oxygen isotope records. Earth Planet Sci Lett 141:227-236

U-series Dating of Marine & Lacustrine Carbonates 401
Chappell J (2002) Sea level changes forced ice breakouts in the Last Glacial cycle: new results from coral terraces. Quat Sci Rev 21:1229-1240
Chappell J Polach H (1991) Post-glacial sea-level rise from a coral record at Huon Peninsula, Papua New Guinea. Nature 349:147-149
Chappell JC, Polach H (1972) Some effects of partial recrystallization on 14C dating Late Pleistocene corals and mollusks. Quat Res 2:244-252
Chen JH, Edwards RL, Wasserburg GJ (1986) U-238, U-234, and Th-232 in seawater. Earth Planet Sci Lett 80:241-251
Chen JH, Curran HA, White B, Wasserburg GJ (1991) Precise chronology of the last interglacial period: 238U/230Th data from fossil coral reefs in the Bahamas. Geol Soc Amer Bull 103:82-97
Cheng H, Adkins JF, Edwards RL, Boyle EA (2000a) 230Th dating of deep-sea corals. Geochim Cosmochim Acta 64:2401-2416
Cheng H, Edwards RL, Hoff J, Gallup CD, Richards DA, Asmerom Y (2000b) The half-lives of uranium-234 and thorium-230. Chem Geol 169:17-33
Cheng H, Edwards RL, Murrell MT, Goldstein S (1998) The systematics of uranium-thorium-protactinium dating. Geochim Cosmochim Acta 62(21):3437-3452
Cherdyntsev VV (1955) Transactions of the third session of the commission for determining the absolute age of geological formations. Izv Akad Nauk SSSR, Moscow, p 175-182
Cobb KM, Charles CD, Cheng H, Edwards RL, Kastner M (2002) U/Th-dating living and young fossil corals from the central tropical Pacific. Earth Planet Sci in review
Cochran JK (1982) The oceanic chemistry of U and Th series nuclides. In: Uranium series disequilibrium: Application to environmental problems. Ivanovich M, Harmon RS (eds) Clarendon, Oxford, p 384-430
Cochran JK, Masqué P (2003) Short-lived U/Th-series radionuclides in the ocean: tracers for scavenging rates, export fluxes and particle dynamics. Rev Mineral Geochem 52:461-492
Collins LB, Zhu ZR, Wyrwol KH, Hatcher BG, Playford PE, Chen JH, Eisenhauer A, Wasserburg GJ (1993) Late Quaternary evolution of coral reefs on a cool-water carbonate margin; the Abrolhos carbonate platforms, Southwest Australia. Marine Geol 110:203-212
Cross TS, Cross BW (1983) U, Sr and Mg in Holocene and Pleistocene corals A. palmata and M. annularis. J Sed Petr 53:587-594
Cutler KB, Edwards RL, Taylor FW, Cheng H, Adkins J, Gallup CD, Cutler PM, Burr GS, Chappell J, Bloom AL (2003) Rapid sea-level fall and deep-ocean temperature change since the last interglacial. Earth Planet Sci Lett, in press
Dansgaard W, Johnson SJ, Clausen HB, Dahl-Jensen D, Gundestrup NS, Hammer CU, Hvidberg CS, Steffensen JP, Sveinbjornsdottir AE, Jouzel J, Bond G (1993) Evidence for general instability of past climate from a 250-kyr ice-core record. Nature 364:218-220
Delaney ML, Boyle EA (1983) Uranium and thorium isotope concentrations in foraminiferal calcite. Earth Planet Sci Lett 62:258-262
Droxler AW, Morse JW, Glaser KS, Haddad GA, Baker PA (1991) Surface sediment carbonate mineralogy and water column chemistry: Nicaragua Rise versus the Bahamas. Marine Geol 100:277-289
Edmonds HN, Moran BS, Hoff JA, Smith JN, Edwards RL (1998) Pa-231 and Th-230 abundances and high scavenging rates in the western Arctic Ocean. Science 280:405-407
Edwards RL (1988) High-precision Th-230 ages of corals and the timing of sea level fluctuations in the late Quaternary. PhD Dissertation, California Institute of Technology, Pasadena, California
Edwards RL (2000) C.C. Patterson Award Acceptance Speech. Geochim Cosmochim Acta 64:759-761 Edwards RL, Beck JW, Burr GS, Donahue DJ, Druffel ERM, Taylor FW (1993) A large drop in
atmospheric 14C/12C and reduced melting during the Younger Dryas, documented with 230Th ages of corals. Science 260:962-968
Edwards RL, Chen JH, Wasserburg GJ (1987a) 238U, 234U, 230Th, 232Th systematics and the precise measurement of time over the past 500,000 years. Earth Planet Sci Lett 81:175-192
Edwards RL, Chen JH, Ku T-L, Wasserburg GJ (1987b) Precise timing of the last interglacial period from mass spectrometric analysis of 230Th in corals. Science 236:1547-1553
Edwards RL, Cheng H, Murrell MT, Goldstein SJ (1997) Protactinium-231 dating of carbonates by thermal ionization mass spectrometry: Implications for the causes of Quaternary climate change. Science 276:782-786
Edwards RL, Gallup CD, Cutler KB, Cheng H (2003) Geochemical evidence for Quaternary Sea Level Changes. In: Treatise on Geochemistry. Oceans and Marine Geochemistry. Vol 6. Turekian KK, Holland H (eds.) Elsevier Science, New York, in press
Edwards RL, Taylor FW, Wasserburg GJ (1988) Dating earthquakes with high precision thorium-230 ages of very young corals. Earth Planet Sci Lett 90:371-381
Eisenhauer A, Zhu ZR, Collins LB, Wyrwoll K, Eichstätter (1996) The Last Interglacial sea level change: new evidence from the Abrolhos islands, West Australia. Geologische Rundschau 85:606-614

402 Edwards, Gallup & Cheng
Esat TM, McCulloch MT, Chappell J, Pillans B, Omura A (1999) Rapid fluctuations in sea level recorded at Huon Peninsula during the Penultimate Deglaciation. Science 283:197-201
Fairbanks RG (1989) A 17,000-year glacio-eustatic sea-level record: influence of glacial melting rates on the Younger Dryas event and deep-ocean circulation. Nature 342:637-642
Gallup CD, Edwards RL, Haddad GA, Droxler AW (1995) Constraints on past changes in the marine δ234Uvalue from northern Nicaragua Rise, Caribbean Sea cores. EOS 76(46):291-292
Gallup CD (1997) High-precision uranium-series analyses of fossil corals and Nicaragua Rise sediments: The timing of high sea levels and the marine δ234U value during the past 200,000 years. PhD Dissertation, University of Minnesota, Twin Cities, Minnesota
Gallup CD, Cheng H, Taylor FW, Edwards RL (2002) Direct determination of the timing of sea level change during termination II. Science 295:310-313
Gallup CD, Edwards RL, Johnson RG (1994) The timing of high sea levels over the past 200,000 years. Science 263:796-800
Glaser KS, Droxler AW (1991) High production and highstand shedding from deeply submerged carbonate banks, Northern Nicaragua Rise. J Sed Petrol 61:128-142
Goldstein SJ, Lea DW, Chakraborty S, Kashgarian M, Murrell MT (2001) Uranium-series and radiocarbon geochronology of deep-sea corals: implications for Southern Ocean ventilation rates and the oceanic carbon cycle. Earth Planet Sci Lett 193:167-182
Gvirtzman G, Friedman GM, Miller DS (1973) Control and distribution of uranium in coral reefs during diagenesis. J Sed Petrol 43:985-997
Hall BL, Henderson GM (2001) Use of TIMS uranium-thorium dating to determine past reservoir effects in lakes: Two examples from Antarctica. Earth Planet Sci Lett 193:565-577
Hamelin B, Bard E, Zindler A, Fairbanks RG (1991) 234U/238U mass spectrometry of corals: How accurate is the U-Th age of the last interglacial period. Earth Planet Sci Lett 106:169-180
Hanebuth T, Stattegger K Grootes PM (2000) Rapid flooding of the Sunda Shelf: a late-glacial sea-level record. Science 288:1033-1035
Hearty P, Kindle, P, Cheng H, Edwards RL (1999) Evidence for a +20 m sea level in the mid-Pleistocene. Geology 27:375-378
Henderson GM (2002) Seawater (234U/238U) during the last 800 thousand years. Earth Planet Sci Lett 199:97-110
Henderson GM, Anderson RF (2003) The U-series toolbox for paleoceanography. Rev Mineral Geochem 52:493-531
Henderson GM, Cohen AS, O’Nions RK (1993) 234U/238U ratios and 230Th ages for Hateruma Atoll corals: implication for coral diagenesis and seawater 234U/238U ratios. Earth Planet Sci Lett 115:65-73
Henderson GM, O'Nions RK (1995) 234U/ 238U ratios in Quaternary planktonic foraminifera. Geochim Cosmochim Acta 59:4685-4694
Henderson G, Slowey N (2000) Evidence from U-Th dating against Northern Hemisphere forcing of the penultimate deglaciation. Nature 404:61-66
Henderson GM, Slowey NC, Fleisher MQ (2001) U-Th dating of carbonate platform and slope sediments. Geochim Cosmochim Acta 65:2757-2770
Isaac N, Picciotto E (1953) Ionium determination in deep-sea sediments. Nature 171:742-743 Israelson C, Bjorck S, Hawkesworth CJ, Possnert G (1997) Direct U-Th dating of organic- and carbonate-
rich lake sediments from southern Scandinavia. Earth Planet Sci Lett 153:251-263 Ivanovich M, Harmon, RS (eds) (1992) Uranium-series Disequilibrium: Application to Earth, Marine, and
Environmental Sciences. Oxford Science Publications, Oxford Jaffey AH, Flynn KF, Glendenin LE, Bentley WC, Essling AM (1971) Precision measurement of Half-
Lives and specific activities of 235U and 238U. Phys Rev C 4:1889-1906 Kaufman A, Broecker WS (1965) Comparison of 230Th and 14C ages for carbonate materials from Lakes
Lahontan and Bonneville. J Geophys Res 70:4039-4054 Kaufman A, Broecker WS, Ku T-L, Thurber D L (1971) The status of U-series methods of mollusk dating.
Geochim. Cosmohcim. Acta 35:1155- 1183 Koczy FF, Picciotto E, Poulaert G, Wilgain S (1957) Mesure des isotopes du thorium dans l’eau de mer.
Geochim Cosmochim Acta 11:103-129 Koetsier G, Elliott T, Fruijtier C (1999) Constraints on diagenetic age disturbance: combined uranium-
protactinium and uranium-thorium ages of the key Largo Formation, Florida Keys, USA. Ninth Annual V. M. Goldschmidt Conf 157-158
Ku T-L (1965) An evaluation of the U234/U238 method as a tool for dating pelagic sediments. J Geophys Res 70:3457-3474
Ku T-L (1968) Protactinium-231 method of dating coral from Barbados Island. J Geophys Res 73:2271-2276
Ku TL (1976) The uranium-series methods of age determination. Ann Rev Earth Planet Sci 4:347-380

U-series Dating of Marine & Lacustrine Carbonates 403
Ku T-L, Kimmel MA, Easton WH, O’Neil TJ (1974) Eustatic sea level 120,000 years ago on Oahu Hawaii. Science 183:959-962
Ku TL, Knauss KG, Mathieu GG (1977) Uranium in the open ocean: Concentration and isotopic composition. Deep-sea Res 24:1005-1017
Ku T-L, Luo S, Lowenstein TM, Li J (1998) U-series chronology of lacustrine deposits in Death Valley, California. Quat Res 50:261-275
Li WX, Lundberg J, Dickin AP, Ford DC, Schwarcz HP, McNutt R, Williams D (1989) High precision mass-spectrometric uranium-series dating of cave deposits and implications for paleoclimate studies. Nature 339:534-536
Lin JC, Broecker WS, Anderson RF, Hemming S, Rubenstone JL, Bonani G (1996) New 230Th/U and 14Cages from Lake Lahontan carbonates, Nevada, USA, and a discussion of the origin of initial thorium. Geochim Cosmochim Acta 60:2817-2832
Lomitschka M, Mangini A (1999) Precise Th/U-dating of small and heavily coated samples of deep sea corals. Earth Planet Sci Lett 170:391¯401
Ludwig KR (2003) Mathematical–statistical treatment of data and errors for 230Th/U geochronology. Rev Mineral Geochem 52:631-636
Ludwig KR, Muhs D, Simmons K, Halley R, Shinn EA (1996) Sea-level records at ~80 ka from tectonically stable platforms: Florida and Bermuda. Geology 24(3):211-214
Ludwig KR, Simmons KR, Szabo BJ, Winograd IJ, Landwehr JM, Riggs AC, Hoffman RJ (1992) Mass-spectrometric 230Th-234U-238U dating of the Devils Hole calcite vein. Science 258:284-287
Ludwig KR, Titterington DM (1994) Calculation of 230Th/U isochrons, ages, and errors. Geochim Cosmochim Acta 58:5031-5042
Lundberg J, Ford DC (1994) Late Pleistocene sea level change in the Bahamas from mass spectrometric U-series dating of submerged speleothem. Quat Sci Rev 13:1-14
Luo SD, Ku T-L (1991) U-series isochron dating: A generalized method employing total-sample dissolution. Geochim Cosmochim Acta 55:555-564
Mangini A, Lomitschka M, Eichstadter R, Frank N, Vogler S, Bonani G, Hajdas I Patzold J (1998) Coral provides way to age deep water. Nature 392:347¯348
Matthew RK (1968) Carbonate diagenesis: Equilibration of sedimentary mineralogy to the subaerial environement; coral cap of Barbados, West Indies. J Sed Petrol 38:1110-1119
McCulloch MT, Esat T (2000) The coral record of last interglacial sea levels and sea surface temperatures. Chem Geol 169:107-129
Mesolella KJ, Matthews RK, Broecker WS, Thurber DL (1969) The astronomical theory of climatic change: Barbados data. J Geol 77:250-274
Min GR, Edwards RL, Taylor FW, Recy J, Gallup CD, Beck JW (1995) Annual cycles of U/Ca in corals and U/Ca thermometry. Geochim Cosmochim Acta. 59:2025-2042
Moore WS (1981) The thorium isotope content of ocean water. Earth Planet Sci Lett 53:419-426 Moran SB, Hoff JA, Edwards RL, Landing WM (1997) Distribution of Th-230 in the Laborador Sea and its
relation to ventilation. Earth Planet Sci Lett 150:151-160 Muhs DR, Simmons KR, Steinke B (2002) Timing and warmth of the Last Interglacial period: new U-
series evidence from Hawaii and Bermuda and a new fossil compilation for North America. Quat Sci Rev 21:1355-1383
Muhs DR, Kennedy G, Rockwell TK (1994) Uranium-series ages of marine terrace corals from the Pacific coast of North America and implications for last-interglacial sea level history. Quat Res 42:72-87
Nozaki Y, Nakanishi T (1985) 231Pa and 230Th profiles in the open ocean water column. Deep-Sea Res 32:1209-1220
Pickett D, Murrell MT, Williams RW (1994) Determination of femtogram quantities of protactinium in geologic samples by thermal ionization mass spectrometry. Anal Chem 66:1044-1049
Porcelli D, Swarzenski PW (2003)The behavior of U- and Th- series nuclides in groundwater. Rev Mineral Geochem 52:317-361
Potratz HA, Bonner NA (1958) U.S. Energy Comm Rept No. La-1721Renne PR, Karner DB, Ludwig KR (1998) Radioisotope dating: Enhanced: Absolute ages aren’t exactly.
Science 282:1840-1841 Richards DA (1995) Pleistocene sea levels and paleoclimate of the Bahamas based on Th-230 ages of
speleothems. PhD Dissertation. University of Bristol, Bristol, United Kingdom Richards DA, Smart PL, Edwards RL (1994) Maximum sea levels for the last glacial period from U-series
ages of submerged speleothems. Nature 367:357-360 Richter FM, Turekian KK (1993) Simple models for the geochemical response of the ocean to climatic and
tectonic forcing. Earth Planet Sci Lett 119:121-131 Robert J, Miranda CF, Muxart R (1969) Mesure de la période du protactinium-231 par microcalorimétrie.
Radiochim Acta 11:104-108

404 Edwards, Gallup & Cheng
Robinson LF, Henderson GM, Slowey NC (2002) U¯Th dating of marine isotope stage 7 in Bahamas slope sediments. Earth Planet Sci Lett 196:175-187
Robst AL, Lowenstein TK, Jordan TE, Godfrey LV, Ku T-L, Luo S (2001) A 106 ka paleoclimate record from drill core of the Salar de Atacama, northern Chile. Paleogeo Paleoclim Paleoecol 173:21-42
Rosholt JN (1957) Quantitative radiochemical methods for determination of the sources of natural radioactivity. Anal Chem 29:1398-1408
Rosholt NJ (1967) Open system model for uranium-series dating of Pleistocene samples. In: Radioactive Dating and Methods of low-level Counting. I. A. E. A. Proc Ser Publ, SM-87/50, p 299-311
Rosholt JN, Antal PS (1962) Evaluation of the Pa231/U-Th230/U method for dating Pleistocene carbonate rocks. US Geol Survey Prof Paper 450-E:108-111
Russell AD, Emerson S, Mix AC, Peterson LC (1996) The use of foraminiferal U/Ca as an indicator of changes in seawater uranium content. Paleoceanography 11:649-663
Rutherford E, Soddy F (1902) The cause and nature of radioactivity: Part II. Phil Mag Ser 6 4:569-585 Sackett WM (1960) Protactnium-231 content of ocean water and sediments. Science 132:1761-1762Sackett WM (1958) Ionium-uranium ratios in marine deposited calcium carbonates and related materials.
PhD Dissertation, Washington University, St. Louis, Missouri Sackett WM, Potratz HA, Goldberg ED (1958) Thorium content of ocean water. Science 128:204-205 Sakanoue M, Konishi K, Komura K (1967) Stepwise determinations of thorium, protactinium, and uranium
isotopes and their application in geochronological studies. In: Proc. Symp. Radioactive Dating and Methods of Low-Level Counting, Monaco, p 313-329
Schramm A, Stein M, Goldstein SL (2000) Calibration of the 14C time scale to >40 ka by 234U-230Th dating of Lake Lisan sediments (last glacial Dead Sea). Earth Planet Sci Lett 175:27-40
Schroeder JH, Miller DS, Friedman GM (1970) Uranium distributions in recent skeletal carbonates. J Sed Petrol 40:672-681
Shackleton NJ, Imbrie J, Hall MA (1983) Oxygen and carbon isotope record of East Pacific core V19-30:implications for the formation of deep water in the late Pleistocene North Atlantic. Earth Planet Sci Lett 65:233-244
Shen C-C, Edwards RL, Cheng H, Dorale JA, Thomas RB, Moran SB, Weinstein S, Edmonds HN (2002) Uranium and thorium isotopic and concentration measurements by magnetic sector inductively coupled plasma mass spectrometry. Chem Geol 185:165-178
Shen GT, Dunbar RB (1995) Environmental controls on uranium in reef corals. Geochim Cosmochim Acta 59:2009-2024
Shen GT, Boyle EA (1988) Determination of lead, cadmium and other trace metals in annually-banded corals. Chem Geol 67:47-62
Slowey NC, Henderson GM, Curry WB (1995) Direct dating of the last two sea-level highstands by measurements of U/Th in marine sediments from the Bahamas. EOS 76(46):296-297
Slowey NC, Henderson GM, Curry WB (1996) Direct U–Th dating of marine sediments from the two most recent interglacial periods. Nature 383:242–244
Smith JE, Risk MJ, Schwarcz HP, McConnaughey TA (1997) Rapid climate change in the North Atlantic during the Younger Dryas recorded by deep-sea corals. Nature 386:818¯820
Stein M, Wasserburg G., Aharon P, Chen JH, Zhu ZR, Bloom AL, Chapell J (1993) TIMS U series dating and stable isotopes of the last interglacial event at Papua New Guinea. Geochim Cosmochim Acta 57:2541-2554
Stirling CH, Esat TM, Lambeck K, McCulloch MT (1998) Timing and duration of the last interglacial; evidence for a restricted interval of widespread coral reef growth. Earth Planet Sci Lett 160:745-762
Stirling CH, Esat TM, Lambeck K, McCullock MT, Blake SG, Lee D-C, Halliday AN (2001) Orbital forcing of the marine isotope stage 9 interglacial. Science 291:290-293
Stirling CH, Esat TM, McCulloch MT, Lambeck K (1995) High-precision U-series dating of corals from Western Australia and implications for the timing and duration of the Last Interglacial. Earth Planet Sci Lett 135:115-130
Swart PK (1980) The environmental geochemistry of scleractinian corals. An experimental study of trace element and stable isotope incorporation. PhD Dissertation, University of London, London, United Kingdom
Swart PK, Hubbard JAEB (1982) Uranium in scleractinian coral skeletons. Coral Reefs 1:13-19 Szabo BJ, Ludwig KR, Muhs DR, Simmons KR (1994) Thorium-230 ages of corals and duration of the last
interglacial sea-level high stand on Oahu, Hawaii. Science 266:93-96 Szabo BJ, Rosholt JN (1969) Uranium-series dating of Pleistocene molluscan shell from southern
California-An open system model. J Geophys Res 74:3253-3260 Tatsumoto M, Goldberg ED (1959) Some aspect of the marine geochemistry of uranium. Geochim
Cosmochim Acta 17:201-208

U-series Dating of Marine & Lacustrine Carbonates 405
Thompson G, Livingston HD (1970) Strontium and uranium concentrations in aragonite precipitated by some modern corals. Earth Planet Sci Lett 8:439-442
Thurber DL (1962) Anomalous 234U/238U in Nature. J Geophys Res 67:4518-4520 Thurber DL, Broecker WS, Blanchard RL, Potratz HA (1965) Uranium-series ages of Pacific atoll coral.
Science 149:55-58 Toscano MA, Lundberg J (1999) Submerged Late Pleistocene reefs on the tectonically-stable S.E. Florida
margin: high-precision geochronology, stratigraphy, resolution of Substage 5a sea-level elevation, and orbital forcing. Quat Sci Rev 18:753-767
Veeh HH (1966) 230Th/238U and 234U/238U ages of Pleistocene high sea level stand. J Geophys Res 71:3379-3386
Veeh HH, Turekian KK (1968) Cobalt, silver and uranium concentrations of reef building corals in the Pacific Ocean. Limol Oceanogr 13:304-308
Wasserburg GJ (2000) Citation for presentation of the 1999 C.C. Patterson Award to R. Lawrence Edwards. Geochim Cosmochim Acta 64:755-757
Wetherill GS (1956a) An interpretation of the Rhodesia and Witwatersrand age patterns. Geochim Cosmochim Acta 9:290-292
Wetherill GS (1956b) Discordant uranium-lead ages. I. Trans. Am Geophys Union 37:320-326 Zachariasen JA (1998) Paleoseismology and Paleogeodesy of the Sumatran Subduction Zone: A Study of
Vertical Deformation Using Coral Microatolls. PhD Dissertation, California Institute of Technology, Pasadena, California
Zachariasen J, Sieh K, Taylor FW, Edwards RL, Hantoro WS (1999) Submergence and uplift associated with the giant 1833 Sumatran subduction earthquake: Evidence from coral microatolls. J Geophys Res 104(B1):895-919
Zhu ZR, Wyrwoll KH, Chen L, Chen J, Wasserburg GJ, Eisenhauer A (1993) High-precision U-series dating of Last Interglacial events by mass spectrometry: Houtman Abrolhos Islands, western Australia. Earth Planet Sci Lett 118:281-293