9 Survey of nutrient levels in commercial shrimp feeds in … The number of shrimp feed producers...
6
9 The number of shrimp feed producers has increased dramacally in recent years. Inially, fish and chicken feed producers were the first to see shrimp feed as a potenal for diversificaon. They were followed by large farmers seng up their own feed-mill operaons. Currently large seafood processors are installing new feed-mills. It is expected that this trend will further fragment the feed market, challenging the exisng key feed producers. Globally there was a decline of fishmeal producon in 2016 and also Indian domesc fishmeal producon was affected, causing shortage of fish meal and fish oil during the summer crop. Contrary to earlier days when the bulk of the marine ingredients such as fishmeal, squid meal, and krill meal were import- ed, today shrimp feeds are formulated for more than 95 % with locally produced raw materials. Thanks to the implemen- taon of modern producon technology, most domesc producers of fishmeal/oil in India meet internaonal quality standards nowadays. Although this allows feedmills to avoid the complex importaon and stocking of marine ingredients, the prices of these local raw materials have increased to internaonal levels. The selecon of raw materials will influence the overall nutrient profile of the feed. Reducing marine ingredients will directly affect the level and availabil- ity of the essenal lipids such as n-3 HUFA and cholesterol, unless the formulator compensates this by adding specialty ingredients providing these nutrients. Survey of nutrient levels in commercial shrimp feeds in India By Alexander van Halteren and Peter Coueau, PhD., Nutriad Internaonal NV, Dendermonde, Belgium Since the introducon of white leg shrimp in 2009, shrimp culture has boomed in India to over 400,000 Mt in 2016. During the past years, Indian shrimp culture has spread from one main culture belt, Andhra Pradesh, into two more areas, Orissa and Gujarat. Culture condions vary in salinity, water source (borehole/seawater), temperature and length of the winter period in the different culture areas.
Transcript of 9 Survey of nutrient levels in commercial shrimp feeds in … The number of shrimp feed producers...
9
The number of shrimp feed producers
has increased dramatically in recent
years. Initially, fish and chicken feed
producers were the first to see shrimp
feed as a potential for diversification.
They were followed by large farmers
setting up their own feed-mill operations.
Currently large seafood processors are
installing new feed-mills. It is expected
that this trend will further fragment the
feed market, challenging the existing key
feed producers.
Globally there was a decline of fishmeal
production in 2016 and also Indian
domestic fishmeal production was
affected, causing shortage of fish meal
and fish oil during the summer crop.
Contrary to earlier days when the bulk of
the marine ingredients such as fishmeal,
squid meal, and krill meal were import-
ed, today shrimp feeds are formulated
for more than 95 % with locally produced
raw materials. Thanks to the implemen-
tation of modern production technology,
most domestic producers of fishmeal/oil
in India meet international quality
standards nowadays. Although this
allows feedmills to avoid the complex
importation and stocking of marine
ingredients, the prices of these local raw
materials have increased to international
levels. The selection of raw materials will
influence the overall nutrient profile of
the feed. Reducing marine ingredients
will directly affect the level and availabil-
ity of the essential lipids such as n-3
HUFA and cholesterol, unless the
formulator compensates this by adding
specialty ingredients providing these
nutrients.
Survey of nutrient levels in
commercial shrimp feeds in India By Alexander van Halteren and Peter Coutteau, PhD., Nutriad International NV, Dendermonde, Belgium
Since the introduction of
white leg shrimp in 2009,
shrimp culture has boomed
in India to over 400,000 Mt
in 2016. During the past
years, Indian shrimp culture
has spread from one main
culture belt, Andhra
Pradesh, into two more
areas, Orissa and Gujarat.
Culture conditions vary in
salinity, water source
(borehole/seawater),
temperature and length of
the winter period in the
different culture areas.
10
Compared to other (aquatic) species,
formulating shrimp feed is more based
on experience then on exact science. The
optimal nutrient profile of a shrimp feed
will depend on many factors, including
the culture density, environmental
conditions (temperature, salinity,
oxygen, …), productivity of the pond
water, the stability of the feed, feeding
method and frequency, … These factors
often are different depending on the
season, region, farm or even pond which
makes the selection of the ideal feed
rather a complex and often unstable
decision for the farmer. As a result,
research in optimizing feed formulations
under practical conditions continues to
be a major objective for feed producers.
Also, we can expect a wide variety in
nutritional specifications among
commercial shrimp feeds as composition
may depend on the target market.
Increasing cost and fluctuating availabil-
ity of raw materials in combination with
an increasingly competitive market is
demanding a creative mind from the
shrimp feed formulator. The nutritional
strategy is key to maintain or gain market
share. Aside from that, diseases like
white spot, vibriosis and white gut/feces
are an emerging risk during the produc-
tion cycle of shrimp in India and require a
good nutritional support to the animal.
The present study investigated the
different nutritional strategies in
commercial shrimp feeds during 2016,
when the number of shrimp feed
suppliers increased sharply. Feed
samples of 8 major brands were
collected in the market and analysed for
proximate composition as well as a
number of essential nutrients (amino
acids, phospholipids, cholesterol, n-3
highly unsaturated fatty acids).
Sample collection and analysis
Since 2013, Nutriad has surveyed the
composition of commercial shrimp feeds
in India. Feeds have been analyzed on a
range of nutritional parameters. For the
present study, we restricted the samples
to one pellet size, i.e. 3P, which
constitutes the main consumed volume
of commercial shrimp feed in India. Pellet
3P typically has the following specifica-
tions : crude protein (35 – 36 %), crude
fat (4.5 – 6 %), crude ash (< 13 %) and
crude fiber (2 – 5 %).
The selected feeds were collected from
the market during the second quarter of
2016 from farmers and feed distributors.
All feed samples were produced during
Q2 of 2016 and stored under typical lab
conditions, before sending for analysis.
Three different samples of each type of
feed was pooled into one representative
sample. Therefore, the results of this
survey are representative for the feed
specifications during a specific window of
time during the culture cycle of 2016.
Crude protein was analyzed following the
Kjeldahl method (Commission Directive
93/28/EEC.OJ No L179.22.7.93). Crude
fat has been determined with acid
hydrolysis following the Soxhlet method
(AOAC 996.06). Fatty acid composition
was determined with the gas chromato-
graphic method following fat extraction
(AOAC 996.06; expressed as g/kg).
Cholesterol was determined by direct
saponification using the gas chromato-
graphic method (AOAC 994.10; ex-
pressed as g/kg). Phospholipids were
analysed with 31P-NMR spectroscopy
using the internal standard method (SAA-
MET002-03, expressed as % as is). The
analyses of amino acids and nitrogen
were performed by Evonik Degussa
GmbH (official European method of
amino acid analysis in feed, COMMIS-
SION DIRECTIVE 98/64/EC of 3 Septem-
ber 1998; official method code 994.12 of
the AOAC International 2000, and
expressed % as is).
… the results of this survey are
representative for the feed
specifications during a specific
window of time during the
culture cycle of 2016.
11
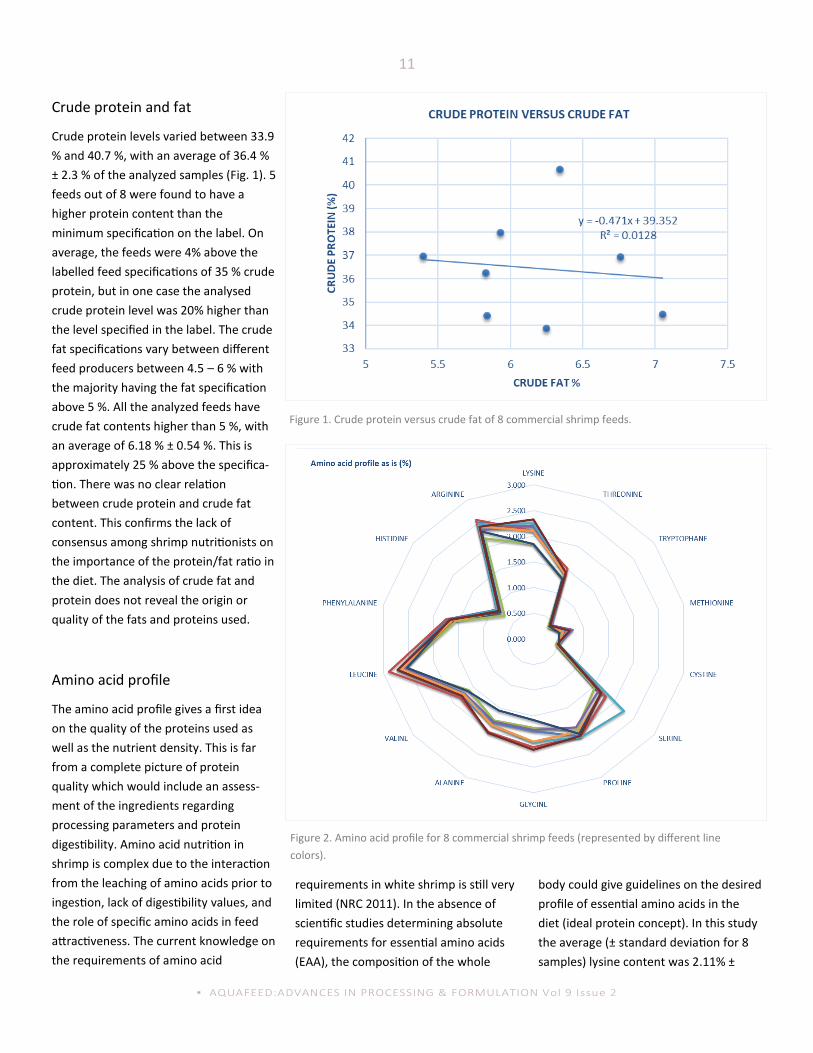
Crude protein and fat
Crude protein levels varied between 33.9
% and 40.7 %, with an average of 36.4 %
± 2.3 % of the analyzed samples (Fig. 1). 5
feeds out of 8 were found to have a
higher protein content than the
minimum specification on the label. On
average, the feeds were 4% above the
labelled feed specifications of 35 % crude
protein, but in one case the analysed
crude protein level was 20% higher than
the level specified in the label. The crude
fat specifications vary between different
feed producers between 4.5 – 6 % with
the majority having the fat specification
above 5 %. All the analyzed feeds have
crude fat contents higher than 5 %, with
an average of 6.18 % ± 0.54 %. This is
approximately 25 % above the specifica-
tion. There was no clear relation
between crude protein and crude fat
content. This confirms the lack of
consensus among shrimp nutritionists on
the importance of the protein/fat ratio in
the diet. The analysis of crude fat and
protein does not reveal the origin or
quality of the fats and proteins used.
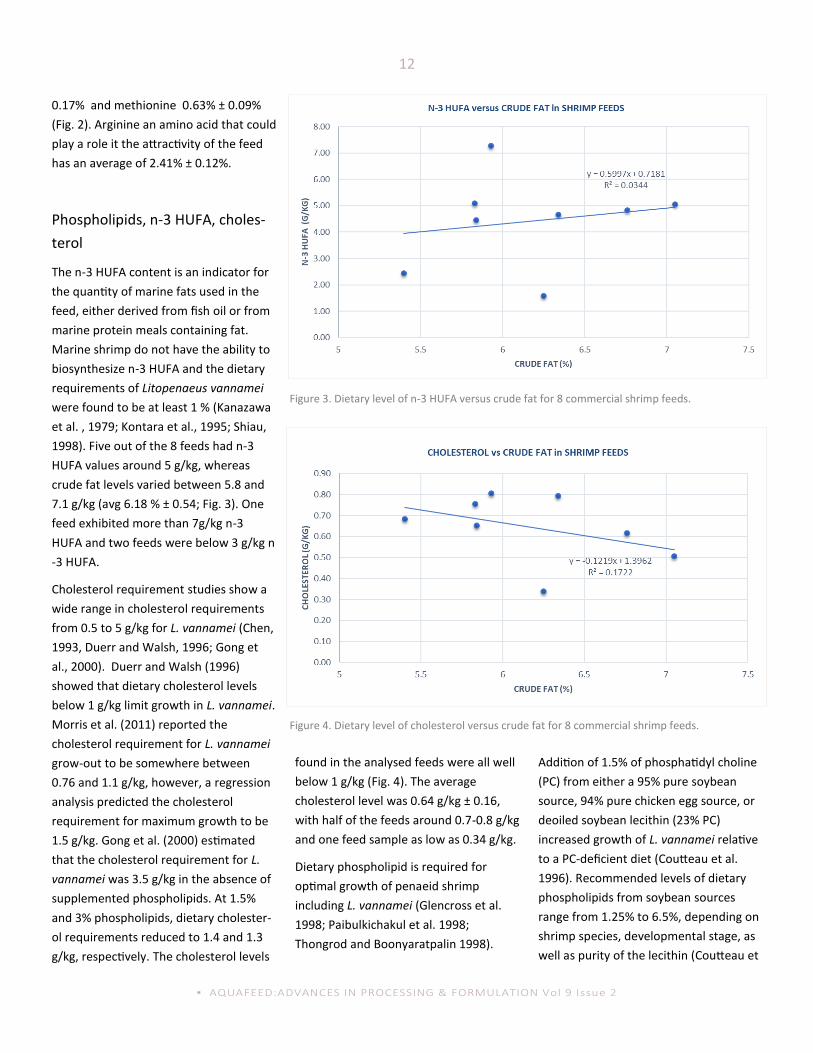
Amino acid profile
The amino acid profile gives a first idea
on the quality of the proteins used as
well as the nutrient density. This is far
from a complete picture of protein
quality which would include an assess-
ment of the ingredients regarding
processing parameters and protein
digestibility. Amino acid nutrition in
shrimp is complex due to the interaction
from the leaching of amino acids prior to
ingestion, lack of digestibility values, and
the role of specific amino acids in feed
attractiveness. The current knowledge on
the requirements of amino acid
requirements in white shrimp is still very
limited (NRC 2011). In the absence of
scientific studies determining absolute
requirements for essential amino acids
(EAA), the composition of the whole
body could give guidelines on the desired
profile of essential amino acids in the
diet (ideal protein concept). In this study
the average (± standard deviation for 8
samples) lysine content was 2.11% ±
Figure 1. Crude protein versus crude fat of 8 commercial shrimp feeds.
Figure 2. Amino acid profile for 8 commercial shrimp feeds (represented by different line
colors).
12
0.17% and methionine 0.63% ± 0.09%
(Fig. 2). Arginine an amino acid that could
play a role it the attractivity of the feed
has an average of 2.41% ± 0.12%.
Phospholipids, n-3 HUFA, choles-
terol
The n-3 HUFA content is an indicator for
the quantity of marine fats used in the
feed, either derived from fish oil or from
marine protein meals containing fat.
Marine shrimp do not have the ability to
biosynthesize n-3 HUFA and the dietary
requirements of Litopenaeus vannamei
were found to be at least 1 % (Kanazawa
et al. , 1979; Kontara et al., 1995; Shiau,
1998). Five out of the 8 feeds had n-3
HUFA values around 5 g/kg, whereas
crude fat levels varied between 5.8 and
7.1 g/kg (avg 6.18 % ± 0.54; Fig. 3). One
feed exhibited more than 7g/kg n-3
HUFA and two feeds were below 3 g/kg n
-3 HUFA.
Cholesterol requirement studies show a
wide range in cholesterol requirements
from 0.5 to 5 g/kg for L. vannamei (Chen,
1993, Duerr and Walsh, 1996; Gong et
al., 2000). Duerr and Walsh (1996)
showed that dietary cholesterol levels
below 1 g/kg limit growth in L. vannamei.
Morris et al. (2011) reported the
cholesterol requirement for L. vannamei
grow-out to be somewhere between
0.76 and 1.1 g/kg, however, a regression
analysis predicted the cholesterol
requirement for maximum growth to be
1.5 g/kg. Gong et al. (2000) estimated
that the cholesterol requirement for L.
vannamei was 3.5 g/kg in the absence of
supplemented phospholipids. At 1.5%
and 3% phospholipids, dietary cholester-
ol requirements reduced to 1.4 and 1.3
g/kg, respectively. The cholesterol levels
found in the analysed feeds were all well
below 1 g/kg (Fig. 4). The average
cholesterol level was 0.64 g/kg ± 0.16,
with half of the feeds around 0.7-0.8 g/kg
and one feed sample as low as 0.34 g/kg.
Dietary phospholipid is required for
optimal growth of penaeid shrimp
including L. vannamei (Glencross et al.
1998; Paibulkichakul et al. 1998;
Thongrod and Boonyaratpalin 1998).
Addition of 1.5% of phosphatidyl choline
(PC) from either a 95% pure soybean
source, 94% pure chicken egg source, or
deoiled soybean lecithin (23% PC)
increased growth of L. vannamei relative
to a PC-deficient diet (Coutteau et al.
1996). Recommended levels of dietary
phospholipids from soybean sources
range from 1.25% to 6.5%, depending on
shrimp species, developmental stage, as
well as purity of the lecithin (Coutteau et
Figure 3. Dietary level of n-3 HUFA versus crude fat for 8 commercial shrimp feeds.
Figure 4. Dietary level of cholesterol versus crude fat for 8 commercial shrimp feeds.
13
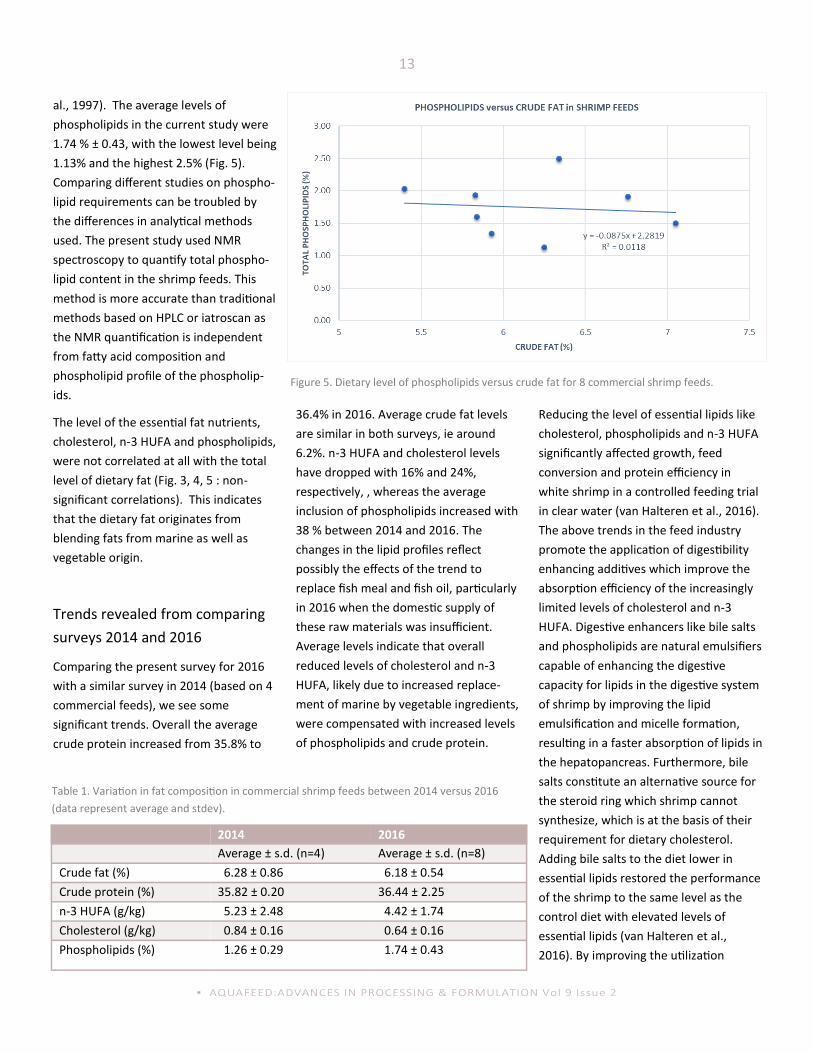
al., 1997). The average levels of
phospholipids in the current study were
1.74 % ± 0.43, with the lowest level being
1.13% and the highest 2.5% (Fig. 5).
Comparing different studies on phospho-
lipid requirements can be troubled by
the differences in analytical methods
used. The present study used NMR
spectroscopy to quantify total phospho-
lipid content in the shrimp feeds. This
method is more accurate than traditional
methods based on HPLC or iatroscan as
the NMR quantification is independent
from fatty acid composition and
phospholipid profile of the phospholip-
ids.
The level of the essential fat nutrients,
cholesterol, n-3 HUFA and phospholipids,
were not correlated at all with the total
level of dietary fat (Fig. 3, 4, 5 : non-
significant correlations). This indicates
that the dietary fat originates from
blending fats from marine as well as
vegetable origin.
Trends revealed from comparing
surveys 2014 and 2016
Comparing the present survey for 2016
with a similar survey in 2014 (based on 4
commercial feeds), we see some
significant trends. Overall the average
crude protein increased from 35.8% to
36.4% in 2016. Average crude fat levels
are similar in both surveys, ie around
6.2%. n-3 HUFA and cholesterol levels
have dropped with 16% and 24%,
respectively, , whereas the average
inclusion of phospholipids increased with
38 % between 2014 and 2016. The
changes in the lipid profiles reflect
possibly the effects of the trend to
replace fish meal and fish oil, particularly
in 2016 when the domestic supply of
these raw materials was insufficient.
Average levels indicate that overall
reduced levels of cholesterol and n-3
HUFA, likely due to increased replace-
ment of marine by vegetable ingredients,
were compensated with increased levels
of phospholipids and crude protein.
Reducing the level of essential lipids like
cholesterol, phospholipids and n‐3 HUFA
significantly affected growth, feed
conversion and protein efficiency in
white shrimp in a controlled feeding trial
in clear water (van Halteren et al., 2016).
The above trends in the feed industry
promote the application of digestibility
enhancing additives which improve the
absorption efficiency of the increasingly
limited levels of cholesterol and n-3
HUFA. Digestive enhancers like bile salts
and phospholipids are natural emulsifiers
capable of enhancing the digestive
capacity for lipids in the digestive system
of shrimp by improving the lipid
emulsification and micelle formation,
resulting in a faster absorption of lipids in
the hepatopancreas. Furthermore, bile
salts constitute an alternative source for
the steroid ring which shrimp cannot
synthesize, which is at the basis of their
requirement for dietary cholesterol.
Adding bile salts to the diet lower in
essential lipids restored the performance
of the shrimp to the same level as the
control diet with elevated levels of
essential lipids (van Halteren et al.,
2016). By improving the utilization
Table 1. Variation in fat composition in commercial shrimp feeds between 2014 versus 2016
(data represent average and stdev).
Figure 5. Dietary level of phospholipids versus crude fat for 8 commercial shrimp feeds.
2014 2016
Average ± s.d. (n=4) Average ± s.d. (n=8)
Crude fat (%) 6.28 ± 0.86 6.18 ± 0.54
Crude protein (%) 35.82 ± 0.20 36.44 ± 2.25
n-3 HUFA (g/kg) 5.23 ± 2.48 4.42 ± 1.74
Cholesterol (g/kg) 0.84 ± 0.16 0.64 ± 0.16
Phospholipids (%) 1.26 ± 0.29 1.74 ± 0.43
14
efficiency of dietary lipids, shrimp
formulations can be made more cost-
effective by reducing the formulated
values for phospholipids, cholesterol and
n-3 highly unsaturated fatty acids
(HUFAs) without affecting the perfor-
mance (Coutteau et al., 2011).
Conclusions
The present study collected samples
from 8 commercial shrimp feed brands
(pellet size P3) in India during 2016 for
the analysis of selected nutrients. The
shrimp feed samples exhibited a wide
range of levels for the nutrients
analysed. The shrimp feeds contained on
average (± s.d. for the eight samples)
36.4 ± 2.3% crude protein, 6.28 ± 0.86 %
crude fat, 2.11 ± 0.17% lysine, 0.63 ±
0.09% methionine, 2.41 ± 0.12%
arginine, 4.42 g/kg ± 1.74 g/kg n-3 HUFA,
0.64 ± 0.16 g/kg cholesterol, 1.74 ±
0.43% phospholipids. Furthermore, the
survey showed an overall trend in the
industry between 2014 and 2016 to offer
feeds with lower levels of cholesterol
and n-3 HUFA, whereas crude protein
and phospholipid levels were increased
over the same period, likely due to the
increasing replacement of marine
ingredients by vegetable raw materials.
AFΩ
More information
Alexander van Halteren Business development manager Aquaculture Nutrition, Nutriad International, Belgium. E: [email protected] Peter Coutteau, PhD Business Unit Director Aquaculture, Nutriad International, Belgium. E: [email protected]


![WELCOME [] FISH FEED PRODUCERS IN BD Aftab Feed Products Ltd Mono Feed Mills Ltd ACI Godrej Agrovet (Pvt) Ltd Nourish Poultry & Hatcheries Ltd Aman Feeds Ltd National Feed Mills Ltd](https://static.fdocuments.us/doc/165x107/5aa663bc7f8b9a517d8e73a8/welcome-fish-feed-producers-in-bd-aftab-feed-products-ltd-mono-feed-mills-ltd.jpg)