9. STRATEGY OPTIONS FOR DRAINAGE & FLOOD … · Strategy Options for Drainage and Flood Management...
49
Strategic Flood Risk Assessment Strategy Options for Drainage and Flood Management Local Development Framework Supporting Documentation 9-1 9. STRATEGY OPTIONS FOR DRAINAGE & FLOOD MANAGEMENT In line with various Government sourced reports and likely policy guidance, LPAs will need to take an increasingly proactive role in identifying and managing flood risk 1 . This requires a coordinated long-term overview of the likely infrastructure that will be needed, and coordinated and integrated policies that deliver effective sustainable flood management. This is a challenging task for any LPA, but this must be addressed soon. This section brings together various previous evidence bases, and identifies the key strategic infrastructure and associated policy issues that will have to be promoted in the near to medium future. Some of these issues may be considered in other strategic plans; especially the Environment Agency based Catchment Flood Management Plan and the Severn Trent River Basin Management Plan. 9.1 Policy Responsibilities Flood risk management is delivered by a number of organisations with varying powers and responsibilities. Whichever Agency is responsible for flood policy, the common aim is to reduce flood risk by: • discouraging inappropriate development in areas at risk from flooding • encouraging adequate and cost effective flood warning systems and flood emergency arrangements • encouraging adequate technically, environmentally and economically sound and sustainable flood risk management measures Arrangements for managing surface water drainage are split between the Environment Agency, local authorities, water companies, and other agencies, with no one organisation having overarching responsibility. As a result, decisions about new drainage or development investments are usually taken without a complete understanding of surface water risks and the most effective solutions. It may be inferred that to date LPAs principal role (not always successful) was in the first of these objectives. However, there is increasing momentum at Government level for increased coordination of drainage and flood management strategies 1 , and it is clear that LPAs will have an increasingly responsible role in coordinating effective drainage strategies through the planning process. As part of the new strategy for flood risk management Making Space for Water 2 the UK Government is exploring how the different organisations in urban drainage can work in partnership to promote a more strategic and integrated approach to surface water management. The pilot studies are already highlighting that the key to achieving a more integrated approach is a shared
Transcript of 9. STRATEGY OPTIONS FOR DRAINAGE & FLOOD … · Strategy Options for Drainage and Flood Management...
Strategic Flood Risk Assessment Strategy Options for Drainage and Flood Management
Local Development Framework Supporting Documentation 9-1
9. STRATEGY OPTIONS FOR DRAINAGE & FLOOD MANAGEMENT In line with various Government sourced reports and likely policy guidance, LPAs will need to take an increasingly proactive role in identifying and managing flood risk 1. This requires a coordinated long-term overview of the likely infrastructure that will be needed, and coordinated and integrated policies that deliver effective sustainable flood management. This is a challenging task for any LPA, but this must be addressed soon. This section brings together various previous evidence bases, and identifies the key strategic infrastructure and associated policy issues that will have to be promoted in the near to medium future. Some of these issues may be considered in other strategic plans; especially the Environment Agency based Catchment Flood Management Plan and the Severn Trent River Basin Management Plan.
9.1 Policy Responsibilities Flood risk management is delivered by a number of organisations with varying powers and responsibilities. Whichever Agency is responsible for flood policy, the common aim is to reduce flood risk by:
• discouraging inappropriate development in areas at risk from flooding
• encouraging adequate and cost effective flood warning systems and flood emergency arrangements
• encouraging adequate technically, environmentally and economically sound and sustainable flood risk management measures
Arrangements for managing surface water drainage are split between the Environment Agency, local authorities, water companies, and other agencies, with no one organisation having overarching responsibility. As a result, decisions about new drainage or development investments are usually taken without a complete understanding of surface water risks and the most effective solutions. It may be inferred that to date LPAs principal role (not always successful) was in the first of these objectives. However, there is increasing momentum at Government level for increased coordination of drainage and flood management strategies 1, and it is clear that LPAs will have an increasingly responsible role in coordinating effective drainage strategies through the planning process. As part of the new strategy for flood risk management Making Space for Water 2 the UK Government is exploring how the different organisations in urban drainage can work in partnership to promote a more strategic and integrated approach to surface water management. The pilot studies are already highlighting that the key to achieving a more integrated approach is a shared
Strategic Flood Risk Assessment Strategy Options for Drainage and Flood Management
Local Development Framework Supporting Documentation 9-2
view of risks by the main decision-makers. PPS 25 has clarified the role of Strategic Flood Risk Assessments in developing such a shared view, but to date surface water issues have not featured strongly. In critical drainage areas, where the risk from surface water drainage is significant, the local authority should prepare a Surface Water Management Plan. This would be an action plan, agreed by all local stakeholders with drainage responsibilities, to clarify responsibilities and manage these risks. Given the potential risks posed by surface water flooding around the country, the Government is now consulting separately on how to give Surface Water Management Plans a stronger role in coordinating development and investment planning. It sees local authorities in a central leadership role, with the Environment Agency advising on and potentially quality-assuring the plans. In particular LPAs and water companies should work together in preparing such plans and using them to guide investment decisions on solving local drainage, including options for above-ground storage and routing. This Chapter of the SFRA begins to address these likely policy options associated with Surface Water Management Plans, which nevertheless will have to be continued post-SFRA via stakeholder discussions between the LPA, Welsh Water and the Environment Agency.
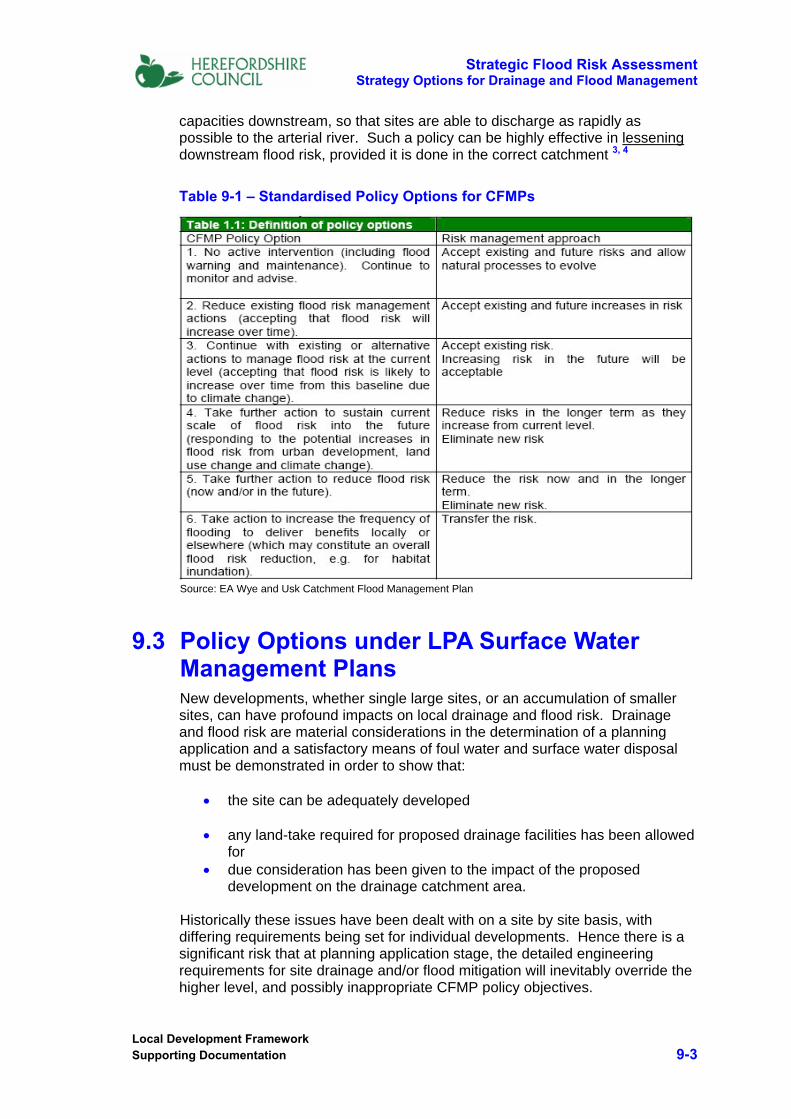
9.2 Policy Options under the CFMP Environment Agency CFMP policies are supposedly driven by the extent, nature and scale of current and future flood risk across the whole catchment, with the overall aim of reducing flood risk by meeting specific CFMP objectives. Within many catchments it is not possible to reduce flood risk everywhere so an understanding of where the greatest risks are (both current and future) is needed before deciding which policies to implement. Table 9-1 illustrates that the EA policy options and the associated risk management approaches are much generalised. The problem with this approach is that at the scale of individual developments (some of which are likely to be very large), the engineering practicalities and the impact of flood risk and drainage changes are not considered. The wider policy objectives do indeed have to be set at a broad scale (the river basin), focused on the risks apparent to that catchment, but they have to be demonstrably practicable right down to the scale of the sub-catchment and the individual site. For high level policy objectives to be effective, they must build from the bottom up, NOT the top down. This means that what is practicably achievable within specific catchments by means of strategic attenuation, SUDS, infiltration, site attenuation, channel improvements etc. must be the first consideration BEFORE high level policies are established. For example, if there is a preponderance of impermeable soils within a particular catchment, it is unlikely that SUDS such as soakaways and swales will be practicable. Hence, it may be more appropriate that sites in this particular catchment contribute to offsite works to provide improved channel
Strategic Flood Risk Assessment Strategy Options for Drainage and Flood Management
Local Development Framework Supporting Documentation 9-3
capacities downstream, so that sites are able to discharge as rapidly as possible to the arterial river. Such a policy can be highly effective in lessening downstream flood risk, provided it is done in the correct catchment 3, 4
Table 9-1 – Standardised Policy Options for CFMPs
Source: EA Wye and Usk Catchment Flood Management Plan
9.3 Policy Options under LPA Surface Water Management Plans New developments, whether single large sites, or an accumulation of smaller sites, can have profound impacts on local drainage and flood risk. Drainage and flood risk are material considerations in the determination of a planning application and a satisfactory means of foul water and surface water disposal must be demonstrated in order to show that:
• the site can be adequately developed
• any land-take required for proposed drainage facilities has been allowed for
• due consideration has been given to the impact of the proposed development on the drainage catchment area.
Historically these issues have been dealt with on a site by site basis, with differing requirements being set for individual developments. Hence there is a significant risk that at planning application stage, the detailed engineering requirements for site drainage and/or flood mitigation will inevitably override the higher level, and possibly inappropriate CFMP policy objectives.
Strategic Flood Risk Assessment Strategy Options for Drainage and Flood Management
Local Development Framework Supporting Documentation 9-4
There is a significant risk of this happening within the Local Development Framework, particularly in and around Hereford and Leominster, where flooding is prevalent, drainage issues are complex, and development pressure is significant. The resultant piece-meal approach to site drainage and flood mitigation (each site for itself) is not sustainable in the long term. Truly integrated strategies require that at the micro-scale (the site) each site contributes in a consistent way to the wider policy objectives, BUT the policy objectives must coincide with what is practicably feasible at the site scale AND is appropriate at the local catchment scale. The significant risk of the CFMP approach is that it is insufficiently detailed so as to take account of these practicalities, and this is where Surface Water Management Plans have a critical role to bridge the gap between high level policy objectives and detailed site drainage proposals.
9.4 Catchment Dynamics as the Foundation of Effective Flood Risk Management
9.4.1 Sub-catchments as Policy Units It is the contention of this SFRA that in preparing for effective drainage and flood management, policies arising from current flood risk and future development impact should be catchment and sub-catchment based. All drainage and flood risk impacts are gravity driven, bounded by the respective watershed, but subsequently interacting with other catchments downstream in increasingly complex ways. These impacts are fundamentally different in their scale and timing within different catchments. Effective long-term flood risk management MUST therefore be based on catchments, not arbitrary policy units. Furthermore, the catchment hydrodynamics (volume of runoff, speed of runoff, drainage capacity, and timing of peak) must be very well understood before blindly embarking on drainage and flood mitigation policies that may prove to be counter-productive in the long-term 3
This SFRA is founded on catchments, and has presented a wealth of evidence and data to support emerging appropriate drainage policies for integrated flood management. The process is ongoing, but a provisional list of appropriate drainage strategies (based on catchment hydrodynamic principles and what is at risk) is drafted in Table 9-2. A cascading type check-list has been formulated to assist in identifying the most likely appropriate policy.

Strategic Flood Risk Assessment Strategy Options for Drainage and Flood Management
Local Development Framework Supporting Documentation 9-5
9.4.2 Site Attenuation is not a Panacea for all Development There is a widespread lack of understanding throughout the drainage industry, including the regulatory authorities with regard to the effectiveness and appropriateness of attenuation as the preferred measure to alleviate downstream flood risk 5. This has arisen precisely because of the past emphasis on piece-meal, site focused solutions to increased runoff with Environment Agency stipulations such as ‘maintain green-field’ runoff rates etc. Maintaining green-field runoff rates creates the illusion that the site drainage is ‘safe’ and the local flood risk status quo is being maintained. In fact, the more widespread attenuation is, and the larger the total attenuated area becomes, there is a significant real risk that in downstream catchments, flood risk is actually increased not decreased. Whilst regulating outflow at green-field rates maintains flows to ‘safe’ limits in the immediately receiving watercourse (and this may frequently be desirable), the interaction with the next ‘sequential’ watercourse downstream may in fact have the opposite effect. This is because the volume of the runoff of the developed site is inevitably greater than the green-field state; hence for the same or lesser peak runoff at the point of disposal, the duration of outflow must continue for a longer period. The peak timing of the receiving watercourse also tends to be delayed. When the prolonged outflow and the delayed timing of the receiving watercourse coincide with a later and larger peak in the arterial river, the net effect is actually an increase in the peak flow on the arterial river. Attenuation from a single small site (< 2ha) is unlikely to create noticeable impact on an arterial river, but an accumulation of such small sites, or individual large (>10 ha) sites over a long period of time will have a measurable (and detrimental) effect.
Figure 9-1 – Example of how Attenuation Increases Flood Risk
Strategic Flood Risk Assessment Strategy Options for Drainage and Flood Management
Local Development Framework Supporting Documentation 9-6
Figure 9-1 shows downstream impacts from a typical 15 ha development site on the receiving watercourse and the sequential arterial watercourse further downstream. Site attenuation does indeed reduce local runoff to a safe (less than bankfull) amount, but the knock-on effect is that the delayed outflow continues for a longer period than when it is unattenuated, and this tends to add increase flows on the main river peak downstream. Hence flood-risk is actually increased in the downstream location. These subtle but crucial alterations to local drainage patterns have not been well understood previously, and consequently ignored by regulatory authorities. If there is a committed move to more strategic, integrated drainage management as required by UK Government, then these subtleties must be appreciated and incorporated into drainage policies and Surface Water Management Plans generally.
9.4.3 Minimising Natural Fluvial Flood Risk The proper management of fluvial flood risk is highly dependent on catchment hydrodynamics (volume of runoff, speed of runoff, drainage capacity and timing of peak) AND the way in which these interact in the downstream direction. The perception of fluvial flooding is that it arises from an excessive flood peak from a single hydrograph. It is crucial to understand however that the observed peak at say, Leominster or Bromyard is not the result of a single independent hydrograph, but rather the accumulation and convolution of many separate smaller hydrographs emanating from different sources i.e. sub-catchments, modified in their downstream passage by the effects of attenuation on the floodplain. The key to successful regional flood alleviation strategies is to reinforce the natural hydrodynamics of the catchments themselves 3, 4, 5, and to achieve as far as possible disruption or disaggregation of the combining natural hydrographs. In the simplest terms, this means delaying even further the timing of runoff from catchments that have long times to peak or that have a headwater location, and advancing the timing of catchments that have short times to peak or have a downstream location. Reduction in the peak rate of outflow below current rates (whether from a development site or a catchment in its entirety) will only be beneficial if that catchment peaks later than the sequential watercourse into which it discharges. Some examples:
• It is counter productive to attenuate either development sites or tributary (local) watercourses that peak many hours before the peak of the arterial river downstream. This may actually increase the peak flow. The preferred solution is to improve the capacity of the local watercourse and/or discharge at the maximum safe rate i.e. one that does not exceed the channel capacity.

Strategic Flood Risk Assessment Strategy Options for Drainage and Flood Management
Local Development Framework Supporting Documentation 9-7
• Upland catchments or development sites in headwater catchments should by preference attenuate as much as possible. This helps to disaggregate the original hydrograph.
9.5 Strategy Definitions & Implications A limited number of catchment based drainage strategies can be evolved that provide an integrated approach that lessens overall flood risk at the regional scale whilst also protecting local property and/or critical infrastructure. Some strategies should actively promote rapid runoff to maximise effective use of channel capacities and rapid timings of watercourses, others will maintain the status quo in terms of matching green-field runoff rates, and at the other end of the scale, significant attenuation may be desirable (by storage of flood water either on-site or in strategically placed reservoirs). The appropriate strategy clearly depends on the combination of:
• What are the physical characteristics of the site and wider catchment that can be used to offset these constraints?
• What is at risk downstream and how vulnerable is it?
• What are the downstream restrictions, and can these be modified?
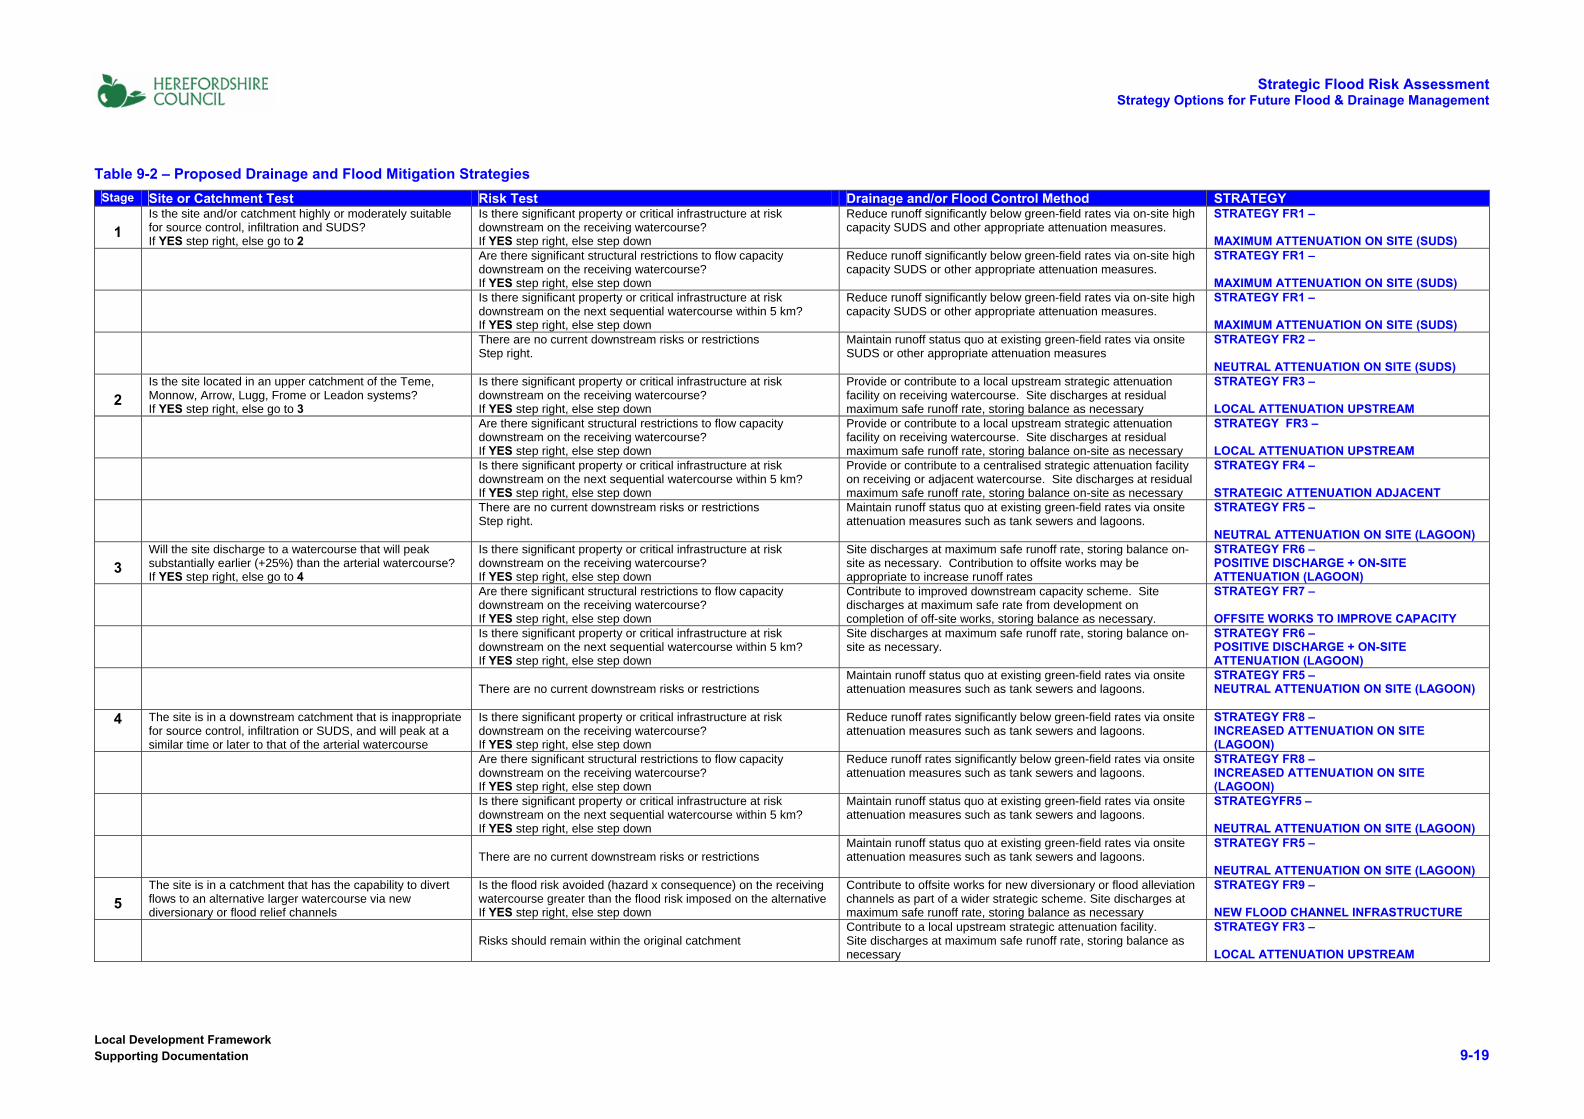
Table 9-2 proposes 9 distinct drainage strategies that in combination are most likely to achieve an integrated regional flood mitigation plan. Account is taken first of the natural characteristics of the catchment, and then various risk tests can be applied to select the appropriate form of drainage control.
9.5.1 Strategy FR1 - Maximum Attenuation on Site (SUDS) There is increasing recognition in Government guidance 1 that surface water below-ground systems are unnecessarily overloaded. There is a strong likelihood that in future increased site runoff will be regarded virtually as a pollutant, with increasing requirements for site owners to pay proportionately for their discharge. The automatic right to connect to surface water systems may become less readily available. “Good surface water management will involve increased use of SUDS and surface water flow routes, through the design and planning of the whole urban fabric, as the capacity of the landscape to store and convey water is much greater than the below-ground system. The nature of SUDS means that their implementation and management does not readily sit within established water industry structures . The major obstacles to their wider uptake and implementation have to do with ownership, maintenance and funding arrangements. We are now consulting separately on options for resolving these barriers to take up, including options for ownership and adoption of SUDS across the main agencies involved in urban and land drainage.” 1
Strategic Flood Risk Assessment Strategy Options for Drainage and Flood Management
Local Development Framework Supporting Documentation 9-8
The most desirable policy of all therefore (subject to groundwater protection issues) is to retain as much as possible if not all surface water on the development site. To be fully effective, this requires highly permeable sites and catchments. Where such soil types exist, this should be the preferred policy, and the sewerage undertaker and or LPA must implement ownership systems and legal agreements to accept and adopt these. Significant reduction of site runoff to well below green-field rates will alleviate downstream flood risk in vulnerable areas, and the detrimental interactions with subsequent watercourses are also likely to be highly marginal, so this policy will work successfully even where there is vulnerable property or infrastructure on the next sequential watercourse.
9.5.2 Strategy FR2 – Neutral Attenuation on Site (SUDS) Where there is still a high level of on-site permeability but no particular existing flood risk downstream or prevalence of restrictive structures i.e. the watercourse is free from artificial influences, there is little need to ‘over-attenuate’ runoff from development sites. The preference should be in fact to maintain the status quo as the safest option i.e. attenuation results in a neutral downstream effect. This means that the site should discharge at the green-field equivalent rate. It is crucially important to understand that this does NOT mean that all runoff from the site should discharge at a fixed ‘1 in 2 year rate’ or similar. This is a flawed policy often promoted in the absence of an understanding that this over-zealous attenuation can be thoroughly counter-productive in the wrong location. Green-field status quo means that for a 1 in 5 year event the developed site discharges at the equivalent 1 in 5 green-field rate, for a 1 in 50 year event it discharges at the equivalent 1 in 50 green-field rate etc. It is the runoff growth curve that is maintained, not a fixed discharge (which is practically very difficult to achieve in any case). The only exception to the ‘neutral attenuation policy without downstream risk’ is one where climate change effects within the catchment are expected to be significant. Hence, over-attenuation may be built in as part of the DEFRA recommended ‘Managed Adaptive Approach’, 5.10.2, to accommodate future changes.
9.5.3 Strategy FR3 – Local Attenuation Upstream Where catchments (and sites) do not have the maximum capability for infiltration or surface water retention, the next test should be if these sites are located in headwater areas of the principal arterial watercourses, namely the Monnow, Teme, Lugg, Arrow, Frome and Leadon rivers. By default under Table 9-1 these catchments should also tend to have relatively higher impermeability. Attenuation of these sites is of course achievable for each site independently in a piece-meal approach, and for very large sites, it may be appropriate and preferable for the site to host its own attenuation reservoir.
Strategic Flood Risk Assessment Strategy Options for Drainage and Flood Management
Local Development Framework Supporting Documentation 9-9
However, these upstream catchments have a vital strategic role. It is these catchments that are the most beneficial for larger ‘strategic’ reservoirs for upstream storage of flood water. Attenuation is a powerful mitigation option because the reduction effect is carried continuously downstream, sometimes for many kilometres. The higher up the location of the reservoir, the more extensive is its impact. There is increasing recognition 1 that upland storage has a crucial role to play in alleviating downstream flood peaks in existing high fluvial risk areas. If such storage facilities are to be constructed to alleviate existing flood risk, it makes economic sense to enlarge these further to accommodate also the impacts of new development, thereby avoiding a proliferation of smaller, less manageable and less effective reservoirs. In the optimum case, it could be that a contributions policy from all of the new developments combined would fully fund a localised strategic attenuation facility, offsetting their own risks and providing significant betterment to existing properties. This policy is most effective within catchments where there is significant flood risk downstream in the same receiving watercourse, and the presumption under FR3 is that the attenuation facility is sited upstream in the same catchment as that of the developments contributing to it. Such facilities do not have to be large or expensive to be effective 4, say between 10 – 25,000 m³.
9.5.4 Strategy FR4 – Strategic Attenuation Where there is no particular flood risk downstream on the receiving watercourse, but there IS flood risk further downstream on a sequential or arterial watercourse, by definition the flood peaks will be larger and the flood damage costs proportionately greater than those for a smaller upstream watercourse. Developments across several upstream catchments may be contributing adversely to this flood risk in a collective and accumulative way. A multiplicity of independent storage reservoirs becomes expensive to monitor and maintain, and will have complex hydrological effects. This argues for even larger, more strategic attenuation reservoirs (> 25,000 m³) that have catchment scale impact as opposed to local impact. These could be sited in any appropriate upstream catchment, and not necessarily the one with the most development. Adjacent catchments might be more effective. The design rule is to select the catchment that achieves the most attenuation for the least storage 4. Strategy FR4 will require significant feasibility study to identify appropriate sites well in advance of when they may be needed. Land acquirement issues may be complex and time consuming, but with appropriate site election, many such strategic reservoirs, engineered flood meadows or washlands can retain a dual use function either for grazing, public open space or nature reserves as well as occasional flood control.
Strategic Flood Risk Assessment Strategy Options for Drainage and Flood Management
Local Development Framework Supporting Documentation 9-10
9.5.5 Strategy FR5 – Neutral Attenuation on Site (Lagoons) Where there are no significant downstream risks or restrictions OR they are not anticipated in future, there is little to be gained in promoting centralised reservoirs. It may be more practicable to enforce on-site attenuation individual to each site. Generally these attenuation facilities will tend to be lagoons and ponds, as the capacity for infiltration source control may be limited. SUDS should be implemented wherever possible however. Generally, because there are no immediate downstream or sequential risks, the runoff rate should match the green-field runoff curve, which minimises the storage residence time of flood-water runoff. This is an essential design requirement of most if not all attenuation facilities, namely that they should empty as rapidly as possible (subject to safe downstream capacities) after the downstream risk has passed, so as to provide capability to absorb secondary storm events. Reservoirs or flood meadows that have unnecessarily prolonged storage times have a serious risk of failure in the typical long-duration frontal events that are prevalent in UK winters.
9.5.6 Strategy FR6 – Offsite Improvements + On-site Attenuation Where the receiving watercourse peaks many hours before the advent of the larger and later peak of the sequential or arterial river, a widespread policy of attenuation in the receiving catchment may protect local watercourses from increased flood risk. However, the long-term effect will generally be to increase the peak discharge on the arterial river downstream. Where development sites lie within say 1 km of an arterial watercourse (i.e. the Wye, Teme, Monnow, Lugg or Frome), it is also strategically counter-productive to significantly attenuate such sites. The larger the development sites, and the greater the degree of attenuation, the more this risk is increased. This phenomenon is most common in smaller catchments with short or steep watercourses that drain directly to a much larger arterial river, such as the Wye and the Lugg. Reference to Table 4-1 shows the relative times to peak of the 47 principal sub-catchments within the study. It shows for example that whilst the hydrograph in the Middle Lugg at Leominster takes some 10 hours to peak, several nearby catchments discharging immediately upstream of Leominster do so earlier in the same storm event, for example Ridgemoor Brook (7.8 hours), Cheaton Brook (8.1 hours) and Pinsley Brook (9.1 hours). Strategically, it is more appropriate to maintain as rapid a drainage rate as possible from these catchments (and development sites within them) so as to avoid conflicts with the later peaking Lugg, subject obviously to safe downstream limits. In this way flood risks to downstream Leominster are actually lessened, because the local components of the flood hydrograph are discharged first. Strategy FR6 therefore is most applicable in smaller catchments and subsidiary watercourses where it can be shown that the peak will discharge earlier.
Strategic Flood Risk Assessment Strategy Options for Drainage and Flood Management
Local Development Framework Supporting Documentation 9-11
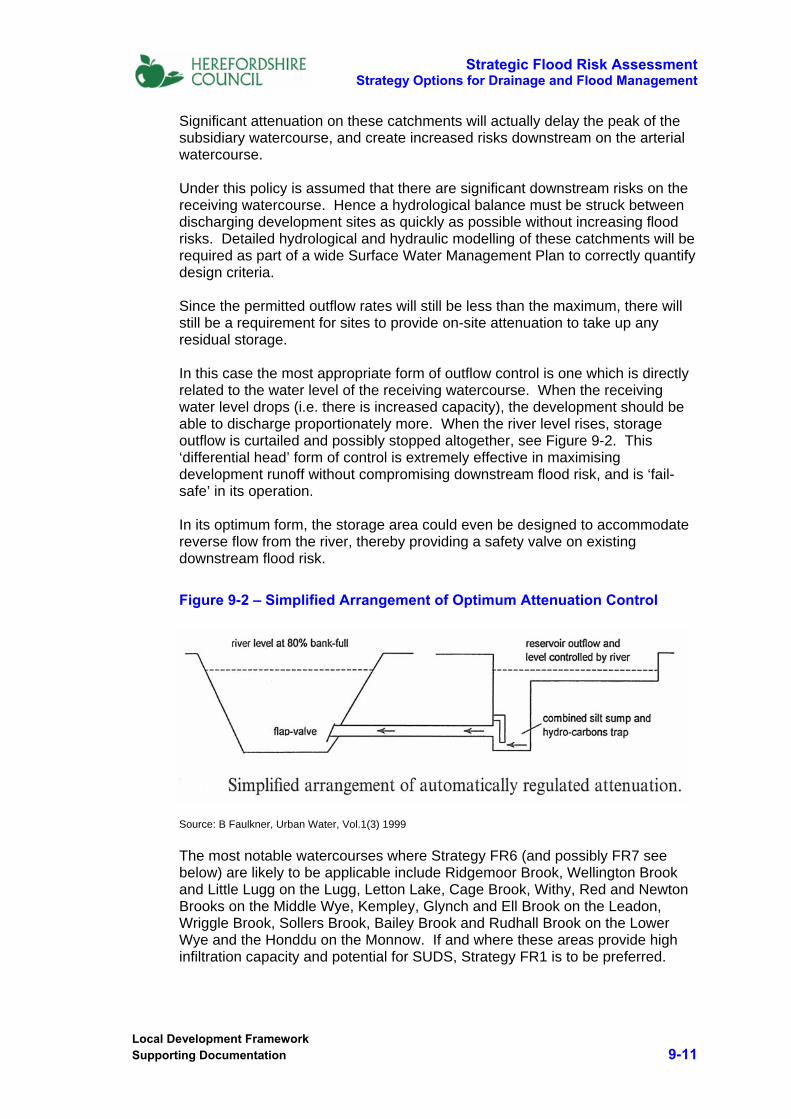
Significant attenuation on these catchments will actually delay the peak of the subsidiary watercourse, and create increased risks downstream on the arterial watercourse. Under this policy is assumed that there are significant downstream risks on the receiving watercourse. Hence a hydrological balance must be struck between discharging development sites as quickly as possible without increasing flood risks. Detailed hydrological and hydraulic modelling of these catchments will be required as part of a wide Surface Water Management Plan to correctly quantify design criteria. Since the permitted outflow rates will still be less than the maximum, there will still be a requirement for sites to provide on-site attenuation to take up any residual storage. In this case the most appropriate form of outflow control is one which is directly related to the water level of the receiving watercourse. When the receiving water level drops (i.e. there is increased capacity), the development should be able to discharge proportionately more. When the river level rises, storage outflow is curtailed and possibly stopped altogether, see Figure 9-2. This ‘differential head’ form of control is extremely effective in maximising development runoff without compromising downstream flood risk, and is ‘fail-safe’ in its operation. In its optimum form, the storage area could even be designed to accommodate reverse flow from the river, thereby providing a safety valve on existing downstream flood risk.
Figure 9-2 – Simplified Arrangement of Optimum Attenuation Control
Source: B Faulkner, Urban Water, Vol.1(3) 1999 The most notable watercourses where Strategy FR6 (and possibly FR7 see below) are likely to be applicable include Ridgemoor Brook, Wellington Brook and Little Lugg on the Lugg, Letton Lake, Cage Brook, Withy, Red and Newton Brooks on the Middle Wye, Kempley, Glynch and Ell Brook on the Leadon, Wriggle Brook, Sollers Brook, Bailey Brook and Rudhall Brook on the Lower Wye and the Honddu on the Monnow. If and where these areas provide high infiltration capacity and potential for SUDS, Strategy FR1 is to be preferred.
Strategic Flood Risk Assessment Strategy Options for Drainage and Flood Management
Local Development Framework Supporting Documentation 9-12
9.5.7 Strategy FR7 – Offsite Improvement Works Strategy FR7 is a variation of FR6 for watercourses where rapid discharge of runoff is desirable. In this case it is identified that there are also significant channel improvements works that could be implemented to improve watercourse capacity. This policy should therefore not only facilitate the new development, but also provide significant betterment to existing flood risk properties.
The appropriate policy response is to promote off-site improvement works along the full length of the subsidiary watercourse. Frequently this may simply require some localised improved defences, replacement of intermittent culverts and reinforcement of bridges with relief culverts etc. These improvement-works being completed, the contributing developments should be allowed to discharge as much as is safely possible into the receiving watercourse. The proviso is that this must never be at a rate that is likely to compromise the capacity of the improved watercourse. Consequently, it may still be necessary for the site to provide some residual flood storage on-site, but the advantage to the developer is that this will be significantly smaller in volume and extent than the full attenuation requirement. The larger the development area, the greater the scope to fund significant channel improvement works to the benefit of the downstream community via a contribution scheme. What is the threshold difference in time to peak that should be tested to determine whether improvement works are desirable? Obviously times to peak of sub-catchments vary slightly primarily depending on antecedent wetness condition, but as a general rule not by more than 20% from the standard observed value. Consequently, a simple test can be that if a subsidiary watercourse peaks more than 20% earlier than the arterial watercourse to which it discharges, the subsidiary watercourse is a prime candidate for maintaining rapid discharge, with minimised attenuation and/or channel improvement works. This also safeguards against the occasional conflicting impact of storm movement. Conversely, if a subsidiary watercourse peaks within 20% of the time of the main sequential watercourse downstream, a ‘maintain status quo’ attenuation policy such as FR5 – Neutral Attenuation may be preferable Off-site works have frequently been a major hindrance to effective integrated drainage strategies. Developers have been allowed the ‘soft’ option of providing on-site attenuation even where this may not have been the appropriate response. There are legal difficulties with entering into Section 106 agreements where of-site works and third parties are involved. However, if the Local Development Framework is to adequately meet Government guidance on best practice, Surface Water Management Plans should explicitly facilitate the implementation of such schemes. The Environment Agency should also be more supportive of such schemes.
Strategic Flood Risk Assessment Strategy Options for Drainage and Flood Management
Local Development Framework Supporting Documentation 9-13
9.5.8 Strategy FR8 – Increased Attenuation on Site For a significant number of catchments in the SFRA study area, there will be limited potential to institute extensive SUDSs. At the same time these catchments will also have little strategic value in that they peak at the same time or later than the arterial watercourse. Hence these catchments have little impact on the arterial flood risk on the main rivers, which will be affected by the simultaneous (or earlier) much larger flood peak on the main river. However, these developments still have the potential to increase localised flood-risk on the receiving watercourse because of the increased runoff volume and advancing peak. If there is significant downstream property or critical infrastructure already at risk, the appropriate policy response is to use the development sites to not only offset their own downstream impacts, but to provide betterment to these areas. This requires that the developments ‘over-attenuate’ to rates that are significantly less than the green-field equivalents. This will help to reduce the peak load on the receiving watercourse. As for Policy FR6, attenuation storage could be designed to facilitate reverse flow from the river into the lagoon to enhance downstream protection even further. The larger the sites and the attenuation, the more effective will be the policy in providing betterment. In situations where there is no downstream flood risk but there are downstream capacity restrictions, Strategy FR7 or FR8 might be equally appropriate.
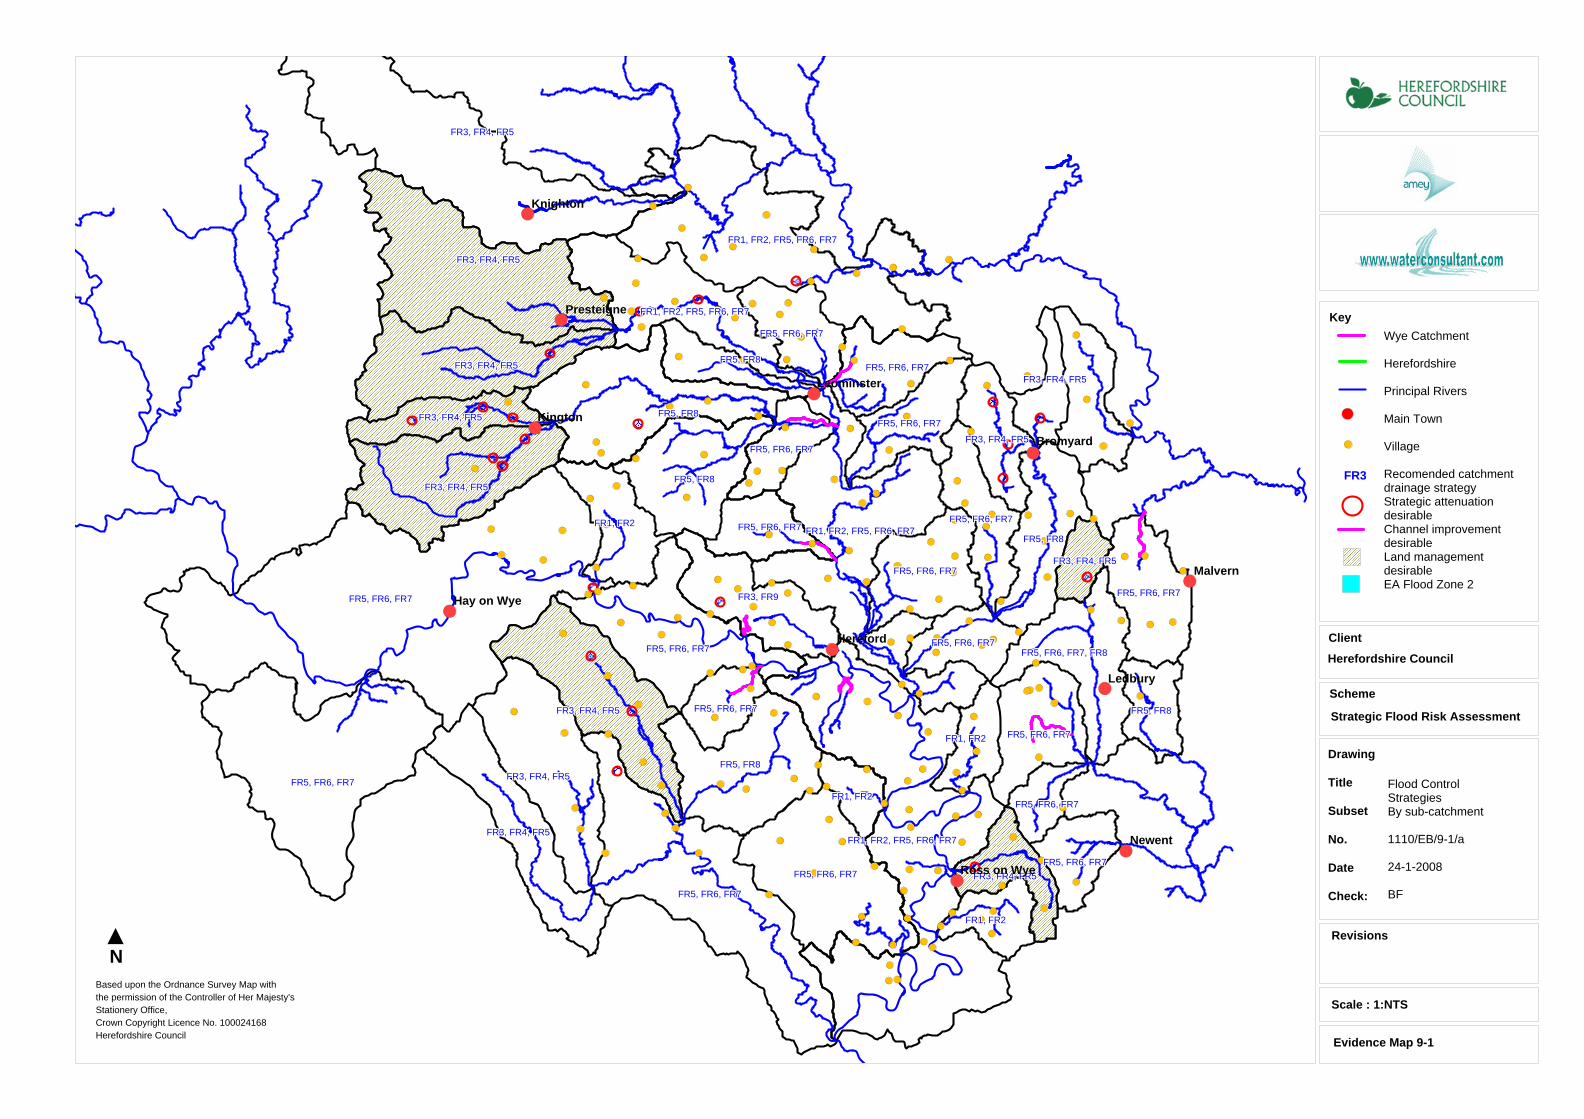
9.5.9 Strategy FR9 – New Flood Channel Infrastructure Strategy FR9 is a special case where there is an engineering option to divert or relieve a watercourse to an entirely different outfall or provide some form of bypass or flood relief arrangement. The Marsh Cut relief channel around north Leominster is an example. Such schemes may be used in combination with offsite improvements and or residual attenuation to reduce total risk. Because of topography and urban pressures, such schemes tend to be underground and inevitably highly expensive. However, in certain cases this is a viable option above ground, and a current scheme under active consideration in Hereford is to provide a high level offtake and relief channel to the Yazor Brook (which has significant existing flood pressures) running southwards by gravity direct to the Wye. The offtake will be located in the vicinity of Credenhill Community Centre. A combination of open and culverted channel will transfer flood flows south through largely agricultural land discharging to the River Wye in the vicinity of Weir Cliff. The proposed route of the diversion is shown in Evidence Map 9-1 – Flood Control Strategies
9.6 Future Flood Infrastructure It is a requirement of an SFRA that some preliminary assessment should be made of likely future flood management infrastructure. This requirement will
Strategic Flood Risk Assessment Strategy Options for Drainage and Flood Management
Local Development Framework Supporting Documentation 9-14
overlap substantially with the Environment Agency’s views expressed via the CFMP, and to some extent will depend on the locations of new development IF these exert increased pressure on downstream flood risk areas. It is likely however that some new or reinforced flood infrastructure will be needed to adapt to climate change and to protect concentrations of property and/or critical infrastructure already at risk of flooding.
9.6.1 Catchment Drainage Policies Catchment drainage policies will be one of the largest contributors to improved flood management infrastructure. Utilising the natural dynamics of the catchments to disaggregate flood hydrographs is probably the single most effective long-term approach, BUT it requires a sustained and consistent approach by the LPA and EA to implement these policies at the catchment scale and to all developments within that catchment. This will require a commitment to ‘strategic drainage’ not yet experienced by the LPA or for that matter the EA. Practical experience of where such strategic drainage policies and associated infrastructure have been implemented show clearly that it is a) achievable b) successful e.g. the regional attenuation strategy for Emersons Green and Folly Brook, Bristol (15,000 houses +, 1990 – 2000). A set of detailed and effective drainage strategies to support LDF and LDD policies has been developed as part of this Strategic Flood Risk Assessment.
9.6.2 Strategic Attenuation Reservoirs Larger, centralised attenuation reservoirs or controlled washlands are especially effective in upland or headwater catchments. This is because the attenuation effect can be seen for a significant distance downstream, with all property and infrastructure benefiting from this reduction in peak flow. The magnitude of the reduction obviously reduces in the downstream direction, but if sufficiently large, such reservoirs have significant impact. Conversely, local flood defence schemes such as at Hereford and Hampton Bishop serve only relatively small areas, and maintain a high level of residual risk that they will be breached or overtopped. Reservoirs capable of strategic scale attenuation will inevitably be large (> 25,000 m³), and may require significant embankment, control structure and earth-works. However, this one facility may substitute 10 on-site schemes, and correctly located, is likely to be technically more effective. They will require significant issues of land acquisition or rental, but frequently the dual use of the land behind the attenuation embankment can be retained for grazing, public open space or amenity value. The Ross-on-Wye Flood Alleviation Scheme is a successful example.
Strategic Flood Risk Assessment Strategy Options for Drainage and Flood Management
Local Development Framework Supporting Documentation 9-15
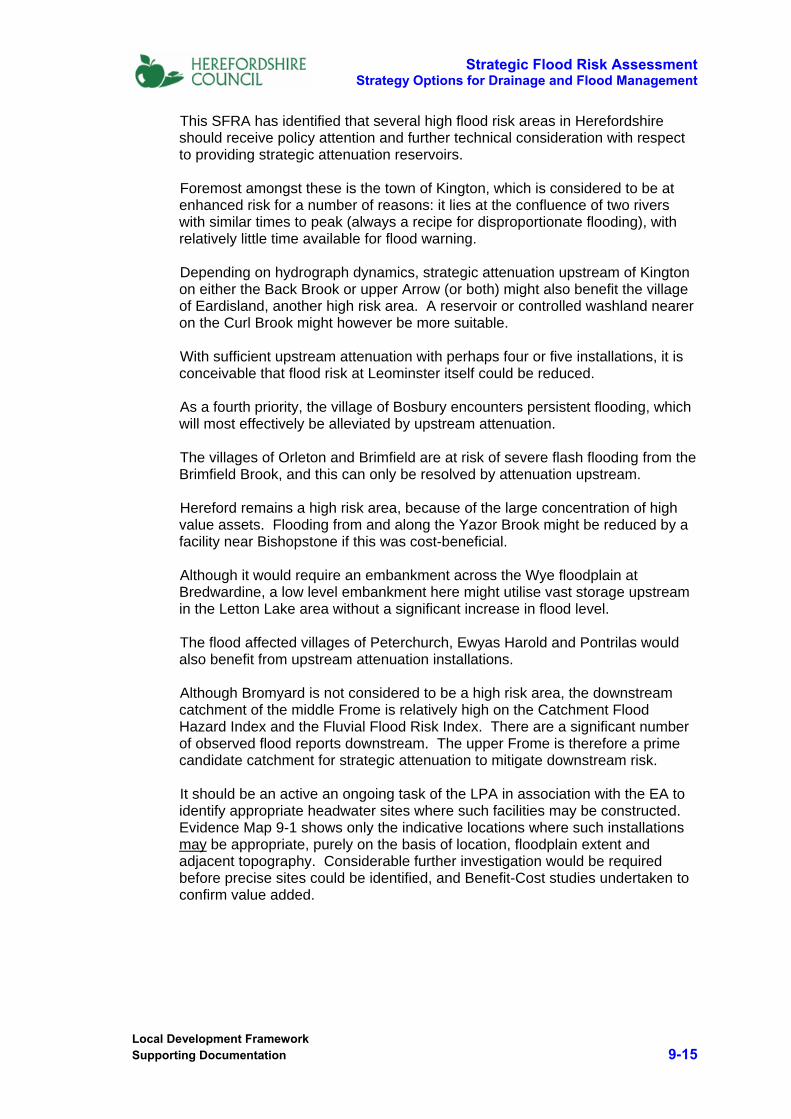
This SFRA has identified that several high flood risk areas in Herefordshire should receive policy attention and further technical consideration with respect to providing strategic attenuation reservoirs. Foremost amongst these is the town of Kington, which is considered to be at enhanced risk for a number of reasons: it lies at the confluence of two rivers with similar times to peak (always a recipe for disproportionate flooding), with relatively little time available for flood warning. Depending on hydrograph dynamics, strategic attenuation upstream of Kington on either the Back Brook or upper Arrow (or both) might also benefit the village of Eardisland, another high risk area. A reservoir or controlled washland nearer on the Curl Brook might however be more suitable. With sufficient upstream attenuation with perhaps four or five installations, it is conceivable that flood risk at Leominster itself could be reduced. As a fourth priority, the village of Bosbury encounters persistent flooding, which will most effectively be alleviated by upstream attenuation. The villages of Orleton and Brimfield are at risk of severe flash flooding from the Brimfield Brook, and this can only be resolved by attenuation upstream. Hereford remains a high risk area, because of the large concentration of high value assets. Flooding from and along the Yazor Brook might be reduced by a facility near Bishopstone if this was cost-beneficial. Although it would require an embankment across the Wye floodplain at Bredwardine, a low level embankment here might utilise vast storage upstream in the Letton Lake area without a significant increase in flood level. The flood affected villages of Peterchurch, Ewyas Harold and Pontrilas would also benefit from upstream attenuation installations. Although Bromyard is not considered to be a high risk area, the downstream catchment of the middle Frome is relatively high on the Catchment Flood Hazard Index and the Fluvial Flood Risk Index. There are a significant number of observed flood reports downstream. The upper Frome is therefore a prime candidate catchment for strategic attenuation to mitigate downstream risk. It should be an active an ongoing task of the LPA in association with the EA to identify appropriate headwater sites where such facilities may be constructed. Evidence Map 9-1 shows only the indicative locations where such installations may be appropriate, purely on the basis of location, floodplain extent and adjacent topography. Considerable further investigation would be required before precise sites could be identified, and Benefit-Cost studies undertaken to confirm value added.
Strategic Flood Risk Assessment Strategy Options for Drainage and Flood Management
Local Development Framework Supporting Documentation 9-16
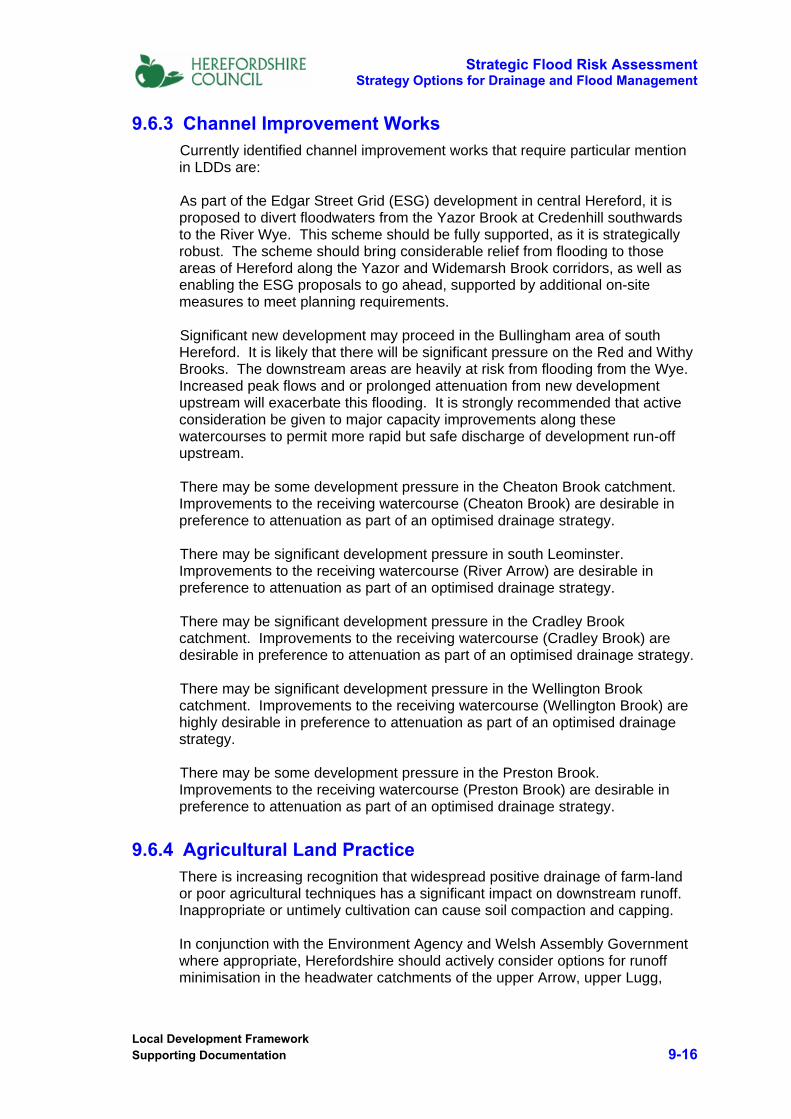
9.6.3 Channel Improvement Works Currently identified channel improvement works that require particular mention in LDDs are: As part of the Edgar Street Grid (ESG) development in central Hereford, it is proposed to divert floodwaters from the Yazor Brook at Credenhill southwards to the River Wye. This scheme should be fully supported, as it is strategically robust. The scheme should bring considerable relief from flooding to those areas of Hereford along the Yazor and Widemarsh Brook corridors, as well as enabling the ESG proposals to go ahead, supported by additional on-site measures to meet planning requirements. Significant new development may proceed in the Bullingham area of south Hereford. It is likely that there will be significant pressure on the Red and Withy Brooks. The downstream areas are heavily at risk from flooding from the Wye. Increased peak flows and or prolonged attenuation from new development upstream will exacerbate this flooding. It is strongly recommended that active consideration be given to major capacity improvements along these watercourses to permit more rapid but safe discharge of development run-off upstream. There may be some development pressure in the Cheaton Brook catchment. Improvements to the receiving watercourse (Cheaton Brook) are desirable in preference to attenuation as part of an optimised drainage strategy. There may be significant development pressure in south Leominster. Improvements to the receiving watercourse (River Arrow) are desirable in preference to attenuation as part of an optimised drainage strategy. There may be significant development pressure in the Cradley Brook catchment. Improvements to the receiving watercourse (Cradley Brook) are desirable in preference to attenuation as part of an optimised drainage strategy. There may be significant development pressure in the Wellington Brook catchment. Improvements to the receiving watercourse (Wellington Brook) are highly desirable in preference to attenuation as part of an optimised drainage strategy. There may be some development pressure in the Preston Brook. Improvements to the receiving watercourse (Preston Brook) are desirable in preference to attenuation as part of an optimised drainage strategy.
9.6.4 Agricultural Land Practice There is increasing recognition that widespread positive drainage of farm-land or poor agricultural techniques has a significant impact on downstream runoff. Inappropriate or untimely cultivation can cause soil compaction and capping. In conjunction with the Environment Agency and Welsh Assembly Government where appropriate, Herefordshire should actively consider options for runoff minimisation in the headwater catchments of the upper Arrow, upper Lugg,

Strategic Flood Risk Assessment Strategy Options for Drainage and Flood Management
Local Development Framework Supporting Documentation 9-17
Hindwell Brook, Back Brook, upper Frome, upper Leadon, Dore and upper Monnow via improved land management practices. These may include reduced drainage or afforestation programmes or alternative cropping methods. Significant implementation of such practices might obviate the need for more formal engineered reservoirs, although they are less predictable in their operation.
9.7 Provisional Drainage Strategy Map To assist the LPA in preparation of its Local Development Documents concerning drainage issues, the various cascade rules of Table 9-2 have been applied to the 47 catchments of the SFRA to identify provisional optimum drainage and flood risk mitigation strategies. The most appropriate solutions according to the rules of Table 9-2 are built in as a field within the GIS database and layer HSFRA All Catchments. These provisional policies are shown in Evidence Map 9-1 Flood Control Strategies. This map also highlights the most pressing areas where the LPA should address specifically matters of improved flood control infrastructure in consultation with the Environment Agency.
9.7.1 Basic Principles of Good Drainage Strategy The provisional drainage strategy is powerful but flexible in its concept, and it is based on a few fundamental basic principles that should apply in most if not all circumstances. These rules apply not only at the catchment scale, but also at the local (site) scale. 1) The overriding drainage strategy preference should be to promote high
levels of surface water retention on site via SUDS systems, where site conditions permit, even if the wider catchment is not generally suitable for widespread source control. This will largely depend on the soil types and sub-soil conditions prevailing at the site.
2) In general terms, the most effective strategic solution to large scale flood risks (at the catchment scale) is to attenuate significantly runoff from upstream catchments, maintain a neutral stance in middle catchments, and promote improved runoff and capacity in downstream catchments. The same principles apply to development sites within catchments in the absence of an overriding general policy for the catchment as a whole.
3) The most appropriate drainage and flood mitigation policy for a site should be derived from i) what is at risk downstream ii) the physical attributes of the site ii) the physical attributes of the catchment.
4) Where there is likely to be a proliferation of small attenuation facilities within a single catchment, it will be more appropriate to construct a single or fewer larger, centralised strategic facilities. This is especially the case in upland headwater catchments where strategic attenuation is likely to be most
Strategic Flood Risk Assessment Strategy Options for Drainage and Flood Management
Local Development Framework Supporting Documentation 9-18
effective.
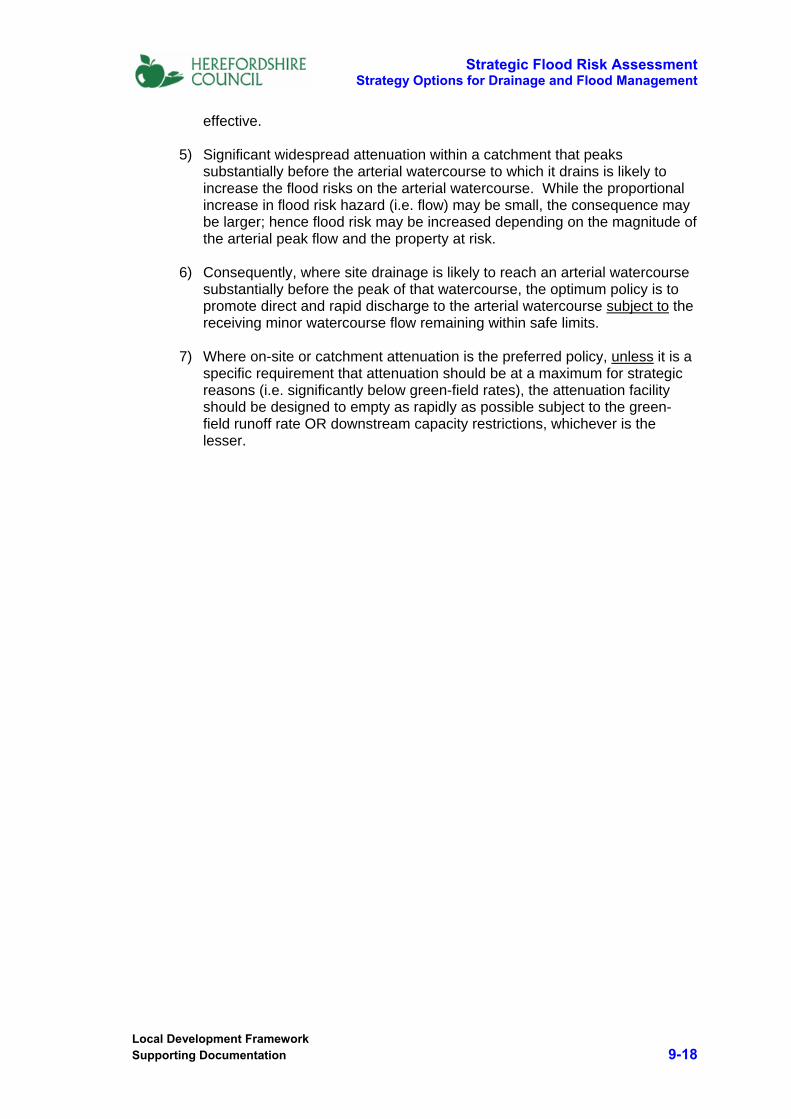
5) Significant widespread attenuation within a catchment that peaks substantially before the arterial watercourse to which it drains is likely to increase the flood risks on the arterial watercourse. While the proportional increase in flood risk hazard (i.e. flow) may be small, the consequence may be larger; hence flood risk may be increased depending on the magnitude of the arterial peak flow and the property at risk.
6) Consequently, where site drainage is likely to reach an arterial watercourse substantially before the peak of that watercourse, the optimum policy is to promote direct and rapid discharge to the arterial watercourse subject to the receiving minor watercourse flow remaining within safe limits.
7) Where on-site or catchment attenuation is the preferred policy, unless it is a specific requirement that attenuation should be at a maximum for strategic reasons (i.e. significantly below green-field rates), the attenuation facility should be designed to empty as rapidly as possible subject to the green-field runoff rate OR downstream capacity restrictions, whichever is the lesser.
Strategic Flood Risk Assessment Strategy Options for Future Flood & Drainage Management
Local Development Framework Supporting Documentation 9-19
Table 9-2 – Proposed Drainage and Flood Mitigation Strategies Stage Site or Catchment Test Risk Test Drainage and/or Flood Control Method STRATEGY
1
Is the site and/or catchment highly or moderately suitable for source control, infiltration and SUDS? If YES step right, else go to 2
Is there significant property or critical infrastructure at risk downstream on the receiving watercourse? If YES step right, else step down
Reduce runoff significantly below green-field rates via on-site high capacity SUDS and other appropriate attenuation measures.
STRATEGY FR1 – MAXIMUM ATTENUATION ON SITE (SUDS)
Are there significant structural restrictions to flow capacity downstream on the receiving watercourse? If YES step right, else step down
Reduce runoff significantly below green-field rates via on-site high capacity SUDS or other appropriate attenuation measures.
STRATEGY FR1 – MAXIMUM ATTENUATION ON SITE (SUDS)
Is there significant property or critical infrastructure at risk downstream on the next sequential watercourse within 5 km? If YES step right, else step down
Reduce runoff significantly below green-field rates via on-site high capacity SUDS or other appropriate attenuation measures.
STRATEGY FR1 – MAXIMUM ATTENUATION ON SITE (SUDS)
There are no current downstream risks or restrictions Step right.
Maintain runoff status quo at existing green-field rates via onsite SUDS or other appropriate attenuation measures
STRATEGY FR2 – NEUTRAL ATTENUATION ON SITE (SUDS)
2
Is the site located in an upper catchment of the Teme, Monnow, Arrow, Lugg, Frome or Leadon systems? If YES step right, else go to 3
Is there significant property or critical infrastructure at risk downstream on the receiving watercourse? If YES step right, else step down
Provide or contribute to a local upstream strategic attenuation facility on receiving watercourse. Site discharges at residual maximum safe runoff rate, storing balance as necessary
STRATEGY FR3 – LOCAL ATTENUATION UPSTREAM
Are there significant structural restrictions to flow capacity downstream on the receiving watercourse? If YES step right, else step down
Provide or contribute to a local upstream strategic attenuation facility on receiving watercourse. Site discharges at residual maximum safe runoff rate, storing balance on-site as necessary
STRATEGY FR3 – LOCAL ATTENUATION UPSTREAM
Is there significant property or critical infrastructure at risk downstream on the next sequential watercourse within 5 km? If YES step right, else step down
Provide or contribute to a centralised strategic attenuation facility on receiving or adjacent watercourse. Site discharges at residual maximum safe runoff rate, storing balance on-site as necessary
STRATEGY FR4 – STRATEGIC ATTENUATION ADJACENT
There are no current downstream risks or restrictions Step right.
Maintain runoff status quo at existing green-field rates via onsite attenuation measures such as tank sewers and lagoons.
STRATEGY FR5 – NEUTRAL ATTENUATION ON SITE (LAGOON)
3
Will the site discharge to a watercourse that will peak substantially earlier (+25%) than the arterial watercourse? If YES step right, else go to 4
Is there significant property or critical infrastructure at risk downstream on the receiving watercourse? If YES step right, else step down
Site discharges at maximum safe runoff rate, storing balance on-site as necessary. Contribution to offsite works may be appropriate to increase runoff rates
STRATEGY FR6 – POSITIVE DISCHARGE + ON-SITE ATTENUATION (LAGOON)
Are there significant structural restrictions to flow capacity downstream on the receiving watercourse? If YES step right, else step down
Contribute to improved downstream capacity scheme. Site discharges at maximum safe rate from development on completion of off-site works, storing balance as necessary.
STRATEGY FR7 – OFFSITE WORKS TO IMPROVE CAPACITY
Is there significant property or critical infrastructure at risk downstream on the next sequential watercourse within 5 km? If YES step right, else step down
Site discharges at maximum safe runoff rate, storing balance on-site as necessary.
STRATEGY FR6 – POSITIVE DISCHARGE + ON-SITE ATTENUATION (LAGOON)
There are no current downstream risks or restrictions
Maintain runoff status quo at existing green-field rates via onsite attenuation measures such as tank sewers and lagoons.
STRATEGY FR5 – NEUTRAL ATTENUATION ON SITE (LAGOON)
4 The site is in a downstream catchment that is inappropriate for source control, infiltration or SUDS, and will peak at a similar time or later to that of the arterial watercourse
Is there significant property or critical infrastructure at risk downstream on the receiving watercourse? If YES step right, else step down
Reduce runoff rates significantly below green-field rates via onsite attenuation measures such as tank sewers and lagoons.
STRATEGY FR8 – INCREASED ATTENUATION ON SITE (LAGOON)
Are there significant structural restrictions to flow capacity downstream on the receiving watercourse? If YES step right, else step down
Reduce runoff rates significantly below green-field rates via onsite attenuation measures such as tank sewers and lagoons.
STRATEGY FR8 – INCREASED ATTENUATION ON SITE (LAGOON)
Is there significant property or critical infrastructure at risk downstream on the next sequential watercourse within 5 km? If YES step right, else step down
Maintain runoff status quo at existing green-field rates via onsite attenuation measures such as tank sewers and lagoons.
STRATEGYFR5 – NEUTRAL ATTENUATION ON SITE (LAGOON)
There are no current downstream risks or restrictions
Maintain runoff status quo at existing green-field rates via onsite attenuation measures such as tank sewers and lagoons.
STRATEGY FR5 – NEUTRAL ATTENUATION ON SITE (LAGOON)
5
The site is in a catchment that has the capability to divert flows to an alternative larger watercourse via new diversionary or flood relief channels
Is the flood risk avoided (hazard x consequence) on the receiving watercourse greater than the flood risk imposed on the alternative If YES step right, else step down
Contribute to offsite works for new diversionary or flood alleviation channels as part of a wider strategic scheme. Site discharges at maximum safe runoff rate, storing balance as necessary
STRATEGY FR9 – NEW FLOOD CHANNEL INFRASTRUCTURE
Risks should remain within the original catchment
Contribute to a local upstream strategic attenuation facility. Site discharges at maximum safe runoff rate, storing balance as necessary
STRATEGY FR3 – LOCAL ATTENUATION UPSTREAM
Strategic Flood Risk Assessment Strategy Options for Drainage & Flood Management
Local Development Framework Supporting Documentation 9-20
9.8 Collation of Future Flood Data Herefordshire Council must greatly increase its awareness and field-intelligence of the sources and mechanisms of flooding in its administrative area. This is essential to effective planning, investment and emergency response in flood management. There should be a systematic method of efficiently collating flood and accessing information, whether from fluvial flooding or from surface water. This was a clear recommendation of the West Midlands Regional Flood Risk Appraisal 5. A detailed pro-forma has been specifically developed as part of this SFRA, see Technical Appendix Chapter 11. In line with RFRA recommendations this form is comprehensive in identifying the incident, source, cause, extent and impact of the flooding. This pro-forma is designed to support the GIS database HSFRA Flood Reports. It is strongly recommended that this form be posted to the Herefordshire Council website where it can be downloaded by the general public AND other Agencies who may encounter flooding incidents. The draft was sent to Herefordshire Council in December 2007, no comments yet received. The Environment Agency does not provide a standardised flood reporting form for general use and it is recommended that Herefordshire Council provides its own standardised method of reporting. Significant effort has been directed towards compiling a Flood Reports database (HSFRA Flood Reports). This database should be regarded as live and ongoing. It should be a high priority task of the LPA to adopt and maintain this database at all times. The information contained therein is of significant value in strategic flood risk planning.
9.9 Interactions with the EA CFMP The Environment Agency does not provide a standardised flood reporting form for general use and it is recommended that Herefordshire Council provides its own standardised method of reporting. Catchment drainage policies will be one of the largest contributors to improved flood management infrastructure. Utilising the natural dynamics of the catchments to disaggregate flood hydrographs is probably the single most effective long-term approach, BUT it requires a sustained and consistent approach by the LPA and EA to implement these policies at the catchment scale and to all developments within that catchment. It should be an active an ongoing task of the LPA in association with the EA to identify appropriate headwater sites where strategic attenuation facilities may be constructed. Evidence Map 9-1 shows only the indicative locations where such installations may be appropriate, purely on the basis of location, floodplain extent and adjacent topography.
Strategic Flood Risk Assessment Strategy Options for Drainage & Flood Management
Local Development Framework Supporting Documentation 9-21
This SFRA has identified that several high flood risk areas in Herefordshire should receive policy attention and further technical consideration from the EA with respect to providing strategic attenuation reservoirs. The key to successful regional flood alleviation strategies is to reinforce the natural hydrodynamics of the catchments themselves, and to achieve as far as possible disruption or disaggregation of the combining natural hydrographs. In the simplest terms, this means delaying even further the timing of runoff from catchments that have long times to peak or that have a headwater location, and advancing the timing of catchments that have short times to peak or have a downstream location. All drainage and flood risk impacts are gravity driven, bounded by the respective watershed, but subsequently interacting with other catchments downstream in increasingly complex ways. These impacts are fundamentally different in their scale and timing within different catchments. Effective long-term flood risk management MUST therefore be based on catchments, not arbitrary policy units. Furthermore, the catchment hydrodynamics (volume of runoff, speed of runoff, drainage capacity, and timing of peak) must be very well understood before blindly embarking on drainage and flood mitigation policies that may prove to be counter-productive in the long-term.
9.10 Evidence Based Statements 1) Arrangements for managing surface water drainage are split between the
Environment Agency, local authorities, water companies, and other agencies, with no one organisation having overarching responsibility. As a result, decisions about new drainage or development investments are usually taken without a complete understanding of surface water risks and the most effective solutions.
2) There is increasing momentum at Government level for increased coordination of drainage and flood management strategies, and it is clear that LPAs will have an increasingly responsible role in coordinating effective drainage strategies through the planning process.
3) In critical drainage areas, where the risk from surface water drainage is significant, the local authority should prepare a Surface Water Management Plan. This would be an action plan, agreed by all local stakeholders with drainage responsibilities, to clarify responsibilities and manage these risks.
4) For high level policy objectives to be effective, they must build from the bottom up, NOT the top down. This means that what is practicably achievable within specific catchments by means of strategic attenuation, SUDS, infiltration, site attenuation, channel improvements etc. must be the first consideration before high level policies are established.
5) New developments, whether single large sites, or an accumulation of smaller sites, can have profound impacts on local drainage and flood risk.

Strategic Flood Risk Assessment Strategy Options for Drainage & Flood Management
Local Development Framework Supporting Documentation 9-22
Drainage and flood risk are material considerations in the determination of a planning application and a satisfactory means of foul water and surface water disposal must be demonstrated.
6) The significant risk of the CFMP approach is that it is insufficiently detailed so as to take account of these practicalities, and this is where Surface Water Management Plans have a critical role to bridge the gap between high level policy objectives and detailed site drainage proposals.
7) Effective long-term flood risk management MUST therefore be based on catchments, not arbitrary policy units. Furthermore, the catchment hydrodynamics (volume of runoff, speed of runoff, drainage capacity, and timing of peak) must be very well understood before blindly embarking on drainage and flood mitigation policies that may prove to be counter-productive in the long-term.
8) The key to successful regional flood alleviation strategies is to reinforce the natural hydrodynamics of the catchments themselves, and to achieve as far as possible disruption or disaggregation of the combining natural hydrographs. In the simplest terms, this means delaying even further the timing of runoff from catchments that have long times to peak or that have a headwater location, and advancing the timing of catchments that have short times to peak or have a downstream location.
9) Some strategies should actively promote rapid runoff to maximise effective use of channel capacities and rapid timings of watercourses, others will maintain the status quo in terms of matching green-field runoff rates, and at the other end of the scale, significant attenuation may be desirable (by storage of flood water either on-site or in strategically placed reservoirs).
10) Table 9-2 proposes 9 distinct drainage strategies that in combination are most likely to achieve an integrated regional flood mitigation plan. Account is taken first of the natural characteristics of the catchment, and then various risk tests can be applied to select the appropriate form of drainage control.
11) Catchment drainage policies will be one of the largest contributors to improved flood management infrastructure. Utilising the natural dynamics of the catchments to disaggregate flood hydrographs is probably the single most effective long-term approach, BUT it requires a sustained and consistent approach by the LPA and EA to implement these policies at the catchment scale and to all developments within that catchment.
9.11 Evidence Based Recommendations
1) This SFRA has prepared detailed strategic assessments of hydrological impacts and flood hazards and flood risks, leading to a set of detailed proposed strategies founded on robust technical appraisal. It will be necessary for these micro-scale policies to be reconciled with the much more general and broader policies in the forthcoming CFMP. It is essential that the CFMP recognises the areas of greatest flood risk as identified in the SFRA, and promotes policies that are in line with the practicalities of

Strategic Flood Risk Assessment Strategy Options for Drainage & Flood Management
Local Development Framework Supporting Documentation 9-23
appropriate catchment drainage strategies.
2) Herefordshire Council must greatly increase its awareness and field-intelligence of the sources and mechanisms of flooding in its administrative area. This is essential to effective planning, investment and emergency response in flood management. There should be a systematic method of collating flood information, whether from fluvial flooding or from surface water. A Flooding Report pro-forma has been prepared for this purpose.
3) The HSFRA Flood Reports database should be adopted forthwith by the LPA and maintained and updated on a continuous basis. The Flooding Report pro-forma should be used to support this process.
4) Proposed drainage strategies in the SFRA should be considered by the LPA and as far as possible incorporated into Local Development Documents.
5) The proposed diversion channel associated with the Edgar Street Grid development running from the Yazor Brook at Credenhill to the Wye at Sugwas Pool is in accordance with Strategy FR9, and should be fully supported. In conjunction with a strategic attenuation facility higher in the Yazor Brook catchment, downstream flooding of the Widemarsh area might be eliminated.
6) Significant new development may proceed in the Bullingham area of south Hereford. It is likely that there will be significant pressure on the Red and Withy Brooks. The downstream areas are heavily at risk from flooding from the Wye. Increased peak flows and or prolonged attenuation from new development upstream will exacerbate this flooding. It is strongly recommended that active consideration be given to major capacity improvements along these watercourses to permit more rapid but safe discharge of development run-off upstream. A Surface Water Management Plan for the Withy Brook and Red Brook catchments is strongly recommended.
7) There may be some development pressure in the Cheaton Brook catchment. Improvements to the receiving watercourse (Cheaton Brook) are desirable in preference to attenuation as part of an optimised drainage strategy.
8) There may be significant development pressure in south Leominster. Improvements to the receiving watercourse (River Arrow) are desirable in preference to attenuation as part of an optimised drainage strategy.
9) There may be significant development pressure in the Cradley Brook catchment. Improvements to the receiving watercourse (Cradley Brook) are desirable in preference to attenuation as part of an optimised drainage strategy.
10) There may be significant development pressure in the Wellington Brook catchment. Improvements to the receiving watercourse (Wellington Brook) are highly desirable in preference to attenuation as part of an optimised drainage strategy.
Strategic Flood Risk Assessment Strategy Options for Drainage & Flood Management
Local Development Framework Supporting Documentation 9-24
11) There may be some development pressure in the Preston Brook. Improvements to the receiving watercourse (Preston Brook) are desirable in preference to attenuation as part of an optimised drainage strategy.
9.12 References and Additional Resources The following published or web-based documentation has been referred to in the following sections, and may provide useful further reference material for the Local Development Framework.
1) Future Water – The Government’s Water Strategy for England, (HMSO,
2008) http://www.defra.gov.uk/environment/water/strategy
2) Making Space for Water – Government Programme for Flood & Coastal Flood Risk Management http://www.defra.gov.uk/environ/fcd/policy/strategy.htm
3) Faulkner, B.L., ‘The Analysis of Flooding and Land Drainage on a Catchment-Wide Basis’. National Symposium on Catchment Planning and Management, Wallingford, June 1993
4) Faulkner, B.L., ‘Innovative and Cost-effective Design of Flood Attenuation Reservoirs in Urban Areas Based on the Exploitation of Catchment Runoff Dynamics’. Novatech 2001 - 4th International Conference on Innovative Technologies in Urban Storm Drainage, Lyon, France, May 2001
5) Faulkner, B.L. ‘The Control of Surface Runoff from New Development - UK National Policy in Need of Review?’. In Urban Water - An International Journal, Volume 1, no.2, Elsevier, June 2000
6) Foresight Programme Future Flooding – Flood and Coastal Defence http://www.foresight.gov.uk/previous_projects/flood_and_coastal_defence/
7) Strategic Flood Mitigation Options – Appraisal Report. ESG Herefordshire Ltd, Dec. Capita Symonds, 2007

Strategic Flood Risk Assessment Strategy Options for Drainage & Flood Management
Local Development Framework Supporting Documentation 9-25
Evidence Map 9-1 – Flood Control Strategies
FR5, FR6, FR7, FR8FR5, FR6, FR7, FR8FR5, FR6, FR7, FR8FR5, FR6, FR7, FR8FR5, FR6, FR7, FR8FR5, FR6, FR7, FR8FR5, FR6, FR7, FR8FR5, FR6, FR7, FR8FR5, FR6, FR7, FR8
FR1, FR2, FR5, FR6, FR7FR1, FR2, FR5, FR6, FR7FR1, FR2, FR5, FR6, FR7FR1, FR2, FR5, FR6, FR7FR1, FR2, FR5, FR6, FR7FR1, FR2, FR5, FR6, FR7FR1, FR2, FR5, FR6, FR7FR1, FR2, FR5, FR6, FR7FR1, FR2, FR5, FR6, FR7
FR5, FR6, FR7FR5, FR6, FR7FR5, FR6, FR7FR5, FR6, FR7FR5, FR6, FR7FR5, FR6, FR7FR5, FR6, FR7FR5, FR6, FR7FR5, FR6, FR7
FR1, FR2, FR5, FR6, FR7FR1, FR2, FR5, FR6, FR7FR1, FR2, FR5, FR6, FR7FR1, FR2, FR5, FR6, FR7FR1, FR2, FR5, FR6, FR7FR1, FR2, FR5, FR6, FR7FR1, FR2, FR5, FR6, FR7FR1, FR2, FR5, FR6, FR7FR1, FR2, FR5, FR6, FR7
FR3, FR4, FR5FR3, FR4, FR5FR3, FR4, FR5FR3, FR4, FR5FR3, FR4, FR5FR3, FR4, FR5FR3, FR4, FR5FR3, FR4, FR5FR3, FR4, FR5
FR3, FR4, FR5FR3, FR4, FR5FR3, FR4, FR5FR3, FR4, FR5FR3, FR4, FR5FR3, FR4, FR5FR3, FR4, FR5FR3, FR4, FR5FR3, FR4, FR5 FR5, FR6, FR7FR5, FR6, FR7FR5, FR6, FR7FR5, FR6, FR7FR5, FR6, FR7FR5, FR6, FR7FR5, FR6, FR7FR5, FR6, FR7FR5, FR6, FR7
FR3, FR4, FR5FR3, FR4, FR5FR3, FR4, FR5FR3, FR4, FR5FR3, FR4, FR5FR3, FR4, FR5FR3, FR4, FR5FR3, FR4, FR5FR3, FR4, FR5
FR3, FR4, FR5FR3, FR4, FR5FR3, FR4, FR5FR3, FR4, FR5FR3, FR4, FR5FR3, FR4, FR5FR3, FR4, FR5FR3, FR4, FR5FR3, FR4, FR5FR5, FR8FR5, FR8FR5, FR8FR5, FR8FR5, FR8FR5, FR8FR5, FR8FR5, FR8FR5, FR8
FR5, FR8FR5, FR8FR5, FR8FR5, FR8FR5, FR8FR5, FR8FR5, FR8FR5, FR8FR5, FR8FR5, FR6, FR7FR5, FR6, FR7FR5, FR6, FR7FR5, FR6, FR7FR5, FR6, FR7FR5, FR6, FR7FR5, FR6, FR7FR5, FR6, FR7FR5, FR6, FR7
FR5, FR6, FR7FR5, FR6, FR7FR5, FR6, FR7FR5, FR6, FR7FR5, FR6, FR7FR5, FR6, FR7FR5, FR6, FR7FR5, FR6, FR7FR5, FR6, FR7
FR3, FR4, FR5FR3, FR4, FR5FR3, FR4, FR5FR3, FR4, FR5FR3, FR4, FR5FR3, FR4, FR5FR3, FR4, FR5FR3, FR4, FR5FR3, FR4, FR5
FR3, FR4, FR5FR3, FR4, FR5FR3, FR4, FR5FR3, FR4, FR5FR3, FR4, FR5FR3, FR4, FR5FR3, FR4, FR5FR3, FR4, FR5FR3, FR4, FR5
FR5, FR6, FR7FR5, FR6, FR7FR5, FR6, FR7FR5, FR6, FR7FR5, FR6, FR7FR5, FR6, FR7FR5, FR6, FR7FR5, FR6, FR7FR5, FR6, FR7
FR5, FR8FR5, FR8FR5, FR8FR5, FR8FR5, FR8FR5, FR8FR5, FR8FR5, FR8FR5, FR8
FR5, FR6, FR7FR5, FR6, FR7FR5, FR6, FR7FR5, FR6, FR7FR5, FR6, FR7FR5, FR6, FR7FR5, FR6, FR7FR5, FR6, FR7FR5, FR6, FR7
FR5, FR6, FR7FR5, FR6, FR7FR5, FR6, FR7FR5, FR6, FR7FR5, FR6, FR7FR5, FR6, FR7FR5, FR6, FR7FR5, FR6, FR7FR5, FR6, FR7
FR3, FR4, FR5FR3, FR4, FR5FR3, FR4, FR5FR3, FR4, FR5FR3, FR4, FR5FR3, FR4, FR5FR3, FR4, FR5FR3, FR4, FR5FR3, FR4, FR5
FR5, FR6, FR7FR5, FR6, FR7FR5, FR6, FR7FR5, FR6, FR7FR5, FR6, FR7FR5, FR6, FR7FR5, FR6, FR7FR5, FR6, FR7FR5, FR6, FR7
FR3, FR9FR3, FR9FR3, FR9FR3, FR9FR3, FR9FR3, FR9FR3, FR9FR3, FR9FR3, FR9
FR5, FR6, FR7FR5, FR6, FR7FR5, FR6, FR7FR5, FR6, FR7FR5, FR6, FR7FR5, FR6, FR7FR5, FR6, FR7FR5, FR6, FR7FR5, FR6, FR7
FR5, FR8FR5, FR8FR5, FR8FR5, FR8FR5, FR8FR5, FR8FR5, FR8FR5, FR8FR5, FR8
FR5, FR6, FR7FR5, FR6, FR7FR5, FR6, FR7FR5, FR6, FR7FR5, FR6, FR7FR5, FR6, FR7FR5, FR6, FR7FR5, FR6, FR7FR5, FR6, FR7
FR1, FR2, FR5, FR6, FR7FR1, FR2, FR5, FR6, FR7FR1, FR2, FR5, FR6, FR7FR1, FR2, FR5, FR6, FR7FR1, FR2, FR5, FR6, FR7FR1, FR2, FR5, FR6, FR7FR1, FR2, FR5, FR6, FR7FR1, FR2, FR5, FR6, FR7FR1, FR2, FR5, FR6, FR7
FR1, FR2FR1, FR2FR1, FR2FR1, FR2FR1, FR2FR1, FR2FR1, FR2FR1, FR2FR1, FR2
FR5, FR6, FR7FR5, FR6, FR7FR5, FR6, FR7FR5, FR6, FR7FR5, FR6, FR7FR5, FR6, FR7FR5, FR6, FR7FR5, FR6, FR7FR5, FR6, FR7
FR3, FR4, FR5FR3, FR4, FR5FR3, FR4, FR5FR3, FR4, FR5FR3, FR4, FR5FR3, FR4, FR5FR3, FR4, FR5FR3, FR4, FR5FR3, FR4, FR5
FR3, FR4, FR5FR3, FR4, FR5FR3, FR4, FR5FR3, FR4, FR5FR3, FR4, FR5FR3, FR4, FR5FR3, FR4, FR5FR3, FR4, FR5FR3, FR4, FR5FR5, FR8FR5, FR8FR5, FR8FR5, FR8FR5, FR8FR5, FR8FR5, FR8FR5, FR8FR5, FR8
FR3, FR4, FR5FR3, FR4, FR5FR3, FR4, FR5FR3, FR4, FR5FR3, FR4, FR5FR3, FR4, FR5FR3, FR4, FR5FR3, FR4, FR5FR3, FR4, FR5
FR5, FR6, FR7FR5, FR6, FR7FR5, FR6, FR7FR5, FR6, FR7FR5, FR6, FR7FR5, FR6, FR7FR5, FR6, FR7FR5, FR6, FR7FR5, FR6, FR7
FR5, FR6, FR7FR5, FR6, FR7FR5, FR6, FR7FR5, FR6, FR7FR5, FR6, FR7FR5, FR6, FR7FR5, FR6, FR7FR5, FR6, FR7FR5, FR6, FR7
FR3, FR4, FR5FR3, FR4, FR5FR3, FR4, FR5FR3, FR4, FR5FR3, FR4, FR5FR3, FR4, FR5FR3, FR4, FR5FR3, FR4, FR5FR3, FR4, FR5
FR1, FR2FR1, FR2FR1, FR2FR1, FR2FR1, FR2FR1, FR2FR1, FR2FR1, FR2FR1, FR2
FR5, FR6, FR7FR5, FR6, FR7FR5, FR6, FR7FR5, FR6, FR7FR5, FR6, FR7FR5, FR6, FR7FR5, FR6, FR7FR5, FR6, FR7FR5, FR6, FR7
FR5, FR6, FR7FR5, FR6, FR7FR5, FR6, FR7FR5, FR6, FR7FR5, FR6, FR7FR5, FR6, FR7FR5, FR6, FR7FR5, FR6, FR7FR5, FR6, FR7
FR5, FR8FR5, FR8FR5, FR8FR5, FR8FR5, FR8FR5, FR8FR5, FR8FR5, FR8FR5, FR8
FR5, FR6, FR7FR5, FR6, FR7FR5, FR6, FR7FR5, FR6, FR7FR5, FR6, FR7FR5, FR6, FR7FR5, FR6, FR7FR5, FR6, FR7FR5, FR6, FR7
FR1, FR2FR1, FR2FR1, FR2FR1, FR2FR1, FR2FR1, FR2FR1, FR2FR1, FR2FR1, FR2
FR1, FR2FR1, FR2FR1, FR2FR1, FR2FR1, FR2FR1, FR2FR1, FR2FR1, FR2FR1, FR2
FR5, FR6, FR7FR5, FR6, FR7FR5, FR6, FR7FR5, FR6, FR7FR5, FR6, FR7FR5, FR6, FR7FR5, FR6, FR7FR5, FR6, FR7FR5, FR6, FR7
FR1, FR2, FR5, FR6, FR7FR1, FR2, FR5, FR6, FR7FR1, FR2, FR5, FR6, FR7FR1, FR2, FR5, FR6, FR7FR1, FR2, FR5, FR6, FR7FR1, FR2, FR5, FR6, FR7FR1, FR2, FR5, FR6, FR7FR1, FR2, FR5, FR6, FR7FR1, FR2, FR5, FR6, FR7
FR3, FR4, FR5FR3, FR4, FR5FR3, FR4, FR5FR3, FR4, FR5FR3, FR4, FR5FR3, FR4, FR5FR3, FR4, FR5FR3, FR4, FR5FR3, FR4, FR5
FR5, FR6, FR7FR5, FR6, FR7FR5, FR6, FR7FR5, FR6, FR7FR5, FR6, FR7FR5, FR6, FR7FR5, FR6, FR7FR5, FR6, FR7FR5, FR6, FR7
Kington
Presteigne
Knighton
Leominster
Bromyard
Malvern
Ledbury
Hay on Wye
Ross on Wye
Hereford
Newent
KeyWye Catchment
Herefordshire
Principal Rivers
Main Town
Village
Recomended catchmentdrainage strategyStrategic attenuationdesirableChannel improvementdesirableLand managementdesirableEA Flood Zone 2
Drawing
Title
Subset
No.
Date
Check:
Revisions
Scale : 1:NTS
Evidence Map 9-1
Flood ControlStrategiesBy sub-catchment
1110/EB/9-1/a
24-1-2008
BF
Client
Herefordshire Council
Scheme
Strategic Flood Risk Assessment
NBased upon the Ordnance Survey Map withBased upon the Ordnance Survey Map withBased upon the Ordnance Survey Map withBased upon the Ordnance Survey Map withBased upon the Ordnance Survey Map withBased upon the Ordnance Survey Map withBased upon the Ordnance Survey Map withBased upon the Ordnance Survey Map withBased upon the Ordnance Survey Map withthe permission of the Controller of Her Majesty'sthe permission of the Controller of Her Majesty'sthe permission of the Controller of Her Majesty'sthe permission of the Controller of Her Majesty'sthe permission of the Controller of Her Majesty'sthe permission of the Controller of Her Majesty'sthe permission of the Controller of Her Majesty'sthe permission of the Controller of Her Majesty'sthe permission of the Controller of Her Majesty'sStationery Office, Stationery Office, Stationery Office, Stationery Office, Stationery Office, Stationery Office, Stationery Office, Stationery Office, Stationery Office, Crown Copyright Licence No. 100024168Crown Copyright Licence No. 100024168Crown Copyright Licence No. 100024168Crown Copyright Licence No. 100024168Crown Copyright Licence No. 100024168Crown Copyright Licence No. 100024168Crown Copyright Licence No. 100024168Crown Copyright Licence No. 100024168Crown Copyright Licence No. 100024168Herefordshire CouncilHerefordshire CouncilHerefordshire CouncilHerefordshire CouncilHerefordshire CouncilHerefordshire CouncilHerefordshire CouncilHerefordshire CouncilHerefordshire Council
FR3FR3FR3FR3FR3FR3FR3FR3FR3
Strategic Flood Risk Assessment Future Flood Management Issues
Local Development Framework Supporting Documentation 10-1
10. FUTURE FLOOD MANAGEMENT ISSUES It is likely that in the coming decade Herefordshire Council will play an increasingly proactive role in the strategic and contingency aspects of ever increasing flood risk within its own region. The following sections summarises latest industry and Government guidance and evolving issues that are likely to directly affect Herefordshire Council and which may provide further material for the evidence base.
10.1 UK Climate Impacts Programme – UKCIP The Climate of the United Kingdom and Recent Trends 1 is the first in a series of reports under the umbrella of the UK 21st Century Climate Change Scenarios (known as UKCIP08). UKCIP08 will provide probabilistic climate projections, based on an approach developed by the Met Office Hadley Centre. The Scenarios Gateway of the UK Climate Change Impacts Programme (www.ukcip.org.uk) provides access to maps, datasets and guidance relevant to UKCIP climate change scenarios. The UKCIP climate change scenarios are funded by the Department for Environment, Food and Rural Affairs (DEFRA) and modelled by the Hadley Centre for Climate Prediction and Research (part of the Met Office), and are a key component of UK national and regional climate impacts assessment. The guidance pages are a good starting point for general information about climate change scenarios and their use in impacts assessment. They describe how climate change scenarios can be used in decision-making and provide details of the uncertainties involved in climate modelling. They also contain frequently asked questions, definitions of commonly-used terms and links to other relevant data and resources.
10.2 Foresight Future Flooding Report How will climate change affect us in 30 to 100 years time? How much will flooding increase in that time? How should changes be managed? These and many other questions are tackled in the Foresight Future Flooding 2 report that was released in April 2004 by the Department of Trade and Industry (DTI). The report is the most wide-ranging analysis of flood risk in the UK. It predicts that climate change will be an important factor in increasing flood risk, and that both the number of people in danger from flooding and the costs of damage from floods will significantly rise. Using a series of scenarios that take into account potential social and economic changes, as well as information on climate change, the main findings of the Foresight Future Flooding report are as follows:
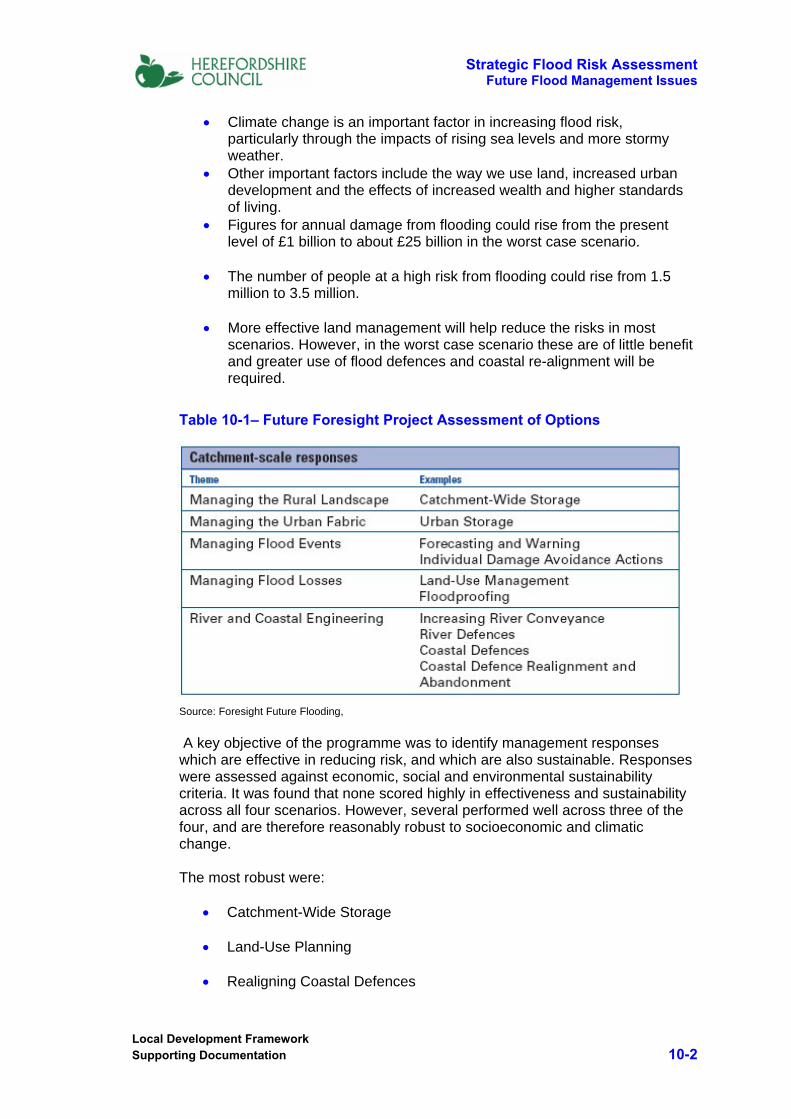
Strategic Flood Risk Assessment Future Flood Management Issues
Local Development Framework Supporting Documentation 10-2
• Climate change is an important factor in increasing flood risk, particularly through the impacts of rising sea levels and more stormy weather.
• Other important factors include the way we use land, increased urban development and the effects of increased wealth and higher standards of living.
• Figures for annual damage from flooding could rise from the present level of £1 billion to about £25 billion in the worst case scenario.
• The number of people at a high risk from flooding could rise from 1.5 million to 3.5 million.
• More effective land management will help reduce the risks in most scenarios. However, in the worst case scenario these are of little benefit and greater use of flood defences and coastal re-alignment will be required.
Table 10-1– Future Foresight Project Assessment of Options
Source: Foresight Future Flooding, A key objective of the programme was to identify management responses which are effective in reducing risk, and which are also sustainable. Responses were assessed against economic, social and environmental sustainability criteria. It was found that none scored highly in effectiveness and sustainability across all four scenarios. However, several performed well across three of the four, and are therefore reasonably robust to socioeconomic and climatic change. The most robust were:
• Catchment-Wide Storage
• Land-Use Planning
• Realigning Coastal Defences

Strategic Flood Risk Assessment Future Flood Management Issues
Local Development Framework Supporting Documentation 10-3
All of these can produce environmental benefits, reduce flood risk and be made sustainable with careful implementation. The key message is that it is how the responses are implemented, that is the critical factor. The key strategic choices facing regulatory agencies and LPAs include:
• What standards of protection should we aim for in the future, and what standards will the public expect
• Who should pay for that protection
• How should we use land, balancing the wider economic and social needs against creating a legacy of flood risk?
While these issues are not new, the project has provided scientific-based estimates of the risks and costs of responses. These will help to inform the development of long-term policies. They will also allow decision-makers to gauge the importance of flood management relative to the many other issues faced.
10.3 DEFRA - Making Space for Water The DEFRA strategy ‘Making Space for Water’ 3 has identified the need for a holistic, joined-up, and integrated approach to manage flood risk. An improved response is especially needed in urban areas where there is a complex interaction of drainage systems and fractured institutional arrangements. One of the Making Space for Water research themes is therefore addressing integrated urban drainage management (IUDM, HA2); how technical and institutional approaches to managing urban drainage systems can be improved to most effectively deliver reduced flood risk in urban areas and at the same time contribute to delivering water quality protection and improvements required by the Water Framework Directive. Inefficiencies in the current institutional arrangements are still being examined using the pilot studies as a primary source of evidence. However four categories of inefficiency have quickly emerged:
1. Information. When customers are flooded from stormwater, they do not know who to contact for help or where to report the incident. Anecdotal evidence suggests that customers can be passed between organisations with no one willing to take responsibility for the water or the incident. There is no single repository or formal reporting of historic flood incidents from stormwater, except perhaps insurance companies, who rarely share this information because it is commercially sensitive.
2. Risk assessment. No single organisation has an incentive to carry out a comprehensive assessment of the risks of stormwater flooding or has been given responsibility to do so. Individual organisations typically conduct their own independent work on mapping and modelling flood risk in relation to their own assets, with no one taking a strategic or
Strategic Flood Risk Assessment Future Flood Management Issues
Local Development Framework Supporting Documentation 10-4
holistic overview. Some local authorities have begun to develop Surface Water Management Plans which integrate drainage provision across local development sites
3. Development planning. Decisions for new development (properties and infrastructure) are often taken without a full understanding of the risks of stormwater flooding – in part because no one organisation takes responsibility for assessing the effect of the cumulative runoff from new developments. Consideration of new developments on a case-by-case basis can ignore cumulative stormwater effect
4. Investment decisions. As organisations own different parts of the urban drainage infrastructure, they make investment decisions based on a limited cost-benefit analysis that rarely considers the wider drainage issues. The sum total of these individual and piecemeal investment strategies is unlikely to produce the most effective solution.
10.4 Future Water – Government Water Strategy for England
Published in March 2008, the Future Water 4 strategy document is a far-reaching set of objectives and visions across the entire water cycle. Amongst other objectives, the Government signals its intention to use Surface Water Management Plans as a tool to improve the coordination of drainage stakeholders. It also wants to promote sustainable drainage by clarifying responsibilities and improving incentives for property owners and developers. Consultations are ongoing on these issues, including options for ownership and maintenance of sustainable drainage systems, and alternatives to the ability to automatically connect surface water drainage to the public sewerage system.
10.5 The Pitt Review 2008 The final report is expected in late 2008, and is likely to emphasise an increased role for LPAs in emergency planning and coordination, critical infrastructure protection, and strategic drainage planning.
10.6 Insurance Industry Drivers A concluding assessment of future drivers in integrated flood risk management would not be complete without reference to the critical influence of the insurance industry. Developments at risk of flooding may increasingly face difficulties with the cost or availability of insurance. This, in turn, could cause problems for property buyers in obtaining mortgages. PPS 25 suggests that the insurance industry may wish to seek to reduce the risk exposure by making appropriate representations about proposals for the location of new development during the preparation of local development plans 6. The LPA should be cognisant of this.
Strategic Flood Risk Assessment Future Flood Management Issues
Local Development Framework Supporting Documentation 10-5
The insurance industry increasingly perceives that there are opportunities for it to:
• use its risk management skills to help planners, architects, utilities and other sectors of society to manage flood risk
• go to court to recover claims payments from the authorities, thus providing an incentive for the authorities to manage flood risks better
• help local planners to avoid building in flood hazard areas
Quoting from Insurance Research and Practice 7 “the ABI Statement of Insurance Principles was intended to reduce social problems by helping existing insurance customers maintain their cover, provided the flood hazard is less than a 1.3% probability (1 in 75 yeas.) But it is discriminatory …. Low-income families may be more likely to shop around for insurance or to have breaks in cover when finances are tight. Many Iow income families do not have bank accounts or access to insurance with rent schemes so continuity of cover can be difficult. This can mean they have no protection from the ABI statement. The ABI estimates that over a million people could lose their insurance following revisions to the statement. The plight of small businesses flood hazard areas also needs to be considered. They receive little help from the authorities yet they provide local employment and are a source of innovative new ideas and enterprise. The local hairdresser, pub or corner shop is an important element in making the local, community more cohesive and cultivating good citizenship, but these businesses are becoming increasingly vulnerable to bankruptcy after a flood event. Even without climate change, all these factors add up to, a recipe for social exclusion on a large scale. Insurers should be aware that this could lead to a breakdown not only in essential services but in law and order. There could even be pressure from the government with threats to apply increased regulation of insurance to contain increases in premium.” The insurance industry is currently considering a two pronged approach for the future:
• Increasing use of litigation against LPAs if flood damages are thought to be the result of poor maintenance, neglect or negligence in the operation of flood defence infrastructure
• Insurers are a key stakeholder, and could offer increased expert advice and partnership with LPAs via flood liaison advice groups (FLAGS).
Strategic Flood Risk Assessment Future Flood Management Issues
Local Development Framework Supporting Documentation 10-6
10.7 References and Further Resources The following published or web-based documentation has been referred to in the following sections, and may provide useful further reference material for the Local Development Framework. 1) The Climate of the UK and Recent Trends – UKCIP08
http://www.ukcip.org.uk/index.php?option=com_content&task=view&id=469&Itemid=477
2) Future Foresight Programme – Flood and Coastal Defence http://www.foresight.gov.uk/Previous_Projects/Flood_and_Coastal_Defence/index.html
3) Making Space for Water – Government Programme for Flood & Coastal Flood Risk Management http://www.defra.gov.uk/environ/fcd/policy/strategy.htm
4) Future Water – The Government’s Water Strategy for England, (HMSO, 2008) http://www.defra.gov.uk/environment/water/strategy
5) West Midlands Regional Flood Risk Appraisal , Faber Maunsell, October 2007
6) Association of British Insurers (undated). Flooding and Insurance. http://www.abi.org.uk/flooding
7) Insurance Research and Practice, D. Crichton, No 1, December 2007 http://www.cii.co.uk
Strategic Flood Risk Assessment Drawings and Technical Appendices
Local Development Framework Supporting Documentation 11-A
11. DRAWINGS & TECHNICAL APPENDICES
11.1 List of A2 Evidence Maps Evidence Map 1-1 – River Wye Catchment and Extent of SFRA Study Area...... 1-20 Evidence Map 2-1 – Sub-catchments, floodplains and topography.................... 2-12 Evidence Map 2-2 – Standard Percentage Runoff by Sub-catchment ................ 2-13 Evidence Map 2-3 – Comparative UH Time to Peak by Sub-catchment.............. 2-14 Evidence Map 3-1 – Environment Agency Flood Zones ....................................... 3-32 Evidence Map 3-2 – Environment Agency Flood Zones Hereford....................... 3-33 Evidence Map 3-3 – Environment Agency Flood Zones Ross-on-Wye............... 3-34 Evidence Map 3-4 – Environment Agency Flood Zones Leominster .................. 3-35 Evidence Map 3-5 – Environment Agency Flood Zones Bromyard..................... 3-36 Evidence Map 3-6 – Environment Agency Flood Zones Ledbury........................ 3-37 Evidence Map 3-7 – Environment Agency Flood Zones Kington ........................ 3-38 Evidence Map 3-8 – Historical Flood Reports By Sub-catchment ....................... 3-39 Evidence Map 3-9 – Location of Hydraulic Models and Cross-sections............. 3-40 Evidence Map 4-1 – Flood Risk Map ....................................................................... 4-11 Evidence Map 5-1 – Possible Development Sites ................................................. 5-59 Evidence Map 5-2 – Development Pressure around Hereford ............................. 5-60 Evidence Map 6-1 – Flood Warning Systems within Herefordshire ...................... 6-9 Evidence Map 6-2 – Fluvial Flood Imminence........................................................ 6-10 Evidence Map 8-1 – Flood Affected Highways....................................................... 8-13 Evidence Map 8-2 – Critical Infrastructure in Hereford......................................... 8-14 Evidence Map 8-3 – Critical Infrastructure in Leominster .................................... 8-15 Evidence Map 8-4 – Critical Infrastructure in Ross-on-Wye................................. 8-16 Evidence Map 8-5 – Critical Infrastructure in Ledbury ......................................... 8-17 Evidence Map 8-6 – Critical Infrastructure in Bromyard....................................... 8-18 Evidence Map 8-7 – Critical Infrastructure in Kington .......................................... 8-19 Evidence Map 9-1 – Flood Control Strategies........................................................ 9-25
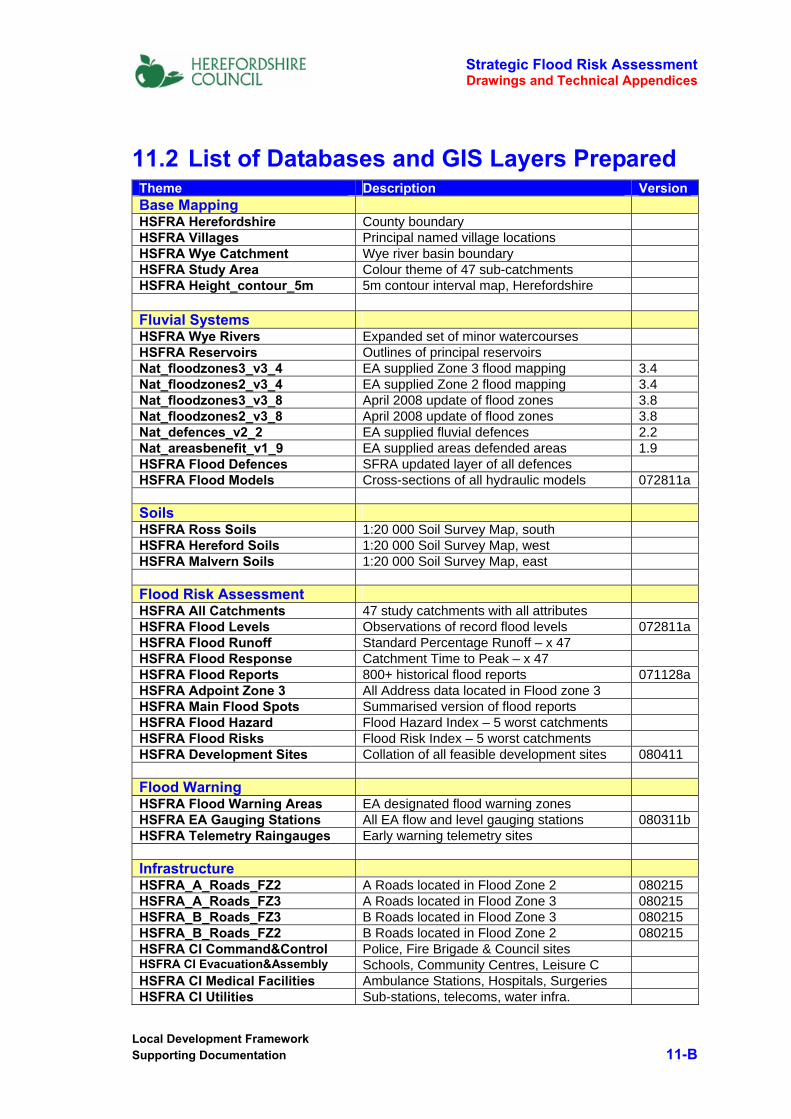
Strategic Flood Risk Assessment Drawings and Technical Appendices
Local Development Framework Supporting Documentation 11-B
11.2 List of Databases and GIS Layers Prepared Theme Description Version Base Mapping HSFRA Herefordshire County boundary HSFRA Villages Principal named village locations HSFRA Wye Catchment Wye river basin boundary HSFRA Study Area Colour theme of 47 sub-catchments HSFRA Height_contour_5m 5m contour interval map, Herefordshire Fluvial Systems HSFRA Wye Rivers Expanded set of minor watercourses HSFRA Reservoirs Outlines of principal reservoirs Nat_floodzones3_v3_4 EA supplied Zone 3 flood mapping 3.4 Nat_floodzones2_v3_4 EA supplied Zone 2 flood mapping 3.4 Nat_floodzones3_v3_8 April 2008 update of flood zones 3.8 Nat_floodzones2_v3_8 April 2008 update of flood zones 3.8 Nat_defences_v2_2 EA supplied fluvial defences 2.2 Nat_areasbenefit_v1_9 EA supplied areas defended areas 1.9 HSFRA Flood Defences SFRA updated layer of all defences HSFRA Flood Models Cross-sections of all hydraulic models 072811a Soils HSFRA Ross Soils 1:20 000 Soil Survey Map, south HSFRA Hereford Soils 1:20 000 Soil Survey Map, west HSFRA Malvern Soils 1:20 000 Soil Survey Map, east Flood Risk Assessment HSFRA All Catchments 47 study catchments with all attributes HSFRA Flood Levels Observations of record flood levels 072811a HSFRA Flood Runoff Standard Percentage Runoff – x 47 HSFRA Flood Response Catchment Time to Peak – x 47 HSFRA Flood Reports 800+ historical flood reports 071128a HSFRA Adpoint Zone 3 All Address data located in Flood zone 3 HSFRA Main Flood Spots Summarised version of flood reports HSFRA Flood Hazard Flood Hazard Index – 5 worst catchments HSFRA Flood Risks Flood Risk Index – 5 worst catchments HSFRA Development Sites Collation of all feasible development sites 080411 Flood Warning HSFRA Flood Warning Areas EA designated flood warning zones HSFRA EA Gauging Stations All EA flow and level gauging stations 080311b HSFRA Telemetry Raingauges Early warning telemetry sites Infrastructure HSFRA_A_Roads_FZ2 A Roads located in Flood Zone 2 080215 HSFRA_A_Roads_FZ3 A Roads located in Flood Zone 3 080215 HSFRA_B_Roads_FZ3 B Roads located in Flood Zone 3 080215 HSFRA_B_Roads_FZ2 B Roads located in Flood Zone 2 080215 HSFRA CI Command&Control Police, Fire Brigade & Council sites HSFRA CI Evacuation&Assembly Schools, Community Centres, Leisure C HSFRA CI Medical Facilities Ambulance Stations, Hospitals, Surgeries HSFRA CI Utilities Sub-stations, telecoms, water infra.

Strategic Flood Risk Assessment Drawings and Technical Appendices
Local Development Framework Supporting Documentation 11-C
Flood Management Strategy HSFRA Zone 3 Climate Change JFLOW outline of Zone 3 @ flows + 20% HSFRA Zone 3 Climate Change Update to above file, now including Leadon 081013 HSFRA Flood Control Strategies Proposed drainage strategies x 47 HSFRA Functional Floodplain JFLOW output of Q20 floodplain, all areas 081013 Post Publication Updated Layers HSFRA Development Sites Update to earlier file 080630
Strategic Flood Risk Assessment Drawings and Technical Appendices
Local Development Framework Supporting Documentation 11-D
11.3 Flood Estimation Catchment Data This section contains summary Tables for Catchment Descriptor data derived from the Flood Estimation Handbook. All parameters quoted relate to the total upstream area inclusive of the cited sub-catchment, and are NOT specific to the individual named catchments. The critical duration storm (D Storm C) is derived conventionally from the FEH recommended formula: D Storm C = Tp(t) x (1 + SAAR / 1000) Conventionally the critical storm duration must be to the nearest odd integer, to provide a symmetrical storm distribution. The critical storm duration is that which will produce the largest peak flow for a specified event probability. Hence, for the Lugg and Arrow catchments above Leominster, the critical storm duration which will produce the largest peak for any specified probability is a 19 hour duration event. The fact that the Lugg and Arrow catchments have the same critical duration greatly increases the likelihood of coincident events, and explains why there are disproportionately high significant floodplains in this area.
11.4 Catchment Flood Hazard Index In essence, this Index attempts to objectively classify sub-catchments into a flood hazard potential class, derived from a comparative ranking of each sub-catchment with regard to a specific flood creating attribute. These attributes are subjective, and could be the subject of further refinement in the future if the method is found useful. The principal use of the method is to provide a planning tool when considering alternative sites for development under the Sequential Test. If there is little to choose between sites on capacity, infrastructure, highways and environmental features, then the Flood Hazard Potential Index could be sued to assign the development to an area with the lowest potential flood hazard. The primary flood hazard attributes considered are discussed listed below.
11.4.1 Catchment Area It is intuitively obvious that larger catchments will create larger floods. However, river capacities expand in proportion to the catchment area upstream, so area per se is not necessarily indicative of increased flood risk. To be meaningful, catchment measures of flood potential should necessarily be standardised i.e. related to unit area.

Strategic Flood Risk Assessment Drawings and Technical Appendices
Local Development Framework Supporting Documentation 11-E
Obviously a catchment with a high level of impermeability might flood anywhere within the area, not just at a downstream river location. Hence we have discounted using catchment area directly within the computation of the CFRP index. However, area IS used in the computation of a standardised assessment of the Flooding Reports database (described in 3.5.7 below).
11.4.2 Standard Annual Average Rainfall (SAAR) Annual average rainfall varies across Herefordshire, decreasing markedly west to east. Higher SAAR values tend to be associated with higher elevations, which in turn is associated with steeper catchments. However, the majority of the surface water flooding reports in Herefordshire lie in the eastern catchments where rainfall is lowest. SAAR is insufficiently sensitive therefore as a measure of isolated flood risk, and it is heavily cross-correlated with other more useful indicators such as soil moisture deficit.
11.4.3 Soil Moisture Deficit (SMD) As evaporation rates accelerate through the spring and soils dry out a 'soil moisture deficit' becomes established - this represents the amount of rainfall necessary to return the soil to what is called 'field capacity' (when the soil can hold no further water) - this is typical of most soils through the winter. Soil moisture conditions are very important in agriculture - they are used directly to assess irrigation needs for a variety of crops - but they also exert an important control on river flows. High soil moisture deficits which extend across much of England in a typical summer allow the soils to absorb much of the summer rainfall reducing the risk of flooding. Equally, long-term average low soil moisture deficits indicate ‘wet’ catchments which obviously have higher propensity to flood. The Met Office provides monthly and weekly soil moisture data for 40 km by 40 km squares in Britain, based on 120 meteorological stations, the so called MORECS system. The long-term average SMD parameter can be readily established from FEH data, and it is a useful general indicator of increased flood risk.
11.4.4 Standard Percentage Runoff (SPR) Catchments with low SPR values will as a general rule generate low response to rainfall. This is because they are more permeable, and a significant proportion of precipitation tends to infiltrate to deeper ground, until these zones reach field saturation point. Conversely, high SPR values imply less permeable soils, which will tend to become saturated quickly, and increase runoff rates and possibly even lead to flash flooding.
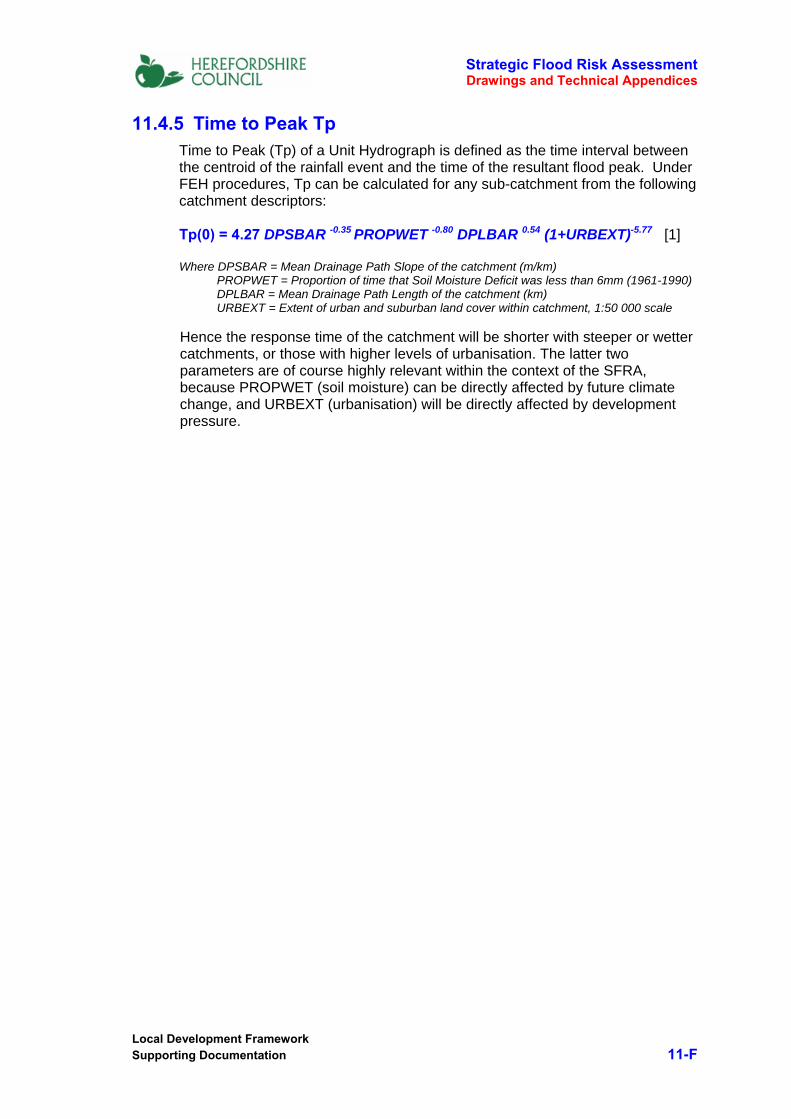
Strategic Flood Risk Assessment Drawings and Technical Appendices
Local Development Framework Supporting Documentation 11-F
11.4.5 Time to Peak Tp Time to Peak (Tp) of a Unit Hydrograph is defined as the time interval between the centroid of the rainfall event and the time of the resultant flood peak. Under FEH procedures, Tp can be calculated for any sub-catchment from the following catchment descriptors: Tp(0) = 4.27 DPSBAR -0.35 PROPWET -0.80 DPLBAR 0.54 (1+URBEXT)-5.77 [1] Where DPSBAR = Mean Drainage Path Slope of the catchment (m/km) PROPWET = Proportion of time that Soil Moisture Deficit was less than 6mm (1961-1990) DPLBAR = Mean Drainage Path Length of the catchment (km) URBEXT = Extent of urban and suburban land cover within catchment, 1:50 000 scale Hence the response time of the catchment will be shorter with steeper or wetter catchments, or those with higher levels of urbanisation. The latter two parameters are of course highly relevant within the context of the SFRA, because PROPWET (soil moisture) can be directly affected by future climate change, and URBEXT (urbanisation) will be directly affected by development pressure.
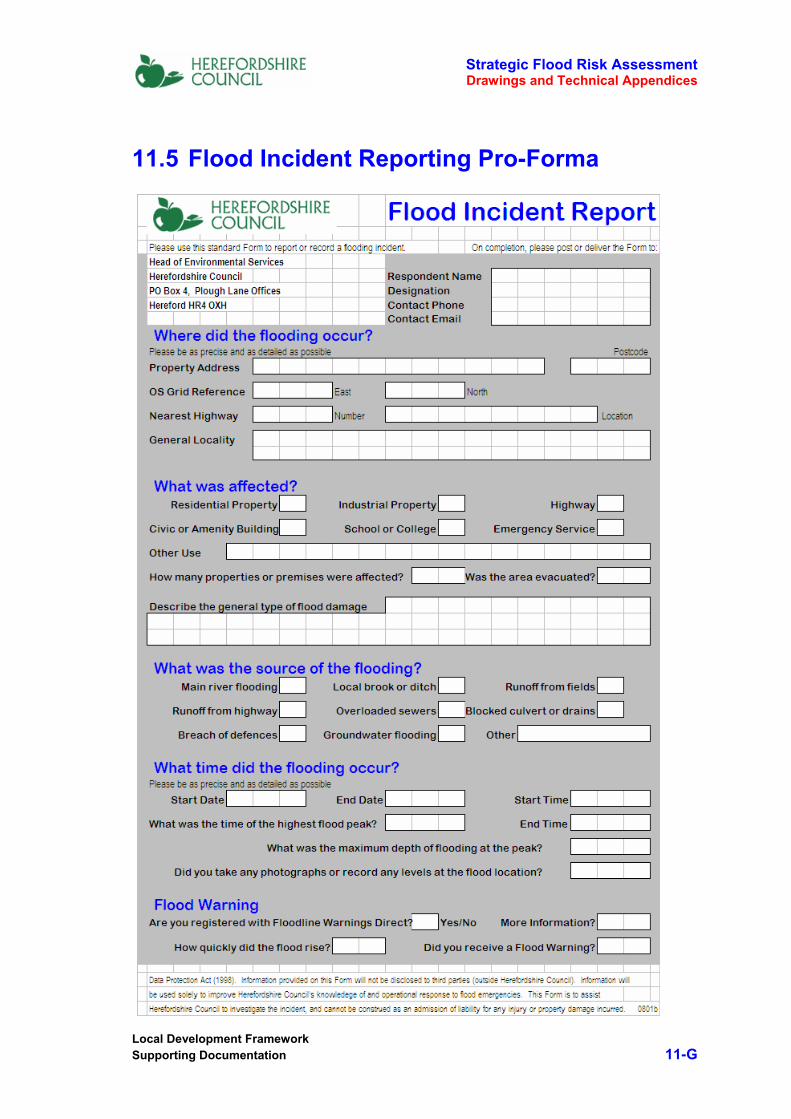
Strategic Flood Risk Assessment Drawings and Technical Appendices
Local Development Framework Supporting Documentation 11-G
11.5 Flood Incident Reporting Pro-Forma
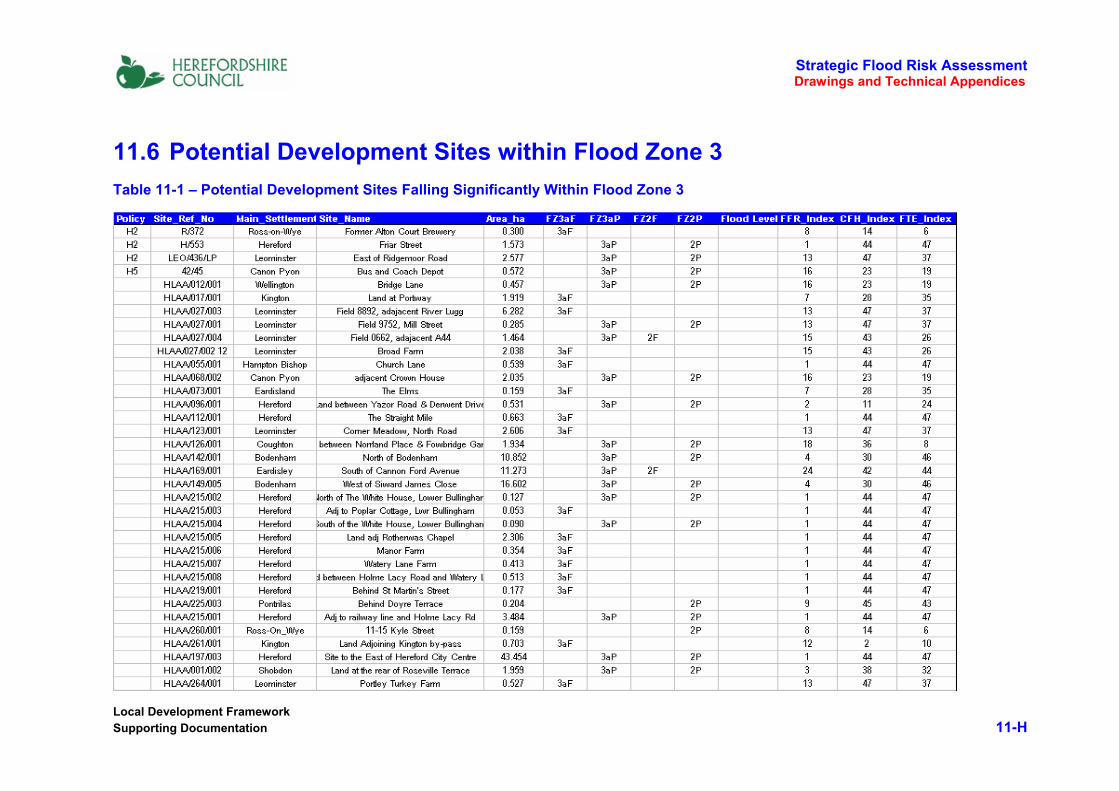
Strategic Flood Risk Assessment Drawings and Technical Appendices
Local Development Framework Supporting Documentation 11-H
11.6 Potential Development Sites within Flood Zone 3 Table 11-1 – Potential Development Sites Falling Significantly Within Flood Zone 3
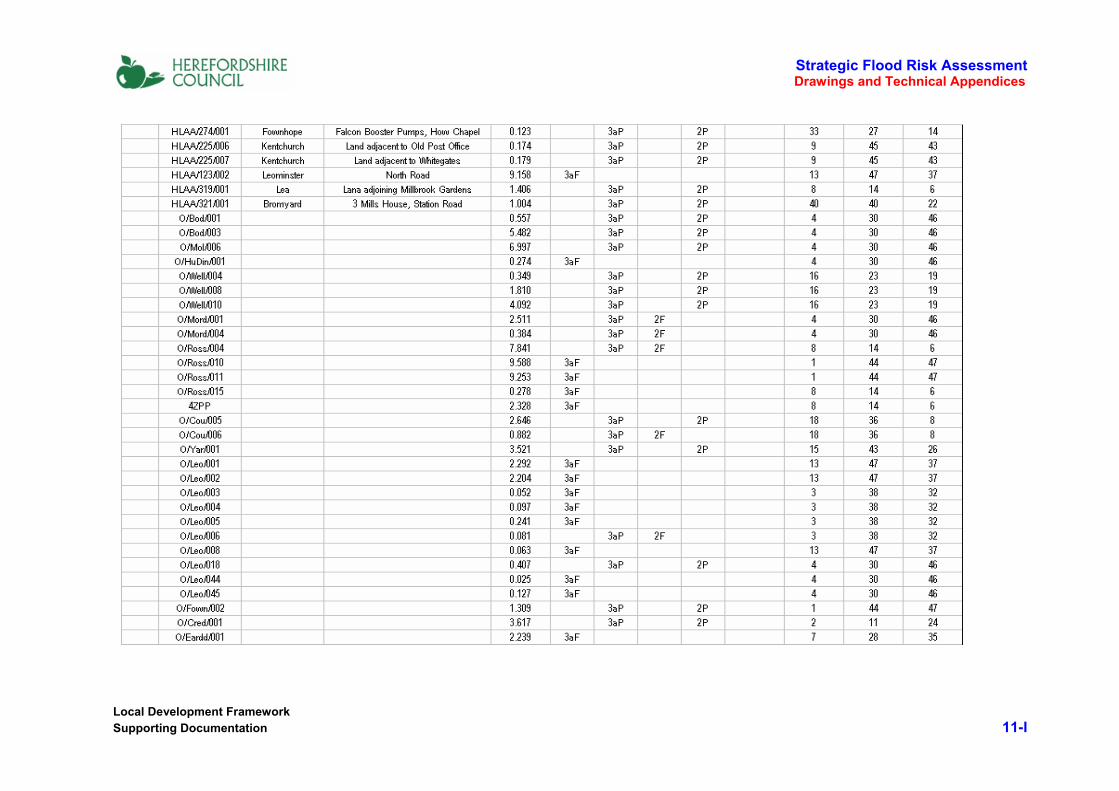
Strategic Flood Risk Assessment Drawings and Technical Appendices
Local Development Framework Supporting Documentation 11-I
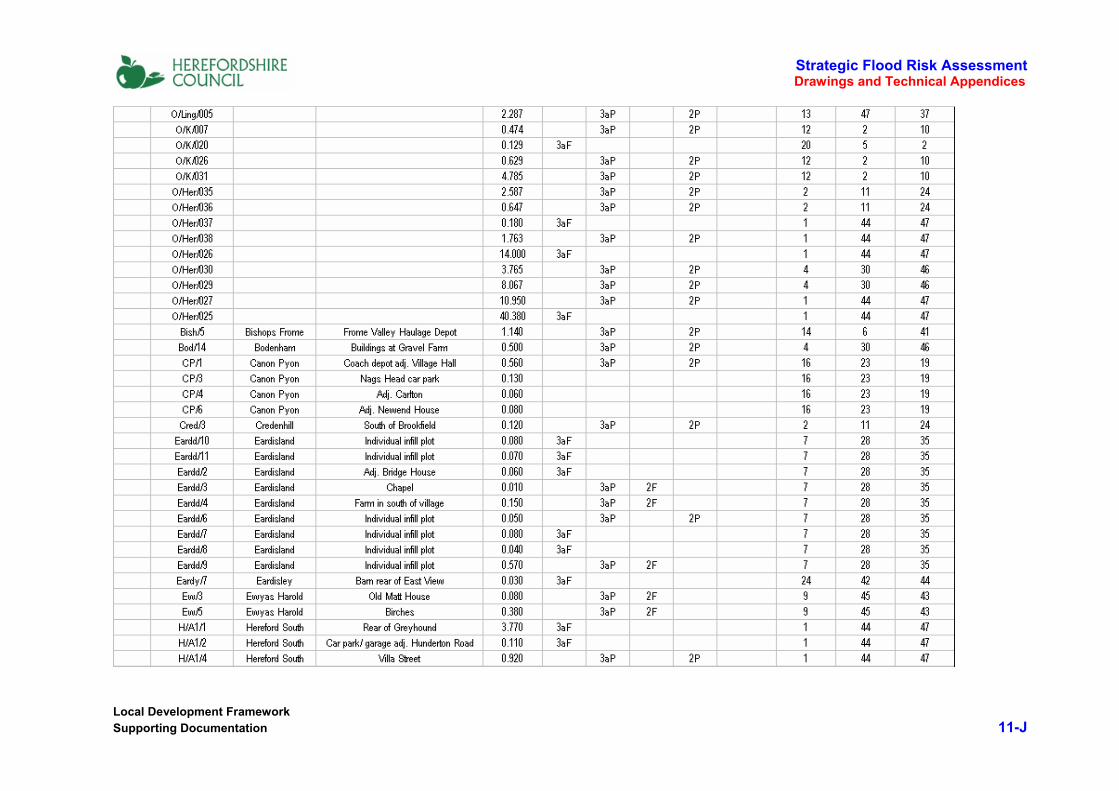
Strategic Flood Risk Assessment Drawings and Technical Appendices
Local Development Framework Supporting Documentation 11-J

Strategic Flood Risk Assessment Drawings and Technical Appendices
Local Development Framework Supporting Documentation 11-K
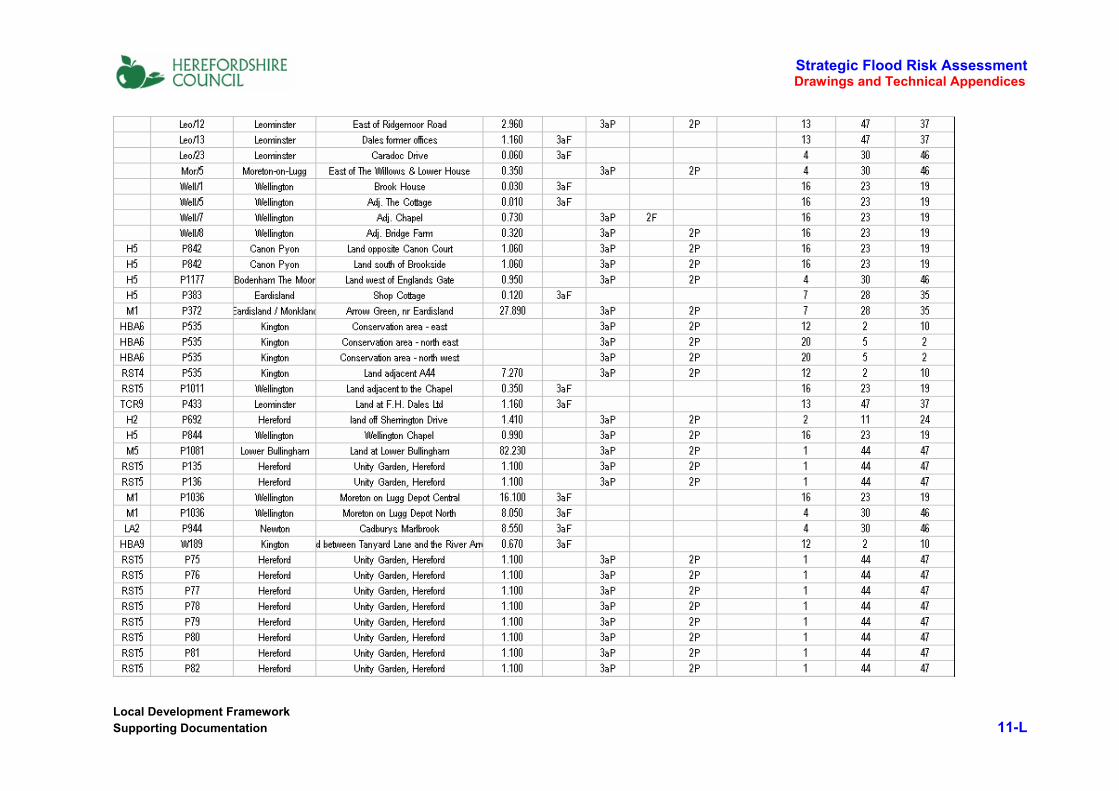
Strategic Flood Risk Assessment Drawings and Technical Appendices
Local Development Framework Supporting Documentation 11-L
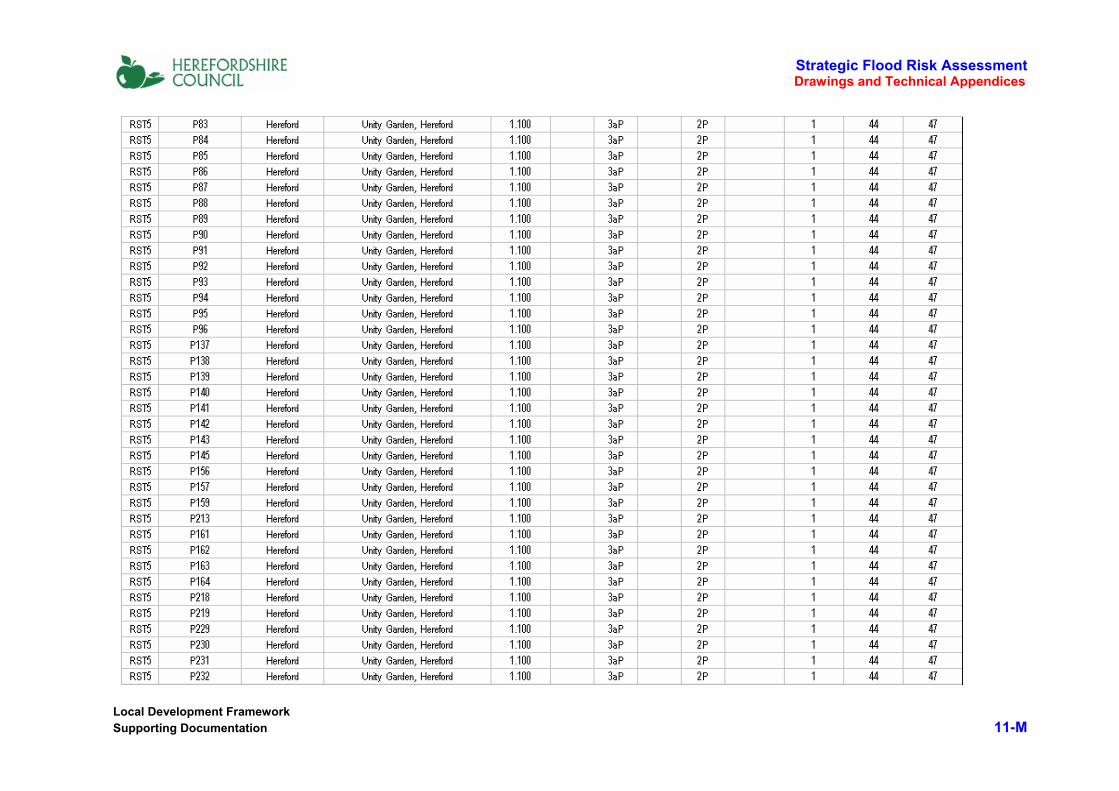
Strategic Flood Risk Assessment Drawings and Technical Appendices
Local Development Framework Supporting Documentation 11-M
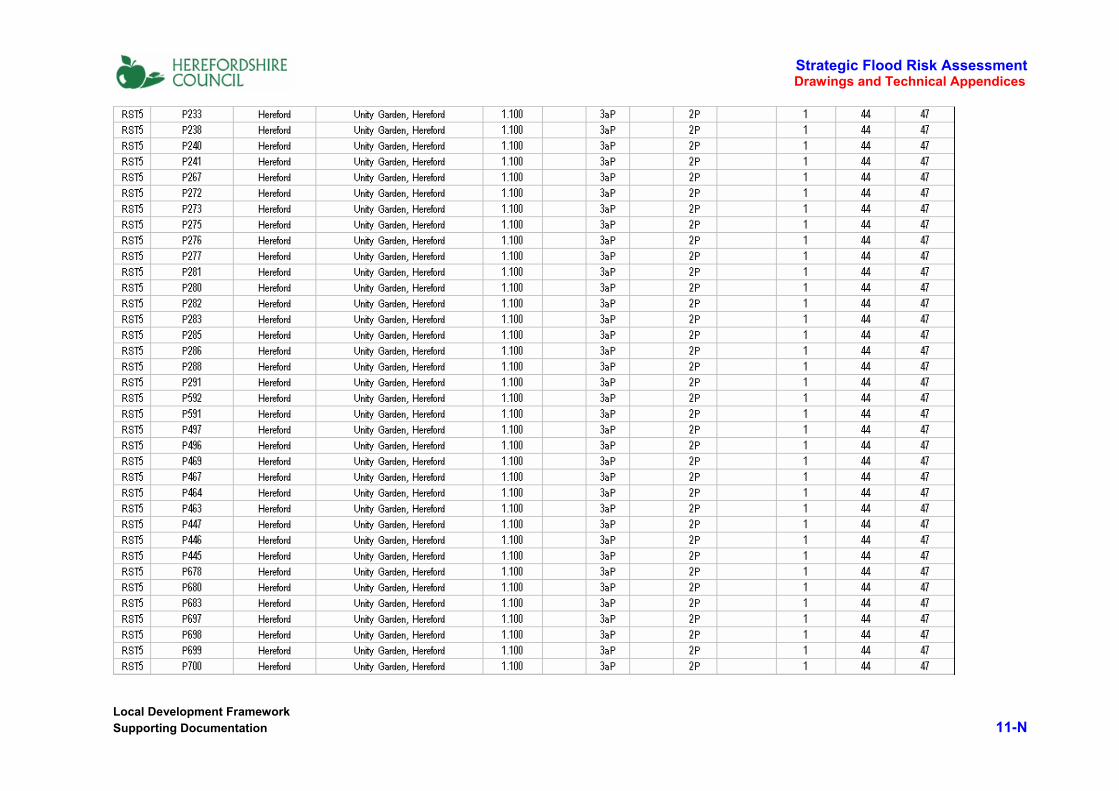
Strategic Flood Risk Assessment Drawings and Technical Appendices
Local Development Framework Supporting Documentation 11-N
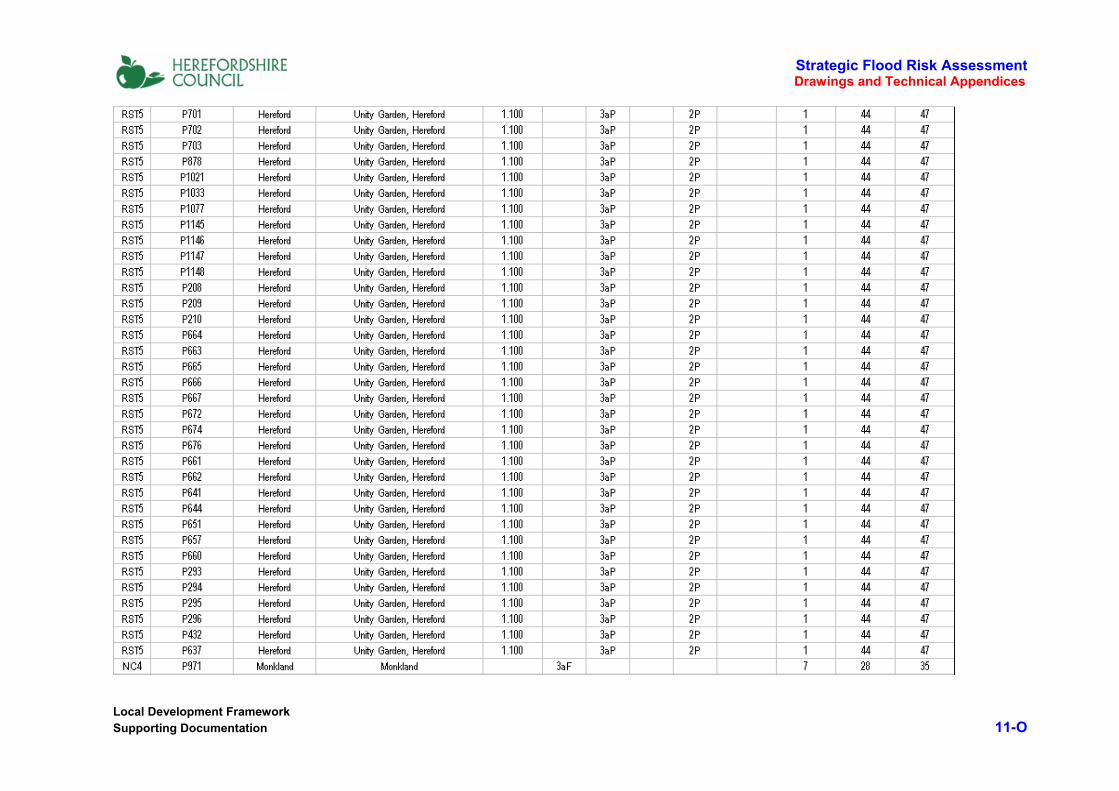
Strategic Flood Risk Assessment Drawings and Technical Appendices
Local Development Framework Supporting Documentation 11-O
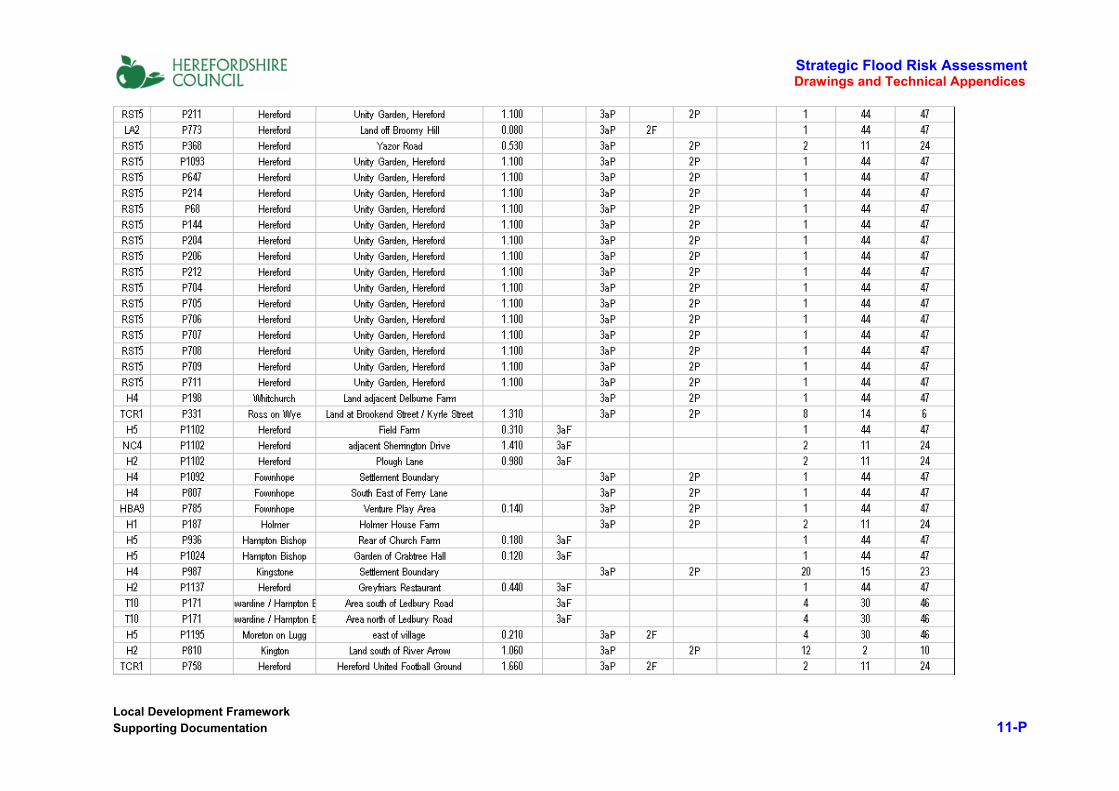
Strategic Flood Risk Assessment Drawings and Technical Appendices
Local Development Framework Supporting Documentation 11-P
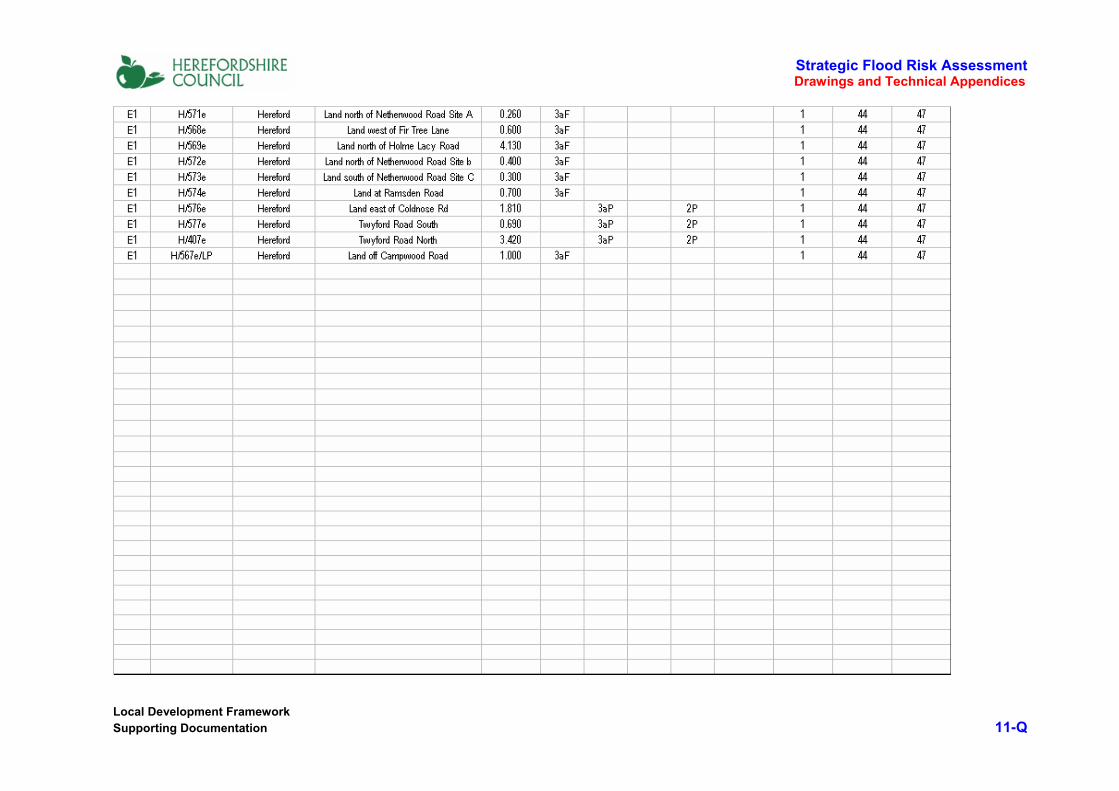
Strategic Flood Risk Assessment Drawings and Technical Appendices
Local Development Framework Supporting Documentation 11-Q