Renewable energy in transport - International Energy … · Renewable energy in transport Source: ...
Upload
dangkhuongCategory
view
221download
2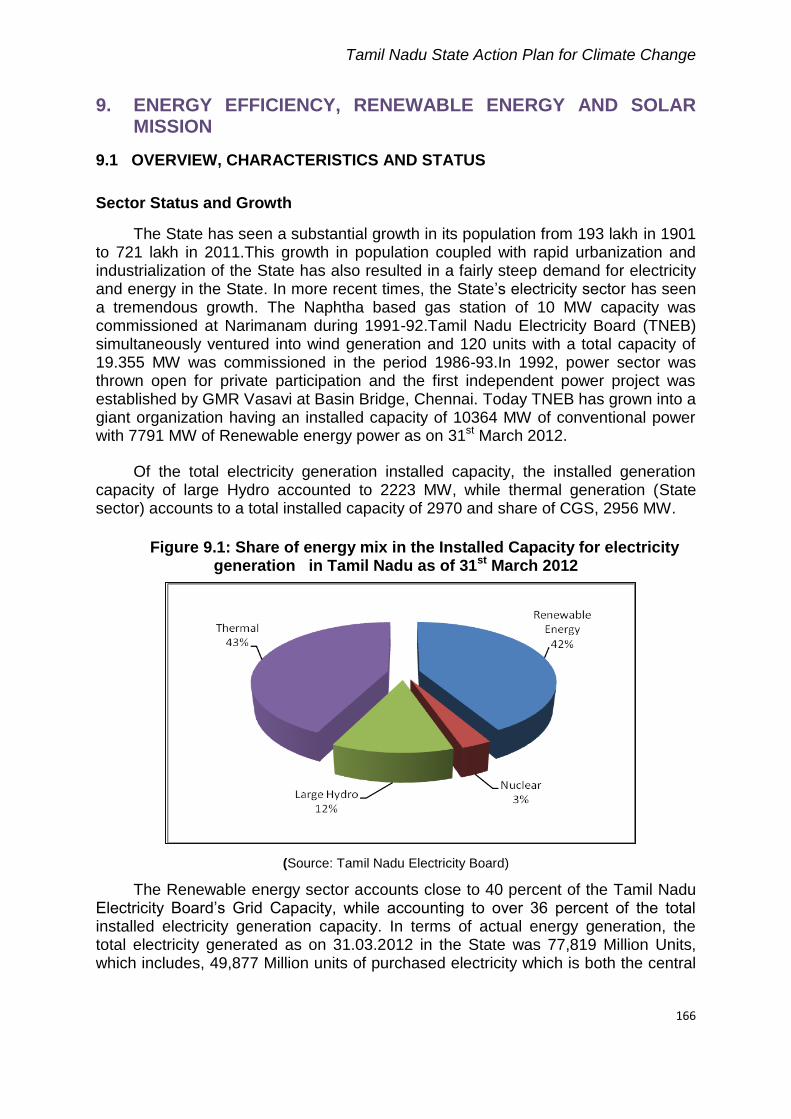
Tamil Nadu State Action Plan for Climate Change
166
9. ENERGY EFFICIENCY, RENEWABLE ENERGY AND SOLAR MISSION
9.1 OVERVIEW, CHARACTERISTICS AND STATUS
Sector Status and Growth
The State has seen a substantial growth in its population from 193 lakh in 1901 to 721 lakh in 2011.This growth in population coupled with rapid urbanization and industrialization of the State has also resulted in a fairly steep demand for electricity and energy in the State. In more recent times, the State’s electricity sector has seen a tremendous growth. The Naphtha based gas station of 10 MW capacity was commissioned at Narimanam during 1991-92.Tamil Nadu Electricity Board (TNEB) simultaneously ventured into wind generation and 120 units with a total capacity of 19.355 MW was commissioned in the period 1986-93.In 1992, power sector was thrown open for private participation and the first independent power project was established by GMR Vasavi at Basin Bridge, Chennai. Today TNEB has grown into a giant organization having an installed capacity of 10364 MW of conventional power with 7791 MW of Renewable energy power as on 31st March 2012.
Of the total electricity generation installed capacity, the installed generation capacity of large Hydro accounted to 2223 MW, while thermal generation (State sector) accounts to a total installed capacity of 2970 and share of CGS, 2956 MW.
Figure 9.1: Share of energy mix in the Installed Capacity for electricity generation in Tamil Nadu as of 31st March 2012
(Source: Tamil Nadu Electricity Board)
The Renewable energy sector accounts close to 40 percent of the Tamil Nadu Electricity Board’s Grid Capacity, while accounting to over 36 percent of the total installed electricity generation capacity. In terms of actual energy generation, the total electricity generated as on 31.03.2012 in the State was 77,819 Million Units, which includes, 49,877 Million units of purchased electricity which is both the central
Tamil Nadu State Action Plan for Climate Change
167
share of generation units located in Tamil Nadu as well as generation units located outside the State.
Figure 9.2: Sources of Electricity for the State
Source: Tamil Nadu Electricity Board, Statistics at a Glance, 2011-12
As can be seen from the above figures, on an average 55-60 percent of the power requirement of the State is purchased from either the central grid or from the Central Share of electricity generated from plants located in the State. Further, despite a large installed capacity of electricity generation from renewable energy sources, the actual energy generated is fairly low. Thermal generation contributes fairly significantly to the electricity requirement of the State and this is also largely due to a fairly high plant load factor of all the thermal power plants located in the State. As on 31.03.2010, Tamil Nadu had a total of 40 hydro installations, which include the various stages of some hydro power stations such as Sholayar 1 and 2, Kodayar 1 and 2, LMHEP Barrage, 1,2,3 &4 and so on. The total installed capacity of these hydro power stations totalled to 2187 MW and the average Plant Load Factor of all these hydro power station installation was 27 percent, with the highest PLF being that of Moyar Hydro Electric Plant and Kundah 1 hydro electric plant with 49 percent respectively.
The plant load factor for wind farms in Tamil Nadu ranges between 12.56 percent to 22 percent. Overall, the State’s generation units have a fairly high plant load factor, whether it is thermal, hydro or wind. In terms of surplus/deficit power requirement, the State on an average has deficit power of roughly 6.5 percent or approximately 5000 million units per year. Table 9.1 below gives an overview of monthly power surplus or deficit for the State of Tamil Nadu for the year 2010-11. This trend has been more or less the same for the last five years. As can be seen from the table, the months of February, March, April and May had the highest deficit of power, while the months of June to January had a relatively low electricity deficit.
Tamil Nadu State Action Plan for Climate Change
168
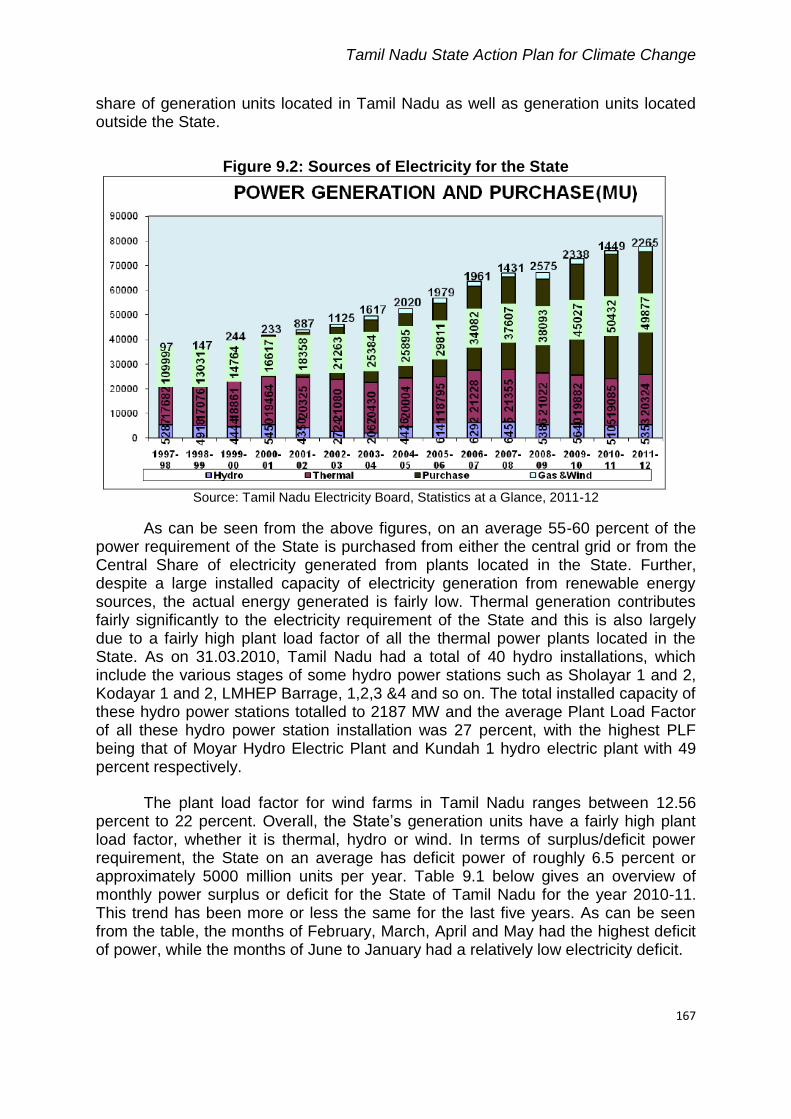
Despite the deficit in electricity generation, the State has always maintained a fairly healthy balance between installed generation capacities and sustained peak demand. However, with increasing demand, the balance is now tilting towards a peak deficit scenario.
Table 9.1: Month wise, Electricity Availability and Requirement Data during 2010-11
De
tail
s
Ap
r ‘10
May‘10
Ju
n’ ‘10
Ju
l ‘10
Au
g ‘10
Se
pt ‘10
Oc
t ‘10
No
v ‘10
De
c ‘10
Jan
‘10
Feb
‘10
Ma
r ‘10
10-1
1
Require
ment (MU)
7217 6210 6728 6892 6853 7007 6794 5888 5979 6555 6667 7524 80314
Avai
lability (MU)
6452 5778 6289 6473 6450 6668 6485 5601 5647 6175 6199 6884 75101
Surplus (+)/Deficit (MU)
-765 -432 -439 -419 -403 -339 -309 -287 -332 -380 -468 -640 -5213
Surplus (+)/Deficit (percent)
-10.6 -7.0 -.6.5 -6.1 -5.9 -4.8 -4.55 -4.9 -5.6 -5.8 -7.0 -8.5 -6.5
Source: Central Electricity Authority, 2010-2011
Figure 9.3: Power Deficits in Tamil Nadu (2003-2010-11)
Source: Central Electricity Authority
Tamil Nadu State Action Plan for Climate Change
169
Electricity Consumption Pattern
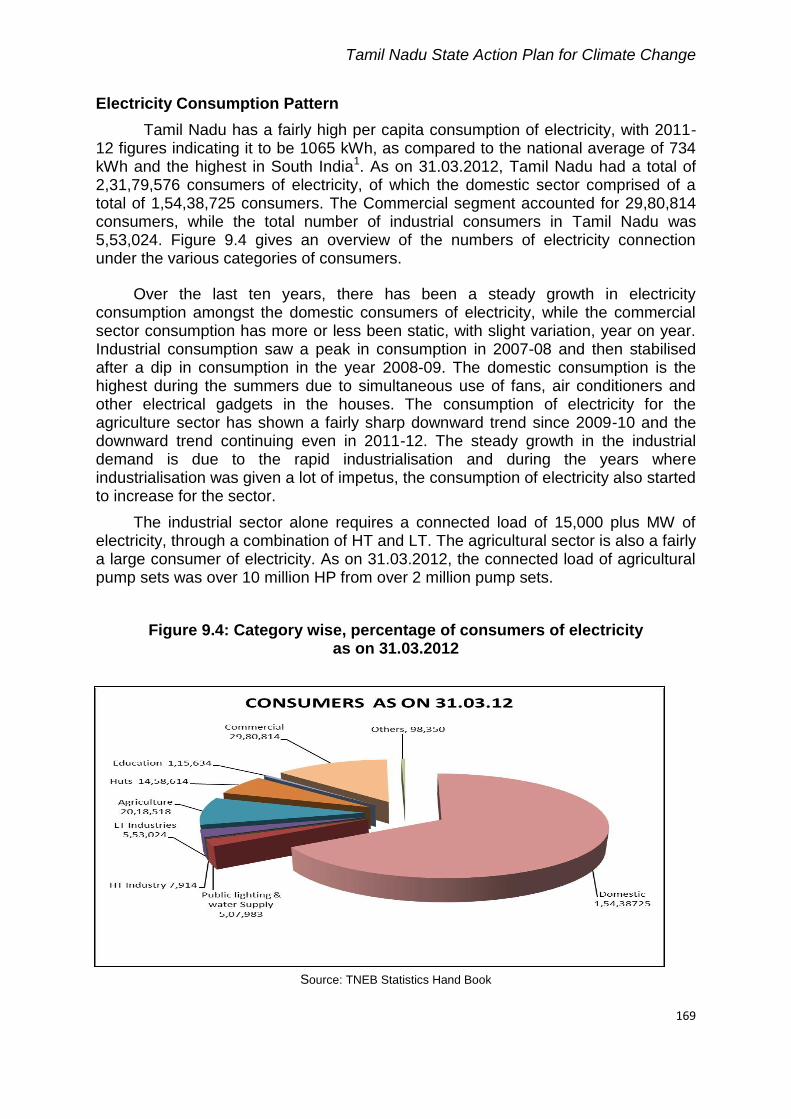
Tamil Nadu has a fairly high per capita consumption of electricity, with 2011-12 figures indicating it to be 1065 kWh, as compared to the national average of 734 kWh and the highest in South India1. As on 31.03.2012, Tamil Nadu had a total of 2,31,79,576 consumers of electricity, of which the domestic sector comprised of a total of 1,54,38,725 consumers. The Commercial segment accounted for 29,80,814 consumers, while the total number of industrial consumers in Tamil Nadu was 5,53,024. Figure 9.4 gives an overview of the numbers of electricity connection under the various categories of consumers.
Over the last ten years, there has been a steady growth in electricity consumption amongst the domestic consumers of electricity, while the commercial sector consumption has more or less been static, with slight variation, year on year. Industrial consumption saw a peak in consumption in 2007-08 and then stabilised after a dip in consumption in the year 2008-09. The domestic consumption is the highest during the summers due to simultaneous use of fans, air conditioners and other electrical gadgets in the houses. The consumption of electricity for the agriculture sector has shown a fairly sharp downward trend since 2009-10 and the downward trend continuing even in 2011-12. The steady growth in the industrial demand is due to the rapid industrialisation and during the years where industrialisation was given a lot of impetus, the consumption of electricity also started to increase for the sector.
The industrial sector alone requires a connected load of 15,000 plus MW of electricity, through a combination of HT and LT. The agricultural sector is also a fairly a large consumer of electricity. As on 31.03.2012, the connected load of agricultural pump sets was over 10 million HP from over 2 million pump sets.
Figure 9.4: Category wise, percentage of consumers of electricity as on 31.03.2012
Source: TNEB Statistics Hand Book
Tamil Nadu State Action Plan for Climate Change
170
Transmission and Distribution Losses
Tamil Nadu has is one of the States which has a fairly low “Transmission and Distribution Loss” as well as Aggregate Technical and & Commercial Losses. The T & D Loss estimated by the Central Electricity Authority for the last few years has been between 19-20 percent (Table 9.2).
Table 9.2: Transmission and Distribution Loss Trends in Tamil Nadu
2003
-04
2004
-05
2005
-06
2006
-07
2007
-08
2008
-09
2009
-10
2010
-11
T&D loss (percent)
20.71 19.34 20.37 19.65 18.92 18.95 18.54 18.23
Source: Central Electricity Authority
The transmission and distribution line density of Tamil Nadu is amongst the highest in comparison to other States with a line density of 5.35 CtK.km/sq km (Circuit kilometre per square km). Further, the State has added 1509 CtK.km of High Tension Lines to its Transmission and Distribution Network on 2008, which has also resulted in a drop in the Transmission and distribution losses from the region of 20 percent and 19 percent to the 18 percent range. As can be seen from the table 9.2 above, the AT & C loss has more or less remained static, with this very marginal reduction. The State has the capacity and potential to further reduce its T & D Loss. The total line loss has been in the region of 18 percent on an average over the last 20 years.
The Southern Electricity Grid is heavily congested and therefore the amount of electricity that the grid can transfer cannot be further increased. The State’s Electricity Demand has been growing and despite the fact that it has its own generation capacities, it also needs to buy substantial electricity from the Central or Southern Grid. Since the southern grid is already running to full capacities, the transmission or technical losses tends to be on a higher side
Renewable Energy Trends
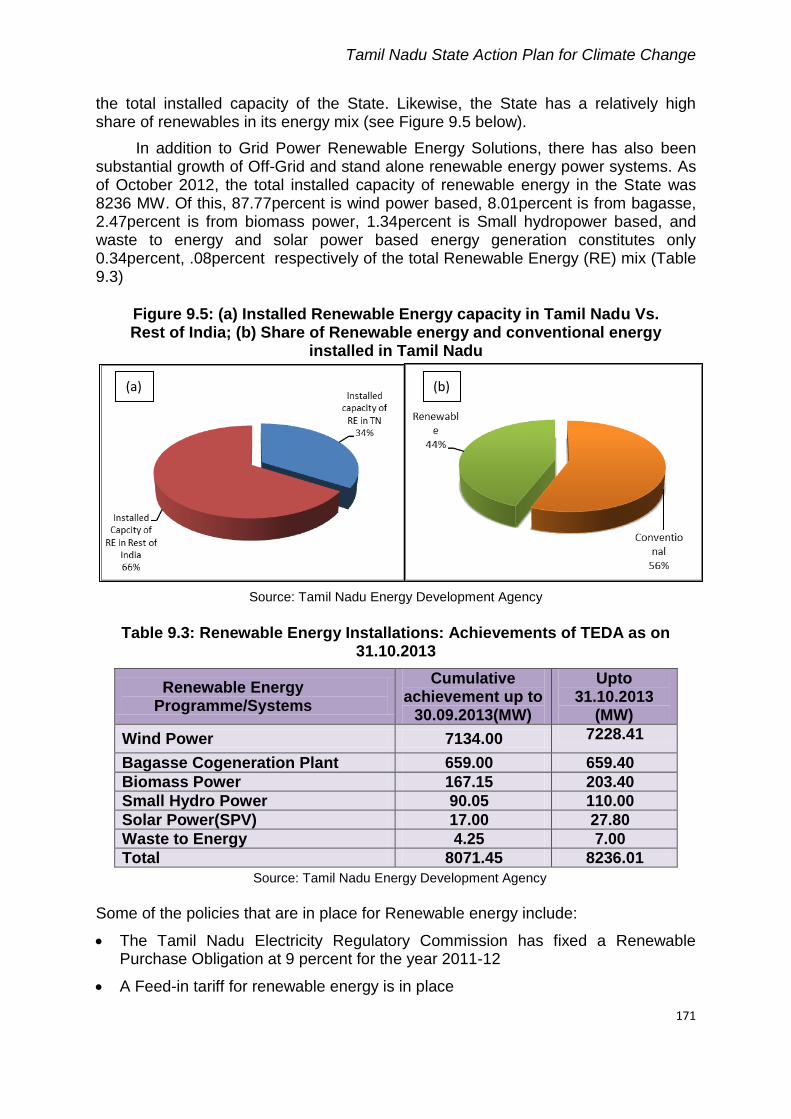
From a modest beginning of approximately 4 MW of installed capacity of renewable energy generation in 1990, the total installed capacity of renewable energy generation as on 30th September 2012 was 7,979.17 MW with a CAGR of 53 percent over the past twenty years. The capacity addition for renewable energy is largely driven by the progress of the Wind Energy Sector, though in very recent times, solar energy sector and bio mass sector have also started to gain some ground, though, still in very initial stages. Tamil Nadu leads the renewable energy space in the country and accounts for 34 percent of the total installed renewable energy capacity in the country, as can be seen from figure 9.5a below. The balance of 66 percent accounts for installed renewable energy capacity across India. Within the State itself, renewable energy contributed to close to 43 percent of the total energy installed capacity, while the conventional power contributes to 57 percent of
Tamil Nadu State Action Plan for Climate Change
171
the total installed capacity of the State. Likewise, the State has a relatively high share of renewables in its energy mix (see Figure 9.5 below).
In addition to Grid Power Renewable Energy Solutions, there has also been substantial growth of Off-Grid and stand alone renewable energy power systems. As of October 2012, the total installed capacity of renewable energy in the State was 8236 MW. Of this, 87.77percent is wind power based, 8.01percent is from bagasse, 2.47percent is from biomass power, 1.34percent is Small hydropower based, and waste to energy and solar power based energy generation constitutes only 0.34percent, .08percent respectively of the total Renewable Energy (RE) mix (Table 9.3)
Figure 9.5: (a) Installed Renewable Energy capacity in Tamil Nadu Vs. Rest of India; (b) Share of Renewable energy and conventional energy
installed in Tamil Nadu
Source: Tamil Nadu Energy Development Agency
Table 9.3: Renewable Energy Installations: Achievements of TEDA as on 31.10.2013
Renewable Energy Programme/Systems
Cumulative achievement up to
30.09.2013(MW)
Upto 31.10.2013
(MW)
Wind Power 7134.00 7228.41
Bagasse Cogeneration Plant 659.00 659.40
Biomass Power 167.15 203.40
Small Hydro Power 90.05 110.00
Solar Power(SPV) 17.00 27.80
Waste to Energy 4.25 7.00
Total 8071.45 8236.01
Source: Tamil Nadu Energy Development Agency
Some of the policies that are in place for Renewable energy include:
The Tamil Nadu Electricity Regulatory Commission has fixed a Renewable Purchase Obligation at 9 percent for the year 2011-12
A Feed-in tariff for renewable energy is in place
(a) (b)
Tamil Nadu State Action Plan for Climate Change
172
The State recently introduced a Solar Policy, 2012, which envisages the implementation of 3000 MW of solar power by 2015, out of which 350 MW would be is from solar roof top systems alone
The Chief Minister’s Solar Powered Green House Scheme is a programme that has been launched with an ambitious target of building 3,00,000 houses powered with solar lighting by 2016 for the benefit of poor in rural areas
Rural Electrification
Tamil Nadu is considered as a State which has 100 percent rural electrification and as per the Census 2011, 93 percent of the total households in Tamil Nadu have access to electricity. As per the Tamil Nadu Electricity board, most of the rural areas have electricity supply ranging from 18 to 20 hrs every day, with power outages from 4 to a maximum of 6 hours a day. Further, even agricultural pump sets have access to electricity for 9 hours a day (see table 9.4).
Table 9.4: Status of electrification in rural Tamil Nadu
Numbers as per 2001 census
Electrified as on 31.3.2012
Percentage of electrification
Towns 439 439 100percent
Inhabitated villages 15400 15400 100percent
Hamlets 48452 48117 98percent
AD colonies 26764 26764 100percent
Agriculture Pump sets 2016324 2016324 100percent
Huts 1589894 1589894 100percent Source: TNEB Statistical Handbook, 2011-12
Energy Efficiency and Conservation
Some of the key energy efficiency and conservation programmes being implemented in the State as of now are:
a) Distribution of CFLs in exchange of Incandescent bulbs to all the hut services of TN at no cost and to all the domestic metered consumers at the subsidized rate of Rs. 15/- per lamp, up to a maximum of 2 per household in a phased manner.
b) Perform, Achieve and Trade (PAT) Scheme aimed at industrial efficiency is being implemented in the State. A total of 41 designated industrial consumers in the State are being covered under this programme. These are mainly Thermal Power Plants (20), Textile Industries (5), Paper and Pulp (3), Cement and Chlor Alkali (12) and fertilizer (1)
c) Agriculture sector Demand Side Management (DSM), particularly to replace energy pump- sets with energy efficient pump sets. So far 149 pump sets have been replaced with 4 stars and above rated pump sets.
d) A demonstration project was done with 36 Small-scale units in the lime Kiln sector in Tirunelveli district for energy efficiency improvements successfully
e) Demand side management (DSM) has been implemented for energy use by the public works and water departments.
f) Other DSM initiatives include:
Tamil Nadu State Action Plan for Climate Change
173
Time of Day (ToD) tariff for HT industries - 20 percent extra charge is levied on the energy consumed during peak hours (6:00 to 9:00 hours and 18:00 to 22:00 hours) on all HT industrial consumers. Further, 5 percent rebate on energy consumption during off peak hours (22:00 to 5:00 hours) is given as an incentive (TNERC, 2010).
Power factor penalties: In order to reduce the difference between the energy consumed and the apparent power, reactive power charges are being levied to reduce energy losses. HT consumers are stipulated to maintain a power factor of 0.90, failing which a penalty is levied. Similarly, for some of the LT consumers, the upper limit of power factor is kept at 0.85 (TNERC, 2010).
The State has also implemented a number of “awareness generation programmes” on “energy conservation” through innovative means of communication such as “street plays”, “exhibition of energy efficient products and systems”, “quiz and poster drawing competitions” amongst engineering colleges and Arts and Science colleges, and also have organized a number of workshops and seminars for builders, industries and Government Departments.
In addition to the above, energy audit was conducted in 18 iconic government buildings, in and around Tamil Nadu. The total energy consumption of these buildings put together was estimated to be in the region of 34,714,518 kWh per year and the audit result came up with a potential saving of approximately 5,596,650 kWh per year or in financial terms, a savings of approximately Rs. 26,818,450/- per year.
Under the LED Village Campaign, three villages namely, Vaddakkalur Village, Kudanur Village and Kallukadu village of Veerapandy Panchayat comprising of 205 houses has been electrified through LED lighting systems. This programme entailed the replacement of existing 60 W incandescent lamps with 5 W LED lamps. Further, all the streetlights were also installed with LED lamps in these villages. As a demonstration project for improving the efficiency of Public Water Works, a major programme to revamp the sewage water pumping system at Alandur Municipality was taken up and completed.
Some of the policy decisions that have been taken by the Government to promote energy conservation and efficiency measures are Policy Orders dated 10.11.2008 and 20.08.2010 and 02.08.2012 that mandate:
a) Replacement of incandescent bulbs with CFLs / fluorescent tube lights with electronic chokes in all Government offices
b) All electrical equipment to comply with BEE efficiency standards
c) All sodium/mercury vapour lamps for external lighting in Government offices will be phased out and no new ones will be installed
d) The order of 20.08.2010 extended the programme to all Government buildings, local bodies, corporations, cooperative societies, public sector undertaking, boards etc.
Tamil Nadu State Action Plan for Climate Change
174
e) The 2nd August 2012 order makes it mandatory for all Government offices to purchase only 3 star rated and above electrical appliances. It also further modifies the previous order that mandated CFLs to T8 lamps and T12 lamps with electronic ballasts. The appliances which should be 3 star rated and above include, refrigerators, air-conditioners, fluorescent lights, distribution transformers, industrial motors, pumps sets, ceiling fans, gas stoves, colour televisions and washing machine.
f) Further a technical committee has been constituted to evolve and adopt guidelines for building and planning authorities and to ensure the implementation of the Energy Conservation Building Code (ECBC) in buildings with a connected load of 100 kW and above in the State.
g) A mission has been constituted under the chair of the Chief Secretary to ensure inter- departmental coordination and monitoring of various energy efficiency schemes – which has been notified as “State Energy Conservation Mission”.
Other Energy Use
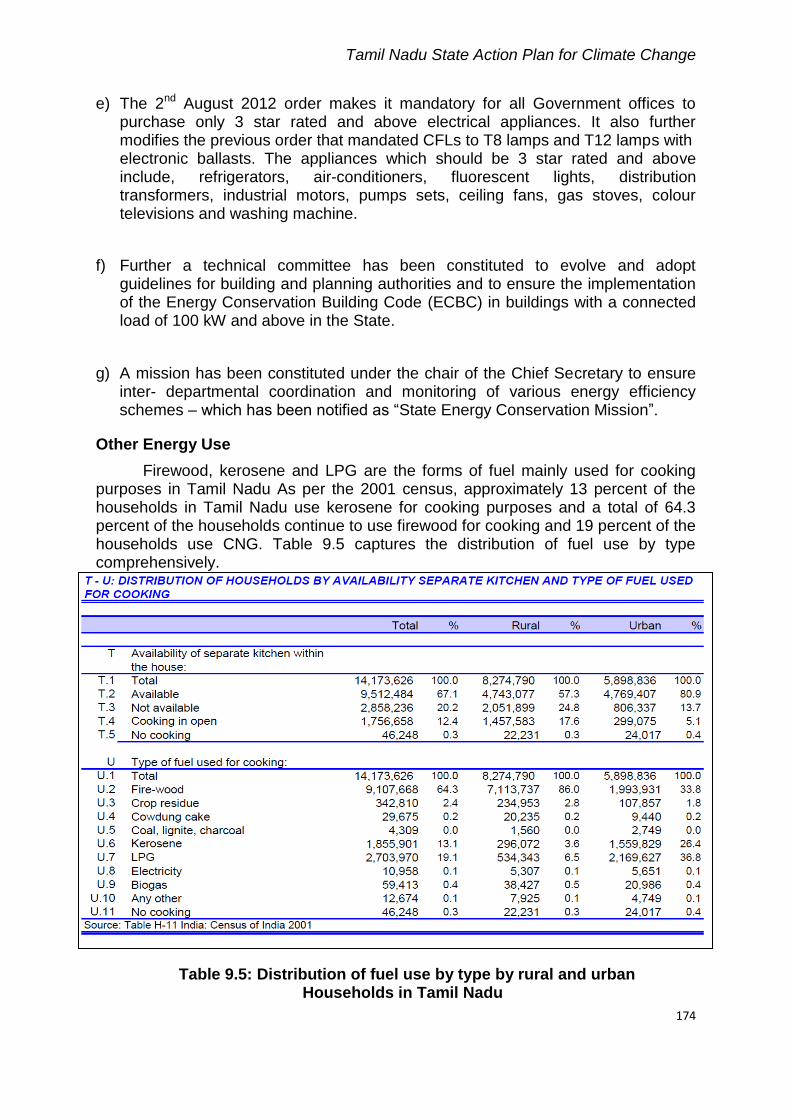
Firewood, kerosene and LPG are the forms of fuel mainly used for cooking purposes in Tamil Nadu As per the 2001 census, approximately 13 percent of the households in Tamil Nadu use kerosene for cooking purposes and a total of 64.3 percent of the households continue to use firewood for cooking and 19 percent of the households use CNG. Table 9.5 captures the distribution of fuel use by type comprehensively.
Table 9.5: Distribution of fuel use by type by rural and urban Households in Tamil Nadu
Tamil Nadu State Action Plan for Climate Change
175
9.2 INSTITUTIONAL MECHANISMS GOVERNING THE ENERGY SECTOR
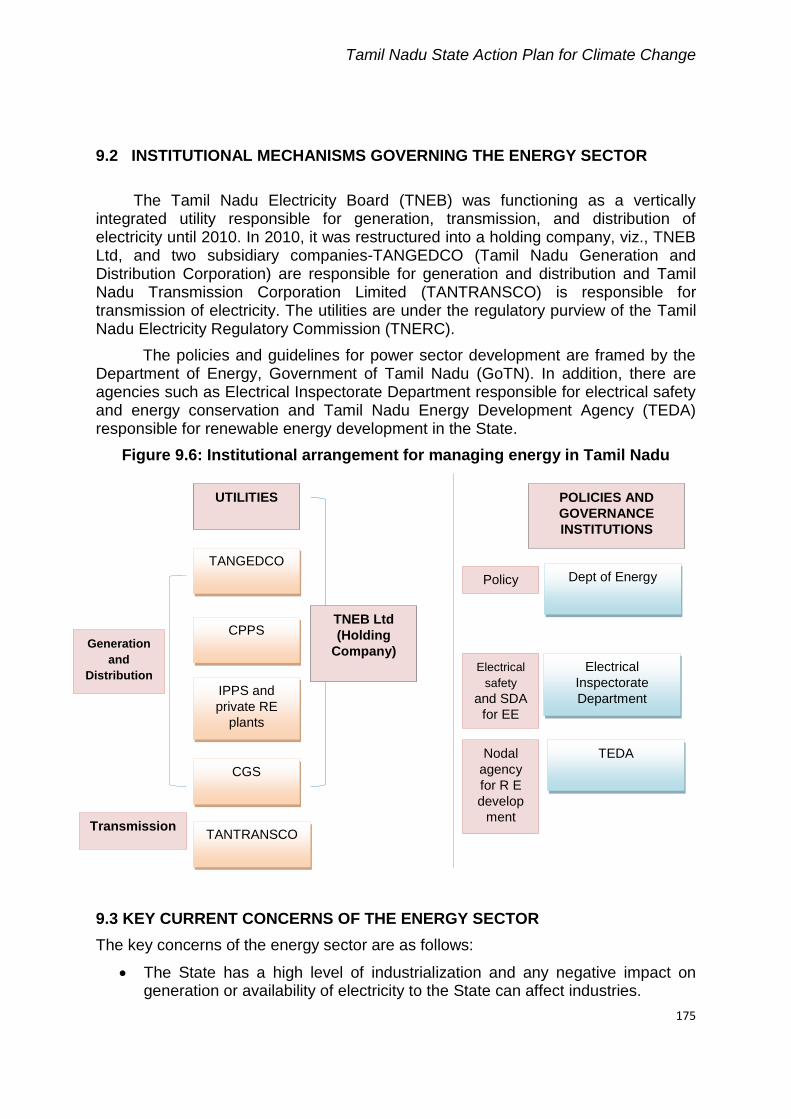
The Tamil Nadu Electricity Board (TNEB) was functioning as a vertically integrated utility responsible for generation, transmission, and distribution of electricity until 2010. In 2010, it was restructured into a holding company, viz., TNEB Ltd, and two subsidiary companies-TANGEDCO (Tamil Nadu Generation and Distribution Corporation) are responsible for generation and distribution and Tamil Nadu Transmission Corporation Limited (TANTRANSCO) is responsible for transmission of electricity. The utilities are under the regulatory purview of the Tamil Nadu Electricity Regulatory Commission (TNERC).
The policies and guidelines for power sector development are framed by the Department of Energy, Government of Tamil Nadu (GoTN). In addition, there are agencies such as Electrical Inspectorate Department responsible for electrical safety and energy conservation and Tamil Nadu Energy Development Agency (TEDA) responsible for renewable energy development in the State.
Figure 9.6: Institutional arrangement for managing energy in Tamil Nadu
9.3 KEY CURRENT CONCERNS OF THE ENERGY SECTOR
The key concerns of the energy sector are as follows:
The State has a high level of industrialization and any negative impact on generation or availability of electricity to the State can affect industries.
Electrical
safety
and SDA
for EE
UTILITIES
TANGEDCO
CPPS
IPPS and
private RE
plants
CGS
TNEB Ltd
(Holding
Company)
POLICIES AND
GOVERNANCE
INSTITUTIONS
Policy Dept of Energy
Electrical
Inspectorate
Department
TEDA Nodal
agency
for R E
develop
ment
Generation
and
Distribution
Transmission TANTRANSCO
Tamil Nadu State Action Plan for Climate Change
176
The State has very high renewable energy potential and is tapping it, but there are financial implications involved in tapping it to its full potential.
The State has started to experience peak power shortages, due to increase in demand. This is likely to further intensify and with a climate change scenario, this is likely to increase further than a Business as usual scenario.
The State has been implementing energy efficiency and conservation measures, but more efforts could be undertaken in this regard.
While the A T & C losses of the State is not high, it has been static for a period of time and hence implementation mechanism of programmes aimed at reducing AT &C losses further needs to be enforced.
Some of the key concerns that could further increase due to climate change are:
The State’s domestic consumption is rather high. In a climate change induced scenario, the consumption is likely to increase drastically.
Rapid growth of urban centres could have an impact on urban domestic consumption of electricity and this would require strengthening of electricity distribution network in urban centres.
Due to successive failure of monsoons, farmers have increased their reliance on ground water for irrigation. In a climate change constrained world and with increasing depletion of ground water resources, farmers would have to resort to using high horse power irrigation pump sets leading to an increase in energy usage.
9.4 CLIMATE CHANGE AND ENERGY DEMAND AND GENERATION
CONCERNS Energy Consumption and Heat Island Effect
Energy consumption of a city is closely related to its ambient temperature. However, urban temperature is changing because of heat island effect and global warming. The International Panel on Climate Change (IPCC) forecasts that the global temperature will be rising in the next 100 years; the temperature rise in 2100 relative to 2000 would range from 1.4 to 5.8 1oC under different adaptation scenarios. Further, there have been a number of scientific studies which estimate that, with a 1oC ambient temperature rise, the consumption of electricity would increase by 9.2 percent of domestic consumption, 3 percent of commercial consumption and 2.4 percent of industrial consumption, Funga et al, 2006. In the case of Tamil Nadu, the mean of the locations studied under the HadCM3 A1B scenario indicates likely rise changes in maximum temperature.
Based on the above, it is estimated that there would be approximately a 14-15
percent increase in electricity consumption in the State, due to temperature rise. Other factors such as increasing growth of domestic consumers, increase in consumption due to growth in GDP etc., increase in electricity coverage area, etc. would continue to have a bearing on electricity consumption.
Tamil Nadu State Action Plan for Climate Change
177
Tamil Nadu has been plagued with acute power shortages since the last few years. The energy and peak shortages stood at 6.5 percent and 11.0 percent respectively in 2010-11. With increase in temperature and resultant increase in the use of fans, air-conditioners, the peak usage is bound to increase in a climate-constrained scenario.
,,Water and hydropower and generation
Further, the State is also dependent on hydro resources to a certain extent and during lean seasons, the State is bound to face shortfall in electricity generation from the hydro sources and would have to depend on renewable energy, coal and purchase from central grid to meet the short fall. The impacts of climate change on water resources have been highlighted in the Fourth assessment report of the Inter Governmental Panel on Climate Change (IPCC) indicating an intensification of the global hydrological cycle affecting both the ground water and surface water supply. The effects of climate change on water resources in India include increased drought, river system closure, and reduced flows in Himalayan river systems, extreme floods, and reduced river yields and reduced ecosystem resilience. Therefore, with the huge dependence on electricity from large hydro-electric sources and with scientific evidence that river systems in India could possibly be affected due to Climate Change, the already shortfall in electricity supply in off-season periods could intensify further.
Forests and Fuel wood use
While right now, there is not much pressure on forests due to use of firewood, it must be noted that as per the 2001 census, 64 percent of the total households in the State were still using firewood as the predominant fuel for cooking and heating purposes. In a climate-constrained world, forest protection is one of the best forms of mitigating carbon, as it acts as a carbon sink. With increasing population and continued dependence on firewood for cooking and heating, it could potentially affect the forest cover of the State. Therefore, it is imperative that the current dependence on firewood for meeting energy needs to be change drastically.
Water and hydropower and generation The State depends significantly on irrigation for the cultivation of some of its principal crops such as paddy, sugarcane, banana, etc., which are water intensive crops. Increased reliance on ground water for irrigation purposes has led to rise in demand for electricity in the agriculture sector. Moreover, ground water level in the State has been declining with nearly 60 percent of the total 385 blocks having been exploited and in different stages of criticality. Declining ground water table has led to usage of high capacity pump sets, thereby increasing electricity usage creating a vicious circle for water-energy resources. Significant variation in load is observed across different seasons of the year. The agriculture sector is dependent on the South-West and North-East monsoons. Most of the rainfall is received during October-December. Hence, electricity demand is relatively less during these months.
The consumption of agricultural category is highest during morning between 8:00 to 10:00 hours, as agriculture consumers are being provided with nine hours of
Tamil Nadu State Action Plan for Climate Change
178
three-phase supply, which includes six hours during daytime and three hours during night time on a roster basis.
The negative impact of climate change on water recharge of deep aquifers means that farmers will resort to deep well water pumping systems, which will be energy intensive. If unaddressed, to meet the water scarcity, the Government may also have to resort to other means to ensure water supply by setting up energy intensive desalination plants.
Adequacy of the Institutions to handle climate change
The institutional framework is fairly robust and evolved with focused set of mandates, which equips itself to perform. The clear role of each of the institutions also avoids overlaps and the tendency to pass on responsibility of implementation to another department is avoided. For instance, while both the Department of New and Renewable Energy and the Department of Power have the responsibility of setting up or promoting renewable energy generation, the mandate for each of the department is clearly outlined, with the Department of New and Renewable Energy promoting generation projects of 1 MW and below and the Department of Power promoting renewable energy generation projects of above 1 MW.
Similarly, with the Department of Electrical Inspectorate being mandated to implement energy efficiency programmes, all issues related to energy efficiency whether it is a street light efficiency programme or a village light efficiency programme comes under its ambit and responsibility. However, it must be noted while that these Departments work independently as of now, since their mandates and responsibilities are also very focused, for addressing climate change, all the departments of Tamil Nadu will have to work together and establish inter- departmental coordination to assess and plan a combined strategy to ensure that the energy sector is a zero carbon emitter to the extent possible. The inter-departmental coordination should also include departments such as the urban planning, transport, forest, science and technology amongst others.
Adequacy of current programmes to meet the challenges of Climate Change
The Programmes implemented by the sector with the exception of those programmes specifically under the National Action Plan on Climate Change are “business as usual programmes” and not necessarily programmes which have been designed to address climate change. However, since India does not need to take any emission reduction actions per se, the programmes and policies which are being implemented properly will ensure that efficiencies of the sector improves, people have access to modern energy and electricity needs, reduce the dependence on forests for energy purposes and importantly increase the fuel mix of energy generation to ensure sustainable energy production in the medium to long run.
However, in terms of programme, there is a need to factor in climate change projections in the long run and plan for generation capacity addition as well as reforms in the energy sector. In terms of implementation, some of the weak links that observed were:
The activities of the departments were stand alone in nature.
Actions implemented were mostly reactive and not proactive,
Tamil Nadu State Action Plan for Climate Change
179
Programmes did not cover the entire State comprehensively,
Programmes had been designed keeping budgetary provisions and business as usual scenario and not necessarily aggressive actions required in view of climate change
There is a lack of coordination between and amongst all the implementing Departments not only in the State, but also inter-State and Centre-State. The inter-State coordination is absolutely essential to counter issues such as Transmission Infrastructure amongst others.
However, the State has recognized some of these weak links and a State Mission specifically with the mandate to ensure coordination of all departments for energy efficiency and conservation has been created. Some of the other weak links are also addressed in the strategy section of this report.
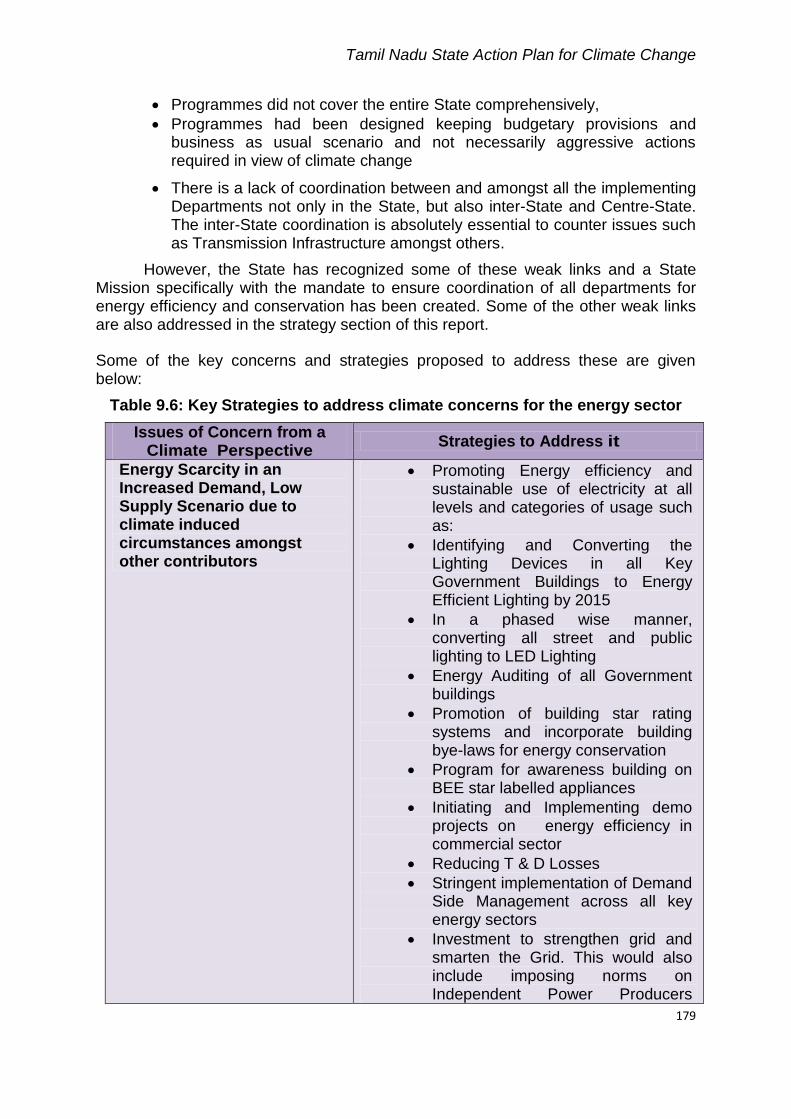
Some of the key concerns and strategies proposed to address these are given below:
Table 9.6: Key Strategies to address climate concerns for the energy sector
Issues of Concern from a Climate Perspective
Strategies to Address it
Energy Scarcity in an Increased Demand, Low Supply Scenario due to climate induced circumstances amongst other contributors
Promoting Energy efficiency and sustainable use of electricity at all levels and categories of usage such as:
Identifying and Converting the Lighting Devices in all Key Government Buildings to Energy Efficient Lighting by 2015
In a phased wise manner, converting all street and public lighting to LED Lighting
Energy Auditing of all Government buildings
Promotion of building star rating systems and incorporate building bye-laws for energy conservation
Program for awareness building on BEE star labelled appliances
Initiating and Implementing demo projects on energy efficiency in commercial sector
Reducing T & D Losses
Stringent implementation of Demand Side Management across all key energy sectors
Investment to strengthen grid and smarten the Grid. This would also include imposing norms on Independent Power Producers
Tamil Nadu State Action Plan for Climate Change
180
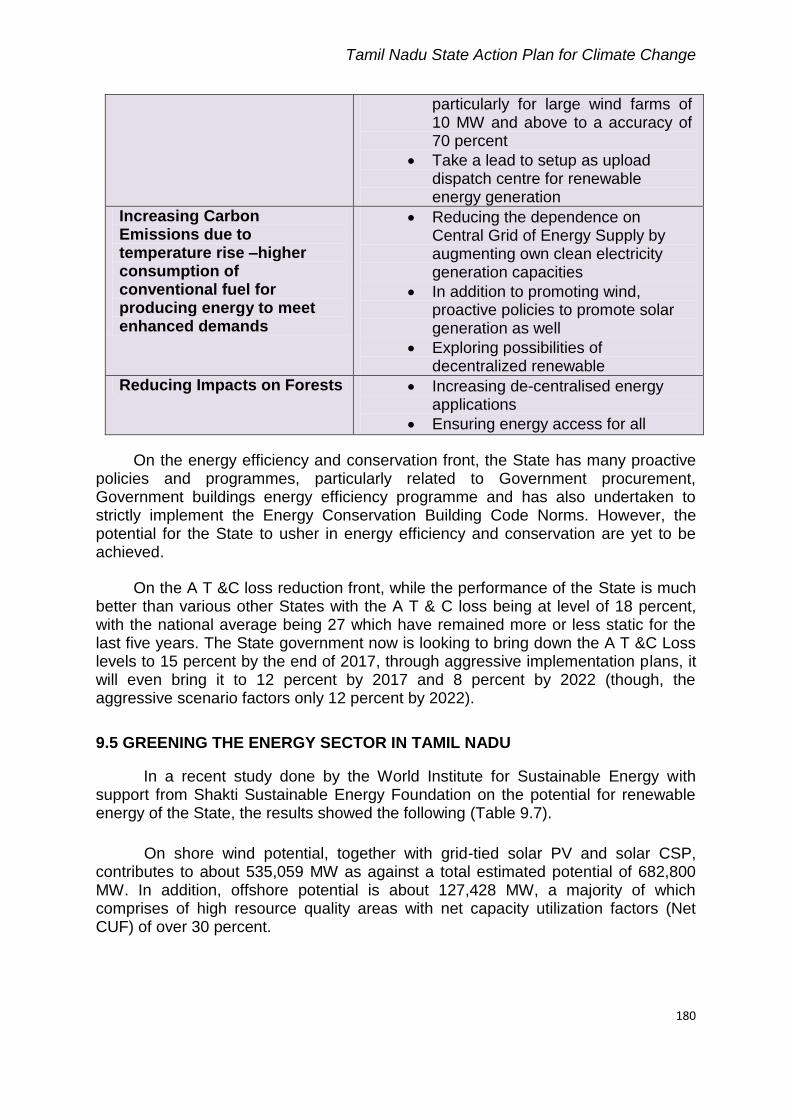
particularly for large wind farms of 10 MW and above to a accuracy of 70 percent
Take a lead to setup as upload dispatch centre for renewable energy generation
Increasing Carbon Emissions due to temperature rise –higher consumption of conventional fuel for producing energy to meet enhanced demands
Reducing the dependence on Central Grid of Energy Supply by augmenting own clean electricity generation capacities
In addition to promoting wind, proactive policies to promote solar generation as well
Exploring possibilities of decentralized renewable
Reducing Impacts on Forests Increasing de-centralised energy applications
Ensuring energy access for all
On the energy efficiency and conservation front, the State has many proactive policies and programmes, particularly related to Government procurement, Government buildings energy efficiency programme and has also undertaken to strictly implement the Energy Conservation Building Code Norms. However, the potential for the State to usher in energy efficiency and conservation are yet to be achieved.
On the A T &C loss reduction front, while the performance of the State is much better than various other States with the A T & C loss being at level of 18 percent, with the national average being 27 which have remained more or less static for the last five years. The State government now is looking to bring down the A T &C Loss levels to 15 percent by the end of 2017, through aggressive implementation plans, it will even bring it to 12 percent by 2017 and 8 percent by 2022 (though, the aggressive scenario factors only 12 percent by 2022).
9.5 GREENING THE ENERGY SECTOR IN TAMIL NADU
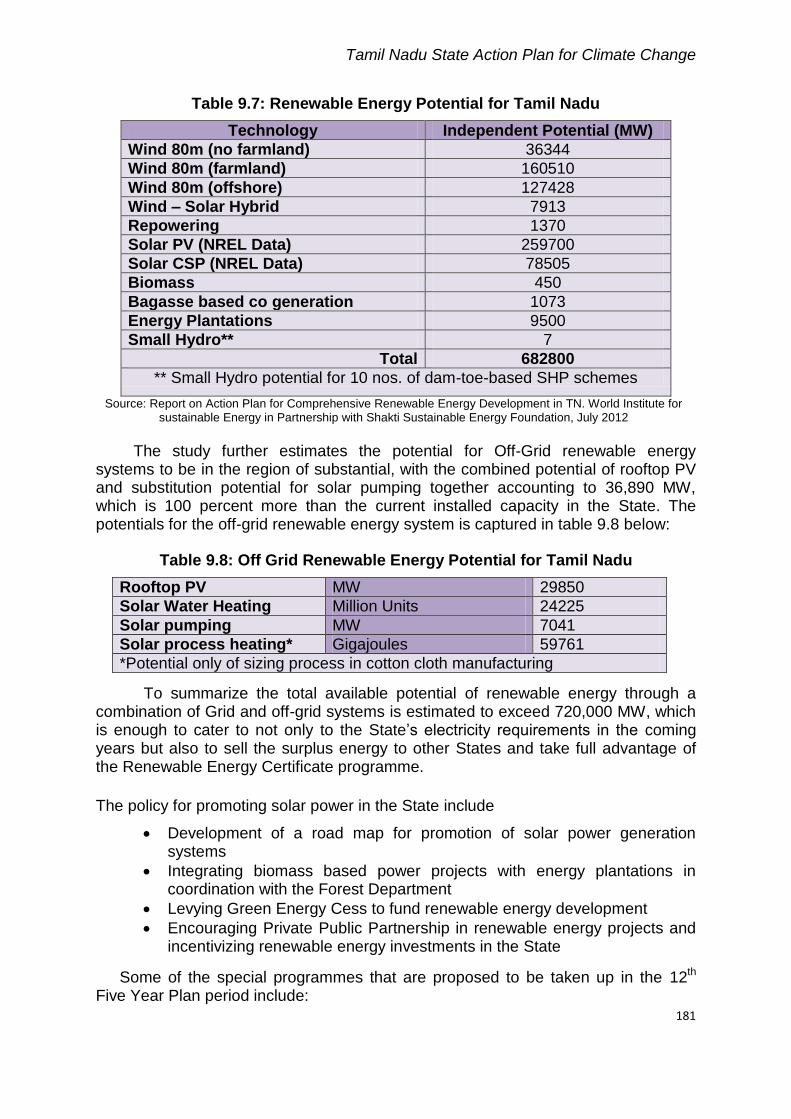
In a recent study done by the World Institute for Sustainable Energy with support from Shakti Sustainable Energy Foundation on the potential for renewable energy of the State, the results showed the following (Table 9.7).
,On shore wind potential, together with grid-tied solar PV and solar CSP, contributes to about 535,059 MW as against a total estimated potential of 682,800 MW. In addition, offshore potential is about 127,428 MW, a majority of which comprises of high resource quality areas with net capacity utilization factors (Net CUF) of over 30 percent.
Tamil Nadu State Action Plan for Climate Change
181
Table 9.7: Renewable Energy Potential for Tamil Nadu
Technology Independent Potential (MW)
Wind 80m (no farmland) 36344
Wind 80m (farmland) 160510
Wind 80m (offshore) 127428
Wind – Solar Hybrid 7913
Repowering 1370
Solar PV (NREL Data) 259700
Solar CSP (NREL Data) 78505
Biomass 450
Bagasse based co generation 1073
Energy Plantations 9500
Small Hydro** 7
Total 682800
** Small Hydro potential for 10 nos. of dam-toe-based SHP schemes
Source: Report on Action Plan for Comprehensive Renewable Energy Development in TN. World Institute for sustainable Energy in Partnership with Shakti Sustainable Energy Foundation, July 2012
The study further estimates the potential for Off-Grid renewable energy systems to be in the region of substantial, with the combined potential of rooftop PV and substitution potential for solar pumping together accounting to 36,890 MW, which is 100 percent more than the current installed capacity in the State. The potentials for the off-grid renewable energy system is captured in table 9.8 below:
Table 9.8: Off Grid Renewable Energy Potential for Tamil Nadu
Rooftop PV MW 29850
Solar Water Heating Million Units 24225
Solar pumping MW 7041
Solar process heating* Gigajoules 59761
*Potential only of sizing process in cotton cloth manufacturing
To summarize the total available potential of renewable energy through a combination of Grid and off-grid systems is estimated to exceed 720,000 MW, which is enough to cater to not only to the State’s electricity requirements in the coming years but also to sell the surplus energy to other States and take full advantage of the Renewable Energy Certificate programme.
The policy for promoting solar power in the State include
Development of a road map for promotion of solar power generation systems
Integrating biomass based power projects with energy plantations in coordination with the Forest Department
Levying Green Energy Cess to fund renewable energy development
Encouraging Private Public Partnership in renewable energy projects and incentivizing renewable energy investments in the State
Some of the special programmes that are proposed to be taken up in the 12th Five Year Plan period include:
Tamil Nadu State Action Plan for Climate Change
182
Solar Powered Green Homes to light 3,00,000 houses
Establishment of solar parks through competitive bidding process-up to 3000 MW of solar parks
Making solar rooftop mandatory for all (a) Multi-storeyed buildings; (b) Educational institutions; (c) IT Parks, SEZs, Telecom Towers; (d) Buildings with a built up area of 20,000 sq.m or more; (e) All Government buildings where ever feasible
Promote R & D that would include smart grid concepts, PV driven seawater desalination plants, grid connected rooftop systems with two way monitoring systems, repowering of existing windmills, forecasting and scheduling wind evacuation, and offshore wind development
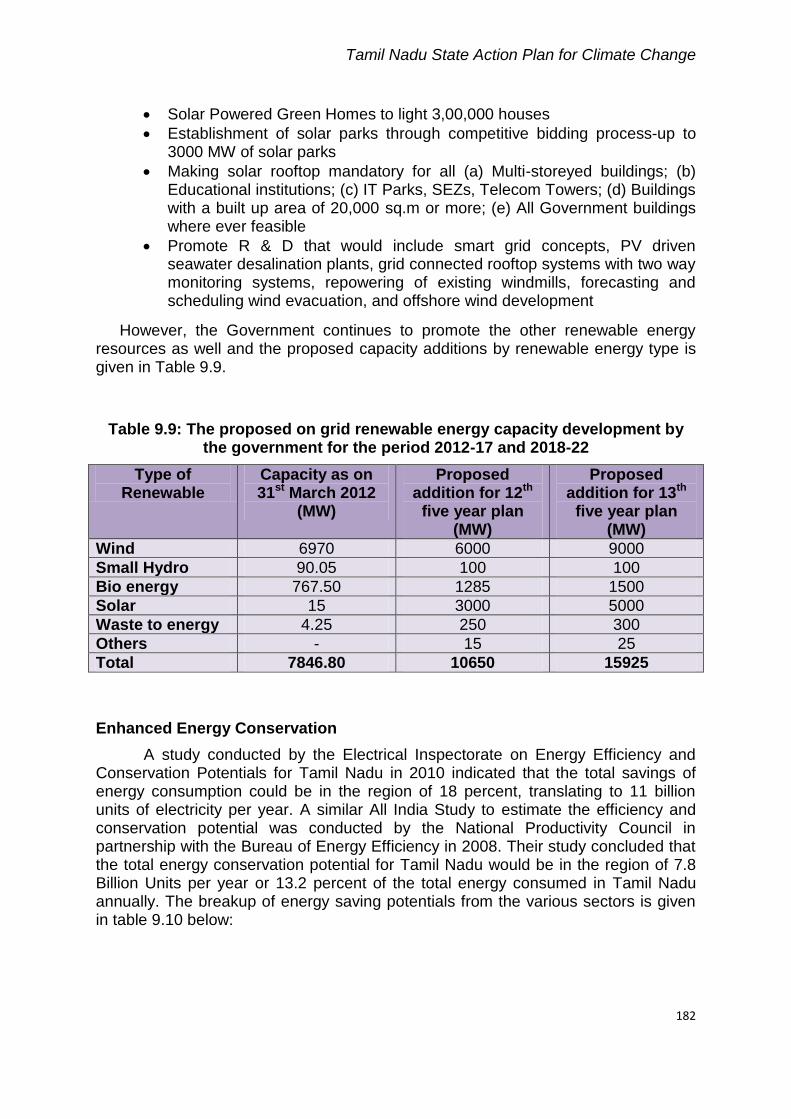
However, the Government continues to promote the other renewable energy resources as well and the proposed capacity additions by renewable energy type is given in Table 9.9.
Table 9.9: The proposed on grid renewable energy capacity development by the government for the period 2012-17 and 2018-22
Type of Renewable
Capacity as on 31st March 2012
(MW)
Proposed addition for 12th
five year plan (MW)
Proposed addition for 13th
five year plan (MW)
Wind 6970 6000 9000
Small Hydro 90.05 100 100
Bio energy 767.50 1285 1500
Solar 15 3000 5000
Waste to energy 4.25 250 300
Others - 15 25
Total 7846.80 10650 15925
Enhanced Energy Conservation
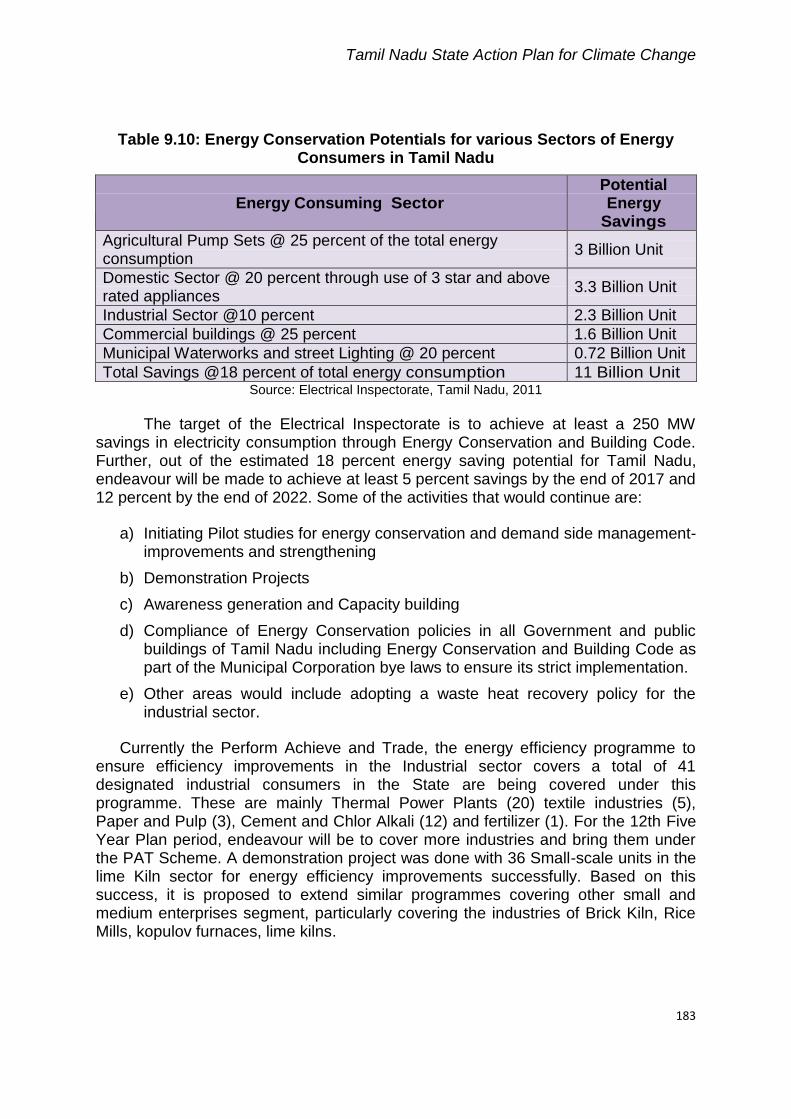
A study conducted by the Electrical Inspectorate on Energy Efficiency and Conservation Potentials for Tamil Nadu in 2010 indicated that the total savings of energy consumption could be in the region of 18 percent, translating to 11 billion units of electricity per year. A similar All India Study to estimate the efficiency and conservation potential was conducted by the National Productivity Council in partnership with the Bureau of Energy Efficiency in 2008. Their study concluded that the total energy conservation potential for Tamil Nadu would be in the region of 7.8 Billion Units per year or 13.2 percent of the total energy consumed in Tamil Nadu annually. The breakup of energy saving potentials from the various sectors is given in table 9.10 below:
Tamil Nadu State Action Plan for Climate Change
183
Table 9.10: Energy Conservation Potentials for various Sectors of Energy Consumers in Tamil Nadu
Energy Consuming Sector Potential Energy
Savings
Agricultural Pump Sets @ 25 percent of the total energy consumption
3 Billion Unit
Domestic Sector @ 20 percent through use of 3 star and above rated appliances
3.3 Billion Unit
Industrial Sector @10 percent 2.3 Billion Unit
Commercial buildings @ 25 percent 1.6 Billion Unit
Municipal Waterworks and street Lighting @ 20 percent 0.72 Billion Unit
Total Savings @18 percent of total energy consumption 11 Billion Unit Source: Electrical Inspectorate, Tamil Nadu, 2011
The target of the Electrical Inspectorate is to achieve at least a 250 MW savings in electricity consumption through Energy Conservation and Building Code. Further, out of the estimated 18 percent energy saving potential for Tamil Nadu, endeavour will be made to achieve at least 5 percent savings by the end of 2017 and 12 percent by the end of 2022. Some of the activities that would continue are:
a) Initiating Pilot studies for energy conservation and demand side management-improvements and strengthening
b) Demonstration Projects
c) Awareness generation and Capacity building
d) Compliance of Energy Conservation policies in all Government and public buildings of Tamil Nadu including Energy Conservation and Building Code as part of the Municipal Corporation bye laws to ensure its strict implementation.
e) Other areas would include adopting a waste heat recovery policy for the industrial sector.
Currently the Perform Achieve and Trade, the energy efficiency programme to ensure efficiency improvements in the Industrial sector covers a total of 41 designated industrial consumers in the State are being covered under this programme. These are mainly Thermal Power Plants (20) textile industries (5), Paper and Pulp (3), Cement and Chlor Alkali (12) and fertilizer (1). For the 12th Five Year Plan period, endeavour will be to cover more industries and bring them under the PAT Scheme. A demonstration project was done with 36 Small-scale units in the lime Kiln sector for energy efficiency improvements successfully. Based on this success, it is proposed to extend similar programmes covering other small and medium enterprises segment, particularly covering the industries of Brick Kiln, Rice Mills, kopulov furnaces, lime kilns.
Tamil Nadu State Action Plan for Climate Change
184
Other programmes that would continue include:
Distribution of CFLs in exchange of incandescent to all the hut services in the State at no cost and to all the domestic metered consumers at the subsidized rate of Rs. 15/- per lamp, up to a maximum of two in a phased manner
Promotion of Bureau of Energy Efficiency’s “energy efficient appliances labelling and programme”
Renewable Energy based demand side management amongst others
Further Potential of Reducing AT & C Losses
The current level of line losses in Tamil Nadu is in the region of 16 percent and the total A T & C losses\ is around 18 percent. This has been the trend since the last five years. The current plan of the Government is to ensure the reduction of A T & C losses from the current level of 18 percent to 15 percent by 2017 with an attempt to bring it down to 12 percent in later years.
The purpose of preparation of an implementation road map in this sector is to provide a pathway with key milestones to ensure the achievement of the objectives listed above. The implementation pathway is provided for both rapid renewable energy penetration, both grid as well as off-grid as well as for energy efficiency and conservation implementation.
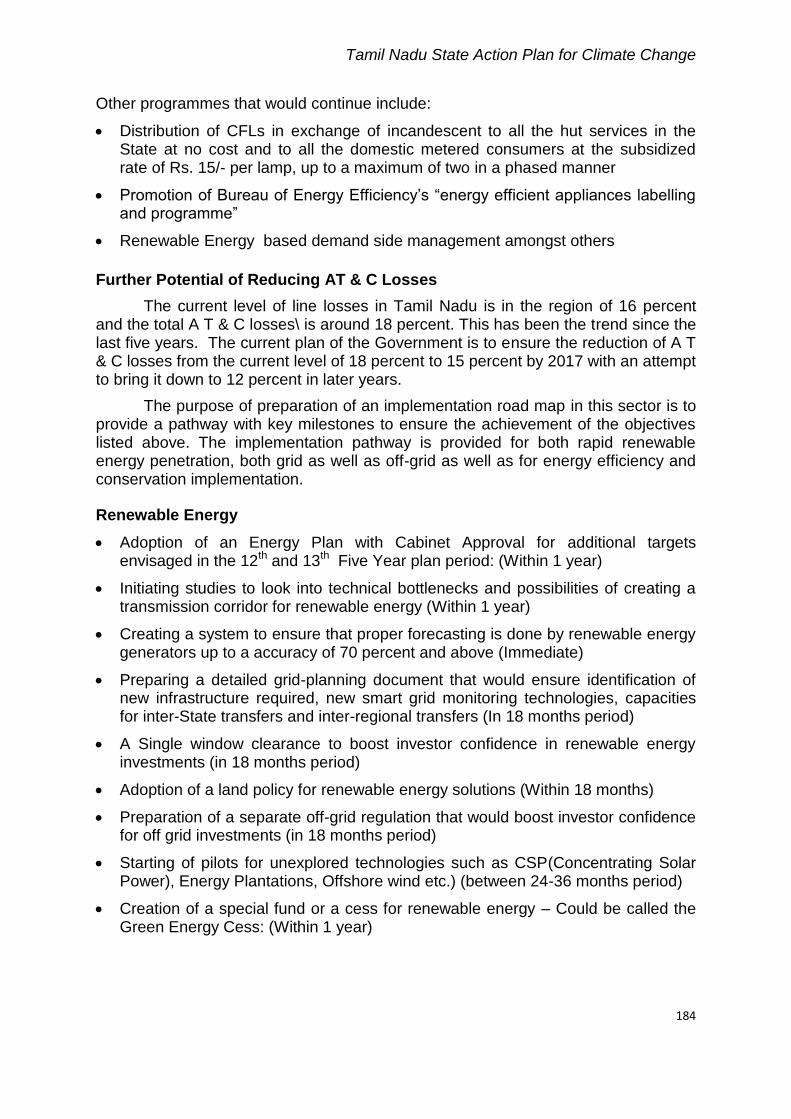
Renewable Energy
Adoption of an Energy Plan with Cabinet Approval for additional targets envisaged in the 12th and 13th Five Year plan period: (Within 1 year)
Initiating studies to look into technical bottlenecks and possibilities of creating a transmission corridor for renewable energy (Within 1 year)
Creating a system to ensure that proper forecasting is done by renewable energy generators up to a accuracy of 70 percent and above (Immediate)
Preparing a detailed grid-planning document that would ensure identification of new infrastructure required, new smart grid monitoring technologies, capacities for inter-State transfers and inter-regional transfers (In 18 months period)
A Single window clearance to boost investor confidence in renewable energy investments (in 18 months period)
Adoption of a land policy for renewable energy solutions (Within 18 months)
Preparation of a separate off-grid regulation that would boost investor confidence for off grid investments (in 18 months period)
Starting of pilots for unexplored technologies such as CSP(Concentrating Solar Power), Energy Plantations, Offshore wind etc.) (between 24-36 months period)
Creation of a special fund or a cess for renewable energy – Could be called the Green Energy Cess: (Within 1 year)
Tamil Nadu State Action Plan for Climate Change
185
Energy Efficiency and Conservation
Detailed Energy auditing of various Government offices and public works and public lighting for a comprehensive plan of action (Immediate)
Pilot projects of converting iconic government buildings into energy efficient buildings (Immediate)
Pilot projects of converting iconic roads of key cities of Tamil Nadu in to LED power street lights (within 1 year)
Pilot projects for Demand Side Management in the agricultural sector, extending it from what has been covered so far. The pilot projects should look at converting conventional irrigation systems to solar powered irrigation systems (within 1 year)
Incorporation of Energy Conservation Building Code in Municipal Bye laws and implementation in commercial buildings. (Within 2 year).
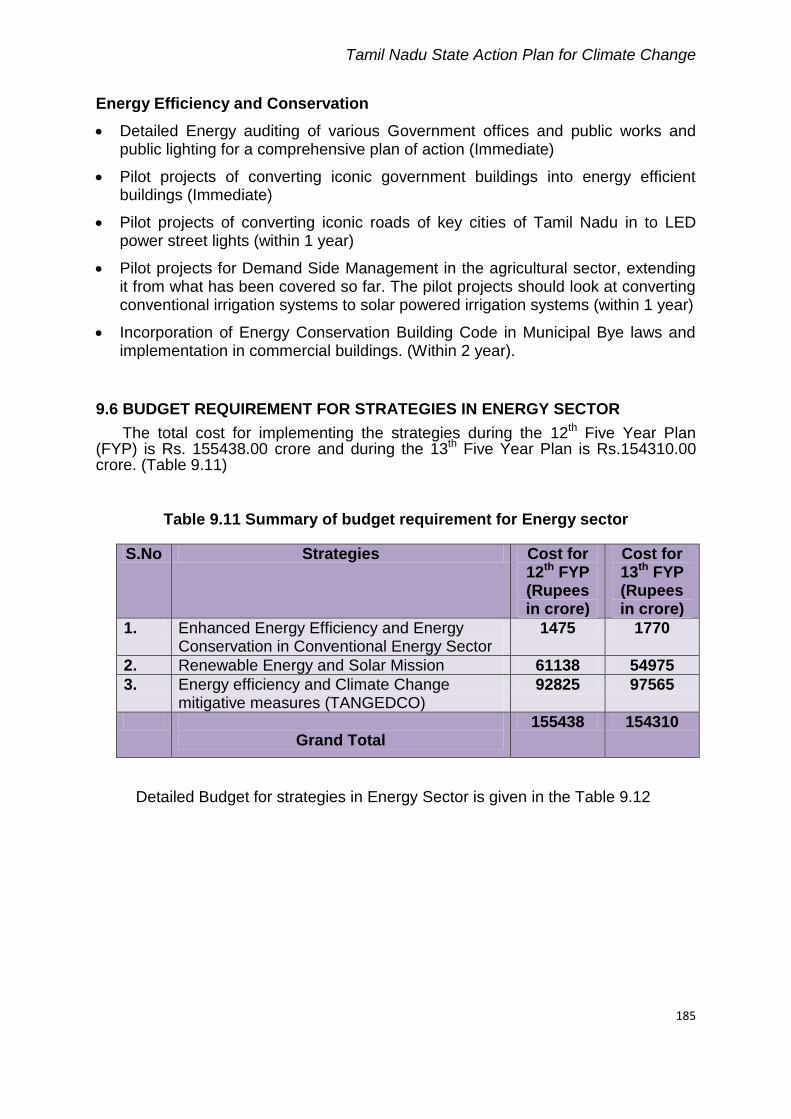
9.6 BUDGET REQUIREMENT FOR STRATEGIES IN ENERGY SECTOR
The total cost for implementing the strategies during the 12th Five Year Plan (FYP) is Rs. 155438.00 crore and during the 13th Five Year Plan is Rs.154310.00 crore. (Table 9.11)
Table 9.11 Summary of budget requirement for Energy sector
S.No Strategies Cost for 12th FYP (Rupees in crore)
Cost for 13th FYP (Rupees in crore)
1. Enhanced Energy Efficiency and Energy Conservation in Conventional Energy Sector
1475 1770
2. Renewable Energy and Solar Mission 61138 54975
3. Energy efficiency and Climate Change mitigative measures (TANGEDCO)
92825 97565
Grand Total
155438 154310
Detailed Budget for strategies in Energy Sector is given in the Table 9.12
Tamil Nadu State Action Plan for Climate Change
186
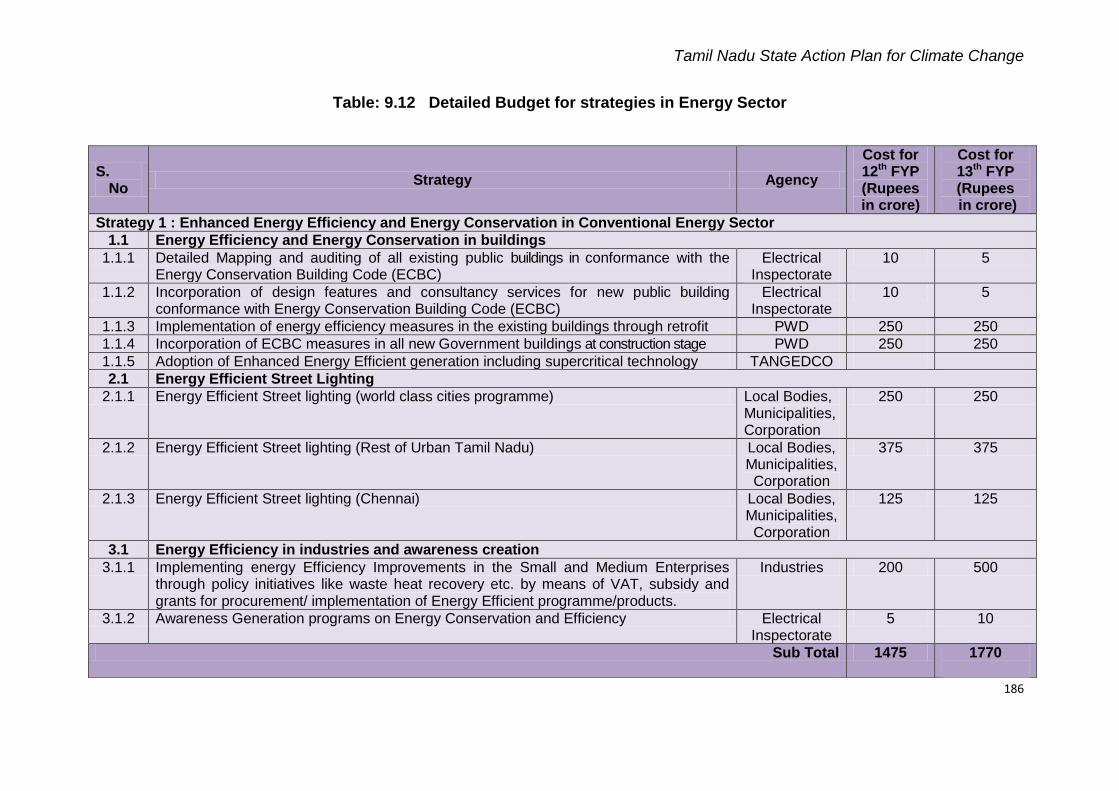
Table: 9.12 Detailed Budget for strategies in Energy Sector
S. No
Strategy Agency
Cost for 12th FYP (Rupees in crore)
Cost for 13th FYP (Rupees in crore)
Strategy 1 : Enhanced Energy Efficiency and Energy Conservation in Conventional Energy Sector
1.1 Energy Efficiency and Energy Conservation in buildings
1.1.1 Detailed Mapping and auditing of all existing public buildings in conformance with the Energy Conservation Building Code (ECBC)
Electrical Inspectorate
10 5
1.1.2 Incorporation of design features and consultancy services for new public building conformance with Energy Conservation Building Code (ECBC)
Electrical Inspectorate
10 5
1.1.3 Implementation of energy efficiency measures in the existing buildings through retrofit PWD 250 250
1.1.4 Incorporation of ECBC measures in all new Government buildings at construction stage PWD 250 250
1.1.5 Adoption of Enhanced Energy Efficient generation including supercritical technology TANGEDCO
2.1 Energy Efficient Street Lighting
2.1.1 Energy Efficient Street lighting (world class cities programme) Local Bodies, Municipalities, Corporation
250 250
2.1.2 Energy Efficient Street lighting (Rest of Urban Tamil Nadu) Local Bodies, Municipalities, Corporation
375 375
2.1.3 Energy Efficient Street lighting (Chennai) Local Bodies, Municipalities, Corporation
125 125
3.1 Energy Efficiency in industries and awareness creation
3.1.1 Implementing energy Efficiency Improvements in the Small and Medium Enterprises through policy initiatives like waste heat recovery etc. by means of VAT, subsidy and grants for procurement/ implementation of Energy Efficient programme/products.
Industries 200 500
3.1.2 Awareness Generation programs on Energy Conservation and Efficiency Electrical Inspectorate
5 10
Sub Total 1475 1770
Tamil Nadu State Action Plan for Climate Change
187
S. No
Strategy Agency
Cost for 12th FYP (Rupees in Crore)
Cost for 13th FYP
(Rupees in Crore)
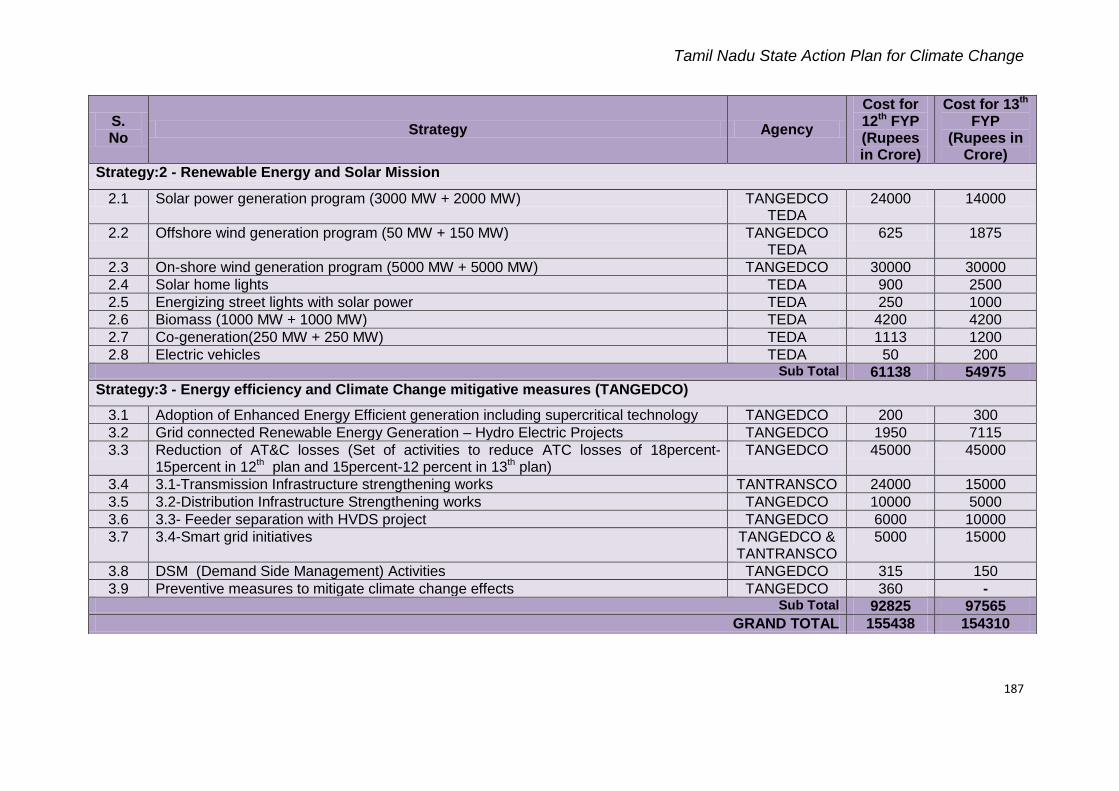
Strategy:2 - Renewable Energy and Solar Mission
2.1 Solar power generation program (3000 MW + 2000 MW) TANGEDCO TEDA
24000 14000
2.2 Offshore wind generation program (50 MW + 150 MW) TANGEDCO TEDA
625 1875
2.3 On-shore wind generation program (5000 MW + 5000 MW) TANGEDCO 30000 30000
2.4 Solar home lights TEDA 900 2500
2.5 Energizing street lights with solar power TEDA 250 1000
2.6 Biomass (1000 MW + 1000 MW) TEDA 4200 4200
2.7 Co-generation(250 MW + 250 MW) TEDA 1113 1200
2.8 Electric vehicles TEDA 50 200 Sub Total 61138 54975
Strategy:3 - Energy efficiency and Climate Change mitigative measures (TANGEDCO)
3.1 Adoption of Enhanced Energy Efficient generation including supercritical technology TANGEDCO 200 300
3.2 Grid connected Renewable Energy Generation – Hydro Electric Projects TANGEDCO 1950 7115
3.3 Reduction of AT&C losses (Set of activities to reduce ATC losses of 18percent-15percent in 12th plan and 15percent-12 percent in 13th plan)
TANGEDCO 45000 45000
3.4 3.1-Transmission Infrastructure strengthening works TANTRANSCO 24000 15000
3.5 3.2-Distribution Infrastructure Strengthening works TANGEDCO 10000 5000
3.6 3.3- Feeder separation with HVDS project TANGEDCO 6000 10000
3.7 3.4-Smart grid initiatives TANGEDCO & TANTRANSCO
5000 15000
3.8 DSM (Demand Side Management) Activities TANGEDCO 315 150
3.9 Preventive measures to mitigate climate change effects TANGEDCO 360 - Sub Total 92825 97565
GRAND TOTAL 155438 154310