(9) End-Face Inspection -...
40
Fiber Connector End-Face Inspection Project Dr. Tatiana Berdinskikh, Celestica International Celestica-iNEMI Technology Forum May 15, 2007
Transcript of (9) End-Face Inspection -...

Fiber ConnectorEnd-Face
InspectionProject
Dr. Tatiana Berdinskikh,Celestica International
Celestica-iNEMITechnology Forum
May 15, 2007

1
PresentationPresentation Outline Outline
• Introduction
• Highlights of Fiber Optic Performance Project
• The Fiber Connector End-Face Inspection Project
– Experimental Methodology
– The Influence of Contamination on Optical Performance
– Particle and Occluded Area Analysis using Images
– Gaussian Weighted % Occluded Area Analysis
– Inspection Criteria
– Evolution of Particle Center Position ( ESD effect)
• Further Research/ Phase 2 of the Project
• Conclusions
2
IntroductionIntroduction
• Fiber optic connector end-face cleaning recognized as anecessity
• Well known that contamination results in degradedperformance, but existing company specific standardslacked scientific basis
• iNEMI (International Electronics Manufacturing Initiative)research to develop a cleanliness specification for fiberoptic connectors
– Based on correlation with optical performance metrics
– Insertion Loss (IL) and Return Loss (RL) for this study
• Research used in the development of IPC-8497-1 “CleaningMethods and Contamination Assessment of OpticalAssembly” standard.
3
Projects/Background of the InitiativeProjects/Background of the Initiative
• Fiber Optic Signal Performance Project was organized
in 2002 to determine the effects of various anomalies
on the performance of a fiber optic signal
• A follow-on project, Fiber Connector End-Face
Inspection, was launched in 2004.
• Phase II of the End-Face Inspection Project was
launched in March 2007
– Project Chair: Tatiana Berdinskikh, Celestica, Inc.
– Project Co-Chair: Heather Tkalec, Alcatel-Lucent

4
Fiber Optic Signal Performance ProjectFiber Optic Signal Performance Project
5
35
40
45
50
55
60
65
D44
D54
D55
D56
D57
D601
D614
D621
D625
D30
D262
D320
D45
D603
D604
D613
D615
D616
D617
D626
D050
D728
D323
Connector Number
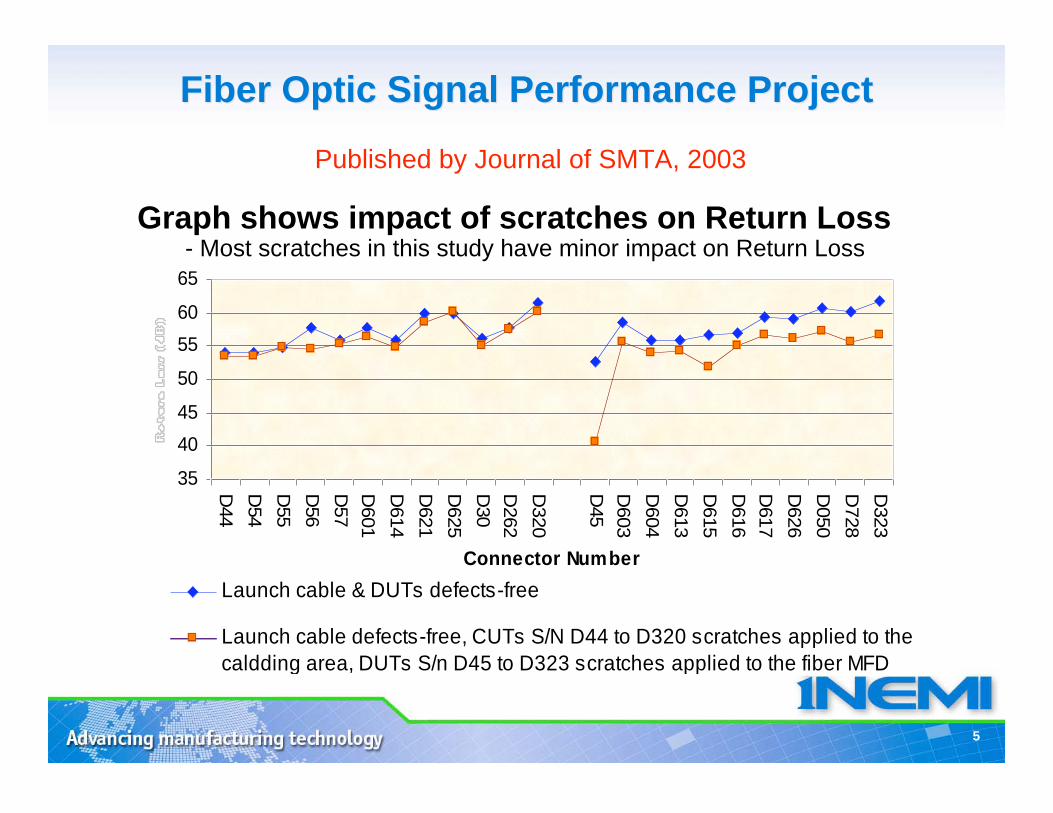
Launch cable & DUTs defects-free
Launch cable defects-free, CUTs S/N D44 to D320 scratches applied to the
caldding area, DUTs S/n D45 to D323 scratches applied to the fiber MFD
Graph shows impact of scratches on Return Loss- Most scratches in this study have minor impact on Return Loss
Fiber Optic Signal Performance ProjectFiber Optic Signal Performance Project
Published by Journal of SMTA, 2003

6
a) Particles on Ferrule and Cladding Area
00.20.40.60.8
11.2
JSC
1
JSC
3
JSC
5
LS
C4
TS
C152
TS
C153
Conn. ID
IL (
dB
)
B-IL(1550)
B-IL (1310)
A-IL(1550)
A- IL (1310)
b) Particles on Ferrule and Cladding
0
20
40
60
80
JSC
1
JSC
3
JSC
5
LS
C4
TS
C152
TS
C153
Conn. ID
RL
(dB
)
B- RL (1550)
B- RL (1310)
A RL (1550)
A RL (1310)
•IL-1550nm/1310nm(clean)=0.24/0.25dB;
•IL-1550nm/1310nm(contaminated)=0.92/1.07dB;
•RL-1550nm/1310nm (clean)=57.3/55.5dB;
•RL-1550/1310nm(contaminated)=56.5dB/55.6dB
Particle ison thecladdinglayer
Published by Journal of SMTA, 2003
Fiber Optic Signal Performance ProjectFiber Optic Signal Performance Project
The impact of Carbon Particles

7
Factors Affecting Optical PerformanceFactors Affecting Optical Performance
Delta IL vs Distance from Core
-0.2
0
0.2
0.4
0.6
0.8
1
1.2
1.4
1.6
1.8
2
0 5 10 15 20 25 30 35 40 45 50
Distance From Core (micron)
Delt
a IL
Delta IL
Published by APEX 2004
Delta RL vs Distance From Core
-50
-40
-30
-20
-10
0
10
0 5 10 15 20 25 30 35 40 45 50
Distance from Core (micron)
Delt
a R
L
Delta RL
The zone of 25 μm diameter was identified as the critical zone in terms
of the contamination influence on optical signal performance
8
Fiber Optic Signal Performance ProjectFiber Optic Signal Performance Project
)cos21()cos2( 21
2
2
2
121
2
2
2
1 rrrrrrrrR ++++=
hnnn
nnr
nn
nnr 2
12
122
20
201
4,, =
+=
+=
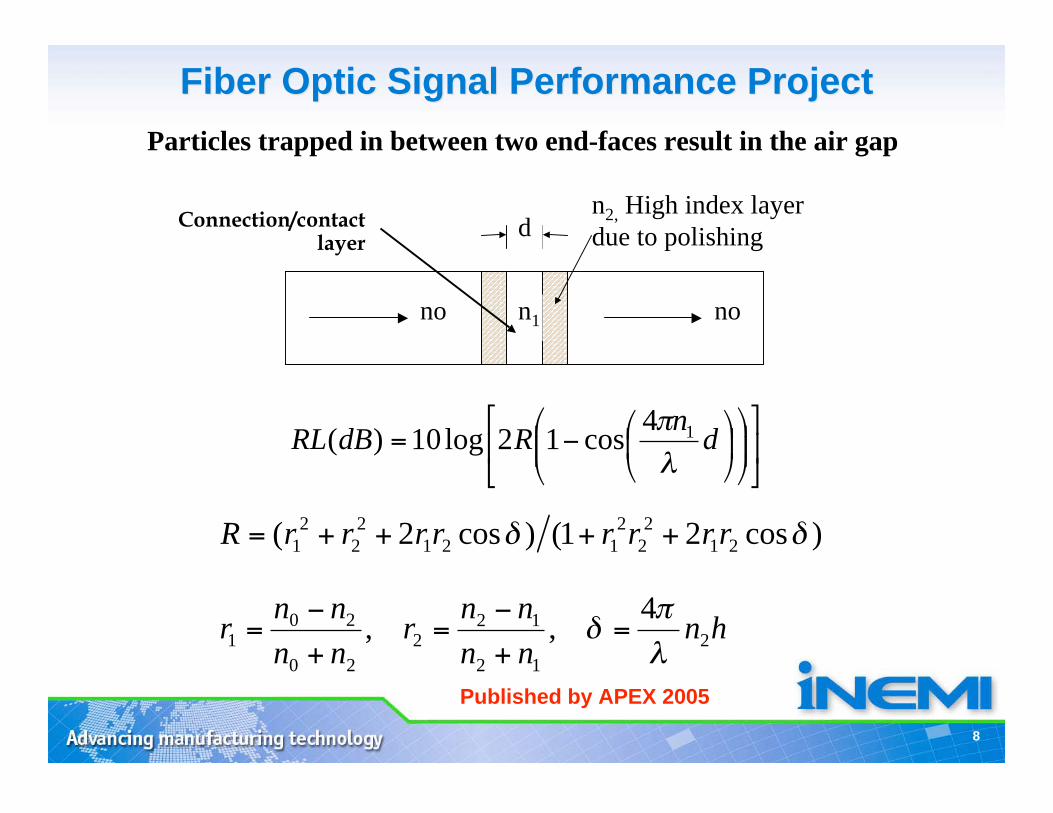
no non1
dn2, High index layer
due to polishing
= dn
RdBRL14
cos12log10)(
Connection/contactlayer
Particles trapped in between two end-faces result in the air gap
Published by APEX 2005
9
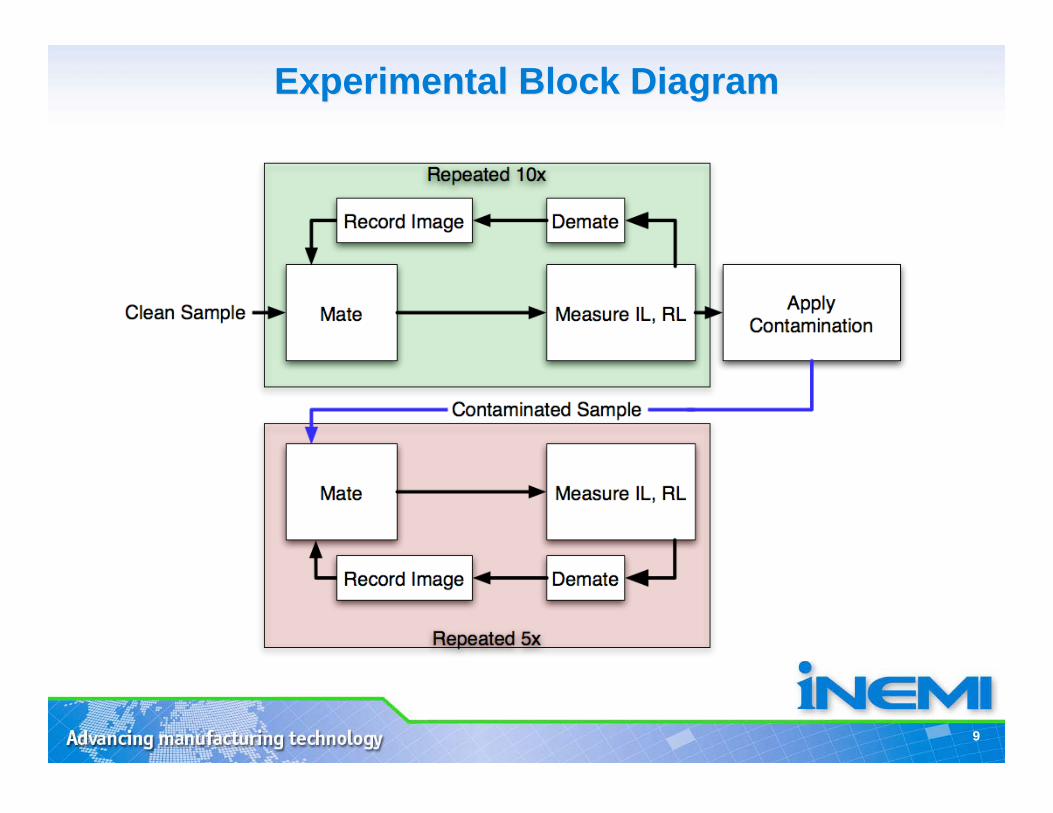
Experimental Block DiagramExperimental Block Diagram
10
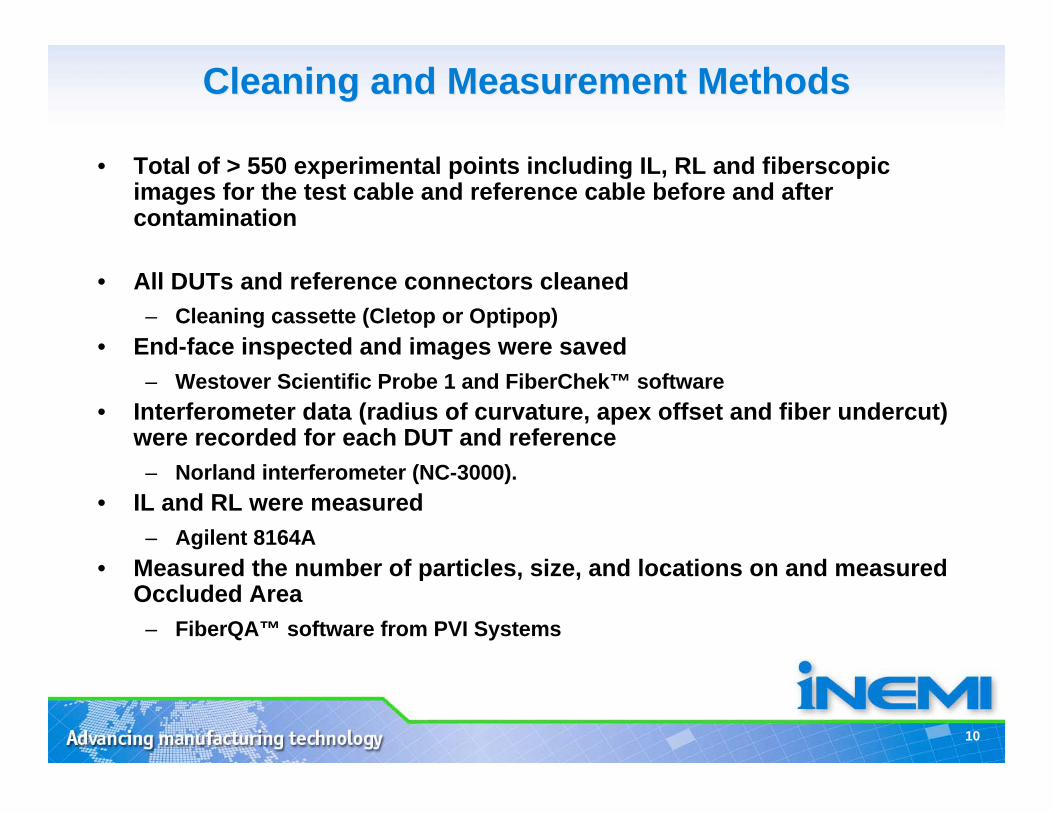
Cleaning and Measurement MethodsCleaning and Measurement Methods
• Total of > 550 experimental points including IL, RL and fiberscopicimages for the test cable and reference cable before and aftercontamination
• All DUTs and reference connectors cleaned
– Cleaning cassette (Cletop or Optipop)
• End-face inspected and images were saved
– Westover Scientific Probe 1 and FiberChek™ software
• Interferometer data (radius of curvature, apex offset and fiber undercut)were recorded for each DUT and reference
– Norland interferometer (NC-3000).
• IL and RL were measured
– Agilent 8164A
• Measured the number of particles, size, and locations on and measuredOccluded Area
– FiberQA™ software from PVI Systems

11
IL & RL Measurement DiagramIL & RL Measurement Diagram
Return Loss (dB)= 10 log (Pincident/ Preflected)=P0-P2-1.0
Note: During return loss test, the DUT jumper must be terminated by bending.
Insertion Loss (dB)= 10 log (Pincident/ Pout)=P0-P1

12
Clean Fiber
Area near thecore, d<25um
Cladding,25um<d<120um
Epoxy Ring Zone,120um<d<130um
ContactDiameter
130um<d<250um
Ferrule Diameter
250um<d<400um
Zone Definitions for Fiber Surface AnalysisZone Definitions for Fiber Surface Analysis

13
FC01-5th Mating Reference
CableInitial IL: 0.04dB
Initial RL: 54dBIL after contamination: 0.04dB
RL after contamination: 55dB
Passed: Within 3 Standard Deviations of Clean Fiber
3 x Standard Deviation of IL: 0.02dB
3 x Standard Deviation of RL: 3dB
FC Connectors - FC01 5th MatingFC Connectors - FC01 5th Mating

14
FC04- 2nd mating Reference Cable
Initial IL: 0.13dB
Initial RL: 54dB
IL after contamination: 0.26dB
RL after contamination: 34dB
Failed: Not Within 3 Standard Deviations of Clean Fiber
3 x Standard Deviation of IL: 0.03dB
3 x Standard Deviation of RL: 1.4dB
FC Connectors - FC04 2nd MatingFC Connectors - FC04 2nd Mating

15
LC07-1st Mating Reference Cable T07
Initial IL: 0.11dB
Initial RL: 53dB
IL after contamination: 0.12dB
RL after contamination: 53dB
3 x Standard Deviation of IL: 0.02dB
3 x Standard Deviation of RL: 1dB
Passed: Within 3 Standard Deviations of Clean Fiber
LC Connectors - LC07 1st MatingLC Connectors - LC07 1st Mating

16
LC07-3rd mating Reference cable T07
Initial IL: 0.11dB
Initial RL: 53dB
IL after contamination: 0.23dB
RL after contamination: 28dB
Failed: Not Within 3 Standard Deviations of Clean Fiber
3 x Standard Deviation of IL: 0.02dB
3 x Standard Deviation of RL: 1dB
LC Connectors - LC07 3rd MatingLC Connectors - LC07 3rd Mating

17
Initial IL: 0.11dB
Initial RL: 53dB
IL after contamination: 0.57dB
RL after contamination: 19dB
LC07- 5th mating Reference Cable T07
3 x Standard Deviation of IL: 0.02dB
3 x Standard Deviation of RL: 1 dB
Failed: Not Within 3 Standard Deviations of Clean Fiber
LC Connectors - LC07 5th MatingLC Connectors - LC07 5th Mating

18
Particle Detection OverlaysParticle Detection Overlays
Raw Cropped Image Detected Particle Overlay
• The raw image (left) was processed to detect and quantify the
particles on the surface, shown in overlay (right).
• Scratch processing was disabled for purposes of this analysis.
Over 270 images were processed using FiberQA

19
Labeled Detected Particles with
5 μm annular rings. (Black area is
ferrule and grey is fiber.)
Raw image for LC07-WD-5M
taken with Westover Microscope
Occluded Area OverlayOccluded Area Overlay

20
Incremental occluded area vs radius
Occluded Area GraphsOccluded Area Graphs
Cumulative occluded area vs radius
Data for connector LC07

21
Normalized Occluded AreaNormalized Occluded Area
• Occluded area within each ringis normalized by the area of thatring
• Plotted as percentage ofincremental area
• This was first attempt atnormalizing data that lead toweighting by intensitydistribution vs radius
• Sample LC 07:
–Before mating core clean
–1st mating 1.4% occluded
–2nd mating 11.6% occluded
–4th mating 32.9% occluded
–delta IL=0.46dB and deltaRL=24dB) over the mating cycles
22
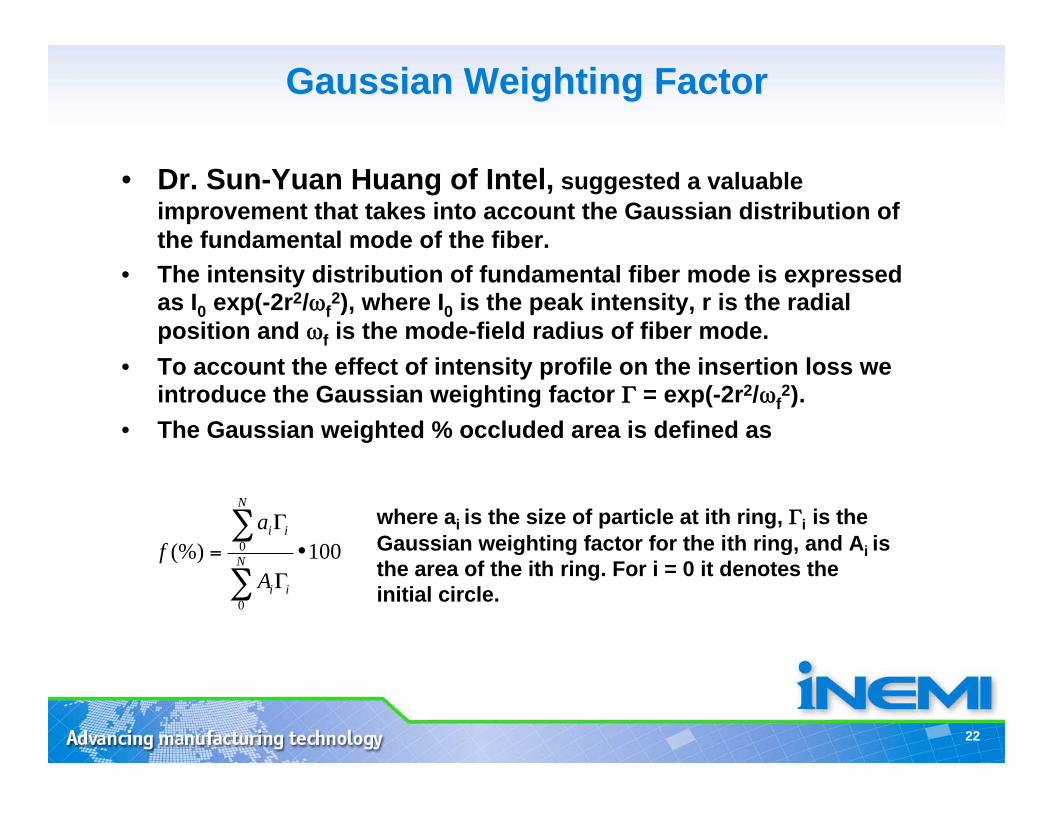
Gaussian Weighting FactorGaussian Weighting Factor
• Dr. Sun-Yuan Huang of Intel, suggested a valuable
improvement that takes into account the Gaussian distribution of
the fundamental mode of the fiber.
• The intensity distribution of fundamental fiber mode is expressedas I0 exp(-2r2/ f
2), where I0 is the peak intensity, r is the radial
position and f is the mode-field radius of fiber mode.
• To account the effect of intensity profile on the insertion loss weintroduce the Gaussian weighting factor = exp(-2r2/ f
2).
• The Gaussian weighted % occluded area is defined as
where ai is the size of particle at ith ring, i is the
Gaussian weighting factor for the ith ring, and Ai is
the area of the ith ring. For i = 0 it denotes the
initial circle.
100(%)
0
0 •=N
ii
N
ii
A
a
f
23
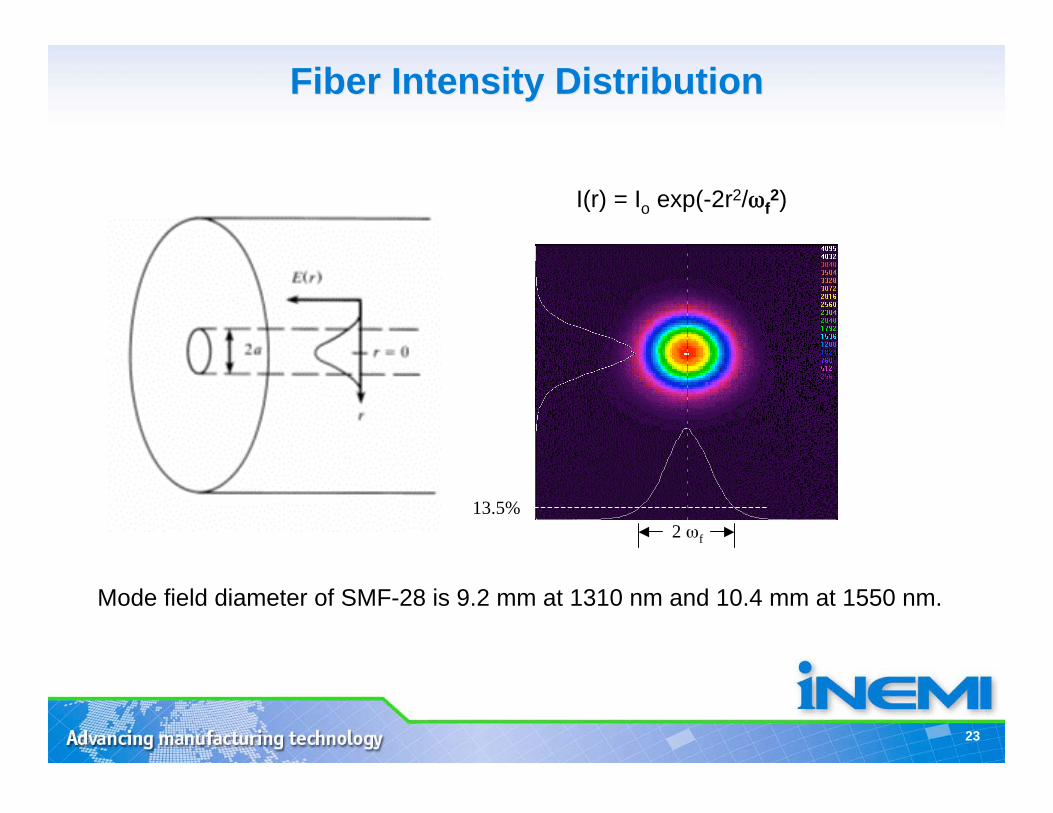
Fiber Intensity DistributionFiber Intensity Distribution
13.5%
2 f
I(r) = Io exp(-2r2/ f2)
Mode field diameter of SMF-28 is 9.2 mm at 1310 nm and 10.4 mm at 1550 nm.

24
Delta IL Delta IL vsvs Gaussian Weighted % Occluded Area Gaussian Weighted % Occluded Area
The Delta IL for the worst-case defects and scratches based
on inspection criteria is less than 0.03 dB

25
Inspection Criteria for SMF End-faceInspection Criteria for SMF End-face
anynone > 10 microns130 to 250
microns2 — Contact Zone
anyany120 to 130
micronsAdhesive Zone
none > 3 microns
any < 2 microns
5 from 2 - 5 microns
none > 5 microns
25 to 120
microns1b — Cladding Zone
nonenone0 to 25
microns 1a — Core Zone
Scratches (width)Defects (diameter)DiameterZone/Description
Allowable Defects and Scratches

26
Receptacles ModulesReceptacles Modules
Distance from core (um)
Published by Photonics North 2005 conference

27
ESD Effects From CleaningESD Effects From Cleaning
• The increased accumulation of particles near the core
during a series of mating/de-mating operations was
investigated. One cause for this accumulation was ESD
(electrostatic discharge) effects from cleaning. Methods to
prevent this phenomenon were studied.
The paper “Accumulation of Particles Near the Core during
Repetitive Fiber Connector Matings and De-matings” was
presented at NFOEC 2007, Anaheim, March 2007

28
ESD EffectESD Effect
Electrostatic charges generated from cleaning process with cleaning cassette,Type 1 for standard and non-standard connector samples.
Humidity is 28%, room temperature is 24C.
Sample preparation
29
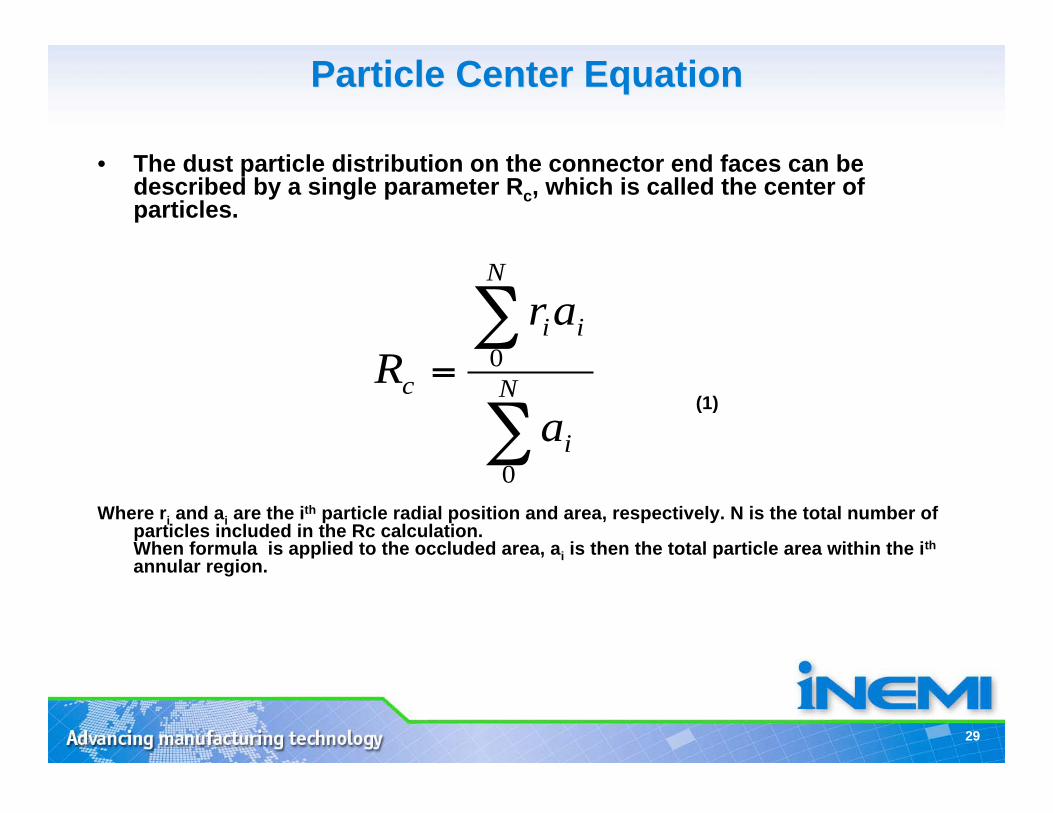
Particle Center EquationParticle Center Equation
• The dust particle distribution on the connector end faces can bedescribed by a single parameter Rc, which is called the center ofparticles.
Where ri and ai are the ith particle radial position and area, respectively. N is the total number ofparticles included in the Rc calculation.When formula is applied to the occluded area, ai is then the total particle area within the ith
annular region.
=N
i
N
ii
c
a
ar
R
0
0
(1)

30
Particle Center vs. MatingParticle Center vs. Mating
Evolution of Particle Center Position for Experiment 1, 2, 11, 16, and 18
Exp 1 and 2 show a dramatic decrease in Rc during repeated matings.
Radius decreases with increasing matings
0
50
100
150
200
250
300
0 1 2 3 4 5
Number of Mating Cycles
Rc
(u
m)
Exp1
Exp2
Exp11
Exp16
Exp18

31
y = 166.18x
R2 = 0.9073
0
25
50
75
100
125
0 0.1 0.2 0.3 0.4 0.5 0.6 0.7 0.8
Charge (nC)
Mo
vin
g S
pe
ed
(um
/ma
te)
Correlation of Rc Speed to ChargeCorrelation of Rc Speed to Charge
• Based on the fact that the electrostatic force F is proportional to the
amount of charge Q, we describe their relationship by F = b*Q, where b is
the constant depending on the geometrical configuration and the electrical
property of dust particles.
F=m*dV/dt (1)
Vc=c*Q (2)
c=b* t/m, c=166 m/mate/nC (3)
Particle center moving speed versus charge

32
Leading the IndustryLeading the Industry
Collaboration with TIA, IEC and IPC• The Project is collaborating with International Electrotechnical
Committee (IEC), Telecommunications Industry Association (TIA)and IPC to develop a cleanliness standard.
iNEMI presentations:• OMI conference, Ottawa, Apr-29-May 1, 2003
• IEC meeting, Montreal, Quebec, Canada, Oct 6-13, 2003 (presented by T.Berdinskikh, Celestica)
• APEX2004, Anaheim, California, Feb 19-Feb 26, 2004
• IEC meeting, Locarno, Switzerland, Apr, 04 (presented by T. Mitcheltree,Cisco)
• IEC meeting, Warsaw, Poland, Sep, 04 (presented by R. Manning, Tyco)• APEX2005, Anaheim, California, Feb, 05
• IEC meeting, Charlotte, NC, Apr, 05 (presented by R. Manning, Tyco)• A draft of IPC-8497-01 “ Cleaning Methods and Contamination Assessment for Optical
Assembly” has been submitted to IPC (June, 04)
• OFC2006, Anaheim, California, Feb, 06
• IEC meeting, Quebec City, Canada, Oct, 06 ( presented by T. Berdinskikh andHeather Tkalec)
• OFC/NFOEC 2007, Anaheim, Califirnia, March, 07

33
Fiber Connector End-Face Project, Phase IIFiber Connector End-Face Project, Phase II
• The Fiber Connector End-Face Inspection Project waslaunched in March 2007
– Face-to-face meeting was held at NFOEC conference, March26, 2007 (Anaheim, CA)
– The project team already developed the Statement of Work
• Further Research:
– Development a cleanliness specification for multimode (MM)fiber, MTP connectors and receptacle type devices
– Measure the particles thickness in order to correlate the RLchanges with the size of the air gap
– Correlate the changes of IL & RL of contaminated connectorswith the signal integrity (Bit Error Rate)

34
Sample MT Endface DataSample MT Endface Data
Clean DUT Contaminated DUT (Arizona Road Dust)
Zone A – 25 micron
Core – 10 micron
611-23 Ref – 604B DUT; F6 D1 IL (dB) RL (dB)
average (10X) 0.098 69.4
std deviation 0.013 0.7
average + 3X std dev 0.137 67.4
0.430 33.4
clean
Contaminated
US Conec Research

35
ConclusionsConclusions
• The iNEMI team conducted experiments to compare the effects ofspecific contamination on the optical performance of fiber opticconnectors
• The zone of 25 μm diameter was identified as critical zone in terms of thecontamination influence on optical signal performance for all types ofinvestigated connectors
• Developed empirical model between IL and the Gaussian Weighted %Occluded Area
• In 60% of all examined LC and MU connectors, a series of five repeatedmatings/demating operations resulted in an increase of IL of 0.5 to 1.1dB due to particle movement from the ferrule and cladding areastowards the core
• Electrostatic charge force was one of the mechanisms responsible forthe particle accumulation, re-distribution and their movement in the corearea during repetitive connector mating and de-mating cycles

36
ConclusionsConclusions
• The iNEMI project team successfully completed 2 projects: theFiber Optic Signal Performance ( 2002-2004) and the FiberConnector End- Face Inspection, Phase I ( 2004-2007). A newproject (Phase II) launched in March, 07
• The iNEMI research was used as a baseline for the developmentof IPC-84-97-1 “ Cleaning Methods and contaminationAssessment for Optical Assembly’
• A project team delivered 10 papers published by industrialmagazines and International optic conferences
• Further research is required on a development of the cleanlinessspecification for MM connectors, MT- ferrule connectors andreceptacle modules

37
Project participants, 2004-2007Project participants, 2004-2007
• Tatiana Berdinskikh, Celestica
• Jose Garcia, JDS Uniphase
• Steve Lytle, Westover Scientific
• Randy Manning, Tyco Electronics
• David Fisher, Tyco Electronics
• Brian J. Roche, Cisco Systems
• Tom Mitcheltree, Cisco Systems
• Mike Hughes, USConec
• Thomas Ronan, Aerotech
• Heather Tkalec, Alcatel
• Frank (Yi) Zhang, Avanex
• Denis Gignac, Nortel Networks
• Doug Wilson, PVI Systems
• Dr. Chip Kilmer, Sagitta
• Dr. Sun-Yuan Huang, Intel
• Carla Gleason, ExceLight CommunicationsInc/ Sumitomo Electric
• Harvey Stone, Microcare
• John Culbert, Megladon Mfg
• Yutaka Sadohara, Sumitomo Electric

38
Past participants, 2002-2004Past participants, 2002-2004
• Tatiana Berdinskikh, N. Albeanu Celestica
• Jennifer Nguyen, Solectron
• Yves Pradieu, Solectron-Iphotonics
• Randy Manning, Tyco Electronics
• Dave Silmser/Heather Tkalec, Alcatel
• Tom Mitcheltree, Cisco Systems
• Thomas Ronan, Ingrid Levy, Aerotech
• Frank (Yi) Zhang, Avanex
• Denis Gignac, Nortel Networks
• Carla Gleason, ExceLight CommunicationsInc/ Sumitomo Electric
• Les Aseere, Sanmina
• Matt Brown, USCONEC
• Steve Lytle, Westover Scientific
• Susan Grant, Corning
• Arnaud Nicolas, FCI
• Mark Vogel, Trace Labs
• David Horat, Diamond