
9 Decision criteria - Department of Transport and Main Roads
9
103 9 Decision criteria The decision criteria provide an indication of the economic performance of the proposal. This section provides the formula used to calculate the decision criteria employed in CBA6. The key decision criteria used in CBA6 include: • BCR • NPV • FYRR • NPVI • IBCR 4
Transcript of 9 Decision criteria - Department of Transport and Main Roads

103
9 Decision criteriaThe decision criteria provide an indication of the economic performance of the proposal. This section provides the formula used to calculate the decision criteria employed in CBA6. The key decision criteria used in CBA6 include:
• BCR
• NPV
• FYRR
• NPVI
• IBCR
4

4.104
The BCR is the economic measure which is used to prioritise the selection of road projects. The BCR provides a single measure that can be used to support the decision to either accept or reject a project. In a budget constrained environment, the BCR can be used as a tool to rank and prioritise all projects in the budget pool. For this reason, the BCR is the preferred decision criterion for project economic justification.
The other decision criterion that provides decision makers with additional information is the NPV. Other indicators such as payback period and internal rate of return are not addressed in CBA6 or in this section. For further detail on why some indicators are used over others, see Section 1.7 of the Theoretical Guide.
Note: The principal of discounting is applied within each of these measures and is covered in Section 9.1. The residual value calculation used to calculate the value of the remaining life of the asset is discussed in Section 9.7, and is incorporated in the final year of the evaluation as a benefit.
Cost-benefit Analysis manual, First Edition, February 2011 ©Transport and Main Roads

4.105
9.1 Discounting
Future flows of benefits and costs are discounted to reflect the time value of money, as discussed in Section 1.4 of the Theoretical Guide. The discounting formula is applied to both benefits and cost streams. Equation 80 shows the discounting formula used in CBA6.
Equation 80: Discounting benefits
Where:
• Bi = benefit or cost in year i
• n = number of years in the evaluation period
• r = real discount rate
Table 42 shows a benefit flow of $1000 in Year 1 followed by benefits of $500 per annum until Year 5.
Table 42: Discounting benefits
Year 1 2 3 4 5 Total
Benefit ($) 1000 500 500 500 500 3000
Discounted benefit (present value $) 943 445 419 396 373 2577
Example: Discounting benefits
Assuming a 6% discount rate, the discounted total benefit is equal to:
The results shown by Table 42 show that the benefit of $500 earned in Year 2 is higher than the $500 earned in Year 5 when compared to the present value. $500 in Year 2 is equivalent to $445 in present value while benefits of $500 in Year 5 are only worth $373 in present value.
Cost-benefit Analysis manual, First Edition, February 2011 ©Transport and Main Roads

4.106
9.2 Benefit-cost ratio
BCR is the discounted benefits divided by the discounted capital costs and the discounted net operating costs. The BCR is shown by Equation 81. The BCR will be greater than 1 whenever discounted benefits exceed discounted costs. A project with a BCR above 1 provides a net economic gain and can be considered economically justified. In a budget constrained environment, projects should be prioritised according to their BCRs. A project with a higher BCR provides a greater benefit per dollar invested and should receive priority in the allocation of funding. This will ensure the efficient allocation of scarce resources.
Equation 81: Benefit-cost ratio
Where:
• Ki = capital costs
• OCi = operating costs
• R = discount rate
• B = net benefits
Example: Benefit-cost ratio
If the sum of the discounted capital and operating costs is assumed to be $50 million over the evaluation period and the discounted benefits are assumed to be $70 million, then the BCR is given as follows:
This example indicates that the present value of the benefits exceeds the present value of the costs required to build a project by 1.4 times.
Cost-benefit Analysis manual, First Edition, February 2011 ©Transport and Main Roads

4.107
9.3 Net present value
NPV measures the actual or real net economic benefit of a project. While the BCR provides a ratio of benefits to costs, NPV measures the absolute net economic gain. NPV is calculated by subtracting the discounted costs from the discounted benefits. All projects with a positive NPV provide a net economic benefit. NPV should be used when comparing mutually exclusive project options. The option with the highest NPV is the preferred option.
Equation 82: Net present value
Where:
• Bi = net annual benefits
• R = discount rate
• Ci = net annual costs
Example: Net present value
If the discounted total benefits are assumed to be $70 million and the discounted total costs are assumed to be $50 million, the NPV is:
This result indicates that there has been a welfare improvement of $20 million in net terms as a result of this project.
Cost-benefit Analysis manual, First Edition, February 2011 ©Transport and Main Roads

4.108
9.4 First year rate of return
FYRR measures the economic return of a project in the first year of operation. FYRR is defined as the ratio of benefits in the first year divided by the capital costs of a project (including operating costs). If the FYRR is below the project discount rate, deferral of the project may be warranted to maximise the net economic gain.
Equation 83: First year rate of return
Where:
• Btf = net benefits in the first year of operation
• Ci = net capital costs
Example: First year rate of return
Using the 6% discount rate, if the first year net benefits of a project are $2 million and the discounted total cost is $50 million, then the FYRR is:
Cost-benefit Analysis manual, First Edition, February 2011 ©Transport and Main Roads
4.109
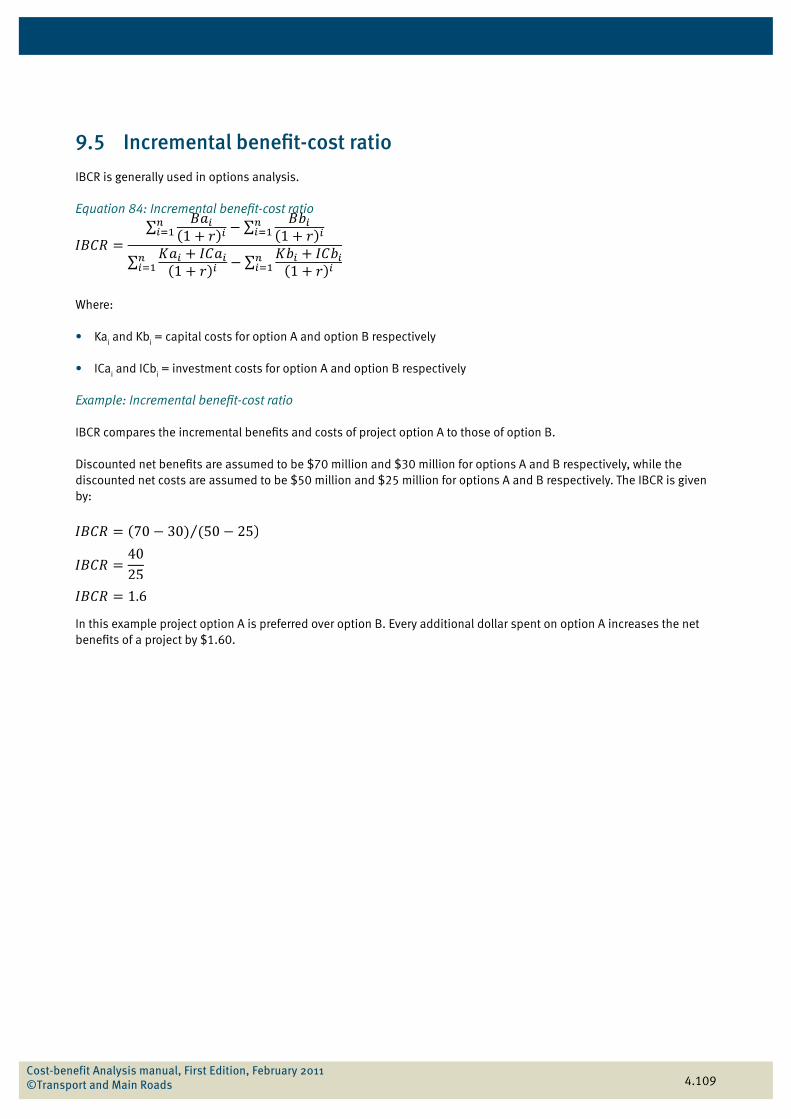
9.5 Incremental benefit-cost ratio
IBCR is generally used in options analysis.
Equation 84: Incremental benefit-cost ratio
Where:
• Kai and Kb
i = capital costs for option A and option B respectively
• ICai and ICb
i = investment costs for option A and option B respectively
Example: Incremental benefit-cost ratio
IBCR compares the incremental benefits and costs of project option A to those of option B.
Discounted net benefits are assumed to be $70 million and $30 million for options A and B respectively, while the discounted net costs are assumed to be $50 million and $25 million for options A and B respectively. The IBCR is given by:
In this example project option A is preferred over option B. Every additional dollar spent on option A increases the net benefits of a project by $1.60.
∑ ∑
∑ ∑
Cost-benefit Analysis manual, First Edition, February 2011 ©Transport and Main Roads

4.110
9.6 Net present value per dollar investment
The NPVI, also known as the capital efficiency ratio, is the NPV of a project divided by the net capital cost of a project.
Equation 85: Net present value per dollar investment
Where:
• Bi = net annual benefits
• Ci = net annual cost
Example: Net present value per dollar investment
If the discounted net benefit of a project is $70 million and the discounted net cost is $50 million, the NPVI is:
The NPVI of 0.4 means that for each dollar invested, a contribution of $0.4 is made to a project’s NPV.
Cost-benefit Analysis manual, First Edition, February 2011 ©Transport and Main Roads

4.111
9.7 Residual value
As mentioned in Section 2.3.3 of the Theoretical Guide, there are occasions where capital assets have a useful life beyond the life of the evaluation. To account for the benefit that the asset returns beyond the evaluation period, a residual value is calculated and applied in the last year of the evaluation as a negative cost.
The remaining life of the asset/project at the end of the analysis period should be expressed as a proportion of the total asset life. Multiplying the capital cost of a project by the proportion of remaining asset life to total asset life is one method of calculating the residual value of the asset. This value is then discounted in the final year of the evaluation.
Equation 86: Residual value
Where:
• YearsRemain = useful remaining life of the project (years)
Example: Residual value
The residual value of a $100 million project with a useful life of 50 years over a 30-year analysis period is:
The result implies that additional benefits to the value of $40 million will accrue to a project beyond the evaluation.
Cost-benefit Analysis manual, First Edition, February 2011 ©Transport and Main Roads