9. basic concepts_of_one_way_analysis_of_variance_(anova)
38
1 Basic Concepts of One- way Analysis of Variance (ANOVA) Sporiš Goran, PhD. http://kif.hr/predmet/mki http:// www.science4performance.com/
-
Upload
irfan-hussain -
Category
Education
-
view
108 -
download
0
Transcript of 9. basic concepts_of_one_way_analysis_of_variance_(anova)

1
Basic Concepts of One-wayAnalysis of Variance
(ANOVA)Sporiš Goran, PhD.http://kif.hr/predmet/mkihttp://www.science4performance.com/

2
Overview
• What is ANOVA?• When is it useful?• How does it work?• Some Examples• Limitations• Conclusions

3
Definitions
• ANOVA: analysis of variation in an experimental outcome and especially of a statistical variance in order to determine the contributions of given factors or variables to the variance.
• Remember: Variance: the square of the standard deviation
Remember: RA Fischer, 1919-Evolutionary Biology

4
Introduction• Any data set has variability
• Variability exists within groups…
• and between groups
• Question that ANOVA allows us to answer : Is this variability significant, or merely by chance?

5
• The difference between variation within a group and variation between groups may help us determine this. If both are equal it is likely that it is due to chance and not significant.
• H0: Variability w/i groups = variability b/t groups, this means that 1 = n
• Ha: Variability w/i groups does not = variability b/t groups, or, 1 n

6
Assumptions
• Normal distribution
• Variances of dependent variable are equal in all populations
• Random samples; independent scores

7
One-Way ANOVA
• One factor (manipulated variable)
• One response variable
• Two or more groups to compare

8
Usefulness
• Similar to t-test
• More versatile than t-test
• Compare one parameter (response variable) between two or more groups

9
For instance, ANOVA Could be Used to:
• Compare heights of plants with and without galls
• Compare birth weights of deer in different geographical regions
• Compare responses of patients to real medication vs. placebo
• Compare attention spans of undergraduate students in different programs at PC.

10
Why Not Just Use t-tests?• Tedious when many groups are
present
• Using all data increases stability
• Large number of comparisons some may appear significant by chance

11
Remember that…
• Standard deviation (s) n
s = √[(Σ (xi – X)2)/(n-1)] i = 1
• In this case: Degrees of freedom (df)
df = Number of observations or groups - 1

12
Notation• k = # of groups• n = # observations in each group• xij = one observation in group i
• Y = mean over all groups
• Yi = mean for group i• SS = Sum of Squares• MS = Mean of Squares• λ = Between MS/Within MS

13
FYI this is how SS Values are calculated
k ni
• Total SS = Σ Σ (xij – )2 = SStot i=1 j=1
k ni
• Within SS = Σ Σ (xij – i)2 = SSw
i=1 j=1 k ni
• Between SS = Σ Σ ( i – )2 = SSbet i=1 j=1

14
and
• SStot = SSw + SSbet

15
Calculating MS Values
• MS = SS/df
• For between groups, df = k-1
• For within groups, df= n-k

16
Hypothesis Testing & Significance Levels

17
F-Ratio = MSBet/MSw
• If:– The ratio of Between-Groups MS:
Within-Groups MS is LARGE reject H0 there is a difference between groups
– The ratio of Between-Groups MS: Within-Groups MS is SMALLdo not reject H0 there is no difference between groups

18
p-values
• Use table in stats book to determine p
• Use df for numerator and denominator
• Choose level of significance
• If F > critical value, reject the null hypothesis (for one-tail test)

19
Example 1, pp. 400 of your handout• Three groups:
– Middle class sample– Persons on welfare– Lower-middle class sample
• Question: Are attitudes toward welfare payments the same?

20
So,
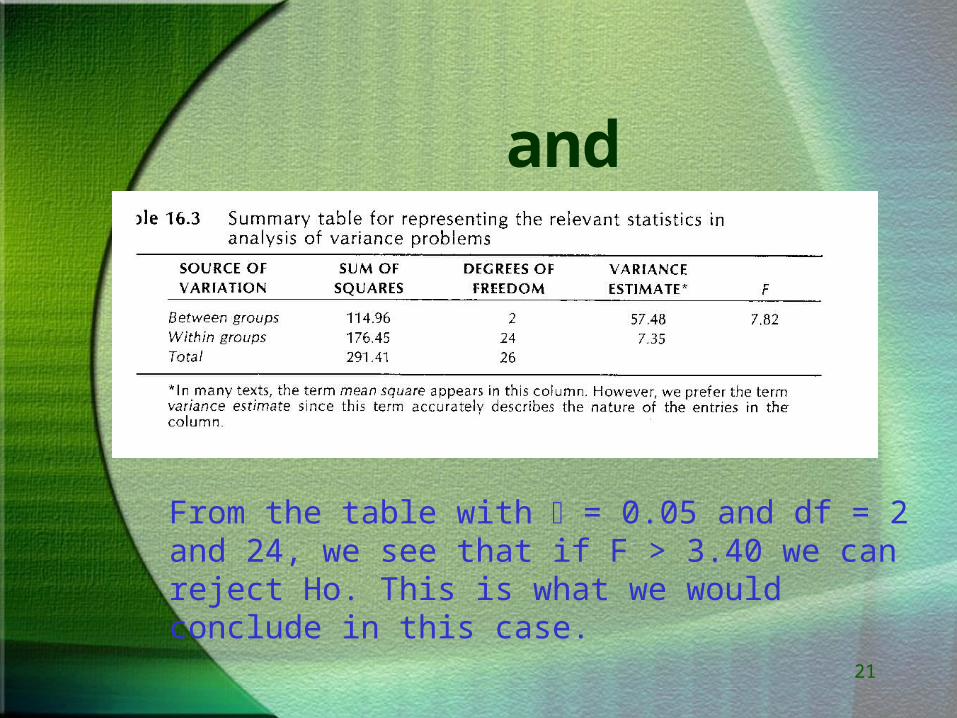
21
and
From the table with = 0.05 and df = 2 and 24, we see that if F > 3.40 we can reject Ho. This is what we would conclude in this case.

22
Example 2
• Bat cave gates:– Group 1 = No gate (NG)– Group 2 = Straight entrance gate (SE)– Group 3 = Angled entrance gate (AE)– Group 4 = Straight dark zone gate (SD)– Group 5 = Angled dark zone gate (AD)
• Question: Is variation in bat flight speed greater within or between groups? Or Ho = no difference significant difference in means.

23
Just leave me alone Max! Go back to
your hockey!

24
Example 2 (cont’d)
Group #, i
Gate Type
Mean FS (m/s) sd FS (m/s) ni
1 NG 5.6 0.93 150
2 SE 3.8 1.05 150
3 AE 4.7 0.97 150
4 SD 4.2 1.23 137
5 AD 5.1 1.03 143
Hypothetical data for bat flight speed with various gate arrangements.
FS= Flight speed; sd = standard deviation

25
Example 2 SSbet
Between SS = 300
Group #, i
Gate Type
Mean FS (m/s)
sd FS (m/s) ni
1 NG 5.6 0.93 150
2 SE 3.8 1.05 150
3 AE 4.7 0.97 150
4 SD 4.2 1.23 137
5 AD 5.1 1.03 143

26
Example 2 SSw
Within SS = 790
Group #, i
Gate Type
Mean FS (m/s)
sd FS (m/s) ni
1 NG 5.6 0.93 150
2 SE 3.8 1.05 150
3 AE 4.7 0.97 150
4 SD 4.2 1.23 137
5 AD 5.1 1.03 143

27
Example 2 (cont’d)
• Between MS = 300/4 = 75
• Within MS = 790/(730-5) = 1.09
• F Ratio = 75/1.09 = 68.8
• See Table find p-value based on df= 4,• Since F>value found on the table we
reject Ho.

28
What ANOVA Cannot Do• Tell which groups are different
– Post-hoc test of mean differences required
• Compare multiple parameters for multiple groups (so it cannot be used for multiple response variables)

29
Some Variations
• Two-Way, Three-Way, etc. ANOVA (will talk about this next class)– 2+ factors
• MANOVA (Multiple analysis of variance)– multiple response variables

30
Summary
• ANOVA:– allows us to know if variability in a data
set is between groups or merely within groups
– is more versatile than t-test– can compare multiple groups at once– cannot process multiple response
variables– does not indicate which groups are
different

31
Now, let’s go to our SPSS manual
• Perform the sample problem on the effects of attachment styles on the psychology of sleep with the data set from the NAAGE site called Delta Sleep.
• Pay attention to the procedure and the post-hoc tests to determine which groups are significantly different. Perform the Tukey Test at a 5% significance level.
• Look at your output and interpret your results.
• Tell me when you are done.

32
So, you had

33
Then, following the steps

34

35
You got

36
and

37
What do all these mean?

38
When you are done with this,
• Do practice exercises 1, 4, 6, 7 and 12 from the handout in SPSS.– Create the data sets.– Run the one-way ANOVAS and
interpret your results.