9 April 2019 Wealth Bulletinelarawealth.com/pdf/Wealth-Bulletin.pdfProduct Manager – Sandip...
12
Product Manager – Sandip Solanki • [email protected] • +91 22 42048607 Confidential & for Private Circulation only Economy and Market Outlook Equity Markets witnessed fresh wave of optimism from the companies reporting annual results & outlook for coming years have been key factors driving the markets on the positive direction. Further, Policy priorities from the government, outcome of elections and forecast of monsoon will remain key triggers driving the markets in near term. RBI reduced repo rate by 25 bps to 6.00% in its second bi-monthly monetary policy meet. It projected GDP growth for 2019-20 at 7.2%, down from 7.4% projected for 2018-19 – in the range of 6.8-7.1% in H1:2019-20 and 7.3- 7.4% in H2. The dovish stand across the globe, recent change in stance of Federal Open Market Committee (FOMC) and announcement that there will no rate hikes, which was followed by other central banks, including the European Central Bank, Bank of England and Bank of Japan, have led to increased liquidity in the system and propelled markets across the globe and in India. As against a lull seen over the past year, FPI flows turned sharply positive in February 2019 at USD 2.4bn and at USD 4.8bn in March 2019. We expect FPI flows to continue on the back of 1) The Fed’s rate pause induced decline in dollar strength, and 2) India’s standing vs other exports-oriented emerging market (EM) in a growth- challenged global environment. We remain constructive on equities backed by the expected buoyancy in the corporate earnings in the upcoming years and reasonable valuations post the consolidation phase of last calendar year. Debt Government bond prices ended flat and off earlier highs. Yield of the 10- year benchmark 7.26% 2029 paper settled at 7.35% on April 5, steady compared with March 29. What remains a concern is RBI’s commentary on domestic inflation expected to be affected by EL Nino in 2019. CPI Inflation stood at 2.57 percent in February compared to revised 1.97 percent in January 2019 due ease in the fall of food prices and abrupt reversal in vegetable prices in summer months. India’s fiscal deficit for April-February 2018-19 was Rs 8.51 lakh crore as against the revised estimate (RE) of Rs 6.34 lakh crore for the entire year, which continues to remain the concern for the longer end of the yield curve. The rupee rose earlier last month aided by intermittent gains in domestic equities and exporters’ dollar sales. However it was under pressure this month, tracking decline in the domestic equities after RBI retained a neutral stance while flagging inflation and fiscal risks. We expect rupee to trade range bound in the near term. Credit spread has started narrowing down post central bank decision of buying dollar/rupee swap amounting $5 billion in the three year tenor. This will further give liquidity boost to overall banking system and aid reducing short term borrowing cost. We continue to like accrual funds over gilt. Funds with average maturity of two to three years are well placed to relatively outperform other debt funds. Categorically, Short duration funds, Banking & PSU debt funds and ultra short term funds continue remain in the traction. 9 April 2019 Wealth Bulletin
Transcript of 9 April 2019 Wealth Bulletinelarawealth.com/pdf/Wealth-Bulletin.pdfProduct Manager – Sandip...

Product Manager – Sandip Solanki • [email protected] • +91 22 42048607
Confidential & for Private Circulation only
Economy and Market Outlook
Equity
Markets witnessed fresh wave of optimism from the companies reporting annual results & outlook for coming
years have been key factors driving the markets on the positive direction. Further, Policy priorities from the
government, outcome of elections and forecast of monsoon will remain key triggers driving the markets in near
term.
RBI reduced repo rate by 25 bps to 6.00% in its second bi-monthly monetary policy meet. It projected GDP growth for 2019-20 at 7.2%, down from 7.4% projected for 2018-19 – in the range of 6.8-7.1% in H1:2019-20 and 7.3- 7.4% in H2. The dovish stand across the globe, recent change in stance of Federal Open Market Committee (FOMC) and
announcement that there will no rate hikes, which was followed by other central banks, including the European
Central Bank, Bank of England and Bank of Japan, have led to increased liquidity in the system and propelled
markets across the globe and in India.
As against a lull seen over the past year, FPI flows turned sharply positive in February 2019 at USD 2.4bn and at
USD 4.8bn in March 2019. We expect FPI flows to continue on the back of 1) The Fed’s rate pause induced
decline in dollar strength, and 2) India’s standing vs other exports-oriented emerging market (EM) in a growth-
challenged global environment.
We remain constructive on equities backed by the expected buoyancy in the corporate earnings in the upcoming
years and reasonable valuations post the consolidation phase of last calendar year.
Debt
Government bond prices ended flat and off earlier highs. Yield of the 10- year benchmark 7.26% 2029 paper settled at 7.35% on April 5, steady compared with March 29. What remains a concern is RBI’s commentary on domestic inflation expected to be affected by EL Nino in 2019. CPI Inflation stood at 2.57 percent in February compared to revised 1.97 percent in January 2019 due ease in the fall of food prices and abrupt reversal in vegetable prices in summer months. India’s fiscal deficit for April-February 2018-19 was Rs 8.51 lakh crore as against the revised estimate (RE) of Rs 6.34 lakh crore for the entire year, which continues to remain the concern for the longer end of the yield curve.
The rupee rose earlier last month aided by intermittent gains in domestic equities and exporters’ dollar sales. However it was under pressure this month, tracking decline in the domestic equities after RBI retained a neutral stance while flagging inflation and fiscal risks. We expect rupee to trade range bound in the near term. Credit spread has started narrowing down post central bank decision of buying dollar/rupee swap amounting $5 billion in the three year tenor. This will further give liquidity boost to overall banking system and aid reducing short term borrowing cost. We continue to like accrual funds over gilt. Funds with average maturity of two to three years are well placed to relatively outperform other debt funds. Categorically, Short duration funds, Banking & PSU debt funds and ultra short term funds continue remain in the traction.
9 April 2019
Wealth Bulletin

2 Confidential & for Private Circulation only Elara Securities (India) Private Limited
Midcap Fervor

3 Confidential & for Private Circulation only Elara Securities (India) Private Limited
Midcap Fervor
Midcap continues to represent India’s growth story more powerfully than large caps. After posting a high in
Jan’18, midcaps underperformed large caps in 2018 and shed their four year streak of outperformance to large caps. YTD, the mid caps (-0.75%), continue to underperform the Nifty (5.5%), amidst concerns around global economic slowdown, decelerated domestic growth outlook for FY19 GDP and enhanced volatility ahead of general elections in May’19. We expect bouts of volatility to persist in the run up to General Election 2019 which should be capitalized as an incremental buying opportunity. We expect a revival in mid caps performance on the back of: (1) price and valuation comfort based on historical trends; (2) strong flows from FPIs and DIIs; and (3) strong earnings revival due to fall in commodity prices and spur in consumption.
1. Historical evidence on price support and valuations
Historical analysis of midcaps reveals that (a) there has never been two consecutive years of negative returns; and (b) the positive returns in the year after negative returns have always exceeded the negative returns. Based on this observation, we expect the return from midcaps to exceed 15% in CY’19 as against -15.3% in CY’18. The relative valuation of midcaps vs large caps are at a historically low level, both at an absolute level as well as on a rolling basis, with 7 DMAs at 2014 levels. With four year midcap – large cap premium practically wiped out, we now believe that valuations are reasonable to support midcap recovery.
Our “What’s in the price” proprietary framework also reinforces our view that midcaps are reasonably valued.
The Long Term Growth Value (LTGV – value attributable to earnings growth beyond the next 2 years) of 53% is lowest since FY’14. That said, the 30% (highest ever) Short Term Growth Value (STGV- value from earnings growth over the next 2 years) reflects optimism on earnings expansion.
Exhibit 1: Midcaps have not had two consecutive
years of negative returns so far…
Exhibit 2: …Midcaps trade at a discount to largecaps
Source: Bloomberg, Elara Securities Research Source: Bloomberg, Elara Securities Research
Midcap valuation discounts are at historical high levels…
The relative valuation of midcaps vs large caps are at a historically low level, both at an absolute level as well as on a
rolling basis, with 7 DMAs at 2014 levels. Now that the four year midcap – large cap premium has been practically
wiped out, we now believe that valuations are reasonable and a midcap recovery is in the offing.
28.2
76.9
(59.4)
99.0
19.2
(31.0)
39.2
(4.6)
56.3
7.6 8.1
47.1
(15.3) (0.4)
(90)
(60)
(30)
0
30
60
90
120
FY
06
FY
07
FY
08
FY
09
FY
10
FY
11
FY
12
FY
13
FY
14
FY
15
FY
16
FY
17
FY
18
YT
D 2
01
9
(%)
Midcap Returns
(13.1)
22.0
(8.8)
22.2
0.8
(6.6)
10.5
(11.3)
24.9
11.5
5.2
19.6
(18.9)
(6.0)
(30)
(20)
(10)
0
10
20
30
FY
06
FY
07
FY
08
FY
09
FY
10
FY
11
FY
12
FY
13
FY
14
FY
15
FY
16
FY
17
FY
18
YT
D 2
01
9
(%)
Midcap Premium/Discount
(100)
(50)
0
50
100
150
Ma
r-0
6
Se
p-0
6
Ma
r-0
7
Se
p-0
7
Ma
r-0
8
Se
p-0
8
Ma
r-0
9
Se
p-0
9
Ma
r-1
0
Se
p-1
0
Ma
r-1
1
Se
p-1
1
Ma
r-1
2
Se
p-1
2
Ma
r-1
3
Se
p-1
3
Ma
r-1
4
Se
p-1
4
Ma
r-1
5
Se
p-1
5
Ma
r-1
6
Se
p-1
6
Ma
r-1
7
Se
p-1
7
Ma
r-1
8
Se
p-1
8
Ma
r-1
9
(%)
Mid-cap Prem/Disc to Large-cap Avg Avg +1 Std Avg -1 Std

4 Confidential & for Private Circulation only Elara Securities (India) Private Limited
2. Strong Institutional flows to support rally
We expect strong FPI flows in CY19 taking into cognizance (a) pause in Fed rate hikes which in effect weakens
the dollar index and makes EMs more attractive for FPI flows; (b) attractiveness of India relative to other EMs in a challenging global growth environment – India which is a consumption led economy is well placed unlike other EMs which export mainly to China; and (c) earnings recovery which is round the corner.
DII flows are also expected to be strong - though lump sum investments have decelerated, SIP flows continue to be strong at ~ INR 800 Bn. The strong market recovery and decline in interest rates makes equity markets more attractive from a lump sum flow perspective as well. Traditionally, FPIs have preferred large caps but the larger among the midcaps will increasingly grab FPI attention due to their market cap and better liquidity, in our view. 34 midcap stocks (daily turnover in excess of USD 10 mn) provide additional options to FPIs to invest.
Exhibit 3: Strong FPI flows since Feb’19 Exhibit 4: MF flows to turn positive
Source: Bloomberg, Elara Securities Research Source: Bloomberg, Elara Securities Research
3. Expectation for strong earnings recovery in midcaps
The Nifty midcap consensus EPS CAGR between FY19-21 is at 22.4%, which provides a strong fundamental
support, in our view. The Nifty Midcap100 EPS growth which incorporates for PSU bank earnings bounce back in FY’19, looks steep (YoY EPS growth of 97%) but on an ex-fin basis, FY’19 earnings growth stands at 25% and the FY19-21 earnings CAGR is expected to be around 12%.
Exhibit 5: Nifty Midcap 100 EPS growth strong Exhibit 6: Sharp increase in EPS expected in FY19
Source: Bloomberg, Elara Securities Research Source: Bloomberg, Elara Securities Research
(5,000)
(4,000)
(3,000)
(2,000)
(1,000)
0
1,000
2,000
3,000
Ja
n-1
8
Fe
b-1
8
Ma
r-1
8
Ap
r-1
8
Ma
y-1
8
Ju
ne
-18
Ju
ly-1
8
Au
g-1
8
Se
p-1
8
Oct-
18
No
v-1
8
De
c-1
8
Jan
-19
Fe
b-1
9
(USD
mn
)
FPI Equity flows
0
500
1,000
1,500
2,000
2,500
3,000
3,500
Ja
n-1
8
Fe
b-1
8
Ma
r-1
8
Ap
r-1
8
Ma
y-1
8
Ju
ne
-18
Ju
ly-1
8
Au
g-1
8
Se
p-1
8
Oct-
18
No
v-1
8
De
c-1
8
Jan
-19
Fe
b-1
9
(USD
mn
)
MF equity flows
0
200
400
600
800
1,000
1,200
1,400
FY18 FY19E FY20E FY21E
(IN
R)
0
5
10
15
20
25
30
FY19E FY20E FY21E
(%)

5 Confidential & for Private Circulation only Elara Securities (India) Private Limited
Midcap stock recommendations
In the current environment, we recommend: (1) Quality stocks that fulfill Elara Quality Portfolio-Midcap (EQP-M) criteria and (2) Beaten down midcap stocks with strong earnings visibility.
Quality Stocks We define quality stocks as those with a combination of high and consistent ROCE, increasing or stable operating Margin, free cash flow positive, low leverage and high revenue growth. We have used the below methodology
to draw up a list of mid-cap stocks from a universe of stocks with market capitalization rank of 100-250.
ROCE Score: To identify value creating companies, we screened for companies that have ROCE >15% in at
least 4 out of the last 5 years have been considered.
NOPAT Score: As a measure of pricing power, cost control and operating leverage, companies that showed
Increasing or stable trend in NOPAT margin have been considered. The tolerance for stability is set at 10%. For Example, if a company’s NOPAT margin is 10% in year 1, we expect that company’s margin to be greater than 10% in year 2 or at least not below 9%.
Leverage score: To identify companies that fund growth from internal accruals and low financial risk,
companies with net debt to equity ratio less than 1 in the latest FY have been scored.
Free cash flow yield: To analyze a company’s ability to generate free cash flows on the capital it employs, we
Identified companies with FCF yield that is positive in at least 4 out of the last 5 years.
Overall Score: Companies that score in each of the above 4 criteria have been considered for the final list.
Elara Rating
Bloomberg Rating
Market Cap (INR mn)
ROCE (%)
NOPAT (%)
Net Debt/Equity (x)
FCF/Capital employed (%)
Abbott India Not rated 4.3 1,56,308 36.6 10.9 -0.6 9.8
Astral Poly Accumulate 3.2 1,33,183 23.6 8.3 0.1 25.4
Avanti Feeds Not rated 5 55,650 87.6 13.5 -0.5 26.7
Bayer Crop Sci. Reduce 3.4 1,48,060 18.3 9.6 -0.2 3.7
Berger Paints Not rated 3.7 3,03,041 29.6 9 0 5.4
Cummins India Accumulate 3.5 2,06,708 15.5 13.7 -0.2 8.3
Endurance Tech. Not rated 3.6 1,61,769 23.9 6.2 0.1 11.5
Hexaware Tech. Not rated 3.7 1,01,740 34.1 11.5 -0.3 21.9
Indraprastha Gas Accumulate 4.3 2,13,570 31 14.6 -0.4 13.6
Kansai Nerolac Not rated 3.9 2,47,418 25.1 9.5 -0.3 0.5
L & T Infotech Buy 4.4 2,88,091 32.8 12.7 -0.4 23.5
L&T Technology Reduce 4.2 1,54,746 30.7 11.4 -0.2 20.5
Page Industries Not rated 3.5 2,62,632 68.2 13.6 -0.3 52.7
Sanofi India Accumulate 4.6 1,28,960 23.1 11.9 -0.4 20.1
Schaeffler India Not rated 3.9 89,810 20.1 10.4 -0.5 12.1
SKF India Not rated 4.4 1,00,024 21.1 9.6 -0.4 17.1
Solar Inds. Not rated 4.5 94,671 24.5 12.6 0.3 4.5
Symphony Not rated 3.1 90,612 43.9 19.9 -0.7 17.4
WABCO India Not rated 3.1 1,17,937 26.3 8.9 -0.5 24.5
Whirlpool India Not rated 3.3 1,97,628 30.9 5.3 -0.8 15.3
6 Confidential & for Private Circulation only Elara Securities (India) Private Limited
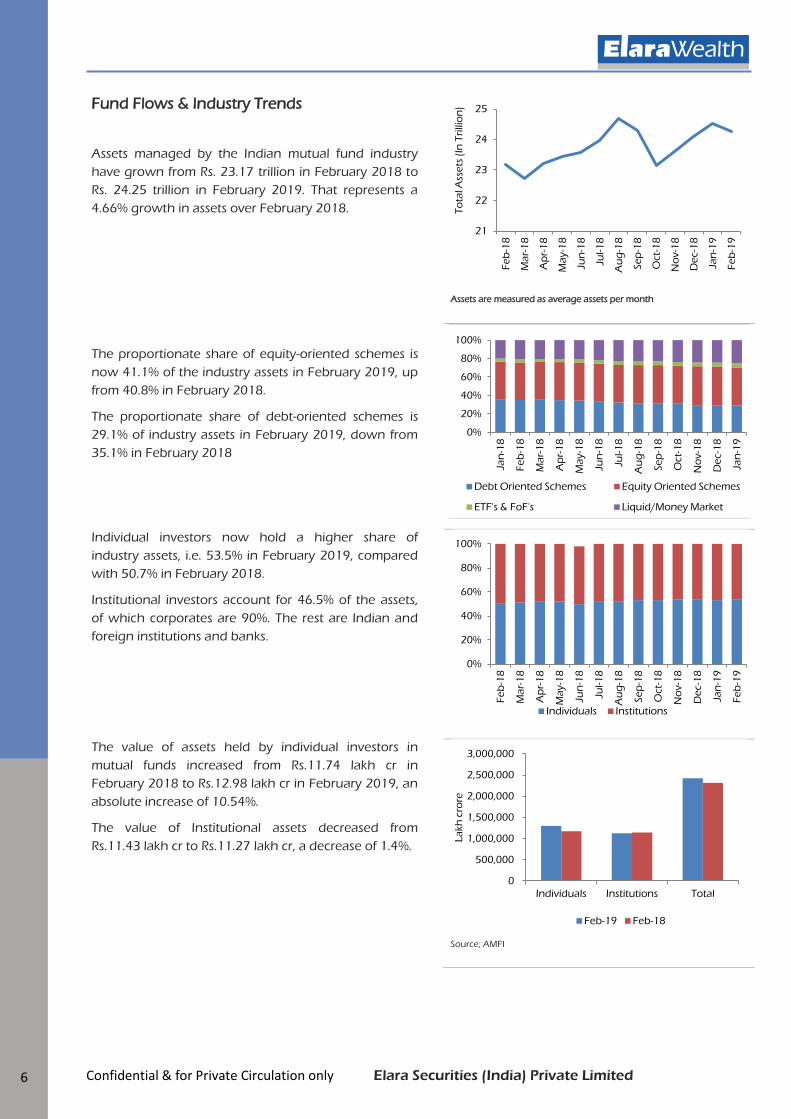
Fund Flows & Industry Trends
Assets managed by the Indian mutual fund industry
have grown from Rs. 23.17 trillion in February 2018 to
Rs. 24.25 trillion in February 2019. That represents a
4.66% growth in assets over February 2018.
Assets are measured as average assets per month
The proportionate share of equity-oriented schemes is
now 41.1% of the industry assets in February 2019, up
from 40.8% in February 2018.
The proportionate share of debt-oriented schemes is
29.1% of industry assets in February 2019, down from
35.1% in February 2018
Individual investors now hold a higher share of
industry assets, i.e. 53.5% in February 2019, compared
with 50.7% in February 2018.
Institutional investors account for 46.5% of the assets,
of which corporates are 90%. The rest are Indian and
foreign institutions and banks.
The value of assets held by individual investors in
mutual funds increased from Rs.11.74 lakh cr in
February 2018 to Rs.12.98 lakh cr in February 2019, an
absolute increase of 10.54%.
The value of Institutional assets decreased from
Rs.11.43 lakh cr to Rs.11.27 lakh cr, a decrease of 1.4%.
Source; AMFI
21
22
23
24
25
Fe
b-1
8
Ma
r-1
8
Ap
r-1
8
Ma
y-1
8
Jun
-18
Jul-1
8
Au
g-1
8
Se
p-1
8
Oct-
18
No
v-1
8
De
c-1
8
Jan
-19
Fe
b-1
9
To
tal A
sse
ts (
In T
rilli
on
)
0%
20%
40%
60%
80%
100%
Jan
-18
Fe
b-1
8
Ma
r-1
8
Ap
r-1
8
Ma
y-1
8
Jun
-18
Jul-1
8
Au
g-1
8
Se
p-1
8
Oct-
18
No
v-1
8
De
c-1
8
Jan
-19
Debt Oriented Schemes Equity Oriented Schemes
ETF's & FoF's Liquid/Money Market
0%
20%
40%
60%
80%
100%
Fe
b-1
8
Ma
r-1
8
Ap
r-1
8
Ma
y-1
8
Jun
-18
Jul-1
8
Au
g-1
8
Se
p-1
8
Oct-
18
No
v-1
8
De
c-1
8
Jan
-19
Fe
b-1
9
Individuals Institutions
0
500,000
1,000,000
1,500,000
2,000,000
2,500,000
3,000,000
Individuals Institutions Total
La
kh
cro
re
Feb-19 Feb-18

7 Confidential & for Private Circulation only Elara Securities (India) Private Limited
Global Markets Performance
Developed Markets
Country Ticker 3M 6M 1YR 3YR
US SPX Index 12.6 1.6 13.0 14.5
UK UKX Index 9.3 5.2 8.1 10.7
Singapore STI Index 5.6 5.6 -0.1 9.6
Japan NKY Index 7.5 -6.3 2.4 13.4
Hong-kong HSI Index 14.3 15.9 3.1 18.2
Germany Dax Index 9.8 -0.1 -2.4 7.5
Canada SPTSX Index 11.7 5.2 11.1 10.2
Australia AS51 Index 9.5 5.9 13.3 14.3
Italy FTSEMIB Index 14.0 9.2 -2.6 11.3
France CAC Index 14.0 3.5 7.3 11.9
Spain IBEX Index 7.7 3.9 1.0 8.1
Emerging Markets
Country Ticker 3M 6M 1YR 3YR
Malaysia FBM100 Index 1.7 -4.2 -6.9 2.6
Brazil IBOV Index 4.0 13.1 16.9 24.6
China SHSZ300 Index 32.1 23.7 7.9 10.8
Russia MXRU Index 9.6 9.7 22.1 18.4
Indonesia LQ45 Index 2.7 12.6 2.3 9.3
Taiwan TWSE Index 11.4 3.7 3.6 12.6
South korea KOSPI Index 7.5 0.2 -7.2 6.0
Thailand SET50 Index 4.5 -0.0 -2.2 11.5
Mexico MEXBOL Index 4.4 -5.5 -3.3 2.3
India Nifty Index 7.0 13.1 13.2 16.9
South Africa TOP40 Index 10.7 9.1 8.0 7.7

8 Confidential & for Private Circulation only Elara Securities (India) Private Limited
Disclaimer:
The contents of this report contain details of investment avenues/products of various Portfolio
Managers, Mutual Funds etc. Elara Wealth division of Elara Securities (India) Private Limited (hereinafter
referred to as “Elara”) is a distributor of various third party financial products offered by SEBI registered
intermediaries. The content is for information purposes only, and should not be construed as an offer
or solicitation of an offer for managing the portfolio of any client. The said report should not be
construed as a research report, references of any research, whether in-house of third party shall be
referred to and disclosed specifically in the report. It does not have regard to specific investment
objectives, financial situation and the particular needs of any specific person who may view the
contents of this e-mail or report contained herein. Clients should seek financial advice regarding the
appropriateness of investing in any securities or investment strategies that may have been discussed
and should understand that the views regarding future prospects may or may not be realized. Further,
the product offerings may not have been registered in any jurisdiction. No part of this publication may
be reproduced, stored in a retrieval system, or transmitted, in any form or by any means, electronic,
mechanical, photocopying, recording, or otherwise, without the prior written permission of Elara.
Risk Factors
Securities investments are subject to market risks and Elara provides no guarantee or assurance that
the objectives set out in the report / document shall be accomplished.
Stock prices, value of mutual fund units/portfolio value may increase or decrease depending upon
various market forces and factors affecting the capital markets such as de-listing of securities, market
closure, relatively small number of scrips accounting for large proportion of trading volume.
Past performances do not guarantee future performance.
Investment decisions made on behalf of the client by any of the SEBI registered intermediaries may not
always be profitable.
Investments are subject to risks arising from the investment objective, investment strategy and asset
allocation.
Macro-Economic risks: Overall economic slowdown, unanticipated corporate performance,
environmental or political problems, changes to monitory or fiscal policies, changes in government
policies and regulations with regard to industry and exports may have direct or indirect impact on the
investments.
Credit Risk: Debt securities are subject to the risk of the issuer’s inability to meet the principal and
interest payments on the obligations and may also be subject to the price volatility due to factors such
as interest sensitivity, market perception, or the credit worthiness of the issuer and general market risk.
Acts of State, or sovereign action, acts of nature, acts of war, civil disturbance are extraneous factors
which can impact your investments.
Mutual Fund Risk: This risk arises from investing in units of Mutual Funds. Risk factors inherent to
equities and debt securities are also applicable to investments in mutual fund units. Further, scheme
specific risk factors of each such underlying scheme, including performance of their underlying stocks,
derivatives instruments, stock lending, off-shore investments etc., will be applicable in the case of
investments in mutual fund units. In addition, events like change in fund manager of the scheme, take

9 Confidential & for Private Circulation only Elara Securities (India) Private Limited
over, mergers and other changes in status and constitution of mutual funds, foreclosure of schemes or
plans, change in government policies could affect performance of the investment in mutual fund units.
Prospective clients should review / study the Disclosure Document / Scheme Information Document /
Statement of Additional Information carefully and in its entirety and shall not construe the contents
hereof or regard the summaries contained herein as advice relating to legal, taxation, or financial /
investment matters and are advised to consult their own professional advisor(s) as to the legal, tax,
financial or any other requirements or restrictions relating to the subscription, gifting, acquisition,
holding, disposal (sale or conversion into money) of Portfolio and to the treatment of income (if any),
capitalisation, capital gains, any distribution, and other tax consequences relevant to their Portfolio,
acquisition, holding, capitalisation, disposal (sale, transfer or conversion into money) of Portfolio within
their jurisdiction of nationality, residence, incorporation, domicile etc. or under the laws of any
jurisdiction to which they or any managed funds to be used to purchase/gift portfolio of securities are
subject, and also to determine possible legal, tax, financial or other consequences of subscribing /
gifting, purchasing or holding portfolio of securities before making an investment.
Elara is neither responsible nor liable for any losses resulting from distribution of third party financial
products.
Clients are not being offered any guarantee / assured returns.
The Client has perused and understood the disclosures made by the Portfolio Manager in the
Disclosure Document / Scheme Information Document / Statement of Additional Information issued by
Mutual Funds (SAI).
Changes in Applicable Law may impact the value of investments.
Elara (including its associates / group entities) and any of its Directors, Employees, Officers, Agents shall
not be liable for any losses, damages whether direct or indirect, incidental, punitive, special or
consequential including lost revenue or lost profits that may arise from or in connection with the use of
the information provided herein.
Elara does not guarantee or warrant that the information / explanation is accurate, complete or
current.
Investments in securities are subject to market risks. Please read the Disclosure Document / Offer
Document / Scheme Information Document / Statement of Additional Information carefully and risk
factors before investing.

10 Confidential & for Private Circulation only Elara Securities (India) Private Limited
ELARA WEALTH
Registered Office; Mumbai Elara Securities (India) Private Limited (CIN: U74992MH2007PTC172297) Indiabulls Finance Centre| Tower 3 | 21st Floor |
Senapati Bapat Marg | Elphinstone Road West | Mumbai-400 013 | INDIA | Telephone: +912261648500
Branch Office; Ahmedabad Elara Securities (India) Private Limited (CIN: U74992MH2007PTC172297) Shapath V | 1310, 13th Floor, Opposite
Karnavati Club I S. G. Road | Ahmedabad-380 051| Gujarat, INDIA |Telephone: +91 79 6616 8104

11 Confidential & for Private Circulation only Elara Securities (India) Private Limited

12 Confidential & for Private Circulation only Elara Securities (India) Private Limited
![[XLS] · Web viewManorama V Solanki Geeta G Vaniya Girishbhai Vaniya Dropadi A Solanki Amishbhai Solanki Apexa M Solanki Mheshbhai Solanki Nileshvari J Swami Jigneshbhai Swami Puja](https://static.fdocuments.us/doc/165x107/5ab72b9a7f8b9ac60e8b49fb/xls-viewmanorama-v-solanki-geeta-g-vaniya-girishbhai-vaniya-dropadi-a-solanki.jpg)