
8th GRADE BENCHMARK TEST Files/Downloads/Frameworks/Secondary... · MATHEMATICS 8th GRADE BENCHMARK...
12
MATHEMATICS 8 th GRADE BENCHMARK TEST Third Testing Period March 3-7, 2003 8 th Grade Benchmark Test Third Testing Period—March 3-7, 2003 190
Transcript of 8th GRADE BENCHMARK TEST Files/Downloads/Frameworks/Secondary... · MATHEMATICS 8th GRADE BENCHMARK...

MATHEMATICS
8th GRADE
BENCHMARK TEST
Third Testing Period March 3-7, 2003
8th Grade Benchmark Test Third Testing Period—March 3-7, 2003
190
Continued on next page
8th Grade Benchmark Test Third Testing Period—March 3-7, 2003
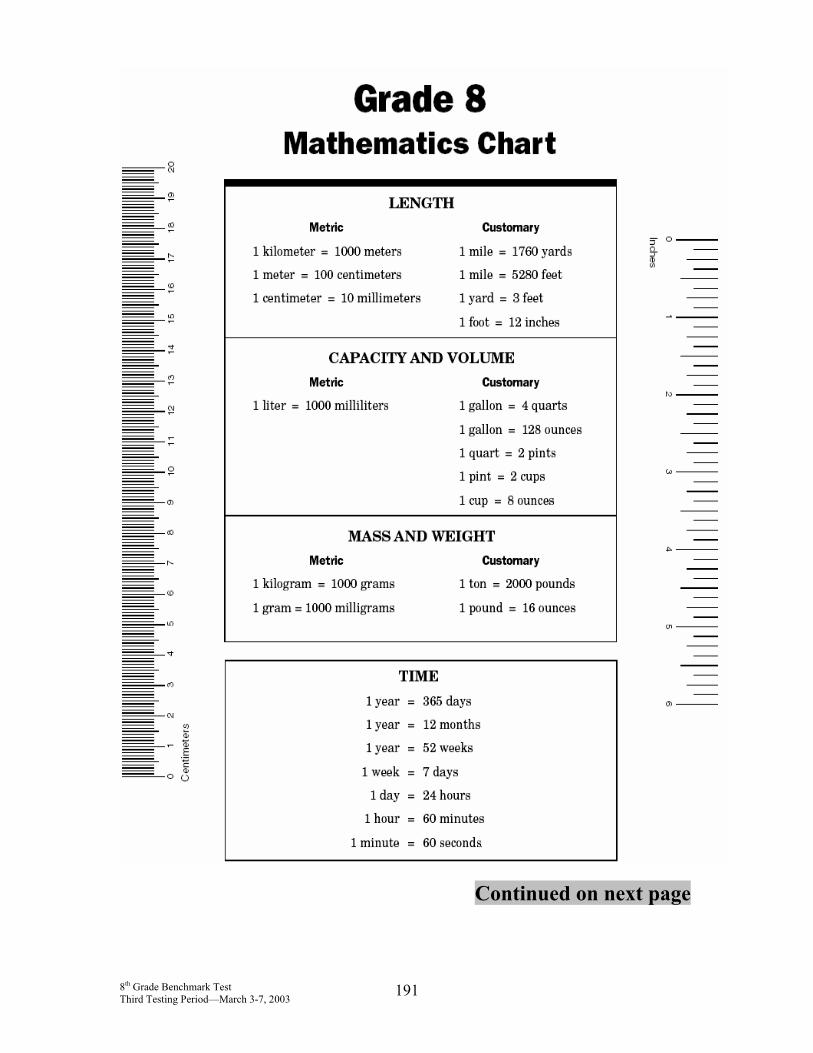
191
8th Grade Benchmark Test Third Testing Period—March 3-7, 2003
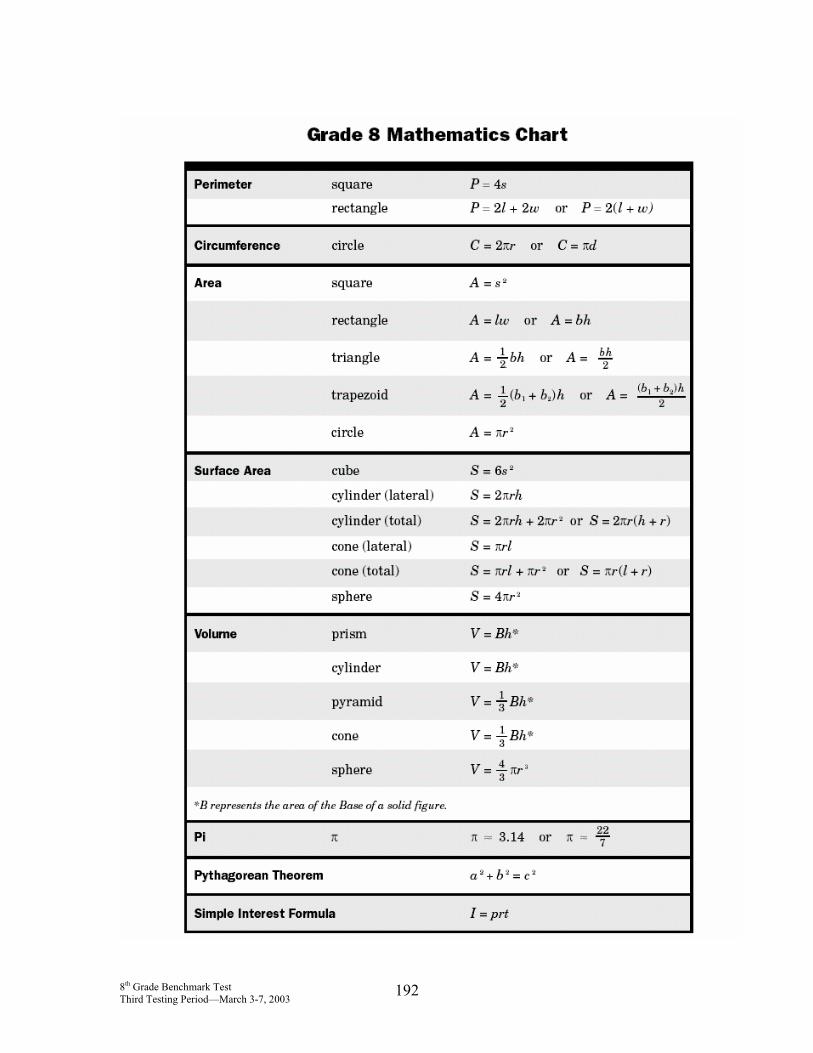
192
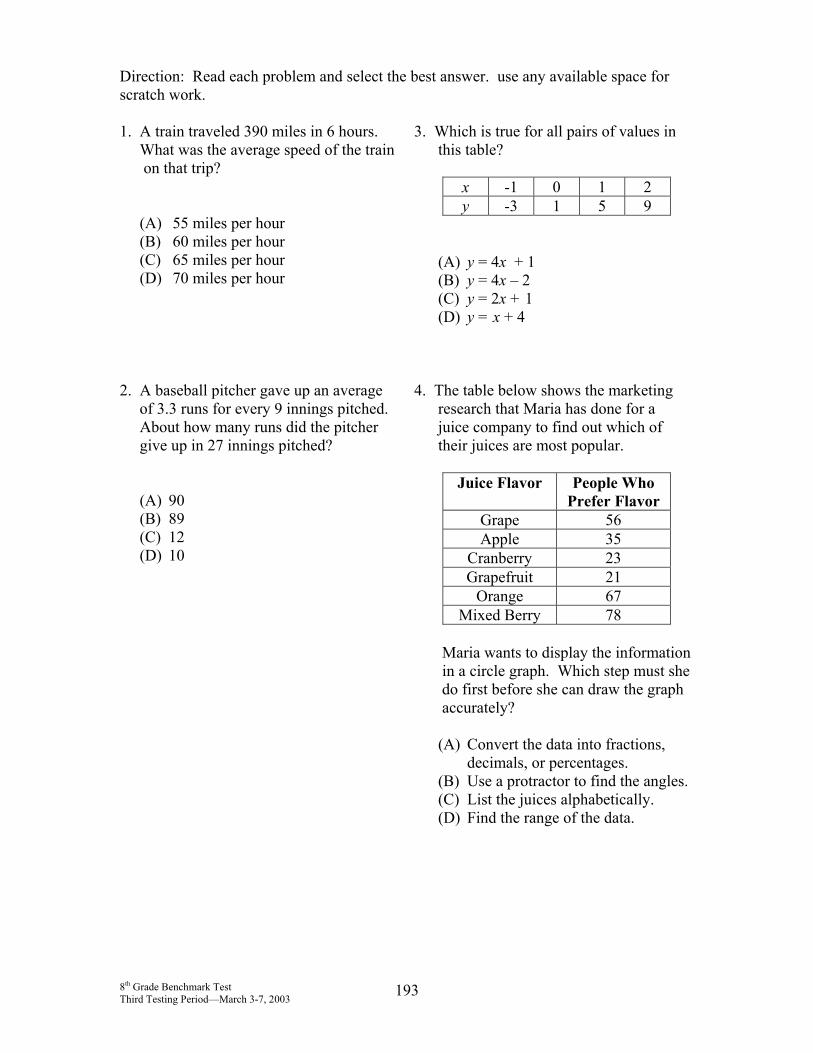
Direction: Read each problem and select the best answer. use any available space for scratch work. 1. A train traveled 390 miles in 6 hours. What was the average speed of the train on that trip?
(A) 55 miles per hour (B) 60 miles per hour (C) 65 miles per hour (D) 70 miles per hour
3. Which is true for all pairs of values in this table?
x -1 0 1 2 y -3 1 5 9
(A) y = 4x + 1 (B) y = 4x – 2 (C) y = 2x + 1 (D) y = x + 4
2. A baseball pitcher gave up an average of 3.3 runs for every 9 innings pitched. About how many runs did the pitcher give up in 27 innings pitched?
(A) 90 (B) 89 (C) 12 (D) 10
4. The table below shows the marketing research that Maria has done for a juice company to find out which of their juices are most popular.
Juice Flavor People Who Prefer Flavor
Grape 56 Apple 35
Cranberry 23 Grapefruit 21
Orange 67 Mixed Berry 78
Maria wants to display the information in a circle graph. Which step must she do first before she can draw the graph accurately?
(A) Convert the data into fractions, decimals, or percentages.
(B) Use a protractor to find the angles. (C) List the juices alphabetically. (D) Find the range of the data.
8th Grade Benchmark Test Third Testing Period—March 3-7, 2003
193
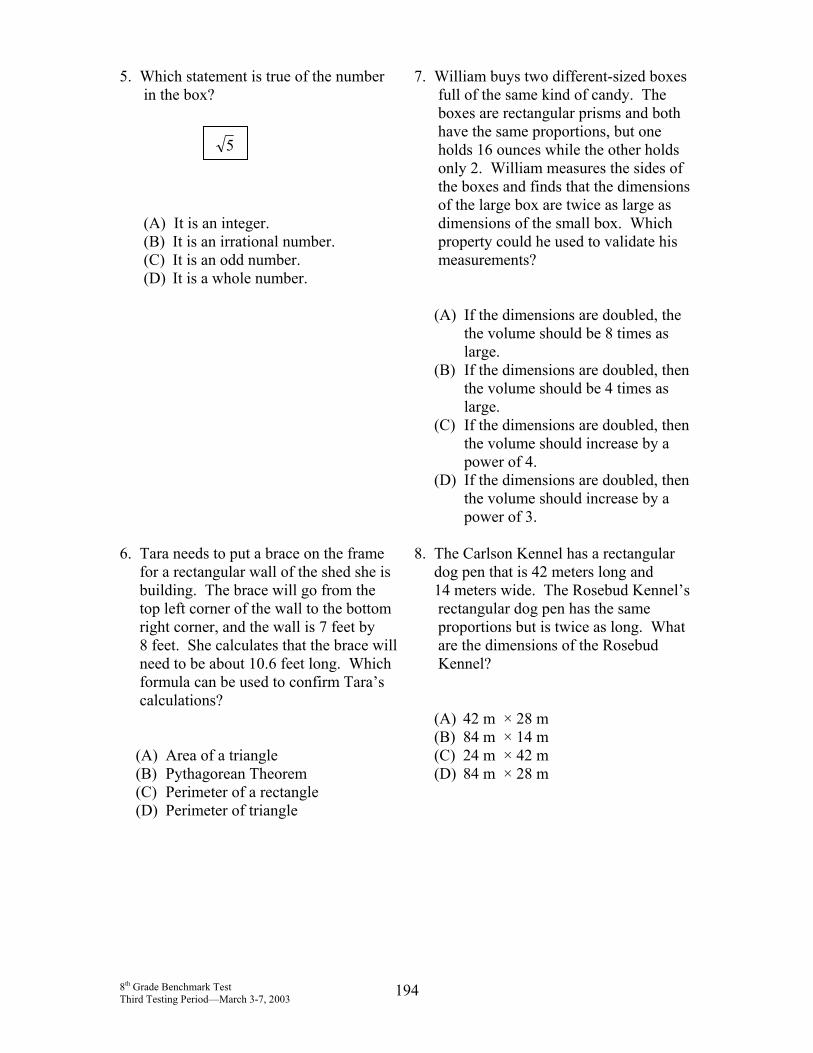
5. Which statement is true of the number in the box? (A) It is a
(B) It is a(C) It is a(D) It is a
7. William buys two different-sized boxes full of the same kind of candy. The boxes are rectangular prisms and both have the same proportions, but one
6. Tara needs for a rectan building. top left cor right corne 8 feet. She need to be formula ca calculation
(A) Area o(B) Pythag(C) Perime(D) Perime
5
8th Grade BenchmarThird Testing Period
n integer. n irrational number. n odd number. whole number.
holds 16 ounces while the other holds only 2. William measures the sides of the boxes and finds that the dimensions of the large box are twice as large as dimensions of the small box. Which property could he used to validate his measurements?
(A) If the dimensions are doubled, the the volume should be 8 times as large.
(B) If the dimensions are doubled, then the volume should be 4 times as large.
(C) If the dimensions are doubled, then the volume should increase by a power of 4.
(D) If the dimensions are doubled, then the volume should increase by a power of 3.
to put a brace on the frame gular wall of the shed she is
The brace will go from the ner of the wall to the bottom r, and the wall is 7 feet by calculates that the brace will
about 10.6 feet long. Which n be used to confirm Tara’s s?
f a triangle orean Theorem ter of a rectangle ter of triangle
8. The Carlson Kennel has a rectangular dog pen that is 42 meters long and 14 meters wide. The Rosebud Kennel’s rectangular dog pen has the same proportions but is twice as long. What are the dimensions of the Rosebud Kennel?
(A) 42 m × 28 m (B) 84 m × 14 m (C) 24 m × 42 m (D) 84 m × 28 m
k Test —March 3-7, 2003
194
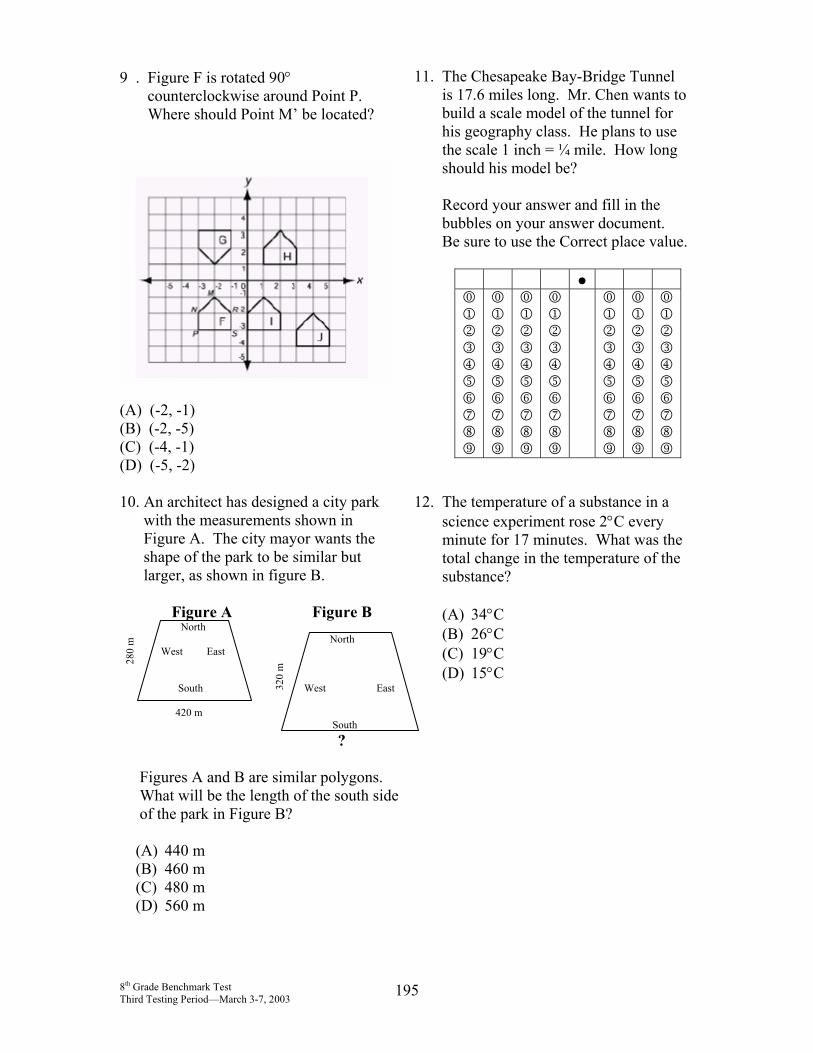
9 . Figure F is rotated 90° counterclockwise around Point P. Where should Point M’ be located?
(A) (-2, -1) (B) (-2, -5) (C) (-4, -1) (D) (-5, -2)
11. The Chesapeake Bay-Bridge Tunnel is 17.6 miles long. Mr. Chen wants to build a scale model of the tunnel for his geography class. He plans to use the scale 1 inch = ¼ mile. How long should his model be? Record your answer and fill in the bubbles on your answer document. Be sure to use the Correct place value.
● 0123456789
0123456789
0123456789
0123456789
0 1 2 3 4 5 6 7 8 9
0 1 2 3 4 5 6 7 8 9
0123456789
10. An architect has designed a city park with the measurements shown in Figure A. The city mayor wants the shape of the park to be similar but larger, as shown in figure B. Figure A Figure B North West East
North
South West East 420 m South ? Figures A and B are similar polygons. What will be the length of the south side of the park in Figure B?
(A) 440 m (B) 460 m (C) 480 m (D) 560 m
12. The temperature of a substance in a science experiment rose 2°C every minute for 17 minutes. What was the total change in the temperature of the substance?
(A) 34°C (B) 26°C (C) 19°C (D) 15°C
280
m
320
m
8th Grade Benchmark Test Third Testing Period—March 3-7, 2003
195
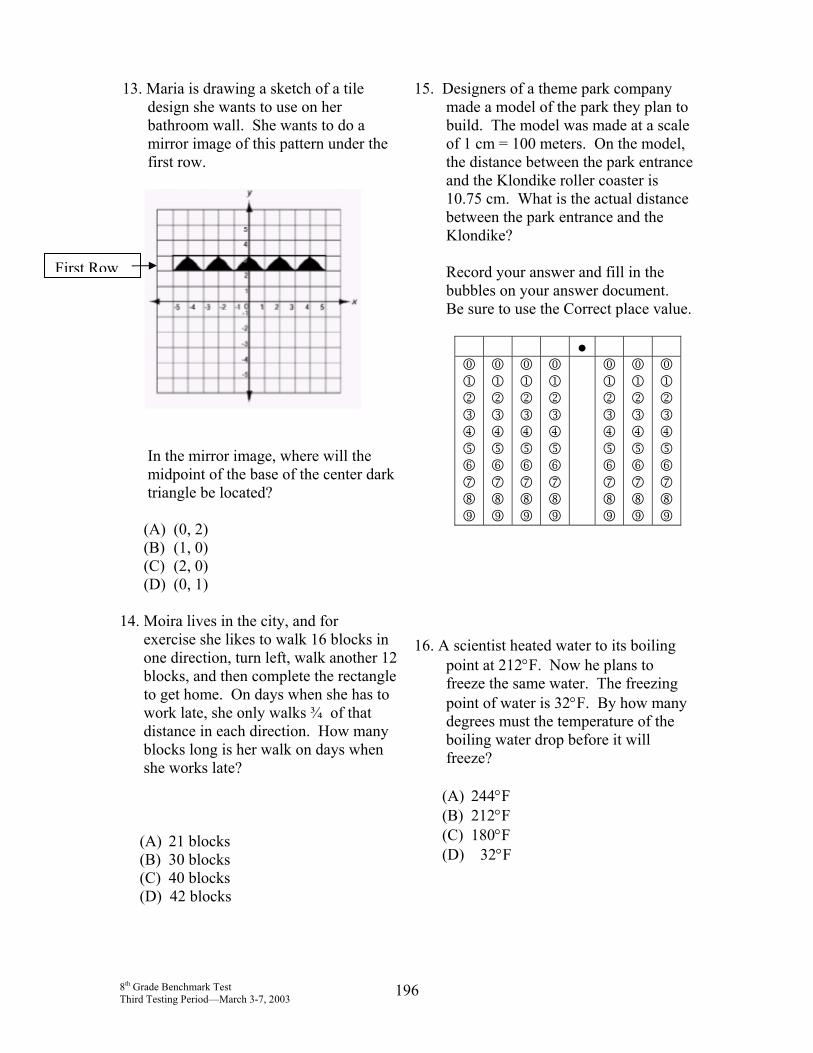
13. Maria is drawing a sketch of a tile design she wants to use on her bathroom wall. She wants to do a mirror image of this pattern under the first row.
15. Designers of a theme park company made a model of the park they plan to build. The model was made at a scale of 1 cm = 100 meters. On the model, the distance between the park entrance and the Klondike roller coaster is 10.75 cm. What is the actual distance between the park entrance and the Klondike? Record your answer and fill in the
First RowIn the mirror image, where will the midpoint of the base of the center dark triangle be located?
(A) (0, 2) (B) (1, 0) (C) (2, 0) (D) (0, 1)
bubbles on your answer document. Be sure to use the Correct place value.
● 0123456789
0123456789
0123456789
0123456789
0 1 2 3 4 5 6 7 8 9
0 1 2 3 4 5 6 7 8 9
0123456789
14. Moira lives in the city, and for exercise she likes to walk 16 blocks in one direction, turn left, walk another 12 blocks, and then complete the rectangle to get home. On days when she has to work late, she only walks ¾ of that distance in each direction. How many blocks long is her walk on days when she works late?
(A) 21 blocks (B) 30 blocks (C) 40 blocks
(D) 42 blocks
16. A scientist heated water to its boiling point at 212°F. Now he plans to freeze the same water. The freezing point of water is 32°F. By how many degrees must the temperature of the boiling water drop before it will freeze?
(A) 244°F (B) 212°F (C) 180°F
(D) 32°F
8th Grade Benchmark Test Third Testing Period—March 3-7, 2003
196
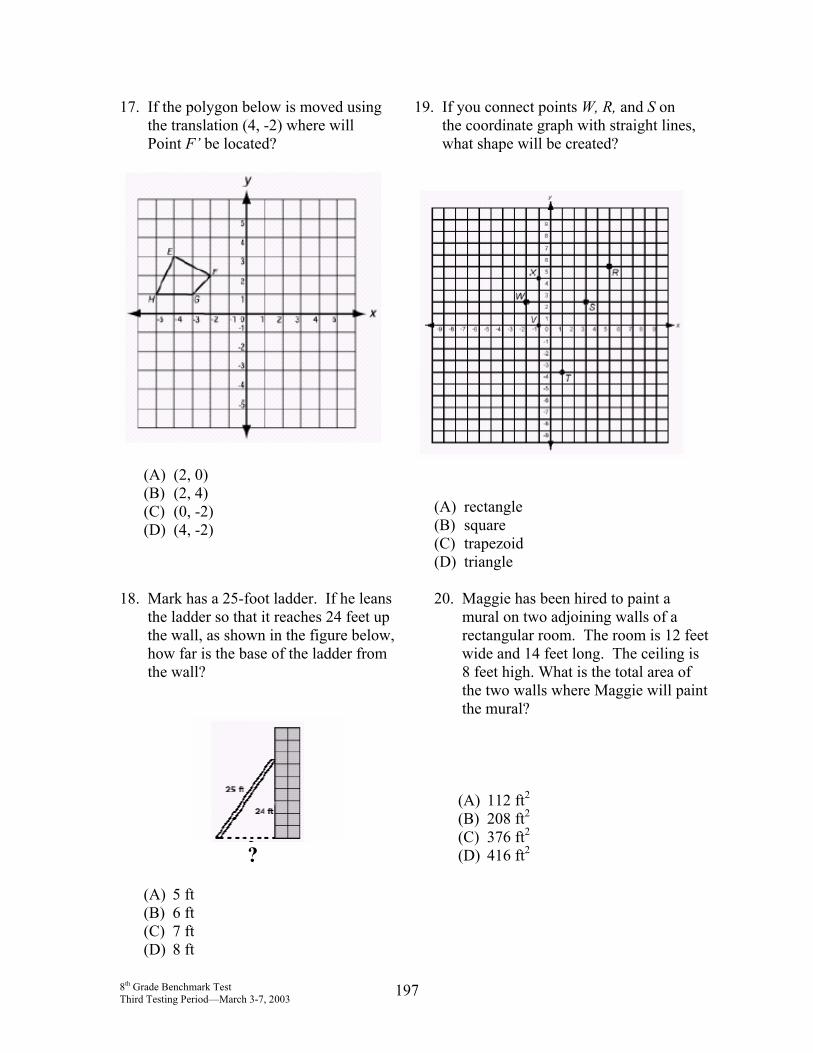
17. If the polygon below is moved using the translation (4, -2) where will Point F’ be located?
(A) (2, 0) (B) (2, 4) (C) (0, -2) (D) (4, -2)
19. If you connect points W, R, and S on the coordinate graph with straight lines, what shape will be created?
(A) rectangle (B) square (C) trapezoid (D) triangle
18. Mark has a 25-foot ladder. If he leans the ladder so that it reaches 24 feet up the wall, as shown in the figure below, how far is the base of the ladder from the wall?
?
(A) 5 ft (B) 6 ft (C) 7 ft (D) 8 ft
20. Maggie has been hired to paint a mural on two adjoining walls of a rectangular room. The room is 12 feet wide and 14 feet long. The ceiling is 8 feet high. What is the total area of the two walls where Maggie will paint the mural?
(A) 112 ft2 (B) 208 ft2 (C) 376 ft2 (D) 416 ft2
8th Grade Benchmark Test Third Testing Period—March 3-7, 2003
197
21. The table below shows the number of bathing suits sold each month at a department store.
Month Bathing Suits Sold
January 15 February 69 March 73 April 123 May 145 June 177
Maria is in charge of ordering clothing for the department store. She uses the table to find the average number of swimming suits sold per month for January to June was 97 suits a month. She predicts that she will probably sell about 100 swimming suits in July. Which is the best explanation for why her prediction might NOT be valid?
(A) She should have rounded 97 down to 95 because that is the closer multiple of 5.
(B) It is impossible to predict sales of items such as swimming suits.
(C) She did not find the average correctly. (D) Swimming suits are a seasonal item and
she has used both colder months and warmer months to find the average.
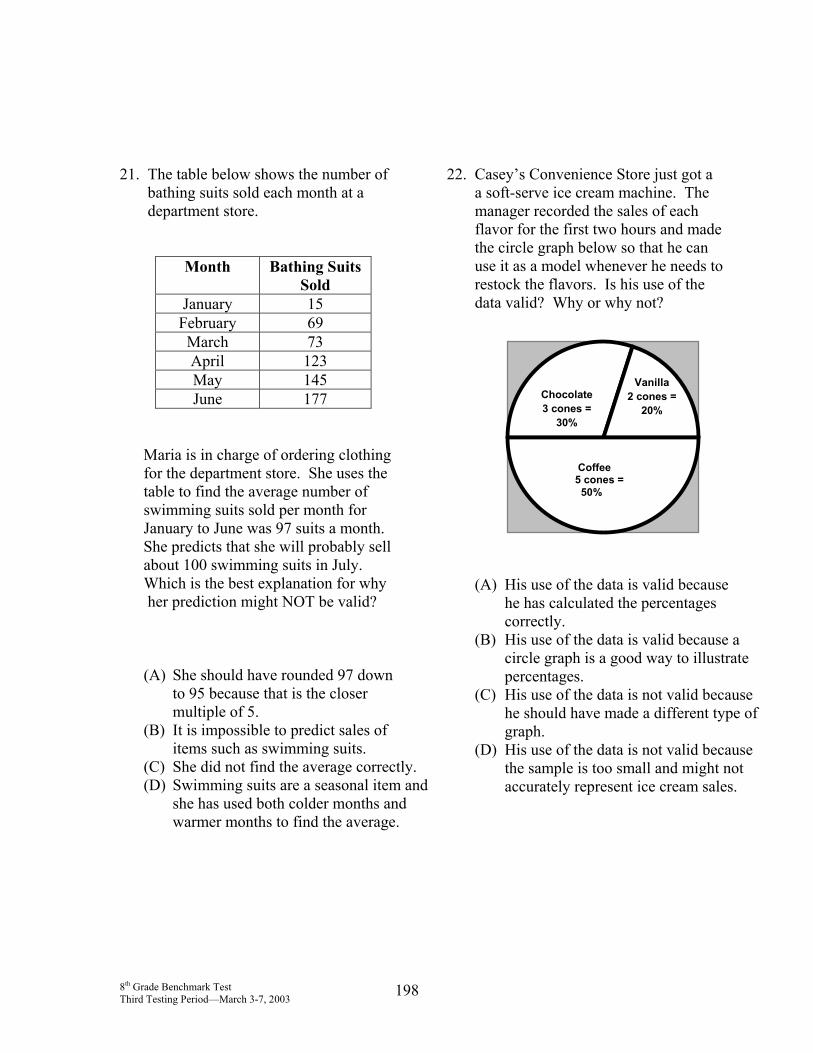
22. Casey’s Convenience Store just got a a soft-serve ice cream machine. The manager recorded the sales of each flavor for the first two hours and made the circle graph below so that he can use it as a model whenever he needs to restock the flavors. Is his use of the data valid? Why or why not?
Vanilla2 cones =
20%Chocolate3 cones =
30%
(A) His use of the data is valid because he has calculated the percentages correctly.
(B) His use of the data is valid because a circle graph is a good way to illustrate percentages.
(C) His use of the data is not valid because he should have made a different type of graph.
(D) His use of the data is not valid because the sample is too small and might not accurately represent ice cream sales.
Coffee 5 cones = 50%
8th Grade Benchmark Test Third Testing Period—March 3-7, 2003
198
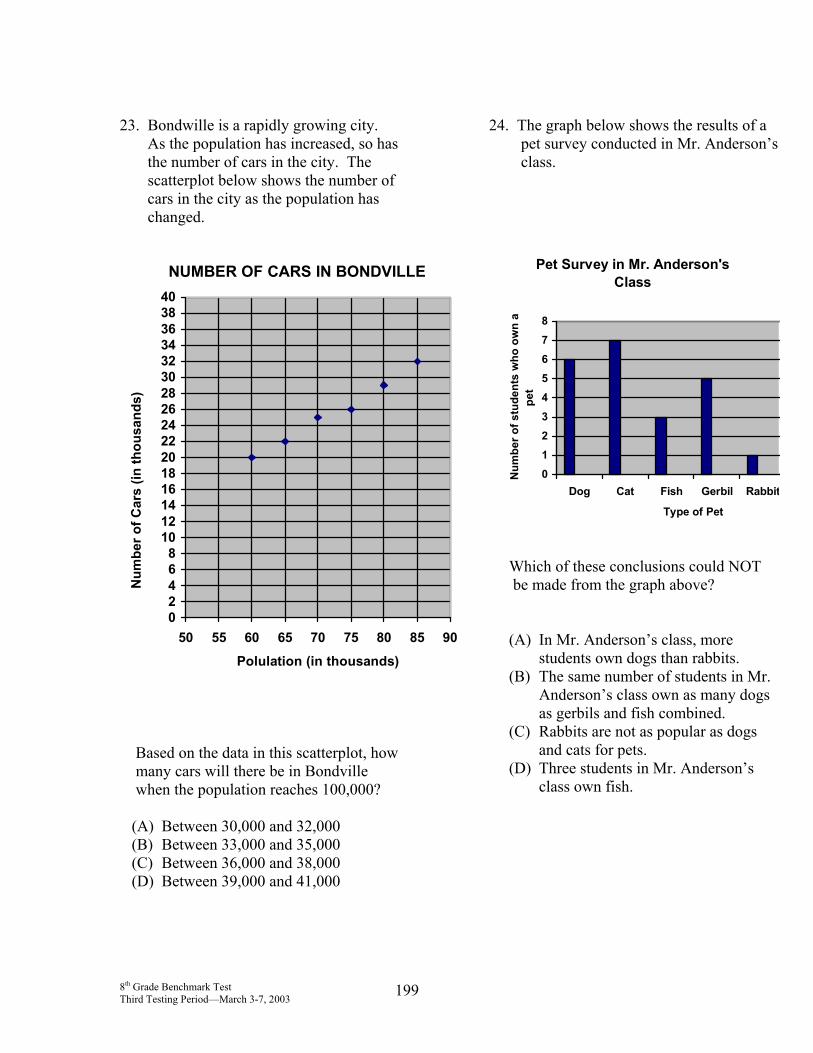
23. Bondwille is a rapidly growing city. As the population has increased, so has the number of cars in the city. The scatterplot below shows the number of cars in the city as the population has changed.
NUMBER OF CARS IN BONDVILLE
02468
10121416182022242628303234363840
50 55 60 65 70 75 80 85 90
Polulation (in thousands)
Num
ber o
f Car
s (in
thou
sand
s)
Based on the data in this scatterplot, how many cars will there be in Bondville when the population reaches 100,000?
(A) Between 30,000 and 32,000 (B) Between 33,000 and 35,000 (C) Between 36,000 and 38,000 (D) Between 39,000 and 41,000
24. The graph below shows the results of a pet survey conducted in Mr. Anderson’s class.
Pet Survey in Mr. Anderson's Class
012345678
Dog Cat Fish Gerbil Rabbit
Type of PetN
umbe
r of s
tude
nts
who
ow
n a
pet
Which of these conclusions could NOT be made from the graph above?
(A) In Mr. Anderson’s class, more students own dogs than rabbits.
(B) The same number of students in Mr. Anderson’s class own as many dogs as gerbils and fish combined.
(C) Rabbits are not as popular as dogs and cats for pets.
(D) Three students in Mr. Anderson’s class own fish.
8th Grade Benchmark Test Third Testing Period—March 3-7, 2003
199
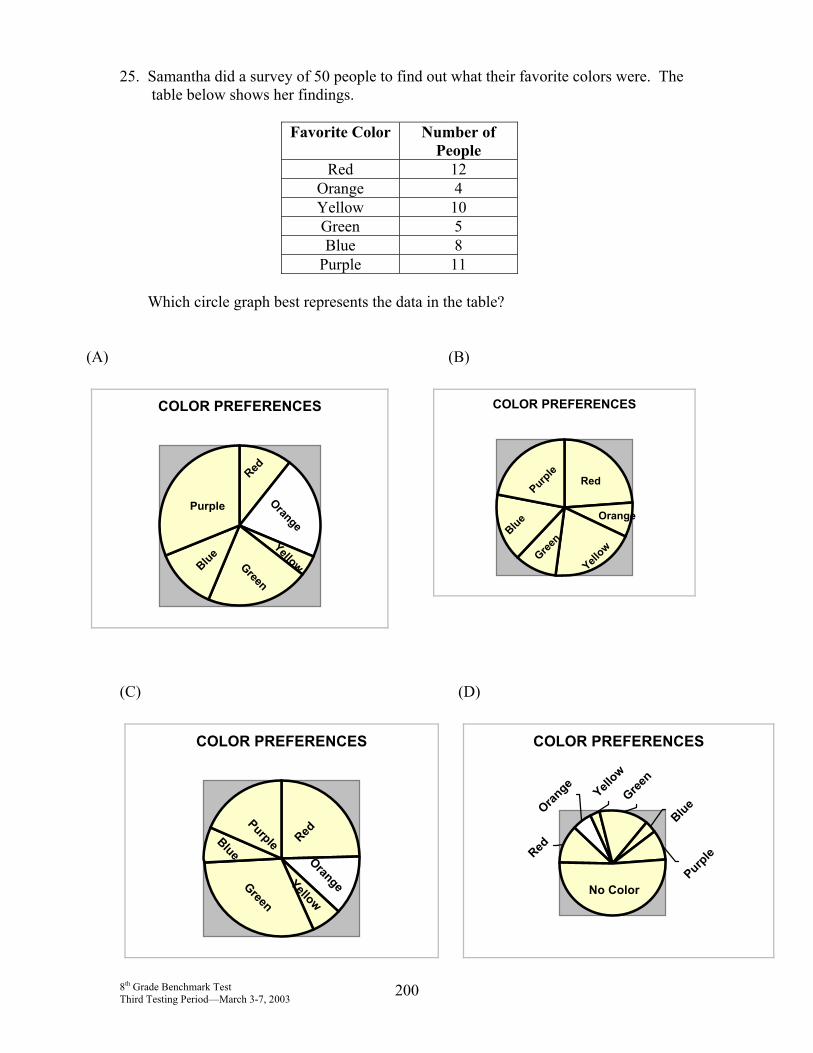
25. Samantha did a survey of 50 people to find out what their favorite colors were. The table below shows her findings.
Favorite Color Number of People
Red 12 Orange 4 Yellow 10 Green 5 Blue 8
Purple 11 Which circle graph best represents the data in the table?
(A)
COLOR PREFERENCES
Purple
BlueGreen
Yellow
Orange
Red
(B)
COLOR PREFERENCES
Purple
Blue
Green
Yellow
Orange
Red
8th
(C)
COLOR PREFERENCES
PurpleBlue
Green
Yellow
Orange
Red
(D)
COLOR PREFERENCES
No ColorPurp
le
BlueGree
nYell
ow
Orange
Red
Grade Benchmark Test Third Testing Period—March 3-7, 2003
200
END OF EXAMINATION
8th Grade Benchmark Test Third Testing Period—March 3-7, 2003
201