893 NUCLEAR HARDNESS SIMULATION AND ANALYSIS OF …ad-ai74 893 nuclear hardness simulation and...
86
AD-Ai74 893 NUCLEAR HARDNESS SIMULATION AND ANALYSIS OF COMPOSITE Uti AIRCRAFT STRUCTURES (U) GENERAL RESEARCH CORP SANTA BARBARA CA W F ADLER It DEC 85 GRC-CR-85-148 UNCLASSIFIED DNA-TR-86-i32-V2 DNA88I-82-C-8245 F/G 11/4 .mlhElilElhiE llflllllllllll EhhhlhEEEElhEE EIIIEEIIIIIIIl EllllllI~EEI mh/hEE/h/hhhEI 'K
Transcript of 893 NUCLEAR HARDNESS SIMULATION AND ANALYSIS OF …ad-ai74 893 nuclear hardness simulation and...

AD-Ai74 893 NUCLEAR HARDNESS SIMULATION AND ANALYSIS OF COMPOSITE UtiAIRCRAFT STRUCTURES (U) GENERAL RESEARCH CORP SANTABARBARA CA W F ADLER It DEC 85 GRC-CR-85-148
UNCLASSIFIED DNA-TR-86-i32-V2 DNA88I-82-C-8245 F/G 11/4.mlhElilElhiEllflllllllllllEhhhlhEEEElhEEEIIIEEIIIIIIIlEllllllI~EEImh/hEE/h/hhhEI'K

111111.0 m 5116
11111.!.2
MICROCOPY RESOLUTION TEST CHART
% op '.
Vk

iAD-A174 893DNA-TR-86-132-V2
NUCLEAR HARDNESS SIMULATION AND ANALYSISOF COMPOSITE AIRCRAFT STRUCTURESVolume II-Dust Erosion Assessment
4
W. F. AdlerGeneral Research CorporationSanta Barbara DivisionP. 0. Box 6770Santa Barbara, CA 93160-6770
31 December 1985
Technical Report
CONTRACT No. DNA 001-82-C-0245
Approved for public release;distribution is unlimited.
THIS WORK WAS SPONSORED BY THE DEFENSE NUCLEAR AGENCYUNDER RDT&E RMSS CODE B342083466 N99QAXAJO0029 H2590D.
DTICo Prepared for n-DEC9 986
Director_ DEFENSE NUCLEAR AGENCY AI
Washington, DC 20305-1000 B
86 12 09 1 J

DISTRIBUTION LIST UPDATE
This mailer is provided to enable DNA to maintain current distribution lists for reports. We wouldappreciate your providing the requested information.
D Add the individual listed to your distribution list.
E: Delete the cited organization/individual.
E Change of address.
NAME.
ORGANIZATION:_____________________________
4OLD ADDRESS CURRENT ADDRESS
TELEPHONE NUMBER: ()
SUBJECT AREA(s) OF INTEREST:
DNA OR OTHER GOVERNMENT CONTRACT NUMBER:__________________________________
CERTIFICATION OF NEED-TO-KNOW BY 'GOVERNMENT SPONSOR (if other than DNA):
SPONSORING ORGANIZATION:______________________
CONTRACTING OFFICER OR REPRESENTATIVE: _________________
SIGNATURE: _______________________________
* %

DirectorDefense Nuclear AgencyATTN: STTIWashington, DC 20305-1000
a DirectorDefense Nuclear AgencyATTN: STTIWashington, DC 20305-1000
%..................................

UNCLASSIFIED-'S 5CRTv ASSIF:CAiON Or - 5 -IA~c A - 07 Y P?-
REPORT DOCUMENTATION PAGEI& REPORT SiC.LRITY CLASSIFICATION lb RESTRICTIVE MARKINGS
UNCLASSIFIED ______ _________________
2.. SECURITY CLASSLWCATION AUTHORITY 3 DISTRIBUTION/,.#AILASIUTY OF REPORT*N/A since UNCLASSIFIED Approved for public release;
2b. OECLASSIFICATIONi DOWNGRAIN4G SCHEDULE distribution is unlimited.N/A sinceUNCLASSIFIED _______________________
4. PERFORMING ORGANIZATION REPORT NUMBER(S) S. MONITORING ORGANIZATION REPORT NUMBER(S)
*CR-85-1408 DNA-TR-86-132-V2
6.. NAME OF PERFORMING ORGANIZATION4 Sb OFFICE SYMBOL 7a. NAME OF MONITORING ORGANIZATIONGeneral Research Corporation Oif JDIDC3klblu) DirectorSanta Barbara Division j________ Defense Nuclear Agency
5c. ADDRESS (City, State, and ZIP Cod*) 7b. ADDRESS (CIMy Stat. and ZIP Code)P. 0. Box 6770 Washington, DC 20305-1000Santa Barbara, CA 93160-6770
S.. NAME OF FUNDING iSPONSORING Sb. OFFICE SYMBOL 9. PROCUREMENT I INSTRUMENT IDENTIFICATION NUMBER
ORGAIZAIONIlf ppkNS) DNA 001-82-C-0245
8c. ADDORESS (City, State, and ZIP Code) 10. SOURCE Of FUNDING NUMBERSPROGRAM PROJECT- TASK ~ WORK UNITELEMENT NO. NO. I NO. ACCESSION NO.62715H N99QAXA J DH006197
1;'iTLE (Infliuaf Security Clan.,"Cjtion)
NUCLEAR HARDNESS SIMULATION AND AN'.LYSIS OF COMPOSVITE AIRCRAFT SIRUCTURESVolume Il-Dust Erosion Assessment-
12. PERSONAL AUTHOR(S)
Adler, W. F.3a. TYPE OF REPORT 13b. TIME COVERED 14. DATE OF REPORT (Yea. PMorith Day) 5 PAGE COUNTTechnical ro 2§QT LU 5218
16 SLPOLEMENTARY NOTATIONThis work was sponsored by the Defense Nuclear Agency under RDT&E R 4SSCode B342083466 N99QAXAJ00029 H2590D.
11 1 1. 1ARain Erosion: - Mass toss.13 1 13 1 Erosion Modelin2.
9 '~aS-;AC-',Continue On reveS* d necessary milldedntift by block n~umber)
This second volume of a two-volume reporit-assesses the state of dust erosion data forcomposite materials. A survey of the solid particle erosion literature revealed that someexperimental data is available for polymeric materials and fiber-reinforced, non-metalliccomposites. Although not directly applicable to the specific compositions currently of
N interest, the available data is used to provide initial insights into the magnitude of the%I erosion problems which may exist for advanced composite materials on aircraft flying through
nuclear-generated dust. Using published erosion data, the..possibility exists for a signif-icant amount of material removal to occur. Additional investigations are suggested toprovide a more relevant estimate of the magnitude of the dust erosion problem. The reportalso discusses available test facilities and their capabilities and presents an extensivebibliography of relevant literature.,
DO FORM 1473, 34 MAAR 33 APR eltiori may oCieseainl .oraui@d SECURITY CLASSIFICATION OF -wS -1AGE
All ote eiton are osolete. UNCLASS IFIED

UNCLASSIFIED
SeCUN8?V C6ASSIVICATOM6 OF ?MIS 0404
r~
UNCLASSIFIED
ii StLCURIl' CLASSI FICArO T101 09~ DAZE
K.; ~ ~ . *.w ~ ~ -. ,: *.~.-. v..%

PREFACE
The program supported under this contract consisted of the
evaluation of emerging advanced composite materials for aircraft exposed
to nuclear induced environments. The evaluation focused on two critical
nuclear response characteristics: (1) thermal flash and (2) particulate
(dust) erosion. Evolving composite materials for aircraft application
were identified and various damage response mechanisms postulated.
Materials were fabricated and various composite materials were evaluated
analytically and experimentally in thermal and erosive nulcear generated
environments. The results of these analyses are presented in two
separate volumes under the single title NUCLEAR HARDNESS SIMULATION AND
ANALYSIS OF COMPOSITE AIRCRAFT STRUCTURES, Defense Nuclear Agency
* Contract No. DNA 001-82-C-0245.
'4l
41
.-
W,
~q
'p
4% %''v j ' " " 4 "' .."* ' ."'-"
"",.."" . ... ". ",. . '" '°. . . ","""""•"-""".". ,,. " 'a"""-" '."''% h'''%
-, . , ... .... ... ""---"" '..'..-..'.".....- ".-" . -'---.i'----

CONVERSION TABLE
5, Conversion factors for U.S. customaryto metric (SI) units of measurement.
To Convert Froa TO Multiply 8y
Sangstrem meters (a) 1.000 000 X E -10atmosphere (nornal) kilo pascal (kPa) 1.013 25 X E +2
% bar kilo pascal (kPa) L.000 000 X E +2
barn meter2
(.2 )
1.000 000 X E -28'titish thermal unit (thermOchernical) Joule (3) 1.054 350 X t 3
calorie (theroachemlcal) Joule (J) 4.18' 000cal (thermochemical)/c0
2 s Joule/m
2 (lJ/r
2) 6.184 000 X K -Z
curie g$ia becquerel (CBq)a 3.700 000 X K +1degree (angle) radian (rad) 1.745 329 x E -2
degree Fahrenheit degree kelvin (K) t - t f + 459.671M.8electron volt joule (1) 1.602 19 X E -19eri Joule (J) 1.000 000 X E -7
er/setcond stt (W) 1.000 000 x E -7f toot meter (m) 3.048 000 X K -1foot-pound-(orce Joule (J) 1.3$5 818gallon (U.S. liquid) meterd (.2) 3.785 412 X K -3Inch meter (a) 2.540 000 X K -2Jerk Joule (J) 1.000 000 X K 49Joule/kIlograa (W/kg) (radiation doseabsorbed) Gray (Gy)** 1.000 000
kilotons terajoules 4.183kip (1000 lbf) newton (N) 4.4.8 222 X E 43kiplin (kin
2) kilo pascal (kPa) 6.894 757 X K +3
ktap nowton-second/m2
(N-s/2
) '1.000 000 X E -2.icron meter (.) 1.000 000 XE -6a.4 ll meter (m) 2.540 000 X E -5mile (international) meter (m) 1.609 3t4 X K +3ounce kilogram (kg) 2.834 952 X K -2pound-fore. (IbI avoirdupois) newton (N) 4.448 222pound-force inch neoton-meter (N-m) 1.129 848 X K -1
Pound-force/inch neuton/meter (N/a) 1.751 268 X E +2pound-force/footy kilo pascal (NPs) 4.788 026 X K -2pound-force/Inchl (lb/in ) kilo Pascal (kPa) 6.894 757
pound-mass (Ibm avoirdupois) kilogram (kg) 4.535 924 X E -1po"nd-sans-footl (moment of inertia) kilogram-meter2
(kx'm') 4.214 Oil X K -2pound*-X%/fnot, kIlotram/.eterl(kg/n) 1.601 1116 X K +1
red (radiation done absorbed) Cray (Gy)** 1.000 000 x E -2roentgen coulomb/kilogram (C/kg) 2.579 760 X K -4shake second (s) 1.000 000 X E -8slu kilogram (kg) 1.4$9 390 X E 41Corr (m MR. 0* C) kilo pascal (iPa) 1.333 22 X K -1
*The becqierel (51) is the ST ,nit of radioactivity; I Sq - I event/s."The Cray (Cy) Is the SI unit of absorbed radiation.
'€ ' iv•V
.. ... .. . . .. .. .... . . . . . .. . . . .. . . . . .

TABLE OF CONTENTS
Sect ion Page
PREFACE .. ........................ iii
CONVERSION TABLE ...................... iv
LIST OF ILLUSTRATIONS. ................... vi
LIST OF TABLES ...................... viii
1 INTRODUCTION. ....................... 1
2 EROSION MODELING. ..................... 3
3 SOLID PARTICLE EROSION OF COMPOSITE MATERIALS. ....... 17
4 MASS REMOVAL ESTIMATES ................... 35
5 DISCUSSION .......................... 43
6 EXISTING PARTICLE IMPACT TESTING CAPABILITY. ........ 48
7 GENERAL EXPERIMENTAL REQUIREMENTS .............. 56
8 CONCLUSIONS.........................65
9 LIST OF REFERENCES ..................... 66
.4.
*1%
'PC

LIST OF ILLUSTRATIONS
Figure Page
1 Mass loss for direct impacts of 90-micron sand on
graphite-fiber reinforced epoxy at 730 fps (222 ms- 1) 4
2 Geometry used for describing the erosion of ahemispherical dome ......... ................... 9
3 Specification of location and velocity of vehicle inspace .......... ......................... . 12
4 Nozzle dimensions and experimental arrangement fordirect and oblique solid particle impacts in the AFML/Bell Rotating Arm Facility ..... ............... ... 21
5 Particle size distributions for 70-micron glass beadsand 90-micron sand ....... ................... ... 23
6 Material removal rates for a graphite-fiber reinforcedepoxy .......... ......................... . 24
7 Steady-state erosion rates for graphite-fiberVreinforced epoxy as a function of particle impact
velocity ......... ........................ ... 25
8 Variation of erosion rate with particle impact angle . 26
9 Erosion behavior of graphite-fiber reinforced epoxy 28
10 Variation of erosion rates for polymeric materials withimpact angle ........ ...................... ... 29
11 Variation of weight loss with quantity of abrasive forpolypropylene and nylon ...... ................ . 29
12 Velocity dependence of composites tested with 125-150 vimquartz at 900 ......... ..................... 31
13 Estimated erosion rates as a function of particle sizefor 90' impacts ........ .................... . 34
14 Dust cover for aircraft at 1 hour after laydown ........ 36
15 Dust cover for aircraft at 3 hours after laydown . . . . 37
'. 16 Dust cover for aircraft at 10 hours after laydown. . . . 38
17 Particle size ranges as a function of cloud age . . . . 40
°- vi
V%
LIST OF ILLUSTRATIONS (Continued)
Figure Page
18 Mass loss for graphite-fiber reinforced epoxy specimensexposed to 10.29 1.8 mm water drop impacts/cm 2-sec. at
730 fps (222 ms- 1 ) ..... ......................... 46
19 Assessment of erosion damage for aircraft componentmaterials ......... ........................ . 57
20 Prediction of dust erosion effects on aircraft components 58
21 Comparison of erosion model predictions with simulated
aircraft component flight conditions ... ........... ... 64
.9-
--!
*1
vii
4".

LIST OF TABLES
Table Page
1 Geometric parameters associated with a spherical dome . . 11
2 Summary of test data for solid particle erosion of
composite materials ....... .................... ... 18
3 Erosion rates for quartz particles impacting compositematerials at normal incidence ..... ............... ... 32
4 Mean depth of penetration estimates for flight trajectory A 41
5 Mean depth of penetration estimates for flight trajectory B 42
4,.
viii
% d.
' 4
- - ,.,.,-
~' :-

SECTION I
INTRODUCTION
The susceptibility of advanced composite materials to solid
particle erosion is becoming an increasing concern. Adler (1981) has
indicated how laboratory erosion data can be used to predict the amount
of material removed during flight through dusty environments. A very
general model is available for making predictions of the mean depth of
penetration (I4DP) using relatively simple computational procedures.
This model is described in Section 2. Once a suitable laboratory
erosion data base is established, estimates of the MDP for a wide range
of flight scenarios and component geometries can be made.
BMD Corporation (1984) has also provided estimates of the level of
material removal that may occur for advanced composites in nuclear-
generated dust environments, however, the material removal rates in this
analysis are based on results for ceramic materials and are not directly
related to non-metallic composites.
A survey of the solid particle erosion literature revealed th~at
some experimental data is available for polymeric materials and fiber-
reinforced, non-metallic composites. Although not directly applicable
to the specific composites currently of interest, the available data
(summarized in Section 3) is used to provide some initial insights into
the magnitude of the erosion problem which may exist for advanced
composite materials on aircraft flying through nuclear-generated dust.
The dust distributions have been modeled by Yoon (1983). Using the
published erosion data, the possibility exists for a significant amount
of material removal to occur as shown in the examples presented in
Section 4. Additional investigations are suggested in Section 5 to
provide a more relevant estimate of the magnitude of the dust erosion
problem and the possible enhancement of the damage which may occur by

encounters with rain environments. The experimental requirements for
meaningful dust erosion assessments for aircraft are described in
Section 6 where the capabilities of the existing facilities are
summarized. A more general approach addressing dust erosion effects on
composite aircraft structures is presented in Section 7. The magnitude
of the test requirements and the analyses which have to be accomplished
are clearly indicated.
The lack of meaningful data for evaluating the erosion of
composite materials is a major obstacle to exercising the model
described in Section 2. The estimates provided however do show that
there could be a significant dust erosion effect for composite aircraft
components. This is the primary conclusion (Section 8) resulting from
this investigation.
i2
'%-- a4
I..

- - oo l
SECTION 2
EROSION MODELING
The general structure of an erosion model which accounts for
flight through a particulate environment, the shape of the component of
interest, and the erosion rates for the material exposed to this erosive
environment has been formulated by Adler (1979a, 1981). The primary
features of this erosion model are described. The general forms of the
data required for implementation of this erosion model are clearly
established.
The mean depth of penetration (MDP) provides a measure of the
material removal from an aircraft component during flight through a
nuclear dust environment. The mean depth of penetration is determined
as follows:
where M~t] is the mass removed from the target material after an
exposure time t in an erosive environment divided by the exposed surface
area, A, and the density of the material, PT. The mass removal for 90
jm silica sand impacting at 730 fps (500 mph) on a graphite fiber
reinforced epoxy target as a function of the exposure time is shown in
Figure 1. After a short incubation period (the nonlinear portion of the
curve) a steady-state rate of material removal is achieved. This is a
* characteristic of the material removal process for moderate size
particles at aircraft flight speeds. The subsequent evaluation of the
erosion of aircraft components in nuclear-generated dust environments
will be expressed in terms of the steady-state material removal rates.
This approach provides a conservative estimate for the erosive losseswhich may result for arbitrary flight scenarios and component
geometries.
3
% \' .

140
120-
100________
&"80
0
60
401
N'0 10 20 30 40 50 60 70 80 90 100
Exposure Time (sec)
Figure 1. Mass loss for direct impacts of 90-micron sand on graphite-fiber reinforced epoxy at 730 fps (222 ms-1) (Adler, 1973).
4
%

The basic measurement of the MDP defined in Equation (1) has to be
generalized for the flight of aircraft through airborne dust. The MDP
is now defined as the average depth of the amount of material removed
from the aircraft component within a local region on the component. The
cumulative effect of the material removed from all of the local regions
comprising the entire exposed surface area of the component indicates
the overall shape change of the component as a function of the time of
flight in the dust environment. This generalized concept for the MDP
can be expressed as
MDP = MDP [X,t; x, T; Fm] (2)
where the parameters in brackets indicate the functional dependence of
the MDP. The coordinates X denote the location of a specific region on
the aircraft at a time t after the dust environment is encountered.
The coordinates x denote the location of this areal element in space and
the time T is the aging of the dust environment at. that location
measured with respect to the initiation of the dust environment. The
time t and the f light path x can be selected independently in order to
evaluate the level of erosion damage which may be produced by the range
of options available for penetrating the nuclear-generated dust
envi ronment.
The term F'M in Equation (2) is a representation for the variations
in the composition of the lofted dust which may be encountered depending
on the thermochemical changes which can occur within the fireball, the
structural environment around the impact site, and the physics of the
lofting process. The influence of the composition of the dust on its
erosiveness is indicated as a factor which should be considered but
explicit representations for its effects would have to be investigated
in conjunction with studies of the dust environment.
5

The particle classification has to differentiate between angular
or rounded solid particles, silica sand or soil, or rain. The
additional parameters which influence the rate of material removal are
explicitly identified in the relation which follows.
MDP = Mt
(k) (k) (k)f (mass loss ,Rt ;xv f
O--A unit mass of eroding particlesk 0
(mass of particles [R(k); x9 'it
unit volume--
.(projected area I flight direction [l) v[x,t] dt (3)
where T is the total transit time and square brackets are used to
indicate the designated quantity is a function of the parameters listed
within those brackets. This relation simply states that the material
removed from a specific location on the exposed surface of a component
is equal to the material removed per unit mass of particles of a
particular type multiplied by the total mass of particles of that type
encountered during flight through a specified environment.
The conventional measure for solid particle erosion is the ratio
of the mass of material removed to the mass of impacting particles: the
erosion rate. The erosion rate is usually determined for steady state
conditions, that is, the mass of material removed is unchanged for equal
successive increments of eroding particles. The erosion rate is
dependent on the type of particles encountered, the particle impact
angle, a p,. the particle impact velocity, vp, and the size of the impact-
ing particle, R . The same definition of the erosion rate is
% % '.5
% % %,
4. %. 4 .4N

PIL)I
applicable to rain erosion except the erosion rate is generally a
nonlinear function of time (or the number of drop impacts per unit
area).
The designation of the particle sizes allows a distribution of
particle sizes to be considered. The particle size distribution curve
can be divided into N increments. If the increments, AR, are equal,
although this is not necessary, then R(k) represents the mean size of
the range (R + (k-I) AR) <R (k) <,(R + kAR) . The effect of particle size
appears in the erosion rate as well as the particle concentration. The
cumulative effect on mass removal is taken as a linear superposition
'A(summation) of the damage associated with each particle size. This
relation can be modified if the experimental data indicates this may be
required.
A distinction is made in Equation (3) between the vehicle'svelocity v and the velocity of the impacting particles v (k) for
(k)particles of mean radius R .This difference acknowledges that the
particle/ surface interaction due to the airflow over the component can
modify the impact velocity of the particle. The same considerations
apl to the particle impact angle c (k)an thoreainccfte
exposed surface.
If the exposed (local) surface area is not planar, it has to be
divided into discrete areal elements due to the dependence of mass
removal on impingement angle. Correspondingly Equation (2) can be
rewritten in terms of the amount of material removed from each areal
element.
-D A a(i)P (4)
where MDP M(is the mean depth of penetration for the ihareal element,
AM comprising a particular component.
7
Introducing the symbol u for the mass loss per unit mass and n for
the mass of particles in a unit volume (particle concentration),
AN M = 1 11], (ik) (ik), (ik) R ( k )]
Pt jk ]A [Mt
n ( k ) [R(k); x,1] v(Q)[x,t] At Q ) (5)
:NNThe noation A ) ] signifies the projection of the area A ont
the plane normal to the flight direction. The time integral in Equation
* (5) is replaced with a summation. Time only occurs explicitly in
connection with the vehicle velocity, since the steady-state erosion
rates are assumed to be achieved for the dust environments and the
particle concentrations 'are a function of the time elapsed from the
onset of rainfall over a particular geographical area or the dust
generated during a specific battlefield scenario. The establishment of
the external environment is independent of the vehicle's time of flight.
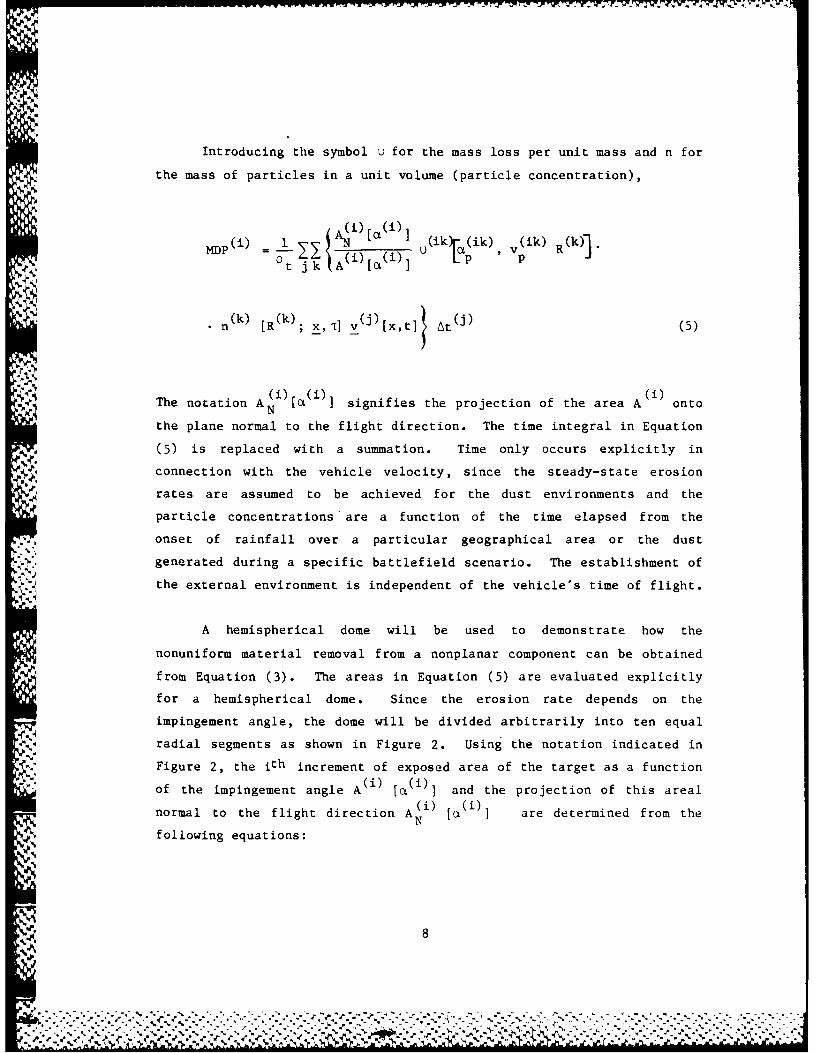
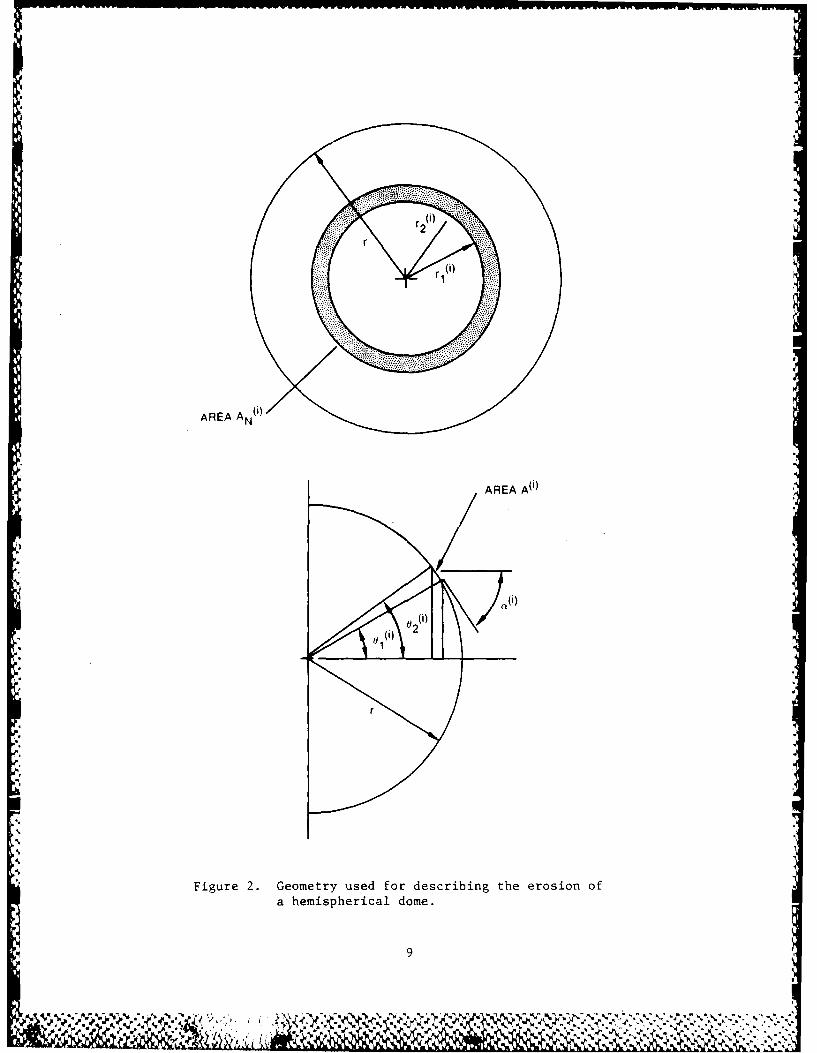
A hemispherical dome will be used to demonstrate how the
nonuniform material removal from a nonplanar component can be obtained
from Equation (3). The areas in Equation (5) are evaluated explicitly
for a hemispherical dome. Since the erosion rate depends on the
impingement angle, the dome will be divided arbitrarily into ten equal
radial segments as shown in Figure 2. Using the notation indicated in
Figure 2, the ith increment of exposed area of the target as a function
of the impingement angle AM ) [(] and the projection of this areal
normal to the flight direction A (i) () are determined from the
following equations:
8
AREA AN 0)
AREA 0 )
'"
Figure 2. Geometry used for describing the erosion of
a hemispherical dome.
9

A [M i)] = 2lTr 2 (Cosa W - Cosa W) (6)
W= iTr 2 (sin2e8(1) - sin 2ea () (7)
The numerical values of the ten increments are tabulated in Table 1.
This discrete approach to the problem provides a suitable
representation of the input data. A smooth curve can be drawn through
4the computed MDP data points as a function of dome angle. This curve
4 should be a reasonable approximation to the actual dome contour after
exposure to a defined environment and flight trajectory.
The flight trajectory is specified in terms of the velocity vector
v. During the course of the vehicle's flight various particle
concentrations will be encountered. The particle concentrations will be
functions of the vehicle's location in space denoted by the position
vector x. The time-dependent particle concentrations can be arrayed in
a three-dimensional matrix representing the space of general interest as
determined from representative dust and rain distributions.
The position and velocity vectors for the vehicle relative to some
reference coordinate system, such as the local Cartesian coordinates
shown in Figure 3, are
x = x e + x2 e 2+Xe3!1 (8)
v = v e I+ v~e, + v 3f (9)
The compc nents of the velocity vector can be written
a10
4.
. a, ~,

SJ
I
Table 1. Geometric parameters associatedwith a spherical dome.
[ i)M (i) A(i)/ 2 (1)/ 2 ()"
r 2 /r2rr AN /(X
i0. 50-44 ' 0.010 0.01 870-8 '
2 .2 110-32' .0304 .03 810o-22'
3 .3 170-27' .0516 .05 750-30'
4 .4 230-35' .0750 .07 690 - 29'
5 .5 30"-0' .1010 .09 630-12'
6 .6 36o-52 ' .1320 .11 560 - 34'
7 .7 440-26' .1720 .13 490-21 '
8 .8 530-8 ' .2280 .15 410-13'
9 .9 640-10' .3284 .17 310-23'
10 1.0 900-0 ' .8716 .19 120-55 '
'.'
°A
" i11
- . 4 ~'4"..W

-a3 0
" t3+ 7r/2
_e2-13 x &
e 214;
.%
Figure 3. Specification of location and velocity of vehicle in space.
-o
,, 12:'m
V

v = v cos4 cosa
v 2 = v cos sinB (10)
v 3 - v sino
The path of the vehicle is then given by
Xj Ql) X(j) + v (11)
where the subscript Z has the range 1,2,3.
The location of the vehicle in the environment can be evaluated
from Equation (II) and the magnitude of the velocity vector v is
determined from Equation (9). For numerical evaluations it is
reasonable to replace the time integration in Equation (3) by a
summation which equals the total length of the path the vehicle follows
in space as indicated in Equation (5).
Although the velocity of the particles in a unit volume at some
location in space does not appear explicitly in the particle concentra-
tion in Equation (5), it is essential to know the average particle
velocity as a function of particle size and location in space in order(Qk) Thinia
to evaluate the relative particle impact speed v P. The initial(k) (k)l
particle velocity is denoted by v [x, R . The velocity vector for
the particle of size R (k) impacting the vehicle at a location x in space
is then determined from
Q(k) = Q ) +(k) [R(k)] +b [, Q v(k) R(k)] (12)p 0
where v Q ) is the velocity of the vehicle determined from
the flight trajectory,
(k)v the velocity of the particles prior to interacting-o
with aerodynamic flows over the aircraft as determined
13
' % - . , . -%-, - -. - .- - - % .% % - % . . -...-.- . •- . - - - .* -- ** . - *. o - . * - • * ., - . . . %- . . '. -. - . . . . . . -• .,, ' ~ - -, . *,,, 4 '. . ,. '4,, ' 4.% , . . . . . . . . . . . .. . ' . , . . ,. -,, -,. . -. .... . . - .

from numerical computations of the dust distribution,
and
vb has to be evaluated from an analysis of the particle
S interaction with the flow field around the vehicle.
The impingement angle cc ik can be determined from the velocity vector
v (j) relative to the surface element whose normal vector is in the
direction ii/2 - ci.(i
The expression in Equation (5) is quite general and suitable for
digital analysis. Using a computer the material removal rates can be
evaluated at various locations on a component of irregular shape for
specified flight trajectories through temporally changing particulate
environments. Once the vehicle trajectory is established, it is
necessary to prescribe u (k) using erosion test data and n (k) to
describe the environment. It is important to note that the erosion data
does not change; only the manner in which it is utilized in evaluating
the M1DP will change. Once tests have been carried out for a material of
interest, for a range of impact angles, impact velocities, particLa
sizes, and particle types, this data base, if broad enough, can be used
to evaluate the erosive effects for any of the operational environments
which may be encountered.
There are many factors which influence the material removalprocess; however the particle size exponent and the velocity exponent
will be of primary concern, since these parameters are common to the
- majority of the particle erosion analyses which can be found in the
*literature. The lack of agreement between the results of the theories
based on kinetic energy exchange between the impacting particle and the
target has been a perplexing issue in the field of solid particle
erosion. The general form of the expression for volume removal (volume
removed per particle impact) can be written,
a b
g vR f:i )113
p
%I

i P ! 4 . .... .... . ... .
- I .I . r ', r.- v r. u o rI-. l 7 . . , . .'-i.- '-
where g is a functional representing the dependence on all of the
parameters not explicitly stated and
v is the particle impact velocityp
R is the mean radius of the impacting particle
f(a ) is a function of the attack angle ap P
a is the velocity exponent
b is the particle size exponent.
The velocity exponent has been generally found to range from two
to three for materials displaying ductile behavior for a wide range of
particle impact conditions, however exponents (up to 4) have been
obtained by Grant and Tabakoff (1975) and Tabakoff, et al (1979).
Tabakoff's results are based on detailed observations of the aerody-
namics of the particle flow and the rebound characteristics of the
particles impacting the eroding surface of the target. The velocity
4 exponents for brittle materials range from 1 to 6.5 (cp. Gulden, 1979a;
Sargent, et al., 1979). The velocity exponent depends on the size,
material, shape, and angle of attack of the impacting particle, however
it does not appear to be significantly affected by the microstructure of
the target material.
The particle size exponent has not been adequately evaluated. It
is generally stated that the volume removal in metals is independent of
particle size for particle sizes in excess of 100 m (Tilly, 1969). The
variations in particle size effects have already been noted for smaller
particle sizes in brittle materials (Sheldon and Finnie, 1966).
Gulden's test data (Gulden, 1979a,b) shows b:4 for magnesium fluoride
impacted by quartLz particles, however hot-pressed silicon nitride
impacted by silicon carbide particulates displayed a b=4 dependence
while impacts by quartz produced a b-3 dependence as well as a change in
a-4 to a=1 for particle sizes from 8 to 940 urm. A definite threshold
4 4for achieving an R V 0 relation was found for reaction-bonded silicon
nitride impacted by quartz particles. The above results are for normal
i5
.%.' .~ '%
-4....%%... %4-
.

imniar--ts on the target surface. The dependence of the particle size
exponent on the particle material is evident, but it is not known how it
would vary with the angle of attack.
The complete characterization of a particular impact condition
(particle impact type and target material) involving the particle size,
impact velocity, and impingement angle requires numerous erosion tests.
Thus a reliable experimental data base for the development as well as
comparison of analytical results is rarely found in the particle erosion
literature which leaves many aspects of the subject unsettled. The
analytical approaches which have been undertaken to describe material
removal due to both solid and liquid particle erosion have been
described and evaluated by Adler (1979b,c).
V16
-'%

SECTION 3
SOLID PARTICLE EROSION OF COMPOSITE MATERIALS
Experimental evaluations of the material removal rates for
polymeric and composite materials are summarized in Table 2. This is
all of the data which could be found in the open literature. Some
general observations concerning this data are provided.
A somewhat more extensive data base exists for rain erosion
evaluations of polymeric materials than for solid particle erosion.
However it is important to note that, while attempts have been made to
correlate the data generated in each of these environments, little
correspondence exists between the respective material removal rates.
Thus, based on the author's experience related to both solid particle
and rain erosion evaluations, it is not possible to use rain erosion
data to predict the erosion rates for solid particle impacts (Adler,
1979 a).
Setting this issue aside, the solid particle erosion investiga-
tions summarized in Table 2 will be used as the data base for estimating
the material removal rates for potential nuclear dust environments. The
recent- work of Zahavi and Schmitt (1981a,b) is of interest, but the-1 '
particle impact velocities (about 42 ms ) are too low to provide ,
relevant material removal rates.
There are some general trends in the solid particle erosion data
which remain to be established for fiber-reinforced composites. For
ductile metals the steady-state erosion rates become constant with
respect to particle size beyond a certain particle size (on the order of
100 um); the critical particle dimension is dependent on the particle
type and impact velocity (Goodwin, Sage and Tilly, 1969; Tilly and Sage,
1970). This limitation does not appear to be applicable to glass which
is representative of brittle response. The maximum (steady-state)
17
~. . .. . . . . . . . . . . . . . . . . . . .- -.-
. ... . * . A '' *.

Table 2. Summary of test data for solid particle erosionof composite materials.
Particle Particle Test Velocity Impact
Reference Material Material Size Apparatus Range Angle(m) (ms- 1
)
Behrendt (1974) CFRP 180/37% SiO 2- 0.2 to 0.25 Rotating arm 100-400 30 to 900
Astrocoat on GFRP Sio - 0.1 to 0.125 90"0.2 to 0.25 250 30 to 90"0.3 to 0.4 90*
GFRP + 400 m SiO 2 - 0.2 to 0.25 250 90*
Fluorocarbon coating
Williams and Lau GFR epoxy Sio -rounded 0.044 to unknown 47-109 90(1974) (unidirectional 0.250
graphite)I
Sio 2-rounded 0.077 to 70 30 to 90'0.125
Tilly and Sage Polyurethane Sio 2-angular 0.125 to Rotating arm 123 90,(1970) 0.150
Nylon (Type 66) 60-305 900
Glass-reinforced nylon30% glass fiber inType 66
Carbon-reinforced nylon25% carbon fiber in
Type 66
Fiberglass70% glass in epoxy
?olypropylene
.... k1969) Nylon (Type i6) 5iO,-angular 0.06 to Air blast 104 40., 900,0.125 70 to 90'
Carbon-reinforced nylon25% carbon fiber inType 66
Glass-reinforced nylon
Fiberglass70% glass in epoxy
?olypropylene
kar 73) FR SiO,-angular 0.090 Rotating arm 222 90,31 v' "I"
box; unidirectional)
-anavi and ;lass-reinforced poly- SiO,-rounded 0.210 to Air blast -2 30* to 90'3cnmit: i9?3la1 butadine -elongated 0.297
Glass-reinforcedpoLvimide
Glass-epoxy laminatesT.ialy35,' resin,
o5. reinforcement
Zanai and -jarings -sTmh:: 1 ?olvjret'ane SLO, 0.210 to Air blast -2 15, co 0to
"MIL-C-i3296) 0.297
?olvurethane* 'MIL-C-33231)
..iorocarzcn
18
% 4'i ".,% % ,. , %. .
r . ~ ~ ~ ~ ~ ~ ~ ~ ~ ~ ~ ~~~'I A,.,....',.,.,,'''''''< 1h"; "" "

erosion rate for ductile metals occurs at an impact angle around 20'
while normal (900) particle impacts are the most damaging for brittle
materials. For very small particles (c 10 PJm) the maximum erosion rate
for brittle ceramics shifts to impact angles less than 900 (Sheldon and
Finnie, 1966).
The trends in the erosion rates for polymeric composites are
dependent on the specific composite material being evaluated and are
typically intermediate to the general trends observed for ductile and
brittle materials. For polymeric composites there is a tendancy for a
mass increase for certain impact conditions (as normal incidence is
* approached) due to particle embedding rather than mass removal during
the initial stages of the erosion process.
Details of the experimental apparatus and procedures used are
relatively scant in the published reports along with the test procedures
used. The limited information that is available will be used to
reconstruct the manner in which the stated results were obtained.
Tilly and his co-workers (Tilly, 1969; Tilly and Sage, 1970) used
both a sand blast apparatus and a rotating arm test configuration as
indicated in Table 2. The rotating arm provided impact velocities more
representative of those encountered in gas turbines operating in dusty
environments, while the sand blast apparatus was used to obtain elevated
temperature data. A single specimen was mounted at each end of a 10.16
cm (4 in.) arm and for higher velocities (approaching 550 ms- ) a 15.24
cm (6 in.) arm. Sand was dropped from a dispenser at one point along
the circumference of the circle through which the specimen passed. The
height of fall of the sand could be adjusted so that all of the sand
impacted the specimens. Tilly indicates that at most 7% of the sand
released may miss the specimens. The specimens were 1 cm (0.4 in.)
squares machined with a shank for attachment to the rotating arm. It is
assumed that the polymeric samples were fastened to a metal backing in
order to obtain mass loss data for these materials. In the sand blast
* 19
?. ~ .

device the particle-laden arsemwsdictdat the central portion
of the specimen. The quantity of particles impinging the specimen is
taken to be proportional to the projected area of the test specimen
* normal to the flow.
The AFML/Bell rotating arm erosion facility (Adler, 1973) has a
rotating arm which places the specimen at a radial distance slightly
greater than 2.75 m (9 ft). The short arm radius used by Tilly did not
let the particles fall the width of the specimen before they were
impacted again. The large radius of the Bell arm allows the particles
to fall more than 30 cm before they are impacted on the next revolution
of the arm. The Dornier System's rotating arm (Behrendt, 1974) has a
wradius of 1.2 m (3.94 ft). No information is provided in the paper by
Williams and Lau (1974) as to the apparatus or procedures which were
used to obtain the data reported.
The actual number and condition of the particles striking the
specimens in these erosion facilities are typically determined indi-
* rectly. Adler (1973) calculated the number of impacts for the AFML/Bell
rotating arm using the following relation for the test arrangement shown
in Figure 4, NNd o O(
4
* .720 2gh "
- .where N Iis the number of particle impacts the specimen experiences per
revolution of the rotating arm,
N is the number of particles released into the path of the,~. 2specimen per minute,
=~h 21.233 fps for the AFML/Bell erosion facility,
4 is the lateral dimension of the sand ejection nozzle,
Z' is the lateral dimension of the exposed area on the specimen'ssurface in inches,
20
~..... .. . . . . . ...- *'

z LL
oU o
< Ii
LLA
0*U 00
wL 'I
0 41
u~ - LW
C/0 *
LLO---
LAl.
C U
M -H
Lij N
z2
U-4

d' is the transverse dimensions of the exposed area on thespecimen's surface in inches.
The specimen used in Adler's experiment was a half cylinder: 1.27 cm
(0.5 in.) diameter x 5.08 cm (3 in.) long. The erosion rates with this
geometry represent a range of impact angles which distorts the values
obtained. For normal impacts, 0 - 0* as defined here, Z - 1.375 in., V-
- 2.5 in., and d' - 0.5 in. Since V- is greater than Z-, the ratio 2-12-
is taken to be unity; however, the particle spray expands as it exits
from from the nozzle, so deviations from the ideal conditions do occur.
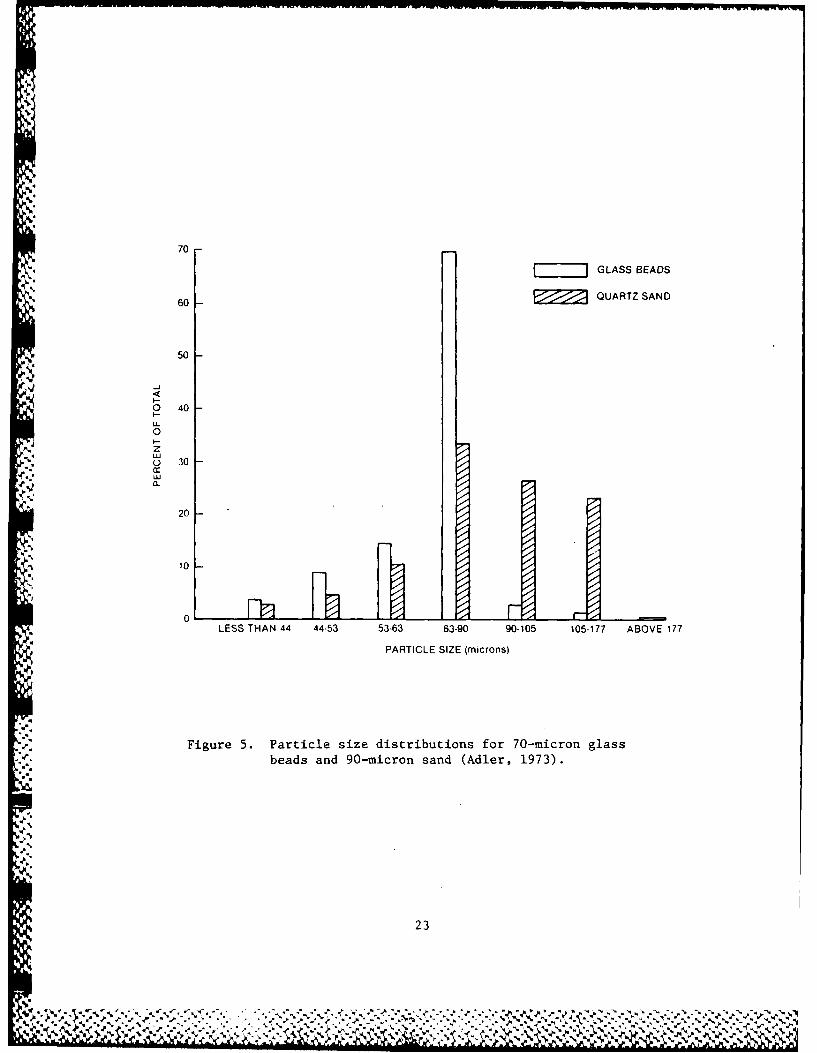
The nominal 90 urn quartz sand was dispensed at a rate of 260 g/min. The
particle size distribution is shown in Figure 5 and is skewed to the
larger particle dimensions. Assuming an equivalent spherical diameter
of 90 inm and a density for quartz of 2.2 g/cc, the value of N in
*4Equation (12) is determined to be 3.10 x 10 8 particles/min. Using these
values in Equation (12) yields a value of = 9.30 x 10³ particles/rev.
A p = 2 s (730 fps) the RPM for the AFML/Bell arm is 1.05 v por7b6. The particle impacts per second are then estimated to be 1.19 x
510 .This value can be used with the measured mass loss per exposure
-A increment in Figure 1 to obtain an approximation of the erosion rate.
It is again important to note that the specimen was a half-cylinder and
so the erosion rate in Table 2 cannot be reliably associated with a
single impingement angle. With this reservation acp = 900' will be
assigned for the initial evaluation.
Behrendt (1974) does not provide explicit information on how the
mass of impacting particles was obtained, so it is not possible to
evaluate the consistency in the erosion rates he obtained and those
obtained by other investigators using rotating arms. Behrendt's erosion
V. evaluations are moderately extensive providing the variations of erosion
rates with impact velocity and impact angle as shown in Figure 6 to 8
for a graphite fiber reinforced composite (the exact constituents are
not specified). The samples are cylindrical with a 16.8 mm (0.66 in.)
diameter and a thickness of 2.5 to 5.0 mm (0.1 to 0.2 in.).
22
"4beJu . r
70
GLASS BEADS
60 - = QUARTZ SAND
50
0 40
U-0
U: 30
a.
20
.5.10
0 LESLESTHAN 44 44-53 53-63 63-90 90-105 105-177 ABOVE 177
PARTICLE SIZE (microns)
Figure 5. Particle size distributions for 70-micron glassbeads and 90-micron sand (Adler, 1973).
23
%- % % %

400 rn/s
150
300 rn/s
250 rn/s
200 rn/s
44 100
E
0i
50
100 rn/S
0*0 1 2 34 5(
MASS IMPACTED. g
Figure 6. material removal rates for a graphite-fiber reinforced
epoxy (Behrendt, 1974).
24 '
-Is'

1000
500 __________
E
Ui G LASS
<100
z0U0
O GFRPw
10
100 200 250 300 400
IMPACT VELOCITY, ms-1
Figure 7. Steady-state erosion rates for graphite-fiber reinforcedepoxy as a function of particle impact velocity (Behrendt,(1974).
* 25 5

300
E '200
'Sd
- GFRP
,.. r __ _ _ _ 0__ _ _ _ _ _ _ _ _ _ _
<',' z
0 0
__. 100
a: 00
15 30 45 60 75 90
PARTICLE IMPACT ANGLE, deg
Figure 8. Variation of erosion rate with particle impact angle
(Behrendt, 1974).
26
0 _j __ _
.:,..,..,.;....r.,,,.,,.,;.0 15:..:" 30,..-..-..,,-,-.." 45 60 75 90 ' :Y¢ Q ~ ,

The dependence of the erosion rate on the impact parameters was
defined in Equation (13).
a bU g v R f(ct)p
where g is a functional representing the dependence on all of the
parameters not explicitly stated, a is the velocity exponent, and b is
the particle size exponent. Behrendt's results indicate that a ::2.4
and the functional dependence on a. at 250 ms- can be obtained fromp
Figure 8. The maximum erosion rate occurs at an impact angle of 450.
On the other hand, Williams and Lau (1974) find from their experiments
that
=0.01 (2R) 0.9 [v psin (a p + 24*)1 3.4 (15)
This expression is based on 100 lIm quartz particles impacting unidirec-
tional graphite fiber reinforced epoxy speciment at 70 ms- (230 fps).
The maximum erosion rate for the test conditions used by Williams and
Lau occurs at an impact angle of 650 (Figure 9). It is also important
to note that the velocity exponent in Equation (15) is 3.4 which is
considerably higher than that found by Behrendt (1974) but the impact
velocity is quite low.
Tilly and his co-workers (Table 2) find that the erosion rate for
nylon and glass carbon fiber reinforced nylon has a maximum at an
impingement angle of 300 (Figure 10). Quartz particles ranging from 60
to 125 UIm sieve diameters imparted the specimens at v = 104 ms (341p
fps). Tilly demonstrated that a significant mass of quartz particles
had to impact the polymeric test samples before the erosion rates would
begin to approach their steady-state values. This effect is greater for
900 impacts than for 400 collisions (Figure 11). 400g of quartz
particles were used to obtain the erosion rates in Figure 10, however,
according to Tilly's evaluation of the influence of the mass of the
-~ 27
V%%

4 5
3 90*
E12
1~0
09
'.
4
3-2-
0 I I - I
0 05 .0 1.5 20 25 30 35Weight at Impacting PtrticleS (g)
(a) Weight loss of graphite-epoxy composite for varying impact angle.(Particle velocity 70 rn/s and particle size range *77-125 urn).
.1~9 .1
60 30
405" 60 7 80 90,.1. lImpact A,,glC
(b) Correlation Equation and Experimental Resuilts.
Figure 9. Erosion behavior of graphite-fiber reinforced epoxy* (Williams and Lau, 1974).
28
:-- R4 % ?5 :: K*
i5 90* -'•'/

0.6
o Calbo, -eo-fo,~d nylon
S0.08 Q 2p E
E ' U
0 0
0
30 60 90
Impcct oncte (degrees)
Figure 10. Variation of erosion rates for polymeric materialswith impact angle (Tilly, 1969).
2
C
0
- 2 1
C.b
a Co~o~ r~nfoC~d y'A4
fo poyrpylee ndnvn(Tll, 96)
29 , -

-- - - - - - P U
impacting. particles, the erosive response is still not stabilized for
400g of quartz particles. This observation raises doubt as to the
accuracy of the data reported in Figure 10. In addition the data points
are not sufficient to confirm that the results for nylon, carbon-
reinforced nylon, and glass-reinforced nylon are nearly identical in the
vicinity of (x= 30' (Figure 10). For a fairly broad range of materials,
Tilly and Sage (1970) found that the velocity exponent was approximately
2.3 for normal impacts of 125 to 150 i'm-quartz particles impacting from
60 to 300 ms -1 as can be seen in Figure 12.
The erosion rates, 'u , which can be determined from the publica-
tions described above are summarized in Table 3 for the particle impact
conditions which are of interest for assessing aircraft vulnerability to
nuclear-generated dust. Although a sizable increase is seen in the
erosion rates at intermediate impact angles at low impact velocities (asJ, shown in Figure 10), the difference between the maximum erosion rate at
an intermediate angL= compared to normal collisions may not be as
'~ drastic at impact velocities in the vicinity of Mach 1 (as indicated in
- .the plot in Figure 8). Th.- values of u for normal impacts in Table 3
will therefore be assumed to be slightly low but indicative of the
maximum erosion rates.
In order to convert the volumetric erosion rates reported by Tilly
and Sage (1970) to mass loss per unit mass of impacting particles, the
densities of the composites they evaluated have been estimated. These
estimated densities are indicated in Table 3. The composite materials
are all quite different, so the available data can only be used to
provide a very crude estimate of the solid particle erosion rates
current composite materials may experience for better defined erosive
conditions. The erosion rates from Tilly and Sage (1970) show the range
of values that may occur, however the graphite-fiber reinforced epoxy
data obtained by Adler (1973) and Behrendt (1974), which may be more
* representative of present day composites, will be used to obtain some
idea of the MDPs for aircraft flying through nuclear-generated dust
environments.
30
N.%

0 -Epoxy- X-Glass
01*1.
I / 70*1. Glass-r3 I Reinforced/ . 0f.Glass "'I epoxy/ enforced nylon I
-25 1.Carbon /Re inforced/ - £nylon
R~eiforced,~~epoxy
SI M a
N Nylon / '
Steel I , Steel
OIL
Figure 12. Velocity dependence of composites tested with125-150 pim quartz at 900 (Tilly and Sage, 1970).
316
% % %.
Z - -- - -- -.

Table 3. Erosion rates for quartz particles impacting
composite materials at normal incidence.
Source Material Particle Impact Erosion
Size Velocity Rate(mm) (ms- 1 ) (mg/g)
Tilly and Sage 30% glass fibers in 125-150 185 4.93(1970) type 6,6 nylon
p z 1.56 g/cc. 245 10.9305 17.14
70% glass fibers in 185 53.5epoxy (fiberglass) 245 109.
p z 2.05 g/cc.
305 170.
25% carbon fibers in 185 4.05type 6,6 nylon
0 z 1.28 g/cc 245 9.00305 14.06
.4 Type 6,6 nylon 185 1.28p z 1.16 g/cc 245 2.67
305 4.53
Behrendt (1974) GFRP 180/37% 200-250 100 6.08
200 26.4
250 43.5
300 70.8
400 137.7
Adler (1973) 31 v/o graphite 90 222 19.10
in epoxy
32

The dust distributions (Yoon, 1983) are specified in terms of the
particle size. Unfortunately the erosion rates obtained by Adler (1973)
and Behrendt (1974) are for a single mean particle size, so it is quite
difficult to specify the variations of u with particle size. Several
forms of the dependence of U on particle size are likely to exist based
on the trends in the solid particle erosion response of other materials.
The available data is plotted in Figure 13 as a function of the mean
particle size. The range in the form of the dependence of U on particle
size is indicated in Figure 13. At this time it is not possible to
select one form over another, but the data deficiency could be
eliminated with a small experimental effort. It was stated at the
beginning of this section that the steady-state erosion rates for
ductile metals become constant with respect to particle size, however
the erosion rates for more brittle materials may not display this same
effect but may tend to increase for a considerably larger range of
particle dimensions. These two possibilities are reflected in the
erosion rates for the smaller particle dimensions.
The solid particle erosion rates for non-metallic composites
obtained from the existing literature, be that what they may, will be
used in Section 4 to provide very preliminary estimates of the removal
rates for hypothetical aircraft trajectories traversing the continental
United States.
P"
N'
33
WA P
% % % %"16_ L

160
140
120
100
80
LU
0 80
40-

- - - - - - - - -- - - - - - - - - - - --- - - - - -
SECTION 4
-~ MASS REMOVAL ESTIMATES
The extent of the damage which may result from flight through
nuclear-generated dust will be estimated using the erosion model
N described in Section 2 and the extrapolations of the experimental
erosion rates summarized in Section 3. The specific conditions to be
Aevaluated are the hypothetical deployment of aircraft from the
southwestern United States at various times after a nuclear attack on
d missile sites within the continental United States.
The general relation in Equation (5) will be evaluated using the
dust distributions calculated by Yoon (1983). Representative dust
distribution plots are available as shown in Figures 14 to 16. Two
trajectories passing through the dust fields have been selected for
aircraft flying across the continental United States without consider-
ation of how realistic they might be. These trajectories will be used
to demonstrate how the temporal development of the dust fields can be
introduced into the erosion model to evaluate the MDP. The two
trajectories labeled A and B are superposed on the dust distributions in
Figures 14 and 16. Since only a limited number of time increments have
been computed for the dust distribution, the evaluation of Equation (3)
-~ has to be carried out for a much larger time increment (essentially a
static dust distribution) than would be the case if the model could be
adequately implemented. A more reasonable time increment for these dust
distributions would be At -100 sec. for an aircraft flying at 300 to
400 ms-1 . The aircraft would fly roughly 20 nmi during this time
increment for a flight speed of 375 ms -1(c.750 knots). It would also
be desirable to have the dust concentrations isocontours at intervals of
3, 15, 30, 45, 60, 90, 120, and greater than 150 mg/in3
The dust field calculations (Yoon, 1983) provide the mean and
range of particle sizes in the atmospnere as a function of time after
- 35
...................................... - ..

=MRW
DUST DENSITIES
Al 14G/M3
x 1 20
-3-1
0 100 200 300 400 500 600 30-1S Kri
SCALF(NMI SUNmr ('win.
Figure 14. Dust cover for aircraft at 1 hourafter laydown (Yoon, 1983).
"I.
36
ee, N-
_4 -. oo -oo . , so • 3 - 4

0~ 10 02000 500
371
........................ 31.3.. . .. . .. - -*k

45 1215-4
'3-1
-. 3-.
* SIJi4MLR CONI).
Figure 16. Dust cover for aircraft at 10 hoursafter laydown (Yoon, 1983).
%% %.
42'

laydown as indicated in Figure 17. For the restricted conditions which
can be investigated at the present time, Equation (5) reduces to
DP = n ( j ) ( j ) (16)
t j
Normal impacts are assumed so there is no angular dependence. The
erosion rate is then simply a function of the particle size and impact
velocity. The particle size is determined from Figure 17 for the values
of time after laydown and therefore is assigned a fixed value.
Correspondingly the mean erosion rate remains unchanged which would not
be the case if the time interval for the dust distribution was reduced
to 15 min. For lack of a flight plan the aircraft velocity is also held
constant, so from Equation (5) lv(J) At j ) - L ( j ) the distance the
aircraft travels through dust with concentration n (j ) . The density of
the generic composite is assumed to be 1.65 g/cc.
The MDP for trajectories A and B can now be evaluated for the
conditions stated above. The MDPs for a range of conditions are listed
* in Table 4 for trajectory A and in Table 5 for trajectory B. Referring
to Tables 4 and 5, it is seen that the amount of material removed for
both the short- and long-time distributions is on the order of 1 mm (40
mil). The MDP values can vary widely from this value due to the
uncertainties in the erosion data as well as the dust distribution
calculations. Also no effort was made to make worst case predictions.
Flight through higher dust concentration zones would increase the
removal rates several fold.
39
*. 39
. . . . . .

1000Mean
Mean prilpartticlessize
ALCMs and bombers
100
PACCs and bombersu tankers during flyot
00
04

Table 4. Mean depth of penetration estimates forflight trajectory A.
Particle Dust Impact Mass LossTime Size Concentration Distance Velocity Ratio MDP(hr) (lam) (mg/in3) (in) (ms-l) (mg/g) (mm)
1143 30 I.53x10 5
9 2.831.5 0.65 300 55-70 0.24-0.31
342 75-95 .33- .42400 110-138 .48- .61
3 70 30 0.87x10⁵
9 3.701.5 3.92 300 40-60 0.16-0.24
342 53-84 .21- .33400 84-131 .33- .52
10 38 9 6.68x10⁵
1.5 2.18 300 27-41 10.10-0.16342 36-58 J.14- .22400 65-100 .25- .38
7'41....
* .21. .

Table 5. Mean depth of penetration estimates forflight trajectory B.
Particle Dust Impact Mass LossTime Size Concentration Distance Velocity Ratio MDP(hr) (;1m) (mg/rn3) (in) (ms-l) (mg/g) (mm)
1 143 80 1.96xl10 5
30 2.839 1.311.5 1.96 300 55-70 0.86-1.09
342 75-95 1.18-1.49400 110-138 1.72-2.16
3 70 9 7.19X10 5
1.5 3.60 300 40-60 0.18-0.28342 53-84 .24- .38400 84-131 .38- .60.
10 38 9 7.19X10⁵
1.5 7.84 300 27-41 0.13-0.19342 36-58 .17- .27400 65-100 .30- .46
42
.......... .. ...... .

SECTION 5
DISCUSSION
The relevant erosion data, five experimental data points in Figure
13, for two different, ill-defined graphite-fiber reinforced composites
has been used as the basis for constructing highly speculative rela-
tions between the erosion rates and the particle dimensions. This data
is required since the mean particle dimensions in the dust environment
predictions are a function of the time after cloud formation (Figure
17). The erosion rates recorded in Figure 13 can vary considerably from
the stated values due to the high degree of uncertainty in the test
procedure and the quality of the test specimens compared to current
composite materials. However the information provided is indicative of
the prevailing state-of-the-art for solid particle erosion of
nonmetallic composites and coated materials for impact velocities in the
vicinity of Mach 1. Figure 13 represents the best estimates that can be
made without initiating additional testing to remove the prevailing data
gap. The dust environment predictions also contain a high level of
inherent uncertainty which could significantly influence the magnitude
of the estimated material removal rates. In view of all of these
factors and additional considerations which will be discussed shortly,
it is evident the detrimental effects of the dusty environments which
may be encountered by composite aircraft components cannot be ignored.
The 900 particle impact data used to make the MDP estimates in
Tables 4 and 5 may not be the worse case condition. Based on the
experimental erosion rates for various composite materials, it appears
that the critical impact angle (the angle at which the maximum erosion
rate occurs) is dependent on the type of composite material being
evaluated. The critical impact angle can range from 300 to 900 (Figure
10). Maximum erosion rates are seen to occur at 450 (Figure 8) and 65'
(Figure 9). Thus, until the erosion rates are measured for a specific
composite construction, there is no assurance that non-normal
43

impingement angles will be beneficial in alleviating the severity of the
amount of material removed.
The material removal evaluated in Tables 4 and 5 is for aircraft
velocities in the vicinity of Mach 1; however if the flight velocity
increases to Mach 2, the material removal is increased by a factor of
5.28 according to the power law relation for the erosion rates obtained
from Behrendt's (1974) data. Extrapolation to the higher velocity
* assumes that no significant change occurs in the mode of material
removal between these two velocities.
The erosion data for the graphite-reinforced polymers listed in
Table 3 was used to provide the estimates of mass removal in Tables 4
and 5. If the erosion data for a material with the characteristics of
fiberglass was used instead, the mass removal could conceivably increase
by a factor of 2.5 for the normal impact condition. On the other hand,
a more resilient matrix material than epoxy (the nylon composites in
Table 3) could help to reduce the mass removal. The variation of more
than an order of magnitude in the experimental eros~ion rates for
different composite materials tends to reinforce the need for estab-
lishing reliable erosion data for a specific composite construction.
The possibility exists for aircraft which have been exposed todust to subsequently encounter rain along their flight path. Although
it may exist, no experimental data could be found for providing insights
into the synergistic effects of the sequential imposition of a dust and
rain environment on any material. The interaction between the erosion
characteristics for each of these particle types could be quite strong
and warrants consideration if the potential for damage is to be
representative of a broad range of flight scenarios. While no directly
applicable erosion data is available, conjectures can be made as to the
extent of the material loss based on a knowledge of the erosion behavior
of materials individually exposed to these two erosive environments. In
particular, Adler (1973) evaluated the rain erosion behavior of the
44
'Z.

graphite-reinforced epoxy material in Table 3 as well as its solid
particle erosion characteristics. The rain erosion data is shown in
Figure 18. The rain field is calibrated to 1.8 mm mean diameter water
drops falling at the rate of 2.54 cmlhr.* It is seen that some time 4
(the incubation period) is required before any rapid rate of material
removal takes place. Finally a steady-state rate of removal is
achieved. Using the information in Adler's report, the number of drops
impacting the specimen and correspondingly the mass of water impacting
the surface can be approximated. The steady-state erosion rate (for 1.8
mm diameter drops) was evaluated from Figure 18 and was found to be 52
mg/g compared to 19.1 mg/g for the solid particle environment. The same
specimen geometry, a half cylinder, was used in the rain erosion tests
also. If the region of the leading edge in which the drop impacts
normal to the surface of the specimen was used in the above erosion rate
evaluation instead of the projected area of the specimen, the erosion
rates would be significantly higher (possibly by as much as a factor of ,
four).
The general character of the damage is distinctly different in
each case. The multiple solid particle impacts produce a relatively
smooth eroded surface with each particle removing a small, localized
volume; the water drops can penetrate the bulk of the specimen once
cracks and pits are formed on the surface and remove relatively large
volumes of material by a surface penetration and upheaval mechanism%
(Adler, 1979b).
Returning to the potential for enhanced damage in combined
environments, it would seem that a surface preconditioned by solid
particle impacts would provide numerous sites for the initiation of rain
erosion damage. In other words, the long incubation period in Figure 18
The rainfield in the AFML/Bell rotating arm facility was recalibratedand the plumbing system improved in 1978. Deviations in the previously
stated and actual rainfield parameters were uncovered at that time, soj
the erosion rate could be changed simply due to the calibration differ-
45
J,.

400
300
p>
E
(n1 2000
0.
00 10 20 30 40 50 60 70 80 ?(
EXPOSURE TIME. sec
Figure 18. Mass loss for graphite-fiber reinforcedepoxy specimens exposed to 10.29 1.8 mrmwater drop impacts/cm 2-sec. at 730 fps(222 ms- 1) (Adler, 1973).
46
;,77, .

(the duration of which is dependent on the impact velocity) would be
by-passed and the steady-state erosion rates for the rain environment
would be rapidly achieved. Also due to the pre-existing fractures, the
effectiveness of the penetration and upheaval mechanism would be
amplified for the rain drop collisions. The combined effect of exposure
to a dust and then a rain environment should be much more severe than
simply encountering a rain environment with a pristine material surface
for a semi-brittle material, On the other hand, flight through rain
s followed by exposure to dust should produce only a slight increase in
the solid particle erosion rates due to the localized nature of the
solid particle impact damage. At this time these observations are
conjectures and require experimental verification and quantification.
47
4.4

SECTION 6
EXISTING PARTICLE IMPACT TESTING CAPABILITY
The previous section provided an assessment of the prevailing data
base for the particulate erosion of composite material constructions.
The main conclusion from this survey is that there is essentially no
data available for the types of materials which are of current interest.
Another conclusion which is evident from this survey is that the number
of existing facilities which can provide dust erosion data at impact
velocities from 500 to 1500 fps is relatively small and the specimen
dimensions are quite limited. The more positive result from this survey
is the clear indication provided in Section 2 of how laboratory-scale
test data can be utilized to provide estimates of the extent of the
erosion damage on a wide range of materials for actual flight scenarios.
The problem of how to obtain useful particulate erosion damage
assessments will be addressed.
4Particulate erosion tests are usually designed to satisfy one or
4, more of the following three objectives: straightforward screening of
materials exposed to a standard test condition, identification of damage
mechanisms in order to improve the erosion resistance of a particular
material, and the generation of data in support of a predictive modeling
effort. The problem areas have mainly involved studying the effects of
a single or relatively small number of particle impacts, such as,
hypervelocity particle impacts on re-entry vehicle nosetips or water
drop collisions on fragile infrared-transmitting materials or space
shuttle tiles.
Motivated for the most part by the need for evaluating the
relative rate of material removed due to solid particle or water drop q
4. impingement rather than in understanding the material removal process
itself, a diversity of test configurations have been utilized to
generate the screening assessments required. Erosion testing has
48

generally been undertaken to satisfy a very specific need for a
particular application. Typically a test method is devised
representative of the operational environment. A material selection
procedure is pursued and then the testing is terminated. It is
difficult to construct a coherent series of test results on this basis.
On the other hand there have been a few programs which have been carried
out to investigate the erosion process; these have been referred to
fairly extensively in the erosion literature. Unfortunately, the
available solid particle erosion test results have generally been
reported with insufficient information pertaining to the test conditions
to provide a valid comparison between the data obtained in one
laboratory with that from another laboratory. This situation is
complicated further by the fact that changes in the construction of the
same test apparatus can significantly influence the delivery of
particles to the target material as shown by Uuemois and Kleis (1975),Wolak, et al. (1977) and Maji and Sheldon (1979).
The primary reasons for the discrepancies in the correspondence
between the erosive response of aircraft components based on erosion
facility test results and their actual performance under operational
conditions are:
* * the lack of adequate characterization of the particle (sand or
rain) interaction with the aerodynamic flow fields around the
component during flight (recognizing that characterization of
these particulate environments in general is a difficult
problem),
*the lack of characterization and verification of the particle
impact conditions within the erosion test facilities used to
generate the erosion data,
e the lack of a procedure which indicates how the erosion test
4. results relate to operational conditions.
49
C. I . j'V 44 V I . -.

The model described in Section 2 provides a general framework for
relating erosion test results with the actual flight conditions and
erosive environments in order to predict the material losses a
structural component may experience. The model can be applied to
material loss estimates for aircraft components. This model clearly
indicates that once accurate erosion test data is obtained it can be
used to evaluate a broad range of flight scenarios. This is a very
signif icant result. This approach affords the opportunity to use a
well-planned, laboratory-scale test program to generate a data base from
which an unlimited number of flight scenarios and trade-off studies can
be undertaken, compared with simulation tests which have a narrow range
of application and have to be repeated as the flight conditions are
changed. This is not to imply that the suggested approach is easy to
implement, but once accomplished it has a considerably higher utility
and cost-effectiveness than the alternatives.
The need for multiple solid particle collisions at impact
velocities from 500 to 1500 fps limits the facilities which can achieve
these particle impact requirements under reasonably controlled
conditions. The types of facilities commonly used to obtain solid
particle erosion data will be described and then the possibilities for
satisfying the higher velocity requirements will be considered.
The most widely used test configuration for solid particle erosion
is the sand blast apparatus. Although some version of this device has
been used for laboratory-scale erosion evaluations for over seventy
years, it has only been quite recent that the test parameters associated
with particular types of equipment have been investigated. The sand
blast equipment used for providing a multiple particle field ingests
particulate matter into a flowing gas stream which subsequently impinges
on a test piece through a small diameter tube: typically less than 12 mm
(0.5 in). The impact velocity and angle of attack of the particles in
the gas stream are governed in part by their size, shape, and density.
The maximum particle impact velocities are generally less than 500 fps.
50
to % N % N
*o % - -a-r~

A facility of this type which operates at higher particle impact
velocities was developed during the early 1970s at the Solar Turbines
International, San Diego, California. In the Solar facility the dust is
injected into a high-pressure air stream. The length of the delivery
tube is on the order of 10 ft (3.05 m) so the particles have sufficient
time in the air flow to achieve their terminal velocities. The
particles exit the system through a 0.375 in (0.95 cm) nozzle. With
this arrangement the eroded area is 0.11 in (0.71 cm ) which may be
marginal with respect to the construction of some of the composites
which may be evaluated. The maximum air velocity is limited by the
sonic velocity: 1120 ft/s (342 ms-) The maximum particle velocities
depend on the mean size of the particles. The maximum particle velocity
for a 10 W~m particle is 935 ft/s (285 ms1 ); the impact velocity in this
facility is greatly reduced for particles on the order of 100 pim. The
particle impact conditions again fall short of the desired regime.
Another facility which provides higher-velocity dust erosion
impacts (velocities up to 800 fps for 50 pam particles) was recently put
in operation at PDA Engineering, Inc., in Santa Ana, California. The
existing capability for this facility will be briefly described as it is
known at the present time.
The particle impingement on the target is accomplished by
translating the target across the particulate flow from one to four
nozzles. The nozzle inside diameter is 0.19 in. and the spacing between
the linear array of nozzles is about 0.25 in. The nozzle array can also
be oscillated in an up and down motion which spreads the particles
uniformly over a 0.5 in. high strip approximately 1.75 in. long. The
test specimen is mounted to a 7 inch square plate that translates across
the nozzles. The motions of this plate are computer controlled, so the
traverse and speed at which the plate is moved can be regulated. Impact
angles currently ranging from 20 to 90 degrees can be used. At impact
angles less than 90 degrees the distance from the centerline of the
51
-5- .- .- ' 5.. S - . . .
W15* L% 5

nozearytoteipc lcto-nth lt smananda
nozze aray the impactlctrnte proetdblaten is frminaiond atha
costrants vau one deine is set.eth nleneoheseie
Thndres worng hae f unteiormoparile flow maiu about6ichesteesure indrto caccounte fo e2d efets. P60 initesdpnig thate
loatione onite sp teimen reiesithedsm. atceditiuin h
edge oftscmen are potected bpaingo aifo frme aorofundited
redsraits ane bhed eine patinimes teile of th sptclrsie rmeime
boundres oan te opratn ofemaerdial roval Thdsiedmxi particulcetae
exosurTe dutce ocnrations can raglfos2o 60 mine dependingiong the
particle sizes and the flows rae deid. i ahbe oprvd
bescwichaeehrdwt particles oftrbtin ah particlar seoize. Fromioe or
four bedsicanle opmeraingi depending on the dsdparticle onthentra-
tio.ie Thv patcle concsentrafon ecnas bed chaanged by caninge thzes
fl o rmati the flucidied bed apoialyorbd a oti the same vlct swudb
particlse size onaraf hein siescnt e diferet inud eahe exaotpove af
pres citicei disedetiution. the particle velocity acthiteedufor
-A~i each paic gle imeniie deedn son then particle size othsfo
nzlsThpatcevelocities haetaeadutdfre beeied sirng of particl sizoe
isd thogactin the pcmnatice appoatl th slae vaaelt ase wolob
thei casrtc can aaf flin injetito a ustin cloud Thseatnessof
tis cowndtoneis deenen pcmn the patie veloctes withindb thes
-'52
clu prio to coldn wihtearrf.Teflwotoahnzl
is fro a sigl f.iie bed so .iig o atce szs i

particle-laden gas which offers the advantage of eliminating the
transition region around the eroded spot on the test piece when the
particles are propelled from a nozzle or tube as in the sand blastarrangement. A system of this type has been described by Grant and
Tabakoff (1975) and Tabakoff and Wakeman (1979) at the University of
Cincinnati. The maximum air velocity achievable in the dust erosion
tunnel for amnhiAet tCMIpeid.Lures at the University of Cincinnati is 450
ft/s (140 ms- 1). Wind tunnels have been used in the past but the
characterization of the dust environments in the tunnels was a problem
in the early investigations. At the present time it does not appear
that dust-laden airf lows are incorporated into any existing transonic to
low supersonic wind tunnel within the United States.
Rotating arm devices in which the specimen is mounted at the tip
of a rotor blade and then passes through a stream of falling particles
are also used for solid particle erosion evaluations (Kleis, 1969; Tilly
and Sage, 1970; Adler, Morris, and Wahl, 1972). The rotating arm
configuration has the advantage of having the specimen impact a graded
particle distribution (such as specified by U.S. Military Specification,
Mil-E-5007C, which includes particle sizes over the range from 0 to 1000
4 um at a uniform velocity. Such conditions are characteristic of high
speed structural components in a dust field where the particles are
traveling at considerably lower velocities. The rotating arm configura-
tions also have potential for being operated at higher impact velocities
compared with sand blast and wind tunnel test facilities, but the sample
mass and dimensions are quite small and the sample configurations are
also highly restricted. Bell Aerospace Textron rotating arm can operate
at velocities of around 100 ft/s to about 3000 ft/s. However as Mach I
is exceeded the sample dimensions are limited.
*The variations which exist in solid particle erosion test
4 apparatus, even for sand blast devices, make it difficult to discuss
typical, or standard, test conditions. Generally the test results are
strongly related to the test apparatus used. In addition the testing
4 53
%4 4 4 ~ .
%. 4. 4 .

procedures for solid particle erosion vary widely from laboratory to
laboratory, so it is difficult to make an absolute comparison between
the results obtained for one set of test conditions to another. Also,.
as more attention is paid to the tesL procedures and characterization of
the impact conditions, additional factors which invluence the impacting
particle/target interactions are being discovered (Tilly, 1969; Tilly.J.. and Sage, 1970; Uuemois an<? Kleis, 1975; Grant and Tabakoff, 1975;
Wolak, et al., 1977; Young and Ruff, 1977; Tabakoff, Kotwal, and Hamed,
1979; Maji and Sheldon, 1979; Lapides and Levy, 1979). Therefore at the
present time the test facility and the test procedure must be considered
in conjunction with the test results.
Surveys of solid particle erosion testing facilities and
procedures indicate there is a definite need for devising a facility to
provide an accurate measure of the erosive response of materials and/or
to provide detailed characterization of the actual impact parameters for
existing facilities. This is not a simple undertaking due to the number
of parameters which are associated with multiple collisions of
irregular-shaped particles on a material surface, whose general
topography and properties are changing with the length of the exposure.
The characterization process for a single particle type and material is
in itself quite extensive. Many factors have to be evaluated to develop
accurate measures of the mass of particles actually contacting the
surface, their impact velocity and impingement angle, and the nature of' -
the particles delivered to the surface compared with the initial
properties and size of the particles (especially for soft particulates).
Concentration effects are obviously important. Particle concentration
can influence the extent of particle shielding at the surface (the
accumulatinn of particles on the surface which prevents the incoming
particles from making direct contact with the target's surface),
particle rebound dharacteristics which change as a function of exposure
time also affect the trajectories of the incoming particles, and the
*. occurrence of particle embedding in the target's surface modifies the
measured erosive response of the base material.
54

An overview of the evaluation of the system implications of
aircraft flying througn nuclear-generated dust environments will be
described in the next section. The explicit erosion testing
: requirements will be outlined in conjunction with this overview.
55
. .. . Wt
.... ... .... ... .... ... .... ... .... ... ...
SECTION 7
GENERAL EXPERIIILNTAL REQUIREZIENTS
The statement is often made that the erosion data obtained from
laboratory-scale erosion facilities is not applicable to the conditions
prevailing ior actual flignts through dusty environments. Contrary to
A this commonly-accepted observation, it is our opinion that if the
laboratory data is used in the right way, very realistic predictions can
be made of the erosive losses for a broad spectrum of aircraft flight
scenarios. This approach offers the advantage of not having to carry
out a significant number of costly flight tests even if it was possible
to undertake full-scale testing in dusty environments. Since it is
aiiily impractical to fly aircraft in dusty environments representative
o nuclear-generated dust, the suggested laboratory-scale testing
provides a viable solution. The accuracy of the erosive loss
predictions is merely dependent on the level of effort devoted to the
adjunct naiyses required to transform the laboratory erosion data to
Lhe aircraft flight conditions. The statements made in Section 2 are
reiterated, since it should be understood from the outset that once
reliable, laboratory erosion data is obtained for the range of
conditions whicth will be specified, this data remains valid for all
fiight scenarios and environmental conditions which may be considered.
The analyses and observations from Sections 2 and 6 provide the
background for a meaninglul approach for an assessment or the potential
dust erosion damage to aircraft flying at high subsonic to low
supersonic speeds. An overview or how such an assessment can be
accomplished is outlined in Figures 19 and 20. The interrelationships
in Figure 19 provide a clear perspective for tie main features of the
dust erosion assessment. The output from the analyses and experimental
data generation will be a computational model for describing the extent
of the material removal which may occur for an arbitrary flight plan.
56
. . . . .. .P . P
%.~..~.k iLaA..J

PARTICULATEENVIRONMENTt'DEFINITION/MODELS
TEST PLAN
* BASELINE MATERIAL '* ADDITIONAL MATERIALS
OF EROSION SCREENING COEFFICIENTS
IMPLEMENTATIONOF SEMI-EMPIRICALEROSION MODEL
EROSION MODELPROGRAMMED FORDIGITAL COMPUTEREVALUATION
Figure 19. Assessment of erosion for aircraft component materials.
57
b.
A- "-, ~A****A~J %.

PARTICULATEENVIRONMENT AIRCRAFT FLIGHT
DEFINITION/MODEL PLAN
EROSION PARTICLE DYNAMICS-,.ENVIRONMENT AIRCRAFTCHARACTERIZATION COMPONENTS
AERODYNAMIC EROSIONMODELING MODEL
EROSION MODELPREDICTIONS. FORFLIGHT SCENARIOS
Figure 20. Prediction of dust erosion effects on aircraft components.
58
.b
,% Y ",,." :,'..-,--:-.',.',. -. '.- ,-. . --.-.. . ... ' .-.---.. . ... . .'".-v.-. v .,v -..-. ,v -.- '.. ,--. ...- .,,. .- . , .. -. .. .,

Thie resulting computational model may be used to examine a wide range of
The primary constituents of the computational model listed in
Figure 19 will be described. It is important to note that estimates of
the mass removal can be made using a minimal amount of information. As
the inputs to the general approach are refined the uncertainties in the
erosion predictions will correspondingly be reduced.
Either a superficial or detailed description of the erosive
environment can be used to bracket the particulate impact conditions
which w~ll be significant. The initial survey of the particle impact
parameters is used to limit the number of particle impact conditions
which have tj be considered. However subsequent modification of the
dust environments will not alter the erosion test conditions. They
should oe selected to be broad enough to accommodate the anticipated
dust environments. Since a very detailed and complete erosion test
matrix can become overwhelming from ttue standpoint of the scope of the
test program required, judgment has to be exercised as to the conditions
which will provide a reasonable test plan as well as a reliable data
base. With proper selection of the test conditions the data base can be
expanded with extrapolations of the experimental results.
The motivation for elaborating the utility of the experimental
erosion data base is that it is sometimes thought that the high level of
uncertainties associated with specifying the nuclear-generated dust
environments should be reduced before any effort be devoted to
developing a much more representative and reliable erosion data base
than exists at the present time. While significant discrepancies in the
impact parameters derived from the lofted dust and debris models and the
dispersion of this dust in the atmosphere will alter the predictions ot
aircraft erosion, ani initially conservative estimate can be provided by
assuming a worst-case condition. If the resulting levels of maLerial
59

removal are not significant, the investi.,tion of the erosive effects
does not have to be pursued further. If the resulting predictions of
material loss are marginal or unacceptable, further refinement of the
5%*. dust environments to be encountered would be warranted. As the
nuclear-generated dust models are refined, specification of the revised
dust environments can be readily and easily incorporated into the
erosion assessment. A much more important consideration for
implementing trie suggested approach is to provide reliable laboratory
erosion data.
In order to obtain reliable erosion data, the particle impact
conditions within the laboratory erosion facility and the particle
impact conditions at the surface of the vulnerable aircraft components
should be well-ctaracterized. This aspect of utilizing the laboratory
erosion data is usually neglected and leads to the general jack o'
correspondence between the laboratory results and the actual flight
conditions. In the approach shown in Figures 19 and 20 it is very
important that the aerodynamics of incoming particles impacting the test
specimens in the erosion test facility and for the aircraft be defined.
In the erosion facility this can be accomplished using diagnostic
equipment to directly observe the particle impacts in addition to
analytically defining their trajectories. For the aircraft the particle
trajectories will more likely have to be specified from analytical or
computational models. "The difference in these particle impact
conditions has been explicitly introduced in Equation (5). The level to
which these particle impact conditions can be prescribed will determine
the accuracy of the predictions which can be made by this approach. The
general relations for incorporating the experimental data and for
predicting the mass removal for actual flight scenarios involves the
explicit evaluation of in Equations (5) and (12) in Section 2.
Since a complete description of the mass loss as a function of the
particle type, size, impact angle, impact velocity, and particle
60
4%0 ~ ~ - .*
5.

concentration tor a single material involves hundreds or particle impact
tests, discretion has to be exercised in the number of impact tests
which are reasonable. If a number of materials are to be evaluated, a
baseline material can be selected and fairly extensively characterized.
The test program for these additional materials can be limited to the
extent that is necessary to at least establish the trends (with respect
to impact angle, particle size and impact velocity) which are adequate
to define their particulate erosive behavior reldtive to the baseline
material. A limited number of test conditions can be prescribed for the
new materials of the same general type in the test matrix and these data
points superposed on the more complete curves for the baseline material.
If the same general trends appear as for the baseline material, a
limited number of tests will be sufficient to compare each new material
with the baseline. If anomalies are noted then more tests (a second
interaction) will be required to describe the behavior of the new
m.terial.
In addition to obtaining quantitative measures of the material
removal rates the test program also offers the advantage of providing
specimens tor materials characterization. Microscopic examination of
the damage produced from the onset of material removal to accelerated
rates of material removal provides significant information on how the
erosion resistance of a particular material can be improved. Identi-
fication of the erosion mechanisms can be accomplished by removing
specimens at various stages of the erosion process. These can then be
used to construct a physical description of the microscopic mechanisms
responsible for the onset and subsequent progression of damage.
In order to gain some appreciation for the magnitude of the
erosion test program a representative test plan will be outlined.
Suppose only one type of dust is considered, for example, crushed
quartz. The silica can be sieved in accordance with the standard Tyler
sieve openings beginning with 38 wm. Four size ranges for the particle
61

. . . . -. . . =.- - T -- - -- . .. -- - -. - - - - -r -- _X - 'M Ft _ WE: : :t l
sizes are reasonable spanning the dimensions from 38 to 180 pm. Since
the impact angle dependence of the material removal rates for the
candidate composites is not known, the impact angles of 15, 25, 45, 60,
,.'. and 90 degrees would have to be included for the baseline material at
* - least. The evaluation of the impact velocity dependence of the material
removal rates would require a minimum of three impact velocities. There
are now sixty particle impact conditions specified for determining the
erosion coefficients, U in Equation (5), for the baseline material.
However the evaluation of the steady-state erosion rates requires a
series of repetitive exposures for each particle impact condition in
order Lo obtain the curve illustrated in Figure 1. Possibly eight to
nine exposures are required in the erosion facility for this purpose.
The specimen has to be accurately weighed after each exposure and
correlated with the mass of particulates impacted during each successive
exposure increment. Thus for tne baseline material possibly 500
incremental exposures to the dust environment are necessary to fully
evaluate the -erosion coefficients. At least triplicate specimens
exposed to the same particle impact conditions are required to provide
adequate confidence in the resulting erosion coefficients. How
expediently this could be accomplished depends on the configuration of
the facility used for the dust erosion testing.
Once the erosion coefficients have been evaluated, the particle
impact conditions have been properly characterized, and the erosion
model has been programmed for digital computations predictions of the
erosion of aircraft materials can be made. This is the scheme shown in
Figure 19. The erosion model is ten combined with a definition of the
dust environment which can be used as input data for the model and
evaluations of the aerodynamic flow fields over the aircraft component
of interest as indicated in Figure 20. Predictions of the extent of the
material removal from this component can then be provided.
62
*~C or -- 5p~~~ % s~

S
Without the option of instrumenting an aircraft and flying through
a well-characterized dust environment, a more feasible assessment ot the
accuracy of the erosion predictions for the aircraft component may be
obtained with wind tunnel tests for at least a section of the component.
The general plan for conducting the wind tunnel tests is illustrated in
Figure 21. The erosion model would be evaluated for the conditions
within the wind tunnel. The predictions from the model would then be
compared with the post-test measurements of the material removal from
the actual aircraft component after a sufficiently long exposure to tlhe
particle impact conditions within the wind tunnel.
4 While the effort described in this section is substantial, it
provides a rational approach for evaluating the dust erosion effects
which in the long run will be cost-effective and will apply to a wide
range of flight conditions.
63
i%
.% % 1.
% 4
, It3I

SELECTION OFAIRCRAFTCOMPONENT
WIND TUNNEL TEST WIND TUNNEL TESTPLAN-ENVIRONMENTAL PLAN-PARTICLE IMPACTCONSIDERATIONS [CHARACTERISTICS
AERODYNAMIC EROSIONMODELAEODYLINAI MOPREDICTIONS FORMODELING MFLIGHT SIMULATIONS
,J.
p,•WIND TUNNEL TESTING COMPARISON OFEROSION DAMAGE EROSION TEST
,ASSESSMENT RESULTS AND MODEL
I PRE DICTIONS
MATERIAL DAMAGE EVALUATION OFCHARACTERIZATION/ EROSION EFFECTSFAILURE MECHANISMS FOR AIRCRAFT
~COMPONENT
a",
.1k
', Figure 21. Comparison of erosion model predictions withsimulated aircraft component flight conditions.
64
i %%
%

SECTION 8
CONCLUSIONS
The existing solid particle erosion data for non-metallic
composite materials has been summarized and reviewed. This survey
indicates that the erosion data for the particle sizes and impact
velocities of interest is essentially not available. The limited number
of erosion rates which are available have been used as the basis for a
very preliminary estimate of the material removal which may be
experienced by aircraft flying through dusty environments. This is
certainly a highly speculative approach, but it represents the best
estimates that can be made at the present time. The available data
contains higii levels of uncertainty, since it is for very ill-defined
composite materials and the test procedures used may introduce
significant errors.
An erosion model which clearly indicates the erosion and environ-
mental parameters required and how they affect the material removal
rates was used to predict the magnitude of the material removal which
may occur for hypothetical flight scenarios. The indication from this
initial effort is that the solid particle material removal rates for
advanced composites can be significant.
This investigation, which represents the best material loss
estimates that can be made currently, indicates that a properly directed
experimental effort is required to improve the reliability of the damage
assessment of composite aircraft components exposed to particulate
environments.
65
%44 % %-

SECTION 9
LIST OF REFERENCES
W. F. Adler (1973). Analytical Modeling of Liquid and Solid Particle
Erosion, Air Force Materials Laboratory Report, AFIL-TR-73-174
(September 1973).
W. F. Adler (1979a). "Particle Erosion of Electromagnetic Window
M1aterials," Optical Engineering, 18, 610-619.
W. F. Adler (1979b). "The Mechanics of Liquid Impact," Treatise on
Materials Science and Technology, vol. 16 Erosion (C. M. Preece,
ed.), New York: Academic Press.
W. F. Adler (1979c). Assessment of the State of Knowledge Pertaining to
* Solid Particle Erosion, Final Report U.S. Army Research Office
Contract No. DAAG29-77-C-0039, General Research Corp. Report No.
CR-79-680 (30 June 1979).
W. F. Adler i1981). "Development of Design Data for Rain Impact Damage
in Infrared Transmitting 11aterials," Proc. Soc. Photo optical
Instr. Engr., 297, Emerging Optical M1aterials.
W. F. Adler, W. Morris, Jr. and N. E. Watil (1972). Supersonic Rain and
Sand Erosion Research: Characterization and Development of Erosion
Resistant Materials. Air Force 1Materials Laboratory Report AFIIL-
TR-72-85 (May, 1972).
A. Behrendt (1974). "Sand Erosion of Dome and Window 'aterials," Proc.
Fourth Int. Conf. on Rain Erosion and Assoc. Phenomena.
~I
BMD Corporation (1984). Hardening of Manned and Unmanned Air Vetticles,
unpublished.
66
% . %, ~ ~

J. E. Goodwin, W. Sage and G. P. Tilly (1969). "Study of Erosion by
Solid Particles," Proc. Inst. Mech. Engrs., 184, 279-292.
G. Grant and W. Tabakoff (1975). "Erosion Prediction in Turbo-machinery
Resulting from Environmental Solid Particles," J. Aircr., 12,
471-478.
M. E. Gulden (1979a). "Solid Particle Erosion of High-Technology
Ceramics (Si 3 N4 , Glass-3onded AZ 20 3, and MgF2) ," Erosion:
Prevention and Useful Applications, ASTM STP 664 (W. F. Adler,
ed.). American Society for Testing and Materials, 11-122.
M. E. Gulden (1979b). Study of Erosion Mechanisms of Engineering
Ceramics, Seventh Interim Technical Report, Effect of Number of
Impacts on Erosion in the Elastic-Plastic Response Regime, Office
of Naval Research Contract N00014-73-C-0401 (March, 1979).
I. Kleis (1969). "Probleme der Bestimmung des Strahlve'rschleisses bei
Metallen," Wear, 13, 199-215.
L. Lapides and A. Levy (1979). "The Halo Effect in Jet Impingement
Solid Particle Erosion Testing of Ductile Metals," in Erosion/
Corrosion Newsletter (A. Levy) Pub-304, Lawrence Berkeley
Laboratory, University of California (Uay 1979).
J. MAji and G. L. Sheldon (1979). "Mechanisms of Erosion of a Ductile
11aterial by Solid Particles," Erosion: Prevention and Useful
Applications, ASTM STP 664, (W. F. Adler, ed.). American Society
for Testing and liaterials, 136-147.
G. A. Sargent, P. K. ehrotra, and H. Conrad (1979). "Multi-particle
Erosion of Pyrex Glass," Erosion: Prevention and Useful Applica-
tions, ASTI STP 664 (W. F. Adler, ed.). American Society for
Testing and Hiaterials, 77-100.
67
- ,. . , "

G. L. Sheldon and I. Finnie (1966), "On the Ductile Behavior of
Nominally Brittle hiaterials During Erosive Cutting," J. Eng. Ind.
Nov. 1966, 387-392.
W. Tabakoff, R. Kotwal, and A. Hamed (1979). "Erosion Study of
Different Materials Affected by Coal Ash Particle," Wear, 52,
161-173.
W. Tabakoff and T. Wakeman (1979). "Test Facility for Material Erosion
at High Temperature," Erosion: Prevention and Useful Applications,
ASTM STP 664 (W. F. Adler, ed.). American Society for Testing and
Materials, 123-135.
G. P. Tilly (1969). "Erosion Caused by Airborne Particles," Wear, 14,
63-79.
G. P. Tilly and W. Sage (1970). "The Interaction of Particle and
Material Behaviour in Erosion Prucesses," Wear, 16, 447-465.
H. Uumois and I. Kleis.(1975). "A Critical Analysis of Erosion Problems
Which Have Been Little Studied," Wear, 31, 359-371.
J. H. Williams, Jr. and E. K. Lau (1974). "Solid Particle Erosion of
Graphite-Epoxy Composites," Wear, 29, 219-230.
.4[.
* J. Wolak, P. Worm, I. Patterson and J. Bodoin (1977). "Parameters
Affecting the Velocity of Particles in an Abrasive Jet," J. Eng.
H1at. Tech., 99, 147-152.
B. Yoon (1983). Nuclear Dust Cloud Characterization. Presented at DNA
Aircraft Survivability/Vulnerability Meeting, 8 February 1983.
J. P. Young and A. W. Ruff (1977). "Particle Erosion Heasurements on
Metals," J. Eng. Mat. Tech., 99, 121-125.
68
%- % %

J. Zahavi and G. F. Schmitt, Jr. (1981a). "Solid Particle Erosion of
Reinforced Composite Naterials," Wear, 71, 179-190.
J. Zahavi and G. F. Schmitt, Jr. (1981b). "Solid Particle Erosion of
Polymeric Coatings," Wear, 71, 191-210.
69

DISTRIBUTION LIST
DEPARTMENT OF DEFENSE NAVAL AIR SYSTEMS COMMANDATTN: AIR 5164G
ASST TO THE SECY OF DEFENSE ATOMIC ENERGY ATTN: PM-23ATTN: EXECUTIVE ASSISTANT
NAVAL AIR TEST CENTERDEFENSE INTELLIGENCE AGENCY ATTN: SATD LCDR KOENIG
ATTN: DB-6E V FRATZKEATTN: RTS-2B NAVAL RESEARCH LABORATORY
ATTN: CODE 2627 TECH LIBDEFENSE NUCLEAR AGENCY ATTN: CODE 6006 0 FORESTER
ATTN: SPAS4 CYS ATTN: STTI-CA NAVAL WEAPONS CENTER
ATTN: CODE 3383 J MORROWDEFENSE TECHNICAL INFORMATION CENTER12 CYS ATTN: DD NAVAL WEAPONS EVALUATION FACILITY
ATTN: CLASSIFIED LIBRARYFIELD COMMAND DEFENSE NUCLEAR AGENCY ATTN: CODE 50 R FRIEDBERG
ATTN: FCTT W SUMMAATTN: FCTXE OFC OF THE DEPUTY CHIEF OF NAVAL OPS
ATTN: OP 654 STRAT EVAL & ANAL BRFIELD COMMAND DNA DET 2LAWRENCE LIVERMORE NATIONAL LAB STRATEGIC SYSTEMS PROGRAM OFFICE (PM-1)
ATTN: FC-1 ATTN: SP-272
JOINT STRAT TGT PLANNING STAFF DEPARTMENT OF THE AIR FORCEATTN: JLK (ATTN: DNA REP)
AERONAUTICAL SYSTEMS DIVISION, AFSCUNDER SECY OF DEF FOR RSCH & ENGRG ATTN: ASD/BlES E PRICE
ATTN: DIR CRUISE MISSILE SYS ATTN: ASD/ENSSATTN: STRAT & SPACE SYS (OS) ATTN: ASD/ENSSS H GRIFFISATTN: STRAT & THTR NUC FORCES
AIR FORCE CTR FOR STUDIES & ANALYSISDEPARTMENT OF THE ARMY 2 CYS ATTN: AFCSA/SAMI R GRIFFIN
ATTN: AFCSA/SASBAVIATION APPLIED TECHNOLOGY DIRECTORATE ATTN: AFCSA/SASM MAJ TOM HOPKINS
ATTN: DAVDL-ATL-ATP H MORROWAIR FORCE SYSTEMS COMMAND
HARRY DIAMOND LABORATORIES ATTN: DLWMATTN: SLCHD-NW-P J GWALTNEY 20240 ATTN: SDNI
ATTN: XRTU S ARMY AVIATION SYSTEMS CMD
ATTN: AMSAV-ES LTC DEVAUGHAN AIR FORCE WEAPONS LABORATORY, AFSCATTN: NTA A SHARP
U S ARMY BALLISTIC RESEARCH LAB ATTN: NTATE E FRANKLINATTN: S POLYAK ATTN: NTN (NGCS)ATTN: SLCBR-TB-B R RALEY ATTN: SUL
U S ARMY NUCLEAR & CHEMICAL AGENCY AIR FORCE WRIGHT AERONAUTICAL LABATTN: LIBRARY ATTN: POTX M STIBICHATTN: MONA-NU MR LONG
AIR FORCE WRIGHT AERONAUTICAL LABDEPARTMENT OF THE NAVY ATTN: GLXRM R DENISON
MARINE HELICOPTER SQUADRON ONE AIR FORCE WRIGHT AERONAUTICAL LABATTN: HMX-1/PLANS MAJ P HALTON 2 CYS ATTN: AFWAL MLBT W ANSPACH
71

DEPARTMENT OF THE AIR FORCE (CONTINUED) GENERAL RESEARCH CORPE M T R E IATTN: D MIHORA
AIR FORCE WRIGHT AERONAUTICAL LAB ATTN: R CRAWFORDATTN: FIBAC J ROSELIUS 6 CYS ATTN: W ADLERATTN: FIBEB C SCHMIDT
IRT CORPAIR UNIVERSITY LIBRARY ATTN: D WOODALL
ATTN: AUL-LSE
KAMAN SCIENCES CORPDEPUTY CHIEF OF STAFF/AF-RDQI ATTN: D COYNE
ATTN: AF/RDQI ATTN: L MENTEATTN: R RUETENIK
DEPUTY CHIEF OF STAFF/AF/RD-L ATTN: W LEEATTN: RDL
KAMAN SCIENCES CORPSTRATEGIC AIR COMMAND/NRI-STINFO ATTN: E CONRAD
ATTN: NRI/STINFOKAMAN TEMPO
STRATEGIC AIR COMMAND/XOBB ATTN: DASIACATTN: XOBBATTN: XOKF MAJ A PHILPOTTS KAMAN TEMPO
ATTN: DASIACSTRATEGIC AIR COMMAND/XPF
ATTN: XPF LOCKHEED CORPORATIONATTN: A SCHUETZ
STRATEGIC AIR COMMAND/XPFS ATTN: B OSBORNEATTN: XPFS
LOCKHEED-GEORGIA COMPANYDEPARTMENT OF ENERGY ATTN: A BONDERUDr', -:ATTN: R KELLYSANDIA NATIONAL LABORATORIES ATTN: T HODGSON
ATTN: TECH LIB 3141 RPTS RCVG CLRK
OTE GMCDONNELL DOUGLAS CORP."OTHER GOVERNMENTATNHSM ATTN: H SAMS
CENTRAL INTELLIGENCE AGENCY ATTN: L KOCHATTN: OSWR/NED ATTN: R J PANDORF
U S ARMS CONTROL & DISARMAMENT AGCY MCDONNELL DOUGLAS CORPATN: H COOPER ATTN: J TRACY
ATTN: L COHEN
DEPARTMENT OF DEFENSE CONTRACTORS MCDONNELL DOUGLAS CORP
BOEING CO ATTN: J GAIDULISATTN: A DACOSTA ATTN: J MCGREW
ATTN: M POTTERBOEING MILITARY AIRPLANE CO
ATTN: D SAWDY NORTHROP CORPATTN: 8 AGARWAL
CALSPAN CORP ATTN: G KENDALLATTN: C PADOVAATTN: M DUNN PACIFIC-SIERRA RESEARCH CORP
ATTN: H BRODE, CHAIRMAN SAGECARPENTER RESEARCH CORP
ATTN: H J CARPENTER R & D ASSOCIATESATTN: A KUHL
DAMASKOS, INC ATTN: F A FIELDATTN: N DAMASKOS ATTN: P RAUSCH
,/,,
DAYTON, UNIVERSITY OF RAND CORP
ATTN: B WILT ATTN: P DAVIS
72

DEPT OF DEFENSE CONTRACTORS (CONTINUED) SCIENCE APPLICATIONS INTL CORPATTN: A MARTELLUCCI
RAND CORPATTN: B BENNETT SOUTHERN RESEARCH INSTITUTE
ATTN: C PEARSROCKWELL INTERNATIONAL CORP ATTN: S CAUSEY
ATTN: A MUSICMANATTN: P MASON TOYON RESEARCH CORPATTN: S MELLINS ATTN: B GRAGG
ATTN: J CUNNINGHAMSCIENCE APPLICATIONS INTL CORP
ATTN: J COCKAYNE
.3
73

.4'..' 4.
-- p~.
(~1. P
~\ r'~-- ~-.
* -~ S ~ wjj'..~ *~-**'-~~-