886 March Road McDonald's Transportation Study
53
McDonald's Restaurants of Canada Limited March 2013 886 March Road McDonald's Transportation Study Submitted by: HDR Corporation 100 York Boulevard, Suite 300 Richmond Hill, ON L4B 1J8 (905) 882-4100 www.hdrinc.com
Transcript of 886 March Road McDonald's Transportation Study

McDonald's Restaurants of Canada Limited
March 2013
886 March Road McDonald's Transportation Study
Submitted by:
HDR Corporation 100 York Boulevard, Suite
300 Richmond Hill, ON L4B 1J8
(905) 882-4100
www.hdrinc.com


McDonald's Restaurants of Canada Limited 886 March Road McDonald's Transportation Study
March 2013 Project # 7306
Page i
EXECUTIVE SUMMARY
A. Introduction
HDR Corporation (“HDR”) was retained by McDonald’s Restaurants of Canada Limited to
undertake a transportation study for a proposed McDonald’s restaurant, with drive-through
window, to be located in the northeast quadrant of March Road and Maxwell Bridge Road in
Ottawa, Ontario. The site is currently occupied by a single family dwelling, which will be
removed as part of the redevelopment.
The proposed restaurant will be 6,137 SF (“square feet”) in size, with unsignalized driveway
access to both March Road and Maxwell Bridge Road. The driveway to March Road will be
restricted to right-in / right-out operations, while the Maxwell Bridge Road driveway will
provide full movement access and will be located opposite an existing commercial driveway
to the south.
This study is part of a Zoning By-law amendment application and site plan control
application.
B. Findings
Operations
Study intersections are operating with excess capacity under existing conditions, and will
continue to do so under background and total traffic conditions. No modifications to the
existing road network are required or recommended.
The existing median on March Road may need to be extended north to physically restrict the
March Road driveway to right-in / right-out operations.
Parking and Drive-Through
Parking for the proposed restaurant will be provided in the amount of 58 spaces. This
exceeds the requirements of the City of Ottawa Zoning By-law 2008-250 by 12 spaces. The
Zoning By-law also requires a minimum of two bicycle parking spaces, which will be
provided.
The drive-through stacking lane will be designed to exceed the City of Ottawa Zoning By-
law 2008-250 requirements. The stacking lane will accommodate a total of 12 vehicles, 8 of
which will be between the first order board and the entrance to the stacking lane.

McDonald's Restaurants of Canada Limited 886 March Road McDonald's Transportation Study
March 2013 Project # 7306
Page ii
Transportation Demand Management
The site is currently well served by transit along its frontage, sidewalks on both frontages and
a bicycle lane on both sides of March Road. The following transportation demand
management plan elements are proposed to be incorporated into the site:
Internal sidewalk connections to the existing sidewalk network on March Road and
Maxwell Bridge Road, which in turn will provide access to the existing transit routes in
the neighbourhood.
Pedestrian access in the form of paved walkways, marked pedestrian crossings, and
wheelchair / stroller accessible ramps to be provided internally to facilitate the flow of
pedestrians throughout the site.
Areas designated for short-term bicycle parking will be clearly marked and located close
to the restaurant entrance. Bicycle parking will be protected from the elements by use of
an overhead canopy, well lit and easily accessible. Access will be provided via the site’s
driveways and internal pedestrian pathways to the existing bicycle lanes on March Road.

McDonald's Restaurants of Canada Limited 886 March Road McDonald's Transportation Study
March 2013 Project # 7306
Page iii
TABLE OF CONTENTS
Executive Summary ................................................................................................................ 1 1. Introduction ................................................................................................................... 1
1.1 Background ............................................................................................................ 1
1.2 Scope of Work ....................................................................................................... 1 1.3 Intersection Operations Analysis Methodology .................................................... 1
2. Existing Conditions ....................................................................................................... 4 2.1 Site Context ........................................................................................................... 4 2.2 Existing Road Network .......................................................................................... 4
2.3 Existing Traffic Volumes ...................................................................................... 4 2.4 Transit Availability ................................................................................................ 4
2.5 Existing Traffic Operations ................................................................................... 7
3. 2018 Background Traffic Conditions .......................................................................... 8 3.1 Planned Road Network Improvements .................................................................. 8 3.2 Background Development ..................................................................................... 8 3.3 Background Traffic Volumes ................................................................................ 8
3.4 Background Traffic Operations ............................................................................. 8
4. Proposed Development ............................................................................................... 11 4.1 Conceptual Site Plan ............................................................................................ 11 4.2 Site Traffic Generation ........................................................................................ 11 4.3 Site Traffic Distribution ....................................................................................... 11
5. Total Traffic Conditions ............................................................................................. 16 5.1 Intersection Operations ........................................................................................ 16
6. Site Review ................................................................................................................... 18 6.1 Parking Supply Requirements ............................................................................. 18
6.2 Drive-Through Operations ................................................................................... 18 6.3 Traffic Demand Management Plan ...................................................................... 18
6.3.1 Pedestrian Access ....................................................................................... 18 6.3.2 Access to Local Transit .............................................................................. 18 6.3.3 Bicycle Accommodation ............................................................................ 19
6.3.4 Implementation .......................................................................................... 19
7. Conclusions .................................................................................................................. 20 7.1 Traffic Operations ................................................................................................ 20
7.2 Parking and Drive-Through ................................................................................. 20 7.3 Transportation Demand Management ................................................................. 20

McDonald's Restaurants of Canada Limited 886 March Road McDonald's Transportation Study
March 2013 Project # 7306
Page iv
Tables
Table 1: Signalized Intersection LOS Definitions .................................................................... 3 Table 2: Existing Signalized Intersection Operations ............................................................... 7 Table 3: Existing Unsignalized Intersection Operations .......................................................... 7
Table 4: Background Traffic Signalized Intersection Operations ............................................ 8 Table 5: Background Traffic Unsignalized Intersection Operations ...................................... 10 Table 6: Site Trip Generation ................................................................................................. 11 Table 7: New Site Traffic Distribution ................................................................................... 11 Table 8: 2018 Total Signalized Intersection Operations ......................................................... 16
Table 9: 2018 Total Unsignalized Intersection Operations .................................................... 16
Exhibits
Exhibit 1: Site Location ............................................................................................................ 2
Exhibit 2: Existing Road Network ............................................................................................ 5 Exhibit 3: Existing Traffic Volumes ......................................................................................... 6
Exhibit 4: 2018 Background Traffic Volumes.......................................................................... 9 Exhibit 5: Conceptual Site Plan .............................................................................................. 12 Exhibit 6: New Site Traffic Volumes ..................................................................................... 13
Exhibit 7: Pass-by Traffic Volumes ........................................................................................ 14 Exhibit 8: Total Site Traffic Volumes .................................................................................... 15
Exhibit 9: 2018 Total Traffic Volumes ................................................................................... 17
Appendices
A Existing Traffic Operations
B 2018 Background Traffic Operations
C Trip Generation Review
D 2018 Total Traffic Operations

McDonald's Restaurants of Canada Limited 886 March Road McDonald's Transportation Study
March 2013 Project # 7306
Page 1
1. INTRODUCTION
1.1 Background
HDR Corporation (“HDR”) was retained by McDonald’s Restaurants of Canada Limited to
undertake a transportation study for a proposed McDonald’s restaurant, with drive-through
window, to be located in the northeast quadrant of March Road and Maxwell Bridge Road in
Ottawa, Ontario. The site location is shown in Exhibit 1. The site is currently occupied by a
single family dwelling, which will be removed as part of the redevelopment.
The proposed restaurant will be 6,137 SF (“square feet”) in size, with unsignalized driveway
access to both March Road and Maxwell Bridge Road. The driveway to March Road will be
restricted to right-in / right-out operations, while the Maxwell Bridge Road driveway will
provide full movement access and will be located opposite an existing commercial driveway
to the south. A transportation study is required as part of a Zoning By-law amendment
application and site plan control application.
1.2 Scope of Work
The proposed scope of work, as confirmed with the City, is described below:
Scenarios 2013 Existing Traffic Conditions
2018 Background Traffic Conditions
(growth plus background developments)
2018 Total Traffic Conditions
(background traffic plus site traffic, existing site traffic removed)
Time
Periods
Weekday AM Peak Hour (7:00am – 9:00am)
Weekday PM Peak Hour (4:00pm – 6:00pm)
Saturday Peak Hour (11:00am – 2:00pm)
Intersections Maxwell Bridge Rd. / Trinity Common Driveway / Proposed Driveway
March Road / Maxwell Bridge Road
March Road / Proposed Driveway
1.3 Intersection Operations Analysis Methodology
Intersection operations were assessed for study intersections using the software program
Synchro 8, which employs methodology from the Highway Capacity Manual (HCM2000),
published by the Transportation Research Board National Research Council. Synchro 8 can
analyze both signalized and unsignalized intersections in a road corridor or network taking
into account spacing, interaction, queues and operations between intersections. Synchro
relates level of service to delay; however, we have followed the City’s guidelines.

McDonald’s Restaurants of Canada Limited 886 March Road McDonald’s Transportation Study
March 2013Project #7306
Exhibit 1 : Site Location Not To Scale
SITE
Hal
ton
Terr
ace
Halton
Terrace
OldCarp
Road
March
Road

McDonald's Restaurants of Canada Limited 886 March Road McDonald's Transportation Study
March 2013 Project # 7306
Page 3
The City’s guidelines relates volume to capacity (v/c) ratios to level of service (LOS), for
signalized intersections. Level of service definitions are contained in Table 1.
Table 1: Signalized Intersection LOS Definitions
The signalized intersection assessment identifies v/c
ratios for the overall intersection and for each
individual movement; these v/c ratios have
corresponding LOS shown to the left.
The signalized intersection analysis considers a measure of performance as:
The capacity of intersection movements, based on a volume to capacity ratio; and
The level of service of each movement, which is directly correlated to v/c ratio.
The unsignalized intersection operation assessment identifies level of service, where the level
of service is between A and F. Volume to capacity ratios are only identified where level of
service is F.
The two-way unsignalized intersection analysis considers two measures of performance:
The level of service for the critical movements, which is based on the average control
delay per vehicle for the various critical movements within the intersection; and
The volume to capacity ratios of the critical intersection movements, when LOS is F
only. The volume to capacity ratio is then based on gap analysis.
Parameters to be used in the Synchro analysis reflect the City of Ottawa Transportation
Impact Guidelines, which states that Synchro default values are to be used, except for:
Minimum Green Time: 10 seconds for side street through movements, 5 seconds for left-turn phases.
Vehicle Clearance: Must consist of amber and all red display.
Duration in accordance with Ontario Traffic Manual Book 12.
Minimum Walk Time: 7 seconds
Walking Speed: 1.2 m/sec; 1.1 m/sec if near old age home, school or shopping centre
Saturation Flow Rate: 1800 vehicles per hour of green per lane, unless alternative rates can be justified
LOS Volume to Capacity Ratio
A 0 to 0.60
B 0.61 to 0.70
C 0.71 to 0.80
D 0.81 to 0.90
E 0.91 to 1.00
F >1.00

McDonald's Restaurants of Canada Limited 886 March Road McDonald's Transportation Study
March 2013 Project # 7306
Page 4
2. EXISTING CONDITIONS
2.1 Site Context
The site is located in the northeast quadrant of March Road and Maxwell Bridge Road on the
northern urban edge of Kanata in the City of Ottawa. It is surrounded by residential to the
west, east and the southwest, farmland to the north, and commercial uses directly to the
south. There is an existing residential house on the property that will be removed.
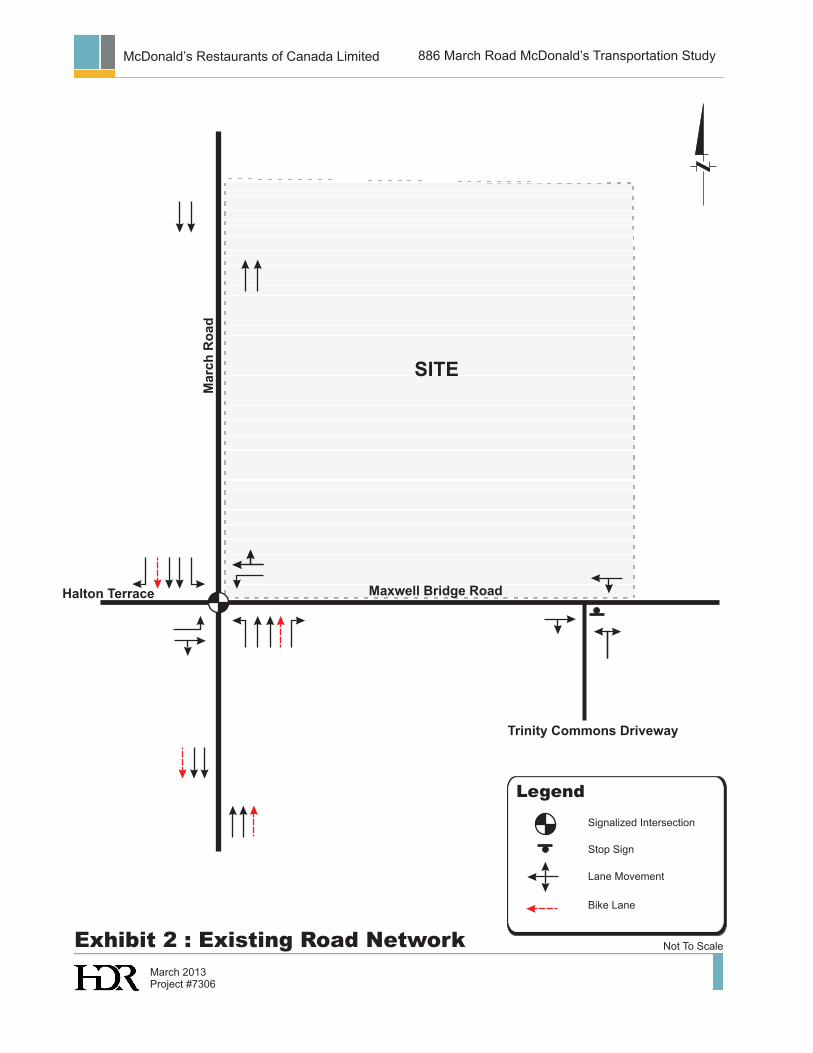
2.2 Existing Road Network
The existing road network is illustrated in Exhibit 2, and is described below:
March Road
(Regional
Road 49)
March road is a north-south arterial road under the jurisdiction of the City
of Ottawa. It has a 4-lane urban cross-section with auxiliary turn lanes
provided at Maxwell Bridge Road and has a posted speed limit of 80 km/h.
Sidewalks and bicycle lanes are provided on both sides of the road. To the
north of Maxwell Bridge Road, March Road narrows to a two-lane rural
cross section with paved shoulders, no sidewalks, and no bicycle lanes.
Maxwell
Bridge Road
Maxwell Bridge Road is an east-west collector road under the jurisdiction
of the City of Ottawa. It has a 2-lane urban cross-section with left-turn lanes
provided at March Road with no posted speed limit (assumed to be 50
km/h). Sidewalks are provided on both sides of the road. Maxwell Bridge
Road becomes Halton Terrace west of March Road.
2.3 Existing Traffic Volumes
Turning movement traffic counts were undertaken on behalf of HDR by the Traffic
Information Group on Thursday January 31, 2013 during the AM and PM peak periods
(7:00am – 9:00am and 4:00pm–6:00pm), and Saturday February 2, 2013 during the midday
peak period (11:00am – 2:00pm). Counts were undertaken at the signalized intersection of
March Road and Maxwell Bridge Road, as well as at the existing commercial driveway on
Maxwell Bridge Road, opposite the proposed site access. Existing traffic volumes are shown
in Exhibit 3.
2.4 Transit Availability
OC Transpo operates one bus route, Route 60, in the vicinity of the site along Maxwell
Bridge Road. The intersection of Maxwell Bridge Road and March Road is the route
terminus, while the opposite end of the route is downtown. The route 60 operates southbound
during the weekday AM and northbound during the PM, with headways of approximately 15
minutes, between 5:30am to 7:00pm. Route 93 Kanata North is also available one block
south of site and operates during all time periods, seven days a week.
SITE
Exhibit 2 : Existing Road Network Not To Scale
Legend
Signalized Intersection
Stop Sign
Lane Movement
March 2013Project #7306
Maxwell Bridge Road
Marc
h R
oad
Halton Terrace
Trinity Commons Driveway
Bike Lane
McDonald’s Restaurants of Canada Limited 886 March Road McDonald’s Transportation Study

Exhibit 3 : Existing Traffic Volumes Not To Scale
Legend
Signalized Intersection
Stop Sign
Right Turn
00 (00) [00]Weekday AM (PM) [SAT]Peak Hour Traffic Volumes
10 (98) [54]13 (43) [30]67 (66) [57]
10 (
11)
[1
0]
743
(248)
[377]
41 (
37)
[5
1]
[8] (9) 6[22] (25) 8[36] (50) 102
[68] (
110)
35
[322] (
852)
179
[48] (
77)
25
794
(296)
[438]
[384] (9
59)
195
Proposed Right-In/Right-Out Driveway
Marc
h R
oad
68 (61) [52]19 (29) [12]
[56] (95) 47[81] (50) 27
[100] (1
34)
22
[41] (6
2)
8
Halton Terrace
Pro
po
sed
Dri
vew
ay
March 2013Project #7306
Trinity Commons Driveway
SITE
Maxwell Bridge Road
Through
Left Turn
McDonald’s Restaurants of Canada Limited 886 March Road McDonald’s Transportation Study

McDonald's Restaurants of Canada Limited 886 March Road McDonald's Transportation Study
March 2013 Project # 7306
Page 7
Schedule D of the City of Ottawa Official Plan shows a new bus rapid transit route along
March Road. The route terminus is shown to be in close proximity to the site, with the route
extending to the south along March Road, towards downtown. A park and ride is also
proposed at the route terminus, in the vicinity of the site. Details pertaining to the proposed
bus rapid transit line have not yet been determined.
2.5 Existing Traffic Operations
Based on the existing traffic volumes shown in Exhibit 3, existing intersection operations
were assessed. Current signal timings were obtained from the City and utilized in this
analysis. Intersection operations are summarized in Table 2 and Table 3 for signalized and
unsignalized intersections, respectively. Detailed reports are provided in Appendix A.
Table 2: Existing Signalized Intersection Operations
Intersection & Critical Movement
Weekday AM
Peak Hour
Weekday PM
Peak Hour
Saturday
Peak Hour
LOS v/c LOS v/c LOS v/c
March Road & Maxwell Bridge Road A 0.34 A 0.39 A 0.20
Eastbound Left-turn A 0.04 A 0.10 A 0.08
Eastbound Through-right A 0.12 A 0.19 A 0.18
Westbound Left-turn A 0.59 A 0.56 A 0.52
Westbound Through-right A 0.08 A 0.35 A 0.25
Northbound Left-turn A 0.07 A 0.14 A 0.11
Northbound Through A 0.08 A 0.37 A 0.14
Northbound Right-turn A 0.02 A 0.05 A 0.03
Southbound Left-turn A 0.05 A 0.09 A 0.07
Southbound Through A 0.32 A 0.11 A 0.16
Southbound Right-turn A 0.01 A 0.01 A 0.01 Notes: v/c – volume to capacity ratio, LOS – level of service
Under existing traffic conditions, there is excess capacity at the signalized intersection of
March Road & Halton Terrace / Maxwell Bridge Road. All movements are operating with
level of service A and with volume to capacity ratios of 0.59 or better.
Table 3: Existing Unsignalized Intersection Operations
Intersection & Critical Movement
Weekday AM
Peak Hour
Weekday PM
Peak Hour
Saturday
Peak Hour
LOS v/c LOS v/c LOS v/c
Maxwell Bridge Road / Trinity Commons Driveway A - A - A -
Eastbound Through-Left - - - - - -
Westbound Left-Through A - A - A -
Northbound Left-Right A - B - B - Notes: v/c – volume to capacity ratio, LOS – level of service, Only critical movements are shown.
Under existing traffic conditions all critical movements at unsignalized intersections are
operating with level of service B or better.
McDonald's Restaurants of Canada Limited 886 March Road McDonald's Transportation Study
March 2013 Project # 7306
Page 8
3. 2018 BACKGROUND TRAFFIC CONDITIONS
3.1 Planned Road Network Improvements
There are no planned road improvements in the vicinity of the site by the 2018 horizon year.
3.2 Background Development
No background developments have been identified for inclusion in this report. It is assumed
that any traffic from future background developments is captured in the assumed background
growth discussed below.
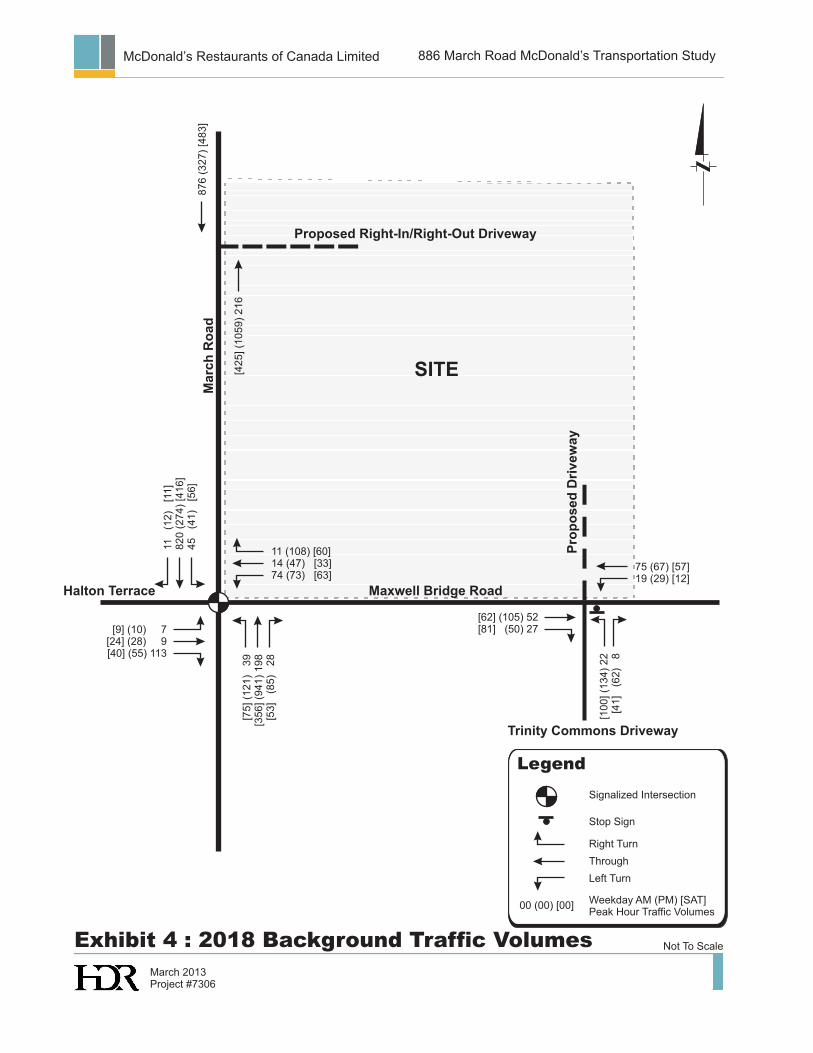
3.3 Background Traffic Volumes
Background traffic volumes consist of existing traffic and traffic as a result of background
growth. An annual growth rate of 2% per year was applied to all movements at the
intersection of March Road and Maxwell Bridge Road, as well as to through movements at
the existing retail driveway to the south of the subject site. However, a review of growth
since 2005 has shown that traffic volumes are decreasing. Therefore, this is a conservative
approach. No growth was assumed for the retail development to the south as it is an existing
development. Background traffic volumes to the 2018 horizon year are shown in Exhibit 4.
3.4 Background Traffic Operations
Background 2018 traffic operations were assessed based on the background traffic volumes
shown in Exhibit 4 and the existing road network shown in Exhibit 2. Intersection
operations are summarized in Table 4 and Table 5 for signalized and unsignalized
intersections, respectively. Detailed reports are contained in Appendix B.
Table 4: Background Traffic Signalized Intersection Operations
Intersection & Critical Movement
Weekday AM
Peak Hour
Weekday PM
Peak Hour
Saturday
Peak Hour
LOS v/c LOS v/c LOS v/c
March Road & Maxwell Bridge Road A 0.39 A 0.43 A 0.22
Eastbound Left-turn A 0.05 A 0.11 A 0.08
Eastbound Through-right A 0.13 A 0.21 A 0.19
Westbound Left-turn B 0.66 A 0.59 A 0.55
Westbound Through-right A 0.09 A 0.43 A 0.27
Northbound Left-turn A 0.09 A 0.16 A 0.12
Northbound Through A 0.09 A 0.42 A 0.15
Northbound Right-turn A 0.02 A 0.06 A 0.04
Southbound Left-turn A 0.06 A 0.11 A 0.09
Southbound Through A 0.36 A 0.13 A 0.18
Southbound Right-turn A 0.01 A 0.01 A 0.01 Notes: v/c – volume to capacity ratio, LOS – level of service
SITE
Exhibit 4 : 2018 Background Traffic Volumes Not To Scale
11 (108) [60]14 (47) [33]74 (73) [63]
11 (
12)
[1
1]
820
(274)
[416]
45 (
41)
[5
6]
[9] (10) 7[24] (28) 9[40] (55) 113
[75] (1
21)
39
[356] (9
41)
198
[53] (8
5)
28
876
(327)
[483]
[425] (1
059)
216
Marc
h R
oad
75 (67) [57]19 (29) [12]
[62] (105) 52[81] (50) 27
[100] (1
34)
22
[41] (6
2)
8
Halton Terrace
Pro
po
sed
Dri
vew
ay
March 2013Project #7306
Trinity Commons Driveway
Maxwell Bridge Road
Proposed Right-In/Right-Out Driveway
Legend
Signalized Intersection
Stop Sign
Right Turn
00 (00) [00]
Through
Left Turn
Weekday AM (PM) [SAT]Peak Hour Traffic Volumes
McDonald’s Restaurants of Canada Limited 886 March Road McDonald’s Transportation Study

McDonald's Restaurants of Canada Limited 886 March Road McDonald's Transportation Study
March 2013 Project # 7306
Page 10
Under 2018 background traffic conditions, there will be excess capacity at the signalized
intersection of March Road & Halton Terrace / Maxwell Bridge Road. Most movements will
operate with level of service A and with volume to capacity ratios of 0.59 or better. The one
exception is the westbound left-turn, which will operate with a volume to capacity ratio of
0.66 and a level of service B during the weekday AM peak hour.
Table 5: Background Traffic Unsignalized Intersection Operations
Intersection & Critical Movement
Weekday AM
Peak Hour
Weekday PM
Peak Hour
Saturday
Peak Hour
LOS v/c LOS v/c LOS v/c
Maxwell Bridge Road / Trinity Commons Driveway A - A - A -
Eastbound Through-Left - - - - - -
Westbound Left-Through A - A - A -
Northbound Left-Right A - B - B - Notes: v/c – volume to capacity ratio, LOS – level of service, Only critical movements are shown.
Under 2018 background traffic conditions all critical movements at unsignalized
intersections will operate with level of service B or better. No changes to the road network
are required.

McDonald's Restaurants of Canada Limited 886 March Road McDonald's Transportation Study
March 2013 Project # 7306
Page 11
4. PROPOSED DEVELOPMENT
4.1 Conceptual Site Plan
The proposal is for a 6,137 SF McDonald’s restaurant with drive-through window. Access
will be provided by two unsignalized driveways. One full movement driveway will be
located on Maxwell Bridge Road opposite an existing commercial plaza driveway to the
south. A proposed driveway on March Road will be restricted to right-in / right-out
operations. The conceptual site plan is shown in Exhibit 5.
4.2 Site Traffic Generation
Site traffic generation for the proposed McDonald’s restaurant was based on rates from our
in-house database, which includes several McDonald’s restaurants located in the City of
Ottawa. Only McDonald’s with drive-through windows were used. The selected trip rates
and the estimated site trips are summarized in Table 6. Pass-by for the proposed
development was based on the Institute of Transportation Engineers publication Trip
Generation Manual, 9th
Edition, which suggests pass-by for restaurants with drive-through
windows is approximately 50%. We have assumed 40% pass-by traffic, to be conservative
(detailed trip generation is shown in Appendix C).
Table 6: Site Trip Generation
McDonald’s with Drive-Through Window Weekday
AM Peak Hour
Weekday
PM Peak Hour
Saturday
Peak Hour
Rate (trips / 1000 SF) 23.30 18.90 58.01
Gross Trips 143 116 356
Pass-by Trips (40%) 58 48 144
Inbound trips 44 36 110
Outbound trips 41 32 102
New Trips 85 68 212
4.3 Site Traffic Distribution
The distribution of new site trips was based on the report titled March Road Commercial
Traffic Impact Update (September 2008) prepared by iTRANS Consulting Inc., and is
summarized in Table 7. The distribution of pass-by trips was based on existing traffic.
Table 7: New Site Traffic Distribution
New site traffic is shown in Exhibit 6.
Pass-by site traffic is shown in Exhibit 7.
Total site traffic is shown in Exhibit 8.
To / From Via Distribution
North March Road 15%
South March Road 75%
East Halton Terrace /
Old Carp Road 5%
West Maxwell Bridge Road 5%

Exhibit 5 : Conceptual Site Plan
March 2013Project # 7306
886 March Road McDonald’s Transportation Study
Not To Scale
McDonald’s Restaurants of Canada Limited

SITE
Exhibit 6 : Net Site Traffic Volumes Not To Scale
2 (2) [5]31 (23) [77]
7(5
) [1
7]
[1] (0) 0[4] (2) 2
[21] (7
) 8
[62] (2
0)
25
Marc
h R
oad
Halton Terrace
Pro
po
sed
Dri
vew
ay
6 (5) [15]
7 (
5)
[17]
[22] (7
) 8
2 (2) [5]
33 (
25)
[82]
2 (
2)
[5
]
[83] (27) 34
March 2013Project #7306
Trinity Commons Driveway
Maxwell Bridge Road
Proposed Right-In/Right-Out Driveway
Legend
Signalized Intersection
Stop Sign
Right Turn
00 (00) [00]
Through
Left Turn
Weekday AM (PM) [SAT]Peak Hour Traffic Volumes
McDonald’s Restaurants of Canada Limited 886 March Road McDonald’s Transportation Study

SITE
Exhibit 7 : Pass-by Traffic Volumes Not To Scale
Marc
h R
oad
Halton Terrace
Pro
po
sed
Dri
vew
ay
6 (15) [29]
[-29] (-
15)
-6
[7] (
4)
1
2 (3) [10]-2 (-3) [-10]
21 (
7)
[39]
2(2
) [4
]
[55] (17) 26[-4] (-2) -2
March 2013Project #7306
19 (4) [29]
-19
(-4)
[-29]
19 (4
) [29]
[-22] (-
11)
-5
[22] (
11)
5
Trinity Commons Driveway
Maxwell Bridge Road
Proposed Right-In/Right-Out Driveway
Legend
Signalized Intersection
Stop Sign
Right Turn
00 (00) [00]
Through
Left Turn
Weekday AM (PM) [SAT]Peak Hour Traffic Volumes
McDonald’s Restaurants of Canada Limited 886 March Road McDonald’s Transportation Study
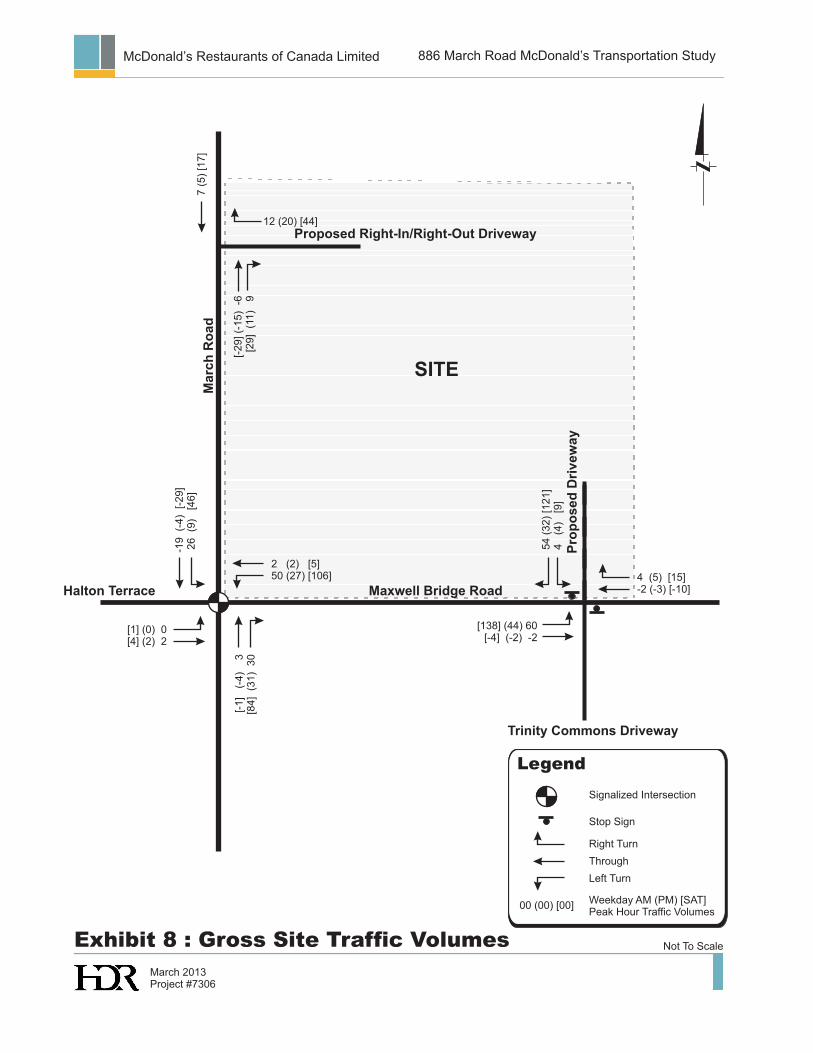
Exhibit 8 : Gross Site Traffic Volumes Not To Scale
Marc
h R
oad
Halton Terrace
Pro
po
sed
Dri
vew
ay
12 (20) [44]
7(5
) [1
7]
[-29] (-
15)
-6
[29] (
11)
9
4 (5) [15]-2 (-3) [-10]
54 (
32)
[121]
4(4
) [9
]
[138] (44) 60[-4] (-2) -2
March 2013Project #7306
2 (2) [5]50 (27) [106]
-19
(-4)
[-2
9]
26 (9
) [4
6]
[1] (0) 0[4] (2) 2
[-1] (-
4)
3
[84] (
31)
30
Trinity Commons Driveway
SITE
Maxwell Bridge Road
Proposed Right-In/Right-Out Driveway
Legend
Signalized Intersection
Stop Sign
Right Turn
00 (00) [00]
Through
Left Turn
Weekday AM (PM) [SAT]Peak Hour Traffic Volumes
McDonald’s Restaurants of Canada Limited 886 March Road McDonald’s Transportation Study

McDonald's Restaurants of Canada Limited 886 March Road McDonald's Transportation Study
March 2013 Project # 7306
Page 16
5. TOTAL TRAFFIC CONDITIONS
The 2018 background traffic volumes shown in Exhibit 4 were combined with the site traffic
from Exhibit 8 to obtain the 2018 total traffic volumes shown in Exhibit 9.
5.1 Intersection Operations
Based on the 2018 total traffic volumes shown in Exhibit 9, intersection operations were
assessed and are summarized in Table 8 and Table 9 for signalized and unsignalized
intersections, respectively. Detailed reports are contained in Appendix D.
Table 8: 2018 Total Signalized Intersection Operations
Intersection & Critical Movement
Weekday AM
Peak Hour
Weekday PM
Peak Hour
Saturday
Peak Hour
LOS v/c LOS v/c LOS v/c
March Road & Halton Terrace /
Maxwell Bridge Road A 0.43 A 0.46 A 0.31
Eastbound Left-turn A 0.03 A 0.08 A 0.04
Eastbound Through-right A 0.12 A 0.18 A 0.12
Westbound Left-turn C 0.75 B 0.66 B 0.70
Westbound Through-right A 0.07 A 0.39 A 0.16
Northbound Left-turn A 0.09 A 0.16 A 0.14
Northbound Through A 0.10 A 0.43 A 0.18
Northbound Right-turn A 0.04 A 0.08 A 0.10
Southbound Left-turn A 0.10 A 0.13 A 0.18
Southbound Through A 0.38 A 0.13 A 0.19
Southbound Right-turn A 0.01 A 0.01 A 0.01 Notes: v/c – volume to capacity ratio, LOS – level of service
Under 2018 total traffic conditions there will be excess capacity at the signalized intersection
of March Road and Halton Terrace / Maxwell Bridge Road. All movements will operate with
level of service C or better, and with volume to capacity ratios of 0.75 or better.
Table 9: 2018 Total Unsignalized Intersection Operations
Intersection & Critical Movement
Weekday AM
Peak Hour
Weekday PM
Peak Hour
Saturday
Peak Hour
LOS v/c LOS v/c LOS v/c
Maxwell Bridge Road / Trinity Commons Driveway
/ Proposed Driveway A - A - A -
Eastbound Left-Through-Right A - A - A -
Westbound Left-Through-Right A - A - A -
Northbound Left-Through-Right B - C - C -
Southbound Left-Through-Right A - A - A -
March Road / Proposed Driveway A - A - A -
Westbound Right-turn A - B - A - Notes: v/c – volume to capacity ratio, LOS – level of service, Only critical movements are shown.
All movements at the unsignalized intersections will operate with level of service C or better.
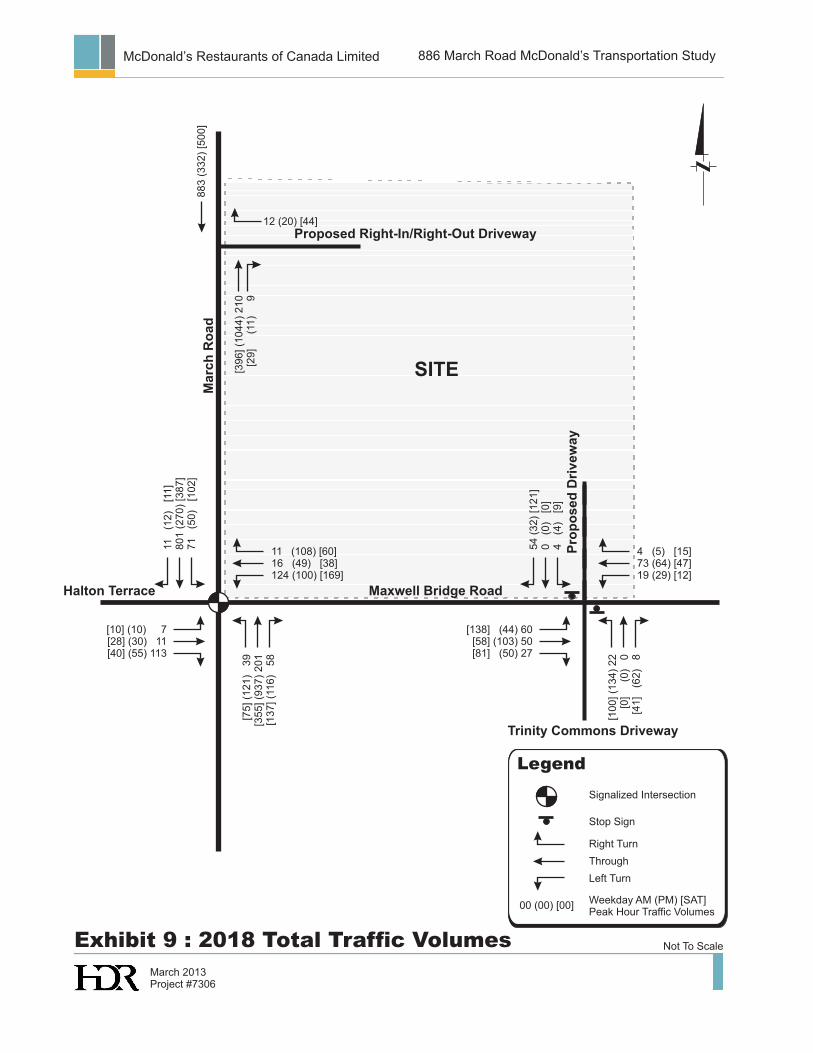
Exhibit 9 : 2018 Total Traffic Volumes Not To Scale
11 (108) [60]16 (49) [38]124 (100) [169]
11 (
12)
[1
1]
801
(270)
[387]
71 (
50)
[1
02]
[10] (10) 7[28] (30) 11[40] (55) 113
[75] (1
21)
39
[355] (9
37)
201
[137] (1
16)
58
Marc
h R
oad
Halton Terrace
Pro
po
sed
Dri
vew
ay
12 (20) [44]
883
(332)
[500]
[396] (1
044)
210
[29] (1
1)
9
4 (5) [15]73 (64) [47]19 (29) [12]
54 (
32)
[121]
0(0
) [0
]4 (
4)
[9
]
[138] (44) 60[58] (103) 50[81] (50) 27
[100] (1
34)
22
[0] (0
) 0
[41] (6
2)
8
March 2013Project #7306
Trinity Commons Driveway
SITE
Maxwell Bridge Road
Proposed Right-In/Right-Out Driveway
Legend
Signalized Intersection
Stop Sign
Right Turn
00 (00) [00]
Through
Left Turn
Weekday AM (PM) [SAT]Peak Hour Traffic Volumes
McDonald’s Restaurants of Canada Limited 886 March Road McDonald’s Transportation Study
McDonald's Restaurants of Canada Limited 886 March Road McDonald's Transportation Study
March 2013 Project # 7306
Page 18
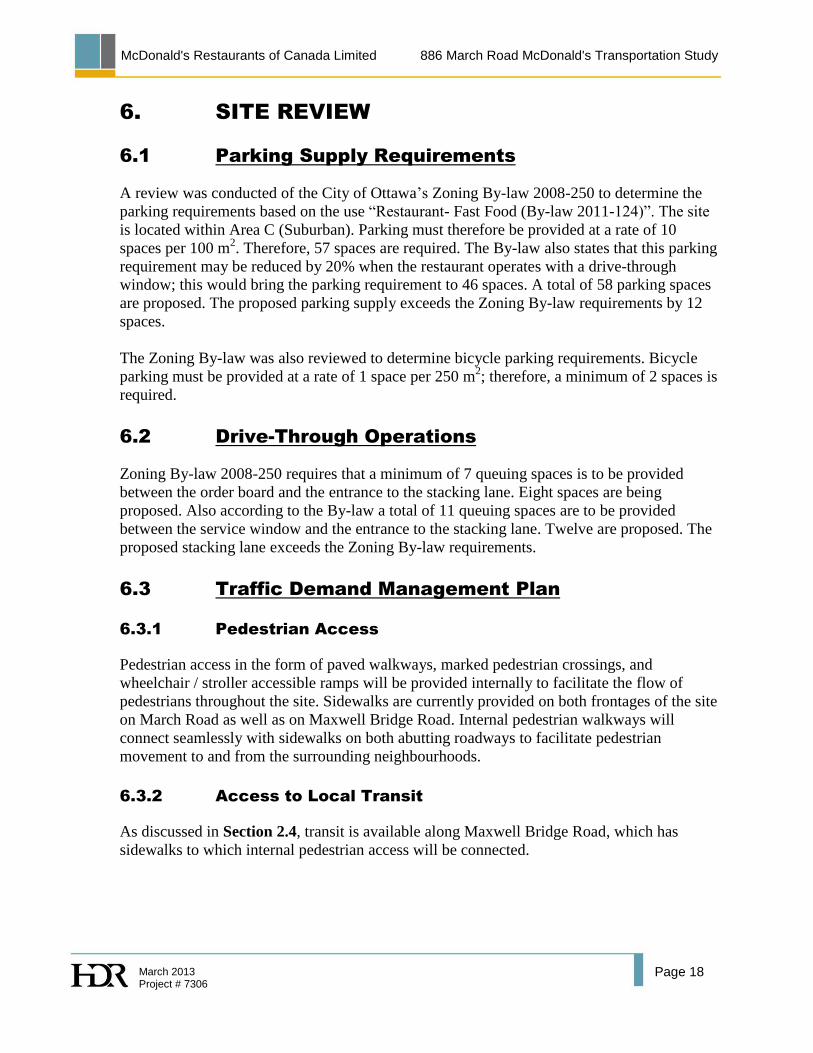
6. SITE REVIEW
6.1 Parking Supply Requirements
A review was conducted of the City of Ottawa’s Zoning By-law 2008-250 to determine the
parking requirements based on the use “Restaurant- Fast Food (By-law 2011-124)”. The site
is located within Area C (Suburban). Parking must therefore be provided at a rate of 10
spaces per 100 m2. Therefore, 57 spaces are required. The By-law also states that this parking
requirement may be reduced by 20% when the restaurant operates with a drive-through
window; this would bring the parking requirement to 46 spaces. A total of 58 parking spaces
are proposed. The proposed parking supply exceeds the Zoning By-law requirements by 12
spaces.
The Zoning By-law was also reviewed to determine bicycle parking requirements. Bicycle
parking must be provided at a rate of 1 space per 250 m2; therefore, a minimum of 2 spaces is
required.
6.2 Drive-Through Operations
Zoning By-law 2008-250 requires that a minimum of 7 queuing spaces is to be provided
between the order board and the entrance to the stacking lane. Eight spaces are being
proposed. Also according to the By-law a total of 11 queuing spaces are to be provided
between the service window and the entrance to the stacking lane. Twelve are proposed. The
proposed stacking lane exceeds the Zoning By-law requirements.
6.3 Traffic Demand Management Plan
6.3.1 Pedestrian Access
Pedestrian access in the form of paved walkways, marked pedestrian crossings, and
wheelchair / stroller accessible ramps will be provided internally to facilitate the flow of
pedestrians throughout the site. Sidewalks are currently provided on both frontages of the site
on March Road as well as on Maxwell Bridge Road. Internal pedestrian walkways will
connect seamlessly with sidewalks on both abutting roadways to facilitate pedestrian
movement to and from the surrounding neighbourhoods.
6.3.2 Access to Local Transit
As discussed in Section 2.4, transit is available along Maxwell Bridge Road, which has
sidewalks to which internal pedestrian access will be connected.

McDonald's Restaurants of Canada Limited 886 March Road McDonald's Transportation Study
March 2013 Project # 7306
Page 19
6.3.3 Bicycle Accommodation
Areas designated for short-term bicycle parking will be clearly marked and located close to
the restaurant entrance. Bicycle parking will be protected from the elements by use of an
overhead canopy, well lit and easily accessible. Access will be provided via the site’s
driveways and internal pedestrian pathways to the existing bicycle lanes on March Road.
6.3.4 Implementation
We recommend concentrating on encouraging alternative modes of travel such as bicycling
and walking, by providing good internal and external connectivity for these modes, and
accommodation for bicycle parking.
McDonald's Restaurants of Canada Limited 886 March Road McDonald's Transportation Study
March 2013 Project # 7306
Page 20
7. CONCLUSIONS
7.1 Traffic Operations
Study intersections are currently operating with excess capacity under existing conditions,
and will continue to do so under background and total traffic conditions.
The existing median on March Road may need to be extended to the north to restrict the
March Road driveway to right-in / right-out operations.
7.2 Parking and Drive-Through
Parking for the proposed restaurant will be provided in the amount of 58 spaces. This
exceeds the requirements of the City of Ottawa Zoning By-law 2008-250 by 12 spaces. The
Zoning By-law also requires a minimum of two bicycle parking spaces, which will be
provided.
The drive-through stacking lane will be designed to exceed the City of Ottawa Zoning By-
law 2008-250 requirements. The stacking lane will accommodate a total of 12 vehicles, 8 of
which will be between the first order board and the entrance to the stacking lane.
7.3 Transportation Demand Management
The site is currently well served by transit along its frontage, sidewalks on both frontages and
a bicycle lane on both sides of March Road. The following transportation demand
management plan elements are proposed to be incorporated into the site:
Internal sidewalk connections to the existing sidewalk network on March Road and
Maxwell Bridge Road, which in turn will provide access to the existing transit routes in
the neighbourhood.
Pedestrian access in the form of paved walkways, marked pedestrian crossings, and
wheelchair / stroller accessible ramps to be provided internally to facilitate the flow of
pedestrians throughout the site.
Areas designated for short-term bicycle parking will be clearly marked and located close
to the restaurant entrance. Bicycle parking will be protected from the elements by use of
an overhead canopy, well lit and easily accessible. Access will be provided via the site’s
driveways and internal pedestrian pathways to the existing bicycle lanes on March Road.

Appendix A
Existing Traffic Operations

HCM Signalized Intersection Capacity Analysis AM Peak Hour
3: March Road & Old Carp Road/Maxwell Bridge Road 2013 Existing Traffic Volumes
HDR Corporation Synchro 8 Report
Page 1
Movement EBL EBT EBR WBL WBT WBR NBL NBT NBR SBL SBT SBR
Lane Configurations
Volume (vph) 6 8 102 67 13 10 35 179 25 41 743 10
Ideal Flow (vphpl) 1800 1800 1800 1800 1800 1800 1800 1800 1800 1800 1800 1800
Total Lost time (s) 6.6 6.6 6.6 6.6 6.4 6.6 6.6 6.4 6.6 6.6
Lane Util. Factor 1.00 1.00 1.00 1.00 1.00 0.95 1.00 1.00 0.95 1.00
Frpb, ped/bikes 1.00 1.00 1.00 1.00 1.00 1.00 1.00 1.00 1.00 1.00
Flpb, ped/bikes 1.00 1.00 1.00 1.00 1.00 1.00 1.00 1.00 1.00 1.00
Frt 1.00 0.86 1.00 0.93 1.00 1.00 0.85 1.00 1.00 0.85
Flt Protected 0.95 1.00 0.95 1.00 0.95 1.00 1.00 0.95 1.00 1.00
Satd. Flow (prot) 1729 1552 1693 1628 1679 3262 1432 1601 3390 1406
Flt Permitted 0.74 1.00 0.65 1.00 0.35 1.00 1.00 0.63 1.00 1.00
Satd. Flow (perm) 1351 1552 1158 1628 619 3262 1432 1055 3390 1406
Peak-hour factor, PHF 0.97 0.97 0.97 0.97 0.97 0.97 0.97 0.97 0.97 0.97 0.97 0.97
Adj. Flow (vph) 6 8 105 69 13 10 36 185 26 42 766 10
RTOR Reduction (vph) 0 94 0 0 9 0 0 0 8 0 0 3
Lane Group Flow (vph) 6 19 0 69 14 0 36 185 18 42 766 7
Confl. Peds. (#/hr) 1
Heavy Vehicles (%) 0% 13% 0% 2% 8% 0% 3% 6% 8% 8% 2% 10%
Turn Type Perm NA Perm NA pm+pt NA Perm pm+pt NA Perm
Protected Phases 4 8 5 2 1 6
Permitted Phases 4 8 2 2 6 6
Actuated Green, G (s) 12.2 12.2 12.2 12.2 87.0 83.1 83.1 89.4 84.3 84.3
Effective Green, g (s) 12.2 12.2 12.2 12.2 87.0 83.1 83.1 89.4 84.3 84.3
Actuated g/C Ratio 0.10 0.10 0.10 0.10 0.72 0.69 0.69 0.75 0.70 0.70
Clearance Time (s) 6.6 6.6 6.6 6.6 6.4 6.6 6.6 6.4 6.6 6.6
Vehicle Extension (s) 3.0 3.0 3.0 3.0 3.0 3.0 3.0 3.0 3.0 3.0
Lane Grp Cap (vph) 137 157 117 165 483 2258 991 809 2381 987
v/s Ratio Prot 0.01 0.01 c0.00 0.06 0.00 c0.23
v/s Ratio Perm 0.00 c0.06 0.05 0.01 0.04 0.00
v/c Ratio 0.04 0.12 0.59 0.08 0.07 0.08 0.02 0.05 0.32 0.01
Uniform Delay, d1 48.6 49.0 51.5 48.8 4.7 6.0 5.7 4.0 6.9 5.3
Progression Factor 1.00 1.00 1.00 1.00 1.00 1.00 1.00 1.00 1.00 1.00
Incremental Delay, d2 0.1 0.3 7.4 0.2 0.1 0.1 0.0 0.0 0.4 0.0
Delay (s) 48.8 49.4 58.9 49.1 4.7 6.1 5.8 4.0 7.2 5.4
Level of Service D D E D A A A A A A
Approach Delay (s) 49.3 56.4 5.9 7.0
Approach LOS D E A A
Intersection Summary
HCM 2000 Control Delay 14.3 HCM 2000 Level of Service B
HCM 2000 Volume to Capacity ratio 0.34
Actuated Cycle Length (s) 120.0 Sum of lost time (s) 19.6
Intersection Capacity Utilization 51.9% ICU Level of Service A
Analysis Period (min) 15
c Critical Lane Group

HCM Unsignalized Intersection Capacity Analysis AM Peak Hour
6: Trinity & Maxwell Bridge Road 2013 Existing Traffic Volumes
HDR Corporation Synchro 8 Report
Page 2
Movement EBT EBR WBL WBT NBL NBR
Lane Configurations
Volume (veh/h) 47 27 19 68 22 8
Sign Control Free Free Stop
Grade 0% 0% 0%
Peak Hour Factor 0.94 0.94 0.94 0.94 0.94 0.94
Hourly flow rate (vph) 50 29 20 72 23 9
Pedestrians
Lane Width (m)
Walking Speed (m/s)
Percent Blockage
Right turn flare (veh)
Median type None None
Median storage veh)
Upstream signal (m) 99
pX, platoon unblocked
vC, conflicting volume 79 177 64
vC1, stage 1 conf vol
vC2, stage 2 conf vol
vCu, unblocked vol 79 177 64
tC, single (s) 4.1 6.4 6.3
tC, 2 stage (s)
tF (s) 2.2 3.5 3.4
p0 queue free % 99 97 99
cM capacity (veh/h) 1532 806 970
Direction, Lane # EB 1 WB 1 NB 1
Volume Total 79 93 32
Volume Left 0 20 23
Volume Right 29 0 9
cSH 1700 1532 844
Volume to Capacity 0.05 0.01 0.04
Queue Length 95th (m) 0.0 0.3 0.9
Control Delay (s) 0.0 1.7 9.4
Lane LOS A A
Approach Delay (s) 0.0 1.7 9.4
Approach LOS A
Intersection Summary
Average Delay 2.3
Intersection Capacity Utilization 21.6% ICU Level of Service A
Analysis Period (min) 15

HCM Signalized Intersection Capacity Analysis PM Peak Hour
3: March Road & Old Carp Road/Maxwell Bridge Road 2013 Existing Traffic Volumes
HDR Corporation Synchro 8 Report
Page 1
Movement EBL EBT EBR WBL WBT WBR NBL NBT NBR SBL SBT SBR
Lane Configurations
Volume (vph) 9 25 50 66 43 98 110 852 77 37 248 11
Ideal Flow (vphpl) 1800 1800 1800 1800 1800 1800 1800 1800 1800 1800 1800 1800
Total Lost time (s) 6.6 6.6 6.6 6.6 6.4 6.6 6.6 6.4 6.6 6.6
Lane Util. Factor 1.00 1.00 1.00 1.00 1.00 0.95 1.00 1.00 0.95 1.00
Frpb, ped/bikes 1.00 1.00 1.00 1.00 1.00 1.00 0.98 1.00 1.00 1.00
Flpb, ped/bikes 1.00 1.00 1.00 1.00 1.00 1.00 1.00 1.00 1.00 1.00
Frt 1.00 0.90 1.00 0.90 1.00 1.00 0.85 1.00 1.00 0.85
Flt Protected 0.95 1.00 0.95 1.00 0.95 1.00 1.00 0.95 1.00 1.00
Satd. Flow (prot) 1729 1595 1631 1606 1729 3424 1495 1728 3357 1547
Flt Permitted 0.50 1.00 0.71 1.00 0.57 1.00 1.00 0.31 1.00 1.00
Satd. Flow (perm) 912 1595 1213 1606 1033 3424 1495 565 3357 1547
Peak-hour factor, PHF 0.96 0.96 0.96 0.96 0.96 0.96 0.96 0.96 0.96 0.96 0.96 0.96
Adj. Flow (vph) 9 26 52 69 45 102 115 888 80 39 258 11
RTOR Reduction (vph) 0 47 0 0 90 0 0 0 24 0 0 4
Lane Group Flow (vph) 9 31 0 69 57 0 115 888 56 39 258 7
Confl. Peds. (#/hr) 2 2
Heavy Vehicles (%) 0% 0% 4% 6% 5% 0% 0% 1% 1% 0% 3% 0%
Turn Type Perm NA Perm NA pm+pt NA Perm pm+pt NA Perm
Protected Phases 4 8 5 2 1 6
Permitted Phases 4 8 2 2 6 6
Actuated Green, G (s) 12.2 12.2 12.2 12.2 91.7 84.3 84.3 84.7 80.8 80.8
Effective Green, g (s) 12.2 12.2 12.2 12.2 91.7 84.3 84.3 84.7 80.8 80.8
Actuated g/C Ratio 0.10 0.10 0.10 0.10 0.76 0.70 0.70 0.71 0.67 0.67
Clearance Time (s) 6.6 6.6 6.6 6.6 6.4 6.6 6.6 6.4 6.6 6.6
Vehicle Extension (s) 3.0 3.0 3.0 3.0 3.0 3.0 3.0 3.0 3.0 3.0
Lane Grp Cap (vph) 92 162 123 163 832 2405 1050 436 2260 1041
v/s Ratio Prot 0.02 0.04 c0.01 c0.26 0.00 0.08
v/s Ratio Perm 0.01 c0.06 0.10 0.04 0.06 0.00
v/c Ratio 0.10 0.19 0.56 0.35 0.14 0.37 0.05 0.09 0.11 0.01
Uniform Delay, d1 48.9 49.4 51.3 50.2 3.6 7.2 5.5 5.3 6.9 6.4
Progression Factor 1.00 1.00 1.00 1.00 1.00 1.00 1.00 1.00 1.00 1.00
Incremental Delay, d2 0.5 0.6 5.7 1.3 0.1 0.4 0.1 0.1 0.1 0.0
Delay (s) 49.4 50.0 57.1 51.5 3.7 7.6 5.6 5.4 7.0 6.4
Level of Service D D E D A A A A A A
Approach Delay (s) 49.9 53.3 7.0 6.8
Approach LOS D D A A
Intersection Summary
HCM 2000 Control Delay 15.1 HCM 2000 Level of Service B
HCM 2000 Volume to Capacity ratio 0.39
Actuated Cycle Length (s) 120.0 Sum of lost time (s) 19.6
Intersection Capacity Utilization 55.1% ICU Level of Service B
Analysis Period (min) 15
c Critical Lane Group

HCM Unsignalized Intersection Capacity Analysis PM Peak Hour
6: Trinity & Maxwell Bridge Road 2013 Existing Traffic Volumes
HDR Corporation Synchro 8 Report
Page 2
Movement EBT EBR WBL WBT NBL NBR
Lane Configurations
Volume (veh/h) 95 50 29 61 134 62
Sign Control Free Free Stop
Grade 0% 0% 0%
Peak Hour Factor 0.86 0.86 0.86 0.86 0.86 0.86
Hourly flow rate (vph) 110 58 34 71 156 72
Pedestrians
Lane Width (m)
Walking Speed (m/s)
Percent Blockage
Right turn flare (veh)
Median type None None
Median storage veh)
Upstream signal (m) 99
pX, platoon unblocked
vC, conflicting volume 169 278 140
vC1, stage 1 conf vol
vC2, stage 2 conf vol
vCu, unblocked vol 169 278 140
tC, single (s) 4.1 6.4 6.3
tC, 2 stage (s)
tF (s) 2.2 3.5 3.4
p0 queue free % 98 78 92
cM capacity (veh/h) 1415 699 883
Direction, Lane # EB 1 WB 1 NB 1
Volume Total 169 105 228
Volume Left 0 34 156
Volume Right 58 0 72
cSH 1700 1415 748
Volume to Capacity 0.10 0.02 0.30
Queue Length 95th (m) 0.0 0.6 9.8
Control Delay (s) 0.0 2.6 11.9
Lane LOS A B
Approach Delay (s) 0.0 2.6 11.9
Approach LOS B
Intersection Summary
Average Delay 6.0
Intersection Capacity Utilization 35.4% ICU Level of Service A
Analysis Period (min) 15
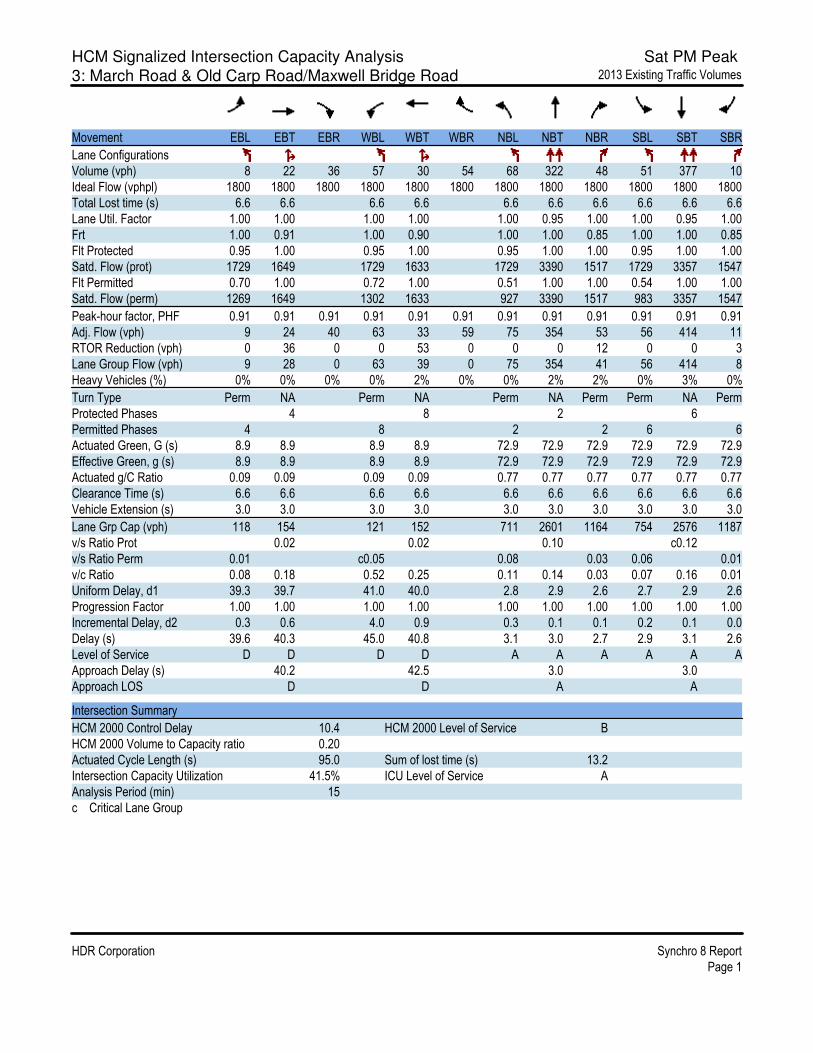
HCM Signalized Intersection Capacity Analysis Sat PM Peak
3: March Road & Old Carp Road/Maxwell Bridge Road 2013 Existing Traffic Volumes
HDR Corporation Synchro 8 Report
Page 1
Movement EBL EBT EBR WBL WBT WBR NBL NBT NBR SBL SBT SBR
Lane Configurations
Volume (vph) 8 22 36 57 30 54 68 322 48 51 377 10
Ideal Flow (vphpl) 1800 1800 1800 1800 1800 1800 1800 1800 1800 1800 1800 1800
Total Lost time (s) 6.6 6.6 6.6 6.6 6.6 6.6 6.6 6.6 6.6 6.6
Lane Util. Factor 1.00 1.00 1.00 1.00 1.00 0.95 1.00 1.00 0.95 1.00
Frt 1.00 0.91 1.00 0.90 1.00 1.00 0.85 1.00 1.00 0.85
Flt Protected 0.95 1.00 0.95 1.00 0.95 1.00 1.00 0.95 1.00 1.00
Satd. Flow (prot) 1729 1649 1729 1633 1729 3390 1517 1729 3357 1547
Flt Permitted 0.70 1.00 0.72 1.00 0.51 1.00 1.00 0.54 1.00 1.00
Satd. Flow (perm) 1269 1649 1302 1633 927 3390 1517 983 3357 1547
Peak-hour factor, PHF 0.91 0.91 0.91 0.91 0.91 0.91 0.91 0.91 0.91 0.91 0.91 0.91
Adj. Flow (vph) 9 24 40 63 33 59 75 354 53 56 414 11
RTOR Reduction (vph) 0 36 0 0 53 0 0 0 12 0 0 3
Lane Group Flow (vph) 9 28 0 63 39 0 75 354 41 56 414 8
Heavy Vehicles (%) 0% 0% 0% 0% 2% 0% 0% 2% 2% 0% 3% 0%
Turn Type Perm NA Perm NA Perm NA Perm Perm NA Perm
Protected Phases 4 8 2 6
Permitted Phases 4 8 2 2 6 6
Actuated Green, G (s) 8.9 8.9 8.9 8.9 72.9 72.9 72.9 72.9 72.9 72.9
Effective Green, g (s) 8.9 8.9 8.9 8.9 72.9 72.9 72.9 72.9 72.9 72.9
Actuated g/C Ratio 0.09 0.09 0.09 0.09 0.77 0.77 0.77 0.77 0.77 0.77
Clearance Time (s) 6.6 6.6 6.6 6.6 6.6 6.6 6.6 6.6 6.6 6.6
Vehicle Extension (s) 3.0 3.0 3.0 3.0 3.0 3.0 3.0 3.0 3.0 3.0
Lane Grp Cap (vph) 118 154 121 152 711 2601 1164 754 2576 1187
v/s Ratio Prot 0.02 0.02 0.10 c0.12
v/s Ratio Perm 0.01 c0.05 0.08 0.03 0.06 0.01
v/c Ratio 0.08 0.18 0.52 0.25 0.11 0.14 0.03 0.07 0.16 0.01
Uniform Delay, d1 39.3 39.7 41.0 40.0 2.8 2.9 2.6 2.7 2.9 2.6
Progression Factor 1.00 1.00 1.00 1.00 1.00 1.00 1.00 1.00 1.00 1.00
Incremental Delay, d2 0.3 0.6 4.0 0.9 0.3 0.1 0.1 0.2 0.1 0.0
Delay (s) 39.6 40.3 45.0 40.8 3.1 3.0 2.7 2.9 3.1 2.6
Level of Service D D D D A A A A A A
Approach Delay (s) 40.2 42.5 3.0 3.0
Approach LOS D D A A
Intersection Summary
HCM 2000 Control Delay 10.4 HCM 2000 Level of Service B
HCM 2000 Volume to Capacity ratio 0.20
Actuated Cycle Length (s) 95.0 Sum of lost time (s) 13.2
Intersection Capacity Utilization 41.5% ICU Level of Service A
Analysis Period (min) 15
c Critical Lane Group
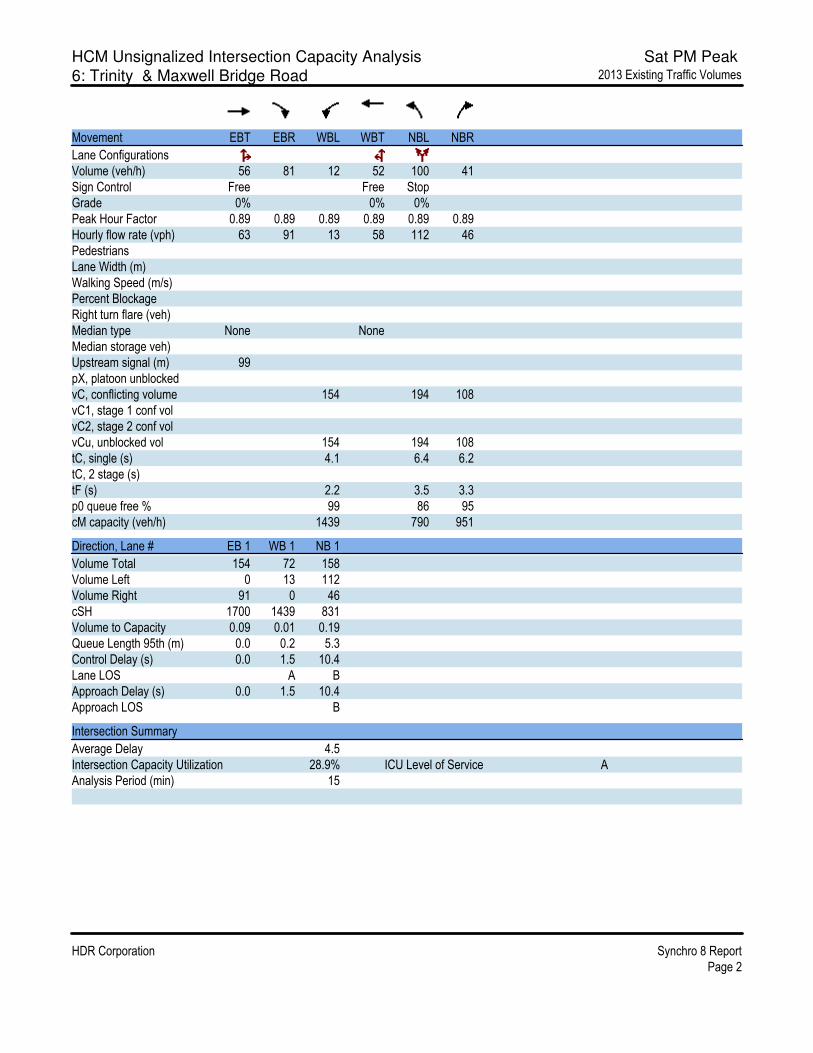
HCM Unsignalized Intersection Capacity Analysis Sat PM Peak
6: Trinity & Maxwell Bridge Road 2013 Existing Traffic Volumes
HDR Corporation Synchro 8 Report
Page 2
Movement EBT EBR WBL WBT NBL NBR
Lane Configurations
Volume (veh/h) 56 81 12 52 100 41
Sign Control Free Free Stop
Grade 0% 0% 0%
Peak Hour Factor 0.89 0.89 0.89 0.89 0.89 0.89
Hourly flow rate (vph) 63 91 13 58 112 46
Pedestrians
Lane Width (m)
Walking Speed (m/s)
Percent Blockage
Right turn flare (veh)
Median type None None
Median storage veh)
Upstream signal (m) 99
pX, platoon unblocked
vC, conflicting volume 154 194 108
vC1, stage 1 conf vol
vC2, stage 2 conf vol
vCu, unblocked vol 154 194 108
tC, single (s) 4.1 6.4 6.2
tC, 2 stage (s)
tF (s) 2.2 3.5 3.3
p0 queue free % 99 86 95
cM capacity (veh/h) 1439 790 951
Direction, Lane # EB 1 WB 1 NB 1
Volume Total 154 72 158
Volume Left 0 13 112
Volume Right 91 0 46
cSH 1700 1439 831
Volume to Capacity 0.09 0.01 0.19
Queue Length 95th (m) 0.0 0.2 5.3
Control Delay (s) 0.0 1.5 10.4
Lane LOS A B
Approach Delay (s) 0.0 1.5 10.4
Approach LOS B
Intersection Summary
Average Delay 4.5
Intersection Capacity Utilization 28.9% ICU Level of Service A
Analysis Period (min) 15

Appendix B
2018 Background Traffic Operations

HCM Signalized Intersection Capacity Analysis AM Peak Hour
3: March Road & Old Carp Road/Maxwell Bridge Road 2018 Background Traffic Volumes
HDR Corporation Synchro 8 Report
Page 1
Movement EBL EBT EBR WBL WBT WBR NBL NBT NBR SBL SBT SBR
Lane Configurations
Volume (vph) 7 9 113 74 14 11 39 198 28 45 820 11
Ideal Flow (vphpl) 1800 1800 1800 1800 1800 1800 1800 1800 1800 1800 1800 1800
Total Lost time (s) 6.6 6.6 6.6 6.6 6.4 6.6 6.6 6.4 6.6 6.6
Lane Util. Factor 1.00 1.00 1.00 1.00 1.00 0.95 1.00 1.00 0.95 1.00
Frpb, ped/bikes 1.00 1.00 1.00 1.00 1.00 1.00 1.00 1.00 1.00 1.00
Flpb, ped/bikes 1.00 1.00 1.00 1.00 1.00 1.00 1.00 1.00 1.00 1.00
Frt 1.00 0.86 1.00 0.93 1.00 1.00 0.85 1.00 1.00 0.85
Flt Protected 0.95 1.00 0.95 1.00 0.95 1.00 1.00 0.95 1.00 1.00
Satd. Flow (prot) 1729 1552 1694 1627 1679 3262 1432 1601 3390 1406
Flt Permitted 0.74 1.00 0.60 1.00 0.31 1.00 1.00 0.62 1.00 1.00
Satd. Flow (perm) 1349 1552 1076 1627 550 3262 1432 1050 3390 1406
Peak-hour factor, PHF 0.97 0.97 0.97 0.97 0.97 0.97 0.97 0.97 0.97 0.97 0.97 0.97
Adj. Flow (vph) 7 9 116 76 14 11 40 204 29 46 845 11
RTOR Reduction (vph) 0 104 0 0 10 0 0 0 9 0 0 3
Lane Group Flow (vph) 7 21 0 76 15 0 40 204 20 46 845 8
Confl. Peds. (#/hr) 1
Heavy Vehicles (%) 0% 13% 0% 2% 8% 0% 3% 6% 8% 8% 2% 10%
Turn Type Perm NA Perm NA pm+pt NA Perm pm+pt NA Perm
Protected Phases 4 8 5 2 1 6
Permitted Phases 4 8 2 2 6 6
Actuated Green, G (s) 12.9 12.9 12.9 12.9 87.4 82.3 82.3 87.6 82.4 82.4
Effective Green, g (s) 12.9 12.9 12.9 12.9 87.4 82.3 82.3 87.6 82.4 82.4
Actuated g/C Ratio 0.11 0.11 0.11 0.11 0.73 0.69 0.69 0.73 0.69 0.69
Clearance Time (s) 6.6 6.6 6.6 6.6 6.4 6.6 6.6 6.4 6.6 6.6
Vehicle Extension (s) 3.0 3.0 3.0 3.0 3.0 3.0 3.0 3.0 3.0 3.0
Lane Grp Cap (vph) 145 166 115 174 448 2237 982 790 2327 965
v/s Ratio Prot 0.01 0.01 c0.00 0.06 0.00 c0.25
v/s Ratio Perm 0.01 c0.07 0.06 0.01 0.04 0.01
v/c Ratio 0.05 0.13 0.66 0.09 0.09 0.09 0.02 0.06 0.36 0.01
Uniform Delay, d1 48.0 48.5 51.4 48.2 4.7 6.3 6.0 4.5 7.8 5.9
Progression Factor 1.00 1.00 1.00 1.00 1.00 1.00 1.00 1.00 1.00 1.00
Incremental Delay, d2 0.1 0.4 13.4 0.2 0.1 0.1 0.0 0.0 0.4 0.0
Delay (s) 48.2 48.8 64.8 48.5 4.8 6.4 6.0 4.5 8.3 5.9
Level of Service D D E D A A A A A A
Approach Delay (s) 48.8 60.8 6.1 8.1
Approach LOS D E A A
Intersection Summary
HCM 2000 Control Delay 15.3 HCM 2000 Level of Service B
HCM 2000 Volume to Capacity ratio 0.39
Actuated Cycle Length (s) 120.0 Sum of lost time (s) 19.6
Intersection Capacity Utilization 61.3% ICU Level of Service B
Analysis Period (min) 15
c Critical Lane Group

HCM Unsignalized Intersection Capacity Analysis AM Peak Hour
6: Trinity & Maxwell Bridge Road 2018 Background Traffic Volumes
HDR Corporation Synchro 8 Report
Page 2
Movement EBT EBR WBL WBT NBL NBR
Lane Configurations
Volume (veh/h) 52 27 19 75 22 8
Sign Control Free Free Stop
Grade 0% 0% 0%
Peak Hour Factor 0.94 0.94 0.94 0.94 0.94 0.94
Hourly flow rate (vph) 55 29 20 80 23 9
Pedestrians
Lane Width (m)
Walking Speed (m/s)
Percent Blockage
Right turn flare (veh)
Median type None None
Median storage veh)
Upstream signal (m) 99
pX, platoon unblocked
vC, conflicting volume 84 190 70
vC1, stage 1 conf vol
vC2, stage 2 conf vol
vCu, unblocked vol 84 190 70
tC, single (s) 4.1 6.4 6.3
tC, 2 stage (s)
tF (s) 2.2 3.5 3.4
p0 queue free % 99 97 99
cM capacity (veh/h) 1526 793 963
Direction, Lane # EB 1 WB 1 NB 1
Volume Total 84 100 32
Volume Left 0 20 23
Volume Right 29 0 9
cSH 1700 1526 832
Volume to Capacity 0.05 0.01 0.04
Queue Length 95th (m) 0.0 0.3 0.9
Control Delay (s) 0.0 1.6 9.5
Lane LOS A A
Approach Delay (s) 0.0 1.6 9.5
Approach LOS A
Intersection Summary
Average Delay 2.1
Intersection Capacity Utilization 21.9% ICU Level of Service A
Analysis Period (min) 15

HCM Signalized Intersection Capacity Analysis PM Peak Hour
3: March Road & Old Carp Road/Maxwell Bridge Road 2018 Background Traffic Volumes
HDR Corporation Synchro 8 Report
Page 1
Movement EBL EBT EBR WBL WBT WBR NBL NBT NBR SBL SBT SBR
Lane Configurations
Volume (vph) 10 28 55 73 47 108 121 941 85 41 274 12
Ideal Flow (vphpl) 1800 1800 1800 1800 1800 1800 1800 1800 1800 1800 1800 1800
Total Lost time (s) 6.6 6.6 6.6 6.6 6.4 6.6 6.6 6.4 6.6 6.6
Lane Util. Factor 1.00 1.00 1.00 1.00 1.00 0.95 1.00 1.00 0.95 1.00
Frpb, ped/bikes 1.00 1.00 1.00 1.00 1.00 1.00 0.98 1.00 1.00 1.00
Flpb, ped/bikes 1.00 1.00 1.00 1.00 1.00 1.00 1.00 1.00 1.00 1.00
Frt 1.00 0.90 1.00 0.90 1.00 1.00 0.85 1.00 1.00 0.85
Flt Protected 0.95 1.00 0.95 1.00 0.95 1.00 1.00 0.95 1.00 1.00
Satd. Flow (prot) 1729 1597 1631 1606 1729 3424 1495 1729 3357 1547
Flt Permitted 0.46 1.00 0.70 1.00 0.56 1.00 1.00 0.27 1.00 1.00
Satd. Flow (perm) 830 1597 1204 1606 1017 3424 1495 493 3357 1547
Peak-hour factor, PHF 0.96 0.96 0.96 0.96 0.96 0.96 0.96 0.96 0.96 0.96 0.96 0.96
Adj. Flow (vph) 10 29 57 76 49 112 126 980 89 43 285 12
RTOR Reduction (vph) 0 51 0 0 87 0 0 0 28 0 0 4
Lane Group Flow (vph) 10 35 0 76 74 0 126 980 61 43 285 8
Confl. Peds. (#/hr) 2 2
Heavy Vehicles (%) 0% 0% 4% 6% 5% 0% 0% 1% 1% 0% 3% 0%
Turn Type Perm NA Perm NA pm+pt NA Perm pm+pt NA Perm
Protected Phases 4 8 5 2 1 6
Permitted Phases 4 8 2 2 6 6
Actuated Green, G (s) 12.9 12.9 12.9 12.9 90.1 82.4 82.4 84.9 79.8 79.8
Effective Green, g (s) 12.9 12.9 12.9 12.9 90.1 82.4 82.4 84.9 79.8 79.8
Actuated g/C Ratio 0.11 0.11 0.11 0.11 0.75 0.69 0.69 0.71 0.66 0.66
Clearance Time (s) 6.6 6.6 6.6 6.6 6.4 6.6 6.6 6.4 6.6 6.6
Vehicle Extension (s) 3.0 3.0 3.0 3.0 3.0 3.0 3.0 3.0 3.0 3.0
Lane Grp Cap (vph) 89 171 129 172 809 2351 1026 401 2232 1028
v/s Ratio Prot 0.02 0.05 c0.01 c0.29 0.00 0.08
v/s Ratio Perm 0.01 c0.06 0.11 0.04 0.07 0.01
v/c Ratio 0.11 0.21 0.59 0.43 0.16 0.42 0.06 0.11 0.13 0.01
Uniform Delay, d1 48.4 48.9 51.0 50.1 4.0 8.3 6.1 5.4 7.4 6.8
Progression Factor 1.00 1.00 1.00 1.00 1.00 1.00 1.00 1.00 1.00 1.00
Incremental Delay, d2 0.6 0.6 6.7 1.7 0.1 0.5 0.1 0.1 0.1 0.0
Delay (s) 48.9 49.5 57.7 51.9 4.1 8.8 6.3 5.5 7.5 6.8
Level of Service D D E D A A A A A A
Approach Delay (s) 49.4 53.8 8.1 7.2
Approach LOS D D A A
Intersection Summary
HCM 2000 Control Delay 15.9 HCM 2000 Level of Service B
HCM 2000 Volume to Capacity ratio 0.43
Actuated Cycle Length (s) 120.0 Sum of lost time (s) 19.6
Intersection Capacity Utilization 58.1% ICU Level of Service B
Analysis Period (min) 15
c Critical Lane Group

HCM Unsignalized Intersection Capacity Analysis PM Peak Hour
6: Trinity & Maxwell Bridge Road 2018 Background Traffic Volumes
HDR Corporation Synchro 8 Report
Page 2
Movement EBT EBR WBL WBT NBL NBR
Lane Configurations
Volume (veh/h) 105 50 29 67 134 62
Sign Control Free Free Stop
Grade 0% 0% 0%
Peak Hour Factor 0.86 0.86 0.86 0.86 0.86 0.86
Hourly flow rate (vph) 122 58 34 78 156 72
Pedestrians
Lane Width (m)
Walking Speed (m/s)
Percent Blockage
Right turn flare (veh)
Median type None None
Median storage veh)
Upstream signal (m) 99
pX, platoon unblocked
vC, conflicting volume 180 297 151
vC1, stage 1 conf vol
vC2, stage 2 conf vol
vCu, unblocked vol 180 297 151
tC, single (s) 4.1 6.4 6.3
tC, 2 stage (s)
tF (s) 2.2 3.5 3.4
p0 queue free % 98 77 92
cM capacity (veh/h) 1401 682 869
Direction, Lane # EB 1 WB 1 NB 1
Volume Total 180 112 228
Volume Left 0 34 156
Volume Right 58 0 72
cSH 1700 1401 732
Volume to Capacity 0.11 0.02 0.31
Queue Length 95th (m) 0.0 0.6 10.1
Control Delay (s) 0.0 2.4 12.1
Lane LOS A B
Approach Delay (s) 0.0 2.4 12.1
Approach LOS B
Intersection Summary
Average Delay 5.8
Intersection Capacity Utilization 36.3% ICU Level of Service A
Analysis Period (min) 15

HCM Signalized Intersection Capacity Analysis Sat PM Peak
3: March Road & Old Carp Road/Maxwell Bridge Road 2018 Backgroung Traffic Volumes
HDR Corporation Synchro 8 Report
Page 1
Movement EBL EBT EBR WBL WBT WBR NBL NBT NBR SBL SBT SBR
Lane Configurations
Volume (vph) 9 24 40 63 33 60 75 356 53 56 416 11
Ideal Flow (vphpl) 1800 1800 1800 1800 1800 1800 1800 1800 1800 1800 1800 1800
Total Lost time (s) 6.6 6.6 6.6 6.6 6.6 6.6 6.6 6.6 6.6 6.6
Lane Util. Factor 1.00 1.00 1.00 1.00 1.00 0.95 1.00 1.00 0.95 1.00
Frt 1.00 0.91 1.00 0.90 1.00 1.00 0.85 1.00 1.00 0.85
Flt Protected 0.95 1.00 0.95 1.00 0.95 1.00 1.00 0.95 1.00 1.00
Satd. Flow (prot) 1729 1648 1729 1632 1729 3390 1517 1729 3357 1547
Flt Permitted 0.69 1.00 0.71 1.00 0.49 1.00 1.00 0.52 1.00 1.00
Satd. Flow (perm) 1258 1648 1295 1632 889 3390 1517 948 3357 1547
Peak-hour factor, PHF 0.91 0.91 0.91 0.91 0.91 0.91 0.91 0.91 0.91 0.91 0.91 0.91
Adj. Flow (vph) 10 26 44 69 36 66 82 391 58 62 457 12
RTOR Reduction (vph) 0 40 0 0 60 0 0 0 14 0 0 3
Lane Group Flow (vph) 10 30 0 69 42 0 82 391 44 62 457 9
Heavy Vehicles (%) 0% 0% 0% 0% 2% 0% 0% 2% 2% 0% 3% 0%
Turn Type Perm NA Perm NA Perm NA Perm Perm NA Perm
Protected Phases 4 8 2 6
Permitted Phases 4 8 2 2 6 6
Actuated Green, G (s) 9.3 9.3 9.3 9.3 72.5 72.5 72.5 72.5 72.5 72.5
Effective Green, g (s) 9.3 9.3 9.3 9.3 72.5 72.5 72.5 72.5 72.5 72.5
Actuated g/C Ratio 0.10 0.10 0.10 0.10 0.76 0.76 0.76 0.76 0.76 0.76
Clearance Time (s) 6.6 6.6 6.6 6.6 6.6 6.6 6.6 6.6 6.6 6.6
Vehicle Extension (s) 3.0 3.0 3.0 3.0 3.0 3.0 3.0 3.0 3.0 3.0
Lane Grp Cap (vph) 123 161 126 159 678 2587 1157 723 2561 1180
v/s Ratio Prot 0.02 0.03 0.12 c0.14
v/s Ratio Perm 0.01 c0.05 0.09 0.03 0.07 0.01
v/c Ratio 0.08 0.19 0.55 0.27 0.12 0.15 0.04 0.09 0.18 0.01
Uniform Delay, d1 39.0 39.4 40.8 39.7 2.9 3.0 2.7 2.9 3.1 2.7
Progression Factor 1.00 1.00 1.00 1.00 1.00 1.00 1.00 1.00 1.00 1.00
Incremental Delay, d2 0.3 0.6 4.8 0.9 0.4 0.1 0.1 0.2 0.2 0.0
Delay (s) 39.3 40.0 45.6 40.6 3.3 3.1 2.8 3.1 3.2 2.7
Level of Service D D D D A A A A A A
Approach Delay (s) 39.9 42.6 3.1 3.2
Approach LOS D D A A
Intersection Summary
HCM 2000 Control Delay 10.5 HCM 2000 Level of Service B
HCM 2000 Volume to Capacity ratio 0.22
Actuated Cycle Length (s) 95.0 Sum of lost time (s) 13.2
Intersection Capacity Utilization 43.4% ICU Level of Service A
Analysis Period (min) 15
c Critical Lane Group

HCM Unsignalized Intersection Capacity Analysis Sat PM Peak
6: Trinity & Maxwell Bridge Road 2018 Backgroung Traffic Volumes
HDR Corporation Synchro 8 Report
Page 2
Movement EBT EBR WBL WBT NBL NBR
Lane Configurations
Volume (veh/h) 62 81 12 57 100 41
Sign Control Free Free Stop
Grade 0% 0% 0%
Peak Hour Factor 0.89 0.89 0.89 0.89 0.89 0.89
Hourly flow rate (vph) 70 91 13 64 112 46
Pedestrians
Lane Width (m)
Walking Speed (m/s)
Percent Blockage
Right turn flare (veh)
Median type None None
Median storage veh)
Upstream signal (m) 99
pX, platoon unblocked
vC, conflicting volume 161 206 115
vC1, stage 1 conf vol
vC2, stage 2 conf vol
vCu, unblocked vol 161 206 115
tC, single (s) 4.1 6.4 6.2
tC, 2 stage (s)
tF (s) 2.2 3.5 3.3
p0 queue free % 99 86 95
cM capacity (veh/h) 1431 777 943
Direction, Lane # EB 1 WB 1 NB 1
Volume Total 161 78 158
Volume Left 0 13 112
Volume Right 91 0 46
cSH 1700 1431 819
Volume to Capacity 0.09 0.01 0.19
Queue Length 95th (m) 0.0 0.2 5.4
Control Delay (s) 0.0 1.4 10.4
Lane LOS A B
Approach Delay (s) 0.0 1.4 10.4
Approach LOS B
Intersection Summary
Average Delay 4.4
Intersection Capacity Utilization 29.2% ICU Level of Service A
Analysis Period (min) 15

Appendix C
Trip Generation Review

Trip Generation ReviewNote: All of the restaurants graphed below are McDonald's restauraunts with drive-through windows.
Size (SF)
1880 Carling Ave, Ottawa 3,466
1771 Walkley Rd, Ottawa 2,626
2686 Laurier St, Rockland 3,229
10520 - 111 Avenue, Edmonton 10,038
10305 - 80 Ave, Edmonton 6,900
16725 Stony Plain, Edmonton 3,439
Bayfield Street, Barrie 4,297
Note:
Not all locations had all three periods surveyed.
Location
y = 13.091ln(x) + 119.35
0
50
100
150
200
250
0 2 4 6 8 10 12
Tri
pEn
ds
Development Size (1000 SF)
Weekday AM Peak Hour
y = -0.947ln(x) + 117.9
0
50
100
150
200
250
0 2 4 6 8 10 12
Tri
pEn
ds
Development Size (1000 SF)
Weekday PM Peak Hour
y = 301.85ln(x) - 191.88
0
50
100
150
200
250
300
350
0 1 2 3 4 5
Tri
pEn
ds
Development Size (1000 SF)
Weekend Peak Hour

Appendix D
2018 Total Traffic Operations

HCM Signalized Intersection Capacity Analysis AM Peak Hour
3: March Road & Old Carp Road/Maxwell Bridge Road 2018 Total Traffic Volumes
HDR Corporation Synchro 8 Report
Page 1
Movement EBL EBT EBR WBL WBT WBR NBL NBT NBR SBL SBT SBR
Lane Configurations
Volume (vph) 7 11 113 124 16 11 39 201 58 71 801 11
Ideal Flow (vphpl) 1800 1800 1800 1800 1800 1800 1800 1800 1800 1800 1800 1800
Total Lost time (s) 6.6 6.6 6.6 6.6 6.4 6.6 6.6 6.4 6.6 6.6
Lane Util. Factor 1.00 1.00 1.00 1.00 1.00 0.95 1.00 1.00 0.95 1.00
Frpb, ped/bikes 1.00 1.00 1.00 1.00 1.00 1.00 1.00 1.00 1.00 1.00
Flpb, ped/bikes 1.00 1.00 1.00 1.00 1.00 1.00 1.00 1.00 1.00 1.00
Frt 1.00 0.86 1.00 0.94 1.00 1.00 0.85 1.00 1.00 0.85
Flt Protected 0.95 1.00 0.95 1.00 0.95 1.00 1.00 0.95 1.00 1.00
Satd. Flow (prot) 1729 1553 1694 1631 1679 3262 1432 1601 3390 1406
Flt Permitted 0.74 1.00 0.63 1.00 0.31 1.00 1.00 0.62 1.00 1.00
Satd. Flow (perm) 1346 1553 1130 1631 552 3262 1432 1037 3390 1406
Peak-hour factor, PHF 0.97 0.97 0.97 0.97 0.97 0.97 0.97 0.97 0.97 0.97 0.97 0.97
Adj. Flow (vph) 7 11 116 128 16 11 40 207 60 73 826 11
RTOR Reduction (vph) 0 98 0 0 9 0 0 0 22 0 0 4
Lane Group Flow (vph) 7 29 0 128 18 0 40 207 38 73 826 7
Confl. Peds. (#/hr) 1
Heavy Vehicles (%) 0% 13% 0% 2% 8% 0% 3% 6% 8% 8% 2% 10%
Turn Type Perm NA Perm NA pm+pt NA Perm pm+pt NA Perm
Protected Phases 4 8 5 2 1 6
Permitted Phases 4 8 2 2 6 6
Actuated Green, G (s) 18.2 18.2 18.2 18.2 81.4 76.2 76.2 83.0 77.0 77.0
Effective Green, g (s) 18.2 18.2 18.2 18.2 81.4 76.2 76.2 83.0 77.0 77.0
Actuated g/C Ratio 0.15 0.15 0.15 0.15 0.68 0.64 0.64 0.69 0.64 0.64
Clearance Time (s) 6.6 6.6 6.6 6.6 6.4 6.6 6.6 6.4 6.6 6.6
Vehicle Extension (s) 3.0 3.0 3.0 3.0 3.0 3.0 3.0 3.0 3.0 3.0
Lane Grp Cap (vph) 204 235 171 247 423 2071 909 745 2175 902
v/s Ratio Prot 0.02 0.01 0.00 0.06 c0.00 c0.24
v/s Ratio Perm 0.01 c0.11 0.06 0.03 0.06 0.01
v/c Ratio 0.03 0.12 0.75 0.07 0.09 0.10 0.04 0.10 0.38 0.01
Uniform Delay, d1 43.4 44.0 48.7 43.7 6.5 8.5 8.2 6.0 10.2 7.7
Progression Factor 1.00 1.00 1.00 1.00 1.00 1.00 1.00 1.00 1.00 1.00
Incremental Delay, d2 0.1 0.2 16.3 0.1 0.1 0.1 0.1 0.1 0.5 0.0
Delay (s) 43.5 44.2 65.0 43.8 6.6 8.6 8.3 6.0 10.7 7.8
Level of Service D D E D A A A A B A
Approach Delay (s) 44.2 61.3 8.3 10.3
Approach LOS D E A B
Intersection Summary
HCM 2000 Control Delay 18.2 HCM 2000 Level of Service B
HCM 2000 Volume to Capacity ratio 0.43
Actuated Cycle Length (s) 120.0 Sum of lost time (s) 19.6
Intersection Capacity Utilization 63.8% ICU Level of Service B
Analysis Period (min) 15
c Critical Lane Group
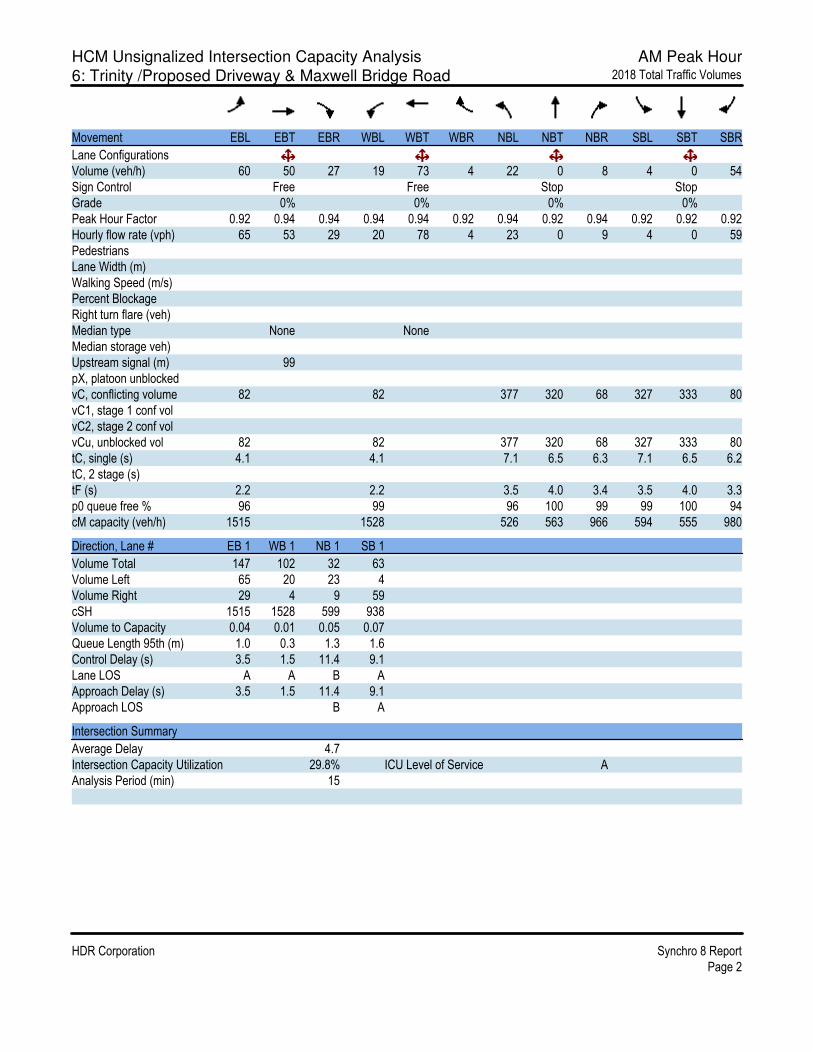
HCM Unsignalized Intersection Capacity Analysis AM Peak Hour
6: Trinity /Proposed Driveway & Maxwell Bridge Road 2018 Total Traffic Volumes
HDR Corporation Synchro 8 Report
Page 2
Movement EBL EBT EBR WBL WBT WBR NBL NBT NBR SBL SBT SBR
Lane Configurations
Volume (veh/h) 60 50 27 19 73 4 22 0 8 4 0 54
Sign Control Free Free Stop Stop
Grade 0% 0% 0% 0%
Peak Hour Factor 0.92 0.94 0.94 0.94 0.94 0.92 0.94 0.92 0.94 0.92 0.92 0.92
Hourly flow rate (vph) 65 53 29 20 78 4 23 0 9 4 0 59
Pedestrians
Lane Width (m)
Walking Speed (m/s)
Percent Blockage
Right turn flare (veh)
Median type None None
Median storage veh)
Upstream signal (m) 99
pX, platoon unblocked
vC, conflicting volume 82 82 377 320 68 327 333 80
vC1, stage 1 conf vol
vC2, stage 2 conf vol
vCu, unblocked vol 82 82 377 320 68 327 333 80
tC, single (s) 4.1 4.1 7.1 6.5 6.3 7.1 6.5 6.2
tC, 2 stage (s)
tF (s) 2.2 2.2 3.5 4.0 3.4 3.5 4.0 3.3
p0 queue free % 96 99 96 100 99 99 100 94
cM capacity (veh/h) 1515 1528 526 563 966 594 555 980
Direction, Lane # EB 1 WB 1 NB 1 SB 1
Volume Total 147 102 32 63
Volume Left 65 20 23 4
Volume Right 29 4 9 59
cSH 1515 1528 599 938
Volume to Capacity 0.04 0.01 0.05 0.07
Queue Length 95th (m) 1.0 0.3 1.3 1.6
Control Delay (s) 3.5 1.5 11.4 9.1
Lane LOS A A B A
Approach Delay (s) 3.5 1.5 11.4 9.1
Approach LOS B A
Intersection Summary
Average Delay 4.7
Intersection Capacity Utilization 29.8% ICU Level of Service A
Analysis Period (min) 15
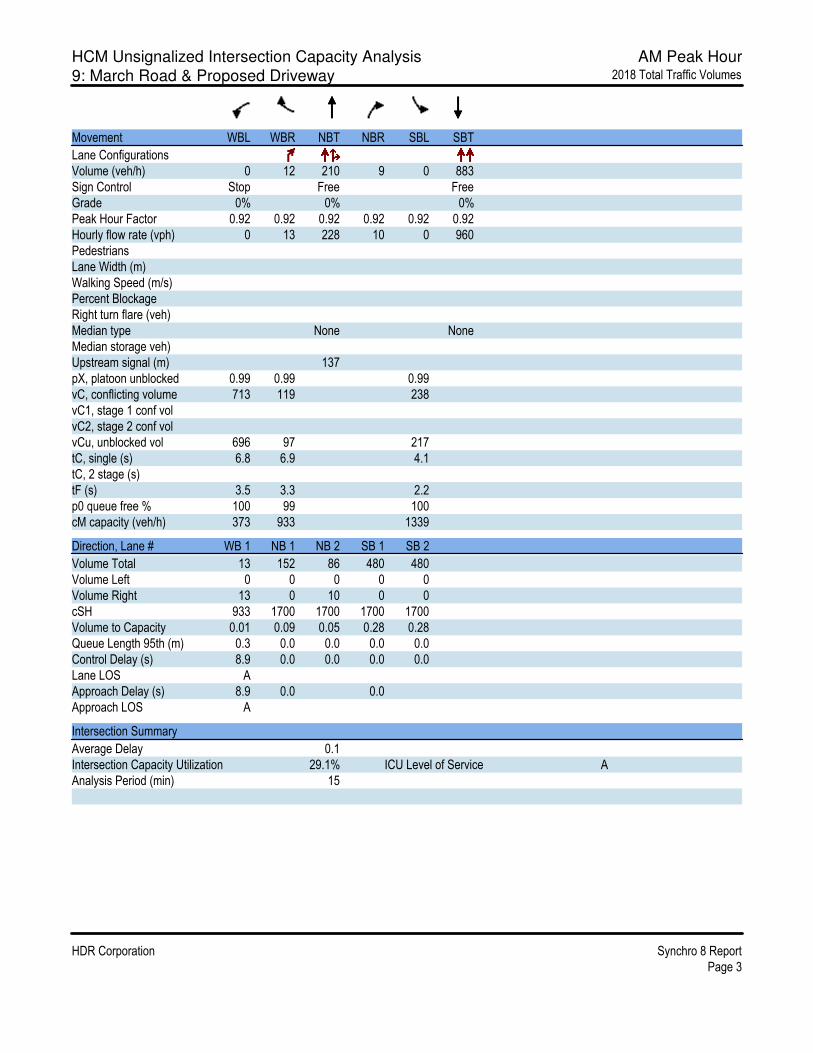
HCM Unsignalized Intersection Capacity Analysis AM Peak Hour
9: March Road & Proposed Driveway 2018 Total Traffic Volumes
HDR Corporation Synchro 8 Report
Page 3
Movement WBL WBR NBT NBR SBL SBT
Lane Configurations
Volume (veh/h) 0 12 210 9 0 883
Sign Control Stop Free Free
Grade 0% 0% 0%
Peak Hour Factor 0.92 0.92 0.92 0.92 0.92 0.92
Hourly flow rate (vph) 0 13 228 10 0 960
Pedestrians
Lane Width (m)
Walking Speed (m/s)
Percent Blockage
Right turn flare (veh)
Median type None None
Median storage veh)
Upstream signal (m) 137
pX, platoon unblocked 0.99 0.99 0.99
vC, conflicting volume 713 119 238
vC1, stage 1 conf vol
vC2, stage 2 conf vol
vCu, unblocked vol 696 97 217
tC, single (s) 6.8 6.9 4.1
tC, 2 stage (s)
tF (s) 3.5 3.3 2.2
p0 queue free % 100 99 100
cM capacity (veh/h) 373 933 1339
Direction, Lane # WB 1 NB 1 NB 2 SB 1 SB 2
Volume Total 13 152 86 480 480
Volume Left 0 0 0 0 0
Volume Right 13 0 10 0 0
cSH 933 1700 1700 1700 1700
Volume to Capacity 0.01 0.09 0.05 0.28 0.28
Queue Length 95th (m) 0.3 0.0 0.0 0.0 0.0
Control Delay (s) 8.9 0.0 0.0 0.0 0.0
Lane LOS A
Approach Delay (s) 8.9 0.0 0.0
Approach LOS A
Intersection Summary
Average Delay 0.1
Intersection Capacity Utilization 29.1% ICU Level of Service A
Analysis Period (min) 15

HCM Signalized Intersection Capacity Analysis PM Peak Hour
3: March Road & Old Carp Road/Maxwell Bridge Road 2018 Total Traffic Volumes
HDR Corporation Synchro 8 Report
Page 1
Movement EBL EBT EBR WBL WBT WBR NBL NBT NBR SBL SBT SBR
Lane Configurations
Volume (vph) 10 30 55 100 49 108 121 937 116 50 270 12
Ideal Flow (vphpl) 1800 1800 1800 1800 1800 1800 1800 1800 1800 1800 1800 1800
Total Lost time (s) 6.6 6.6 6.6 6.6 6.4 6.6 6.6 6.4 6.6 6.6
Lane Util. Factor 1.00 1.00 1.00 1.00 1.00 0.95 1.00 1.00 0.95 1.00
Frpb, ped/bikes 1.00 1.00 1.00 1.00 1.00 1.00 0.98 1.00 1.00 1.00
Flpb, ped/bikes 1.00 1.00 1.00 1.00 1.00 1.00 1.00 1.00 1.00 1.00
Frt 1.00 0.90 1.00 0.90 1.00 1.00 0.85 1.00 1.00 0.85
Flt Protected 0.95 1.00 0.95 1.00 0.95 1.00 1.00 0.95 1.00 1.00
Satd. Flow (prot) 1729 1602 1631 1607 1729 3424 1495 1729 3357 1547
Flt Permitted 0.50 1.00 0.70 1.00 0.56 1.00 1.00 0.27 1.00 1.00
Satd. Flow (perm) 906 1602 1202 1607 1020 3424 1495 485 3357 1547
Peak-hour factor, PHF 0.96 0.96 0.96 0.96 0.96 0.96 0.96 0.96 0.96 0.96 0.96 0.96
Adj. Flow (vph) 10 31 57 104 51 112 126 976 121 52 281 12
RTOR Reduction (vph) 0 49 0 0 81 0 0 0 41 0 0 4
Lane Group Flow (vph) 10 39 0 104 82 0 126 976 80 52 281 8
Confl. Peds. (#/hr) 2 2
Heavy Vehicles (%) 0% 0% 4% 6% 5% 0% 0% 1% 1% 0% 3% 0%
Turn Type Perm NA Perm NA pm+pt NA Perm pm+pt NA Perm
Protected Phases 4 8 5 2 1 6
Permitted Phases 4 8 2 2 6 6
Actuated Green, G (s) 15.8 15.8 15.8 15.8 87.2 79.3 79.3 82.0 76.7 76.7
Effective Green, g (s) 15.8 15.8 15.8 15.8 87.2 79.3 79.3 82.0 76.7 76.7
Actuated g/C Ratio 0.13 0.13 0.13 0.13 0.73 0.66 0.66 0.68 0.64 0.64
Clearance Time (s) 6.6 6.6 6.6 6.6 6.4 6.6 6.6 6.4 6.6 6.6
Vehicle Extension (s) 3.0 3.0 3.0 3.0 3.0 3.0 3.0 3.0 3.0 3.0
Lane Grp Cap (vph) 119 210 158 211 787 2262 987 386 2145 988
v/s Ratio Prot 0.02 0.05 c0.01 c0.29 0.01 0.08
v/s Ratio Perm 0.01 c0.09 0.11 0.05 0.09 0.00
v/c Ratio 0.08 0.18 0.66 0.39 0.16 0.43 0.08 0.13 0.13 0.01
Uniform Delay, d1 45.7 46.4 49.5 47.7 4.9 9.7 7.3 6.4 8.5 7.9
Progression Factor 1.00 1.00 1.00 1.00 1.00 1.00 1.00 1.00 1.00 1.00
Incremental Delay, d2 0.3 0.4 9.5 1.2 0.1 0.6 0.2 0.2 0.1 0.0
Delay (s) 46.1 46.8 59.0 48.9 5.0 10.3 7.5 6.6 8.7 7.9
Level of Service D D E D A B A A A A
Approach Delay (s) 46.7 52.8 9.4 8.3
Approach LOS D D A A
Intersection Summary
HCM 2000 Control Delay 17.1 HCM 2000 Level of Service B
HCM 2000 Volume to Capacity ratio 0.46
Actuated Cycle Length (s) 120.0 Sum of lost time (s) 19.6
Intersection Capacity Utilization 59.5% ICU Level of Service B
Analysis Period (min) 15
c Critical Lane Group
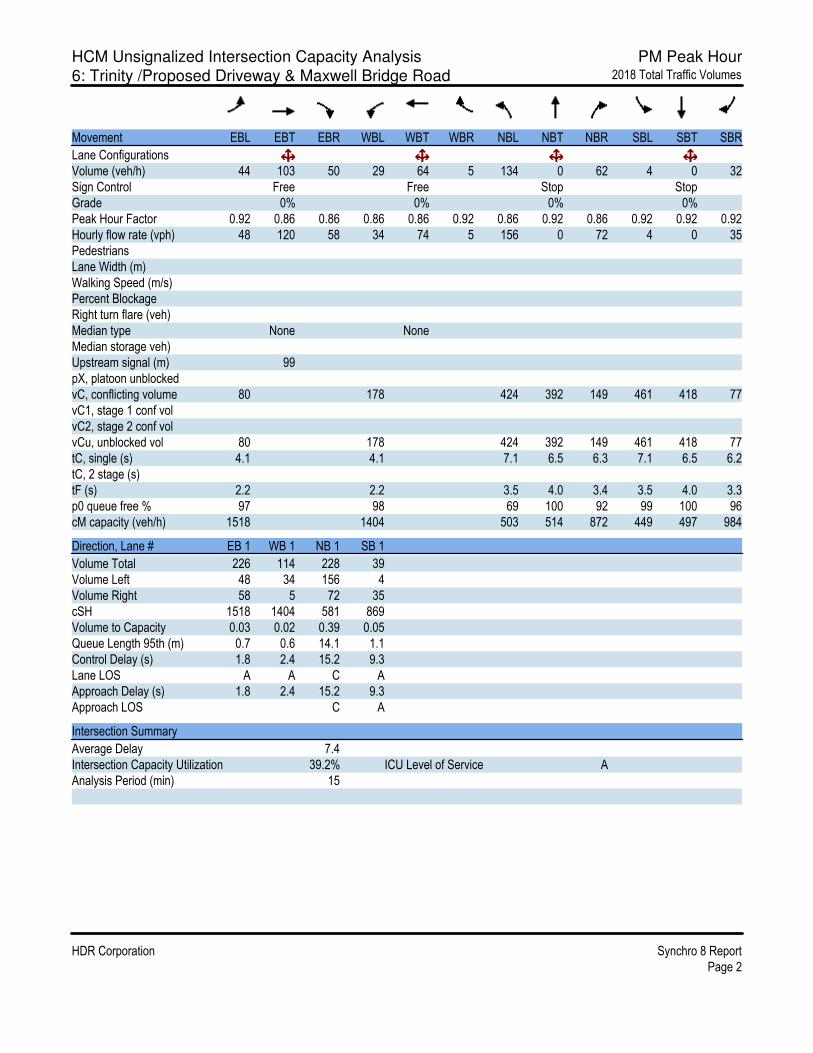
HCM Unsignalized Intersection Capacity Analysis PM Peak Hour
6: Trinity /Proposed Driveway & Maxwell Bridge Road 2018 Total Traffic Volumes
HDR Corporation Synchro 8 Report
Page 2
Movement EBL EBT EBR WBL WBT WBR NBL NBT NBR SBL SBT SBR
Lane Configurations
Volume (veh/h) 44 103 50 29 64 5 134 0 62 4 0 32
Sign Control Free Free Stop Stop
Grade 0% 0% 0% 0%
Peak Hour Factor 0.92 0.86 0.86 0.86 0.86 0.92 0.86 0.92 0.86 0.92 0.92 0.92
Hourly flow rate (vph) 48 120 58 34 74 5 156 0 72 4 0 35
Pedestrians
Lane Width (m)
Walking Speed (m/s)
Percent Blockage
Right turn flare (veh)
Median type None None
Median storage veh)
Upstream signal (m) 99
pX, platoon unblocked
vC, conflicting volume 80 178 424 392 149 461 418 77
vC1, stage 1 conf vol
vC2, stage 2 conf vol
vCu, unblocked vol 80 178 424 392 149 461 418 77
tC, single (s) 4.1 4.1 7.1 6.5 6.3 7.1 6.5 6.2
tC, 2 stage (s)
tF (s) 2.2 2.2 3.5 4.0 3.4 3.5 4.0 3.3
p0 queue free % 97 98 69 100 92 99 100 96
cM capacity (veh/h) 1518 1404 503 514 872 449 497 984
Direction, Lane # EB 1 WB 1 NB 1 SB 1
Volume Total 226 114 228 39
Volume Left 48 34 156 4
Volume Right 58 5 72 35
cSH 1518 1404 581 869
Volume to Capacity 0.03 0.02 0.39 0.05
Queue Length 95th (m) 0.7 0.6 14.1 1.1
Control Delay (s) 1.8 2.4 15.2 9.3
Lane LOS A A C A
Approach Delay (s) 1.8 2.4 15.2 9.3
Approach LOS C A
Intersection Summary
Average Delay 7.4
Intersection Capacity Utilization 39.2% ICU Level of Service A
Analysis Period (min) 15

HCM Unsignalized Intersection Capacity Analysis PM Peak Hour
9: March Road & Proposed Driveway 2018 Total Traffic Volumes
HDR Corporation Synchro 8 Report
Page 3
Movement WBL WBR NBT NBR SBL SBT
Lane Configurations
Volume (veh/h) 0 20 1044 11 0 332
Sign Control Stop Free Free
Grade 0% 0% 0%
Peak Hour Factor 0.92 0.92 0.92 0.92 0.92 0.92
Hourly flow rate (vph) 0 22 1135 12 0 361
Pedestrians
Lane Width (m)
Walking Speed (m/s)
Percent Blockage
Right turn flare (veh)
Median type None None
Median storage veh)
Upstream signal (m) 137
pX, platoon unblocked 0.86 0.86 0.86
vC, conflicting volume 1321 573 1147
vC1, stage 1 conf vol
vC2, stage 2 conf vol
vCu, unblocked vol 1059 194 857
tC, single (s) 6.8 6.9 4.1
tC, 2 stage (s)
tF (s) 3.5 3.3 2.2
p0 queue free % 100 97 100
cM capacity (veh/h) 190 704 674
Direction, Lane # WB 1 NB 1 NB 2 SB 1 SB 2
Volume Total 22 757 390 180 180
Volume Left 0 0 0 0 0
Volume Right 22 0 12 0 0
cSH 704 1700 1700 1700 1700
Volume to Capacity 0.03 0.45 0.23 0.11 0.11
Queue Length 95th (m) 0.7 0.0 0.0 0.0 0.0
Control Delay (s) 10.3 0.0 0.0 0.0 0.0
Lane LOS B
Approach Delay (s) 10.3 0.0 0.0
Approach LOS B
Intersection Summary
Average Delay 0.1
Intersection Capacity Utilization 40.8% ICU Level of Service A
Analysis Period (min) 15

HCM Signalized Intersection Capacity Analysis Sat PM Peak
3: March Road & Old Carp Road/Maxwell Bridge Road 2018 Total Traffic Volumes
HDR Corporation Synchro 8 Report
Page 1
Movement EBL EBT EBR WBL WBT WBR NBL NBT NBR SBL SBT SBR
Lane Configurations
Volume (vph) 10 28 40 169 38 60 75 355 137 102 387 11
Ideal Flow (vphpl) 1800 1800 1800 1800 1800 1800 1800 1800 1800 1800 1800 1800
Total Lost time (s) 6.6 6.6 6.6 6.6 6.6 6.6 6.6 6.6 6.6 6.6
Lane Util. Factor 1.00 1.00 1.00 1.00 1.00 0.95 1.00 1.00 0.95 1.00
Frt 1.00 0.91 1.00 0.91 1.00 1.00 0.85 1.00 1.00 0.85
Flt Protected 0.95 1.00 0.95 1.00 0.95 1.00 1.00 0.95 1.00 1.00
Satd. Flow (prot) 1729 1660 1729 1640 1729 3390 1517 1729 3357 1547
Flt Permitted 0.69 1.00 0.71 1.00 0.50 1.00 1.00 0.52 1.00 1.00
Satd. Flow (perm) 1251 1660 1289 1640 917 3390 1517 949 3357 1547
Peak-hour factor, PHF 0.91 0.91 0.91 0.91 0.91 0.91 0.91 0.91 0.91 0.91 0.91 0.91
Adj. Flow (vph) 11 31 44 186 42 66 82 390 151 112 425 12
RTOR Reduction (vph) 0 35 0 0 52 0 0 0 52 0 0 4
Lane Group Flow (vph) 11 40 0 186 56 0 82 390 99 112 425 8
Heavy Vehicles (%) 0% 0% 0% 0% 2% 0% 0% 2% 2% 0% 3% 0%
Turn Type Perm NA Perm NA Perm NA Perm Perm NA Perm
Protected Phases 4 8 2 6
Permitted Phases 4 8 2 2 6 6
Actuated Green, G (s) 19.6 19.6 19.6 19.6 62.2 62.2 62.2 62.2 62.2 62.2
Effective Green, g (s) 19.6 19.6 19.6 19.6 62.2 62.2 62.2 62.2 62.2 62.2
Actuated g/C Ratio 0.21 0.21 0.21 0.21 0.65 0.65 0.65 0.65 0.65 0.65
Clearance Time (s) 6.6 6.6 6.6 6.6 6.6 6.6 6.6 6.6 6.6 6.6
Vehicle Extension (s) 3.0 3.0 3.0 3.0 3.0 3.0 3.0 3.0 3.0 3.0
Lane Grp Cap (vph) 258 342 265 338 600 2219 993 621 2197 1012
v/s Ratio Prot 0.02 0.03 0.12 c0.13
v/s Ratio Perm 0.01 c0.14 0.09 0.07 0.12 0.01
v/c Ratio 0.04 0.12 0.70 0.16 0.14 0.18 0.10 0.18 0.19 0.01
Uniform Delay, d1 30.2 30.7 35.0 31.0 6.2 6.4 6.1 6.4 6.5 5.7
Progression Factor 1.00 1.00 1.00 1.00 1.00 1.00 1.00 1.00 1.00 1.00
Incremental Delay, d2 0.1 0.2 8.1 0.2 0.5 0.2 0.2 0.6 0.2 0.0
Delay (s) 30.3 30.8 43.1 31.2 6.7 6.6 6.3 7.1 6.7 5.7
Level of Service C C D C A A A A A A
Approach Delay (s) 30.7 38.7 6.5 6.7
Approach LOS C D A A
Intersection Summary
HCM 2000 Control Delay 14.0 HCM 2000 Level of Service B
HCM 2000 Volume to Capacity ratio 0.31
Actuated Cycle Length (s) 95.0 Sum of lost time (s) 13.2
Intersection Capacity Utilization 49.4% ICU Level of Service A
Analysis Period (min) 15
c Critical Lane Group

HCM Unsignalized Intersection Capacity Analysis Sat PM Peak
6: Trinity /Proposed Driveway & Maxwell Bridge Road 2018 Total Traffic Volumes
HDR Corporation Synchro 8 Report
Page 2
Movement EBL EBT EBR WBL WBT WBR NBL NBT NBR SBL SBT SBR
Lane Configurations
Volume (veh/h) 138 58 81 12 47 15 100 0 41 9 0 121
Sign Control Free Free Stop Stop
Grade 0% 0% 0% 0%
Peak Hour Factor 0.92 0.89 0.89 0.89 0.89 0.92 0.89 0.92 0.89 0.92 0.92 0.92
Hourly flow rate (vph) 150 65 91 13 53 16 112 0 46 10 0 132
Pedestrians
Lane Width (m)
Walking Speed (m/s)
Percent Blockage
Right turn flare (veh)
Median type None None
Median storage veh)
Upstream signal (m) 99
pX, platoon unblocked
vC, conflicting volume 69 156 630 507 111 545 544 61
vC1, stage 1 conf vol
vC2, stage 2 conf vol
vCu, unblocked vol 69 156 630 507 111 545 544 61
tC, single (s) 4.1 4.1 7.1 6.5 6.2 7.1 6.5 6.2
tC, 2 stage (s)
tF (s) 2.2 2.2 3.5 4.0 3.3 3.5 4.0 3.3
p0 queue free % 90 99 64 100 95 98 100 87
cM capacity (veh/h) 1532 1436 316 419 948 393 399 1004
Direction, Lane # EB 1 WB 1 NB 1 SB 1
Volume Total 306 83 158 141
Volume Left 150 13 112 10
Volume Right 91 16 46 132
cSH 1532 1436 392 906
Volume to Capacity 0.10 0.01 0.40 0.16
Queue Length 95th (m) 2.5 0.2 14.5 4.2
Control Delay (s) 4.1 1.3 20.3 9.7
Lane LOS A A C A
Approach Delay (s) 4.1 1.3 20.3 9.7
Approach LOS C A
Intersection Summary
Average Delay 8.7
Intersection Capacity Utilization 50.1% ICU Level of Service A
Analysis Period (min) 15

HCM Unsignalized Intersection Capacity Analysis Sat PM Peak
9: March Road & Proposed Driveway 2018 Total Traffic Volumes
HDR Corporation Synchro 8 Report
Page 3
Movement WBL WBR NBT NBR SBL SBT
Lane Configurations
Volume (veh/h) 0 44 396 29 0 500
Sign Control Stop Free Free
Grade 0% 0% 0%
Peak Hour Factor 0.92 0.92 0.92 0.92 0.92 0.92
Hourly flow rate (vph) 0 48 430 32 0 543
Pedestrians
Lane Width (m)
Walking Speed (m/s)
Percent Blockage
Right turn flare (veh)
Median type None None
Median storage veh)
Upstream signal (m) 137
pX, platoon unblocked 0.97 0.97 0.97
vC, conflicting volume 718 231 462
vC1, stage 1 conf vol
vC2, stage 2 conf vol
vCu, unblocked vol 646 143 382
tC, single (s) 6.8 6.9 4.1
tC, 2 stage (s)
tF (s) 3.5 3.3 2.2
p0 queue free % 100 94 100
cM capacity (veh/h) 392 851 1137
Direction, Lane # WB 1 NB 1 NB 2 SB 1 SB 2
Volume Total 48 287 175 272 272
Volume Left 0 0 0 0 0
Volume Right 48 0 32 0 0
cSH 851 1700 1700 1700 1700
Volume to Capacity 0.06 0.17 0.10 0.16 0.16
Queue Length 95th (m) 1.4 0.0 0.0 0.0 0.0
Control Delay (s) 9.5 0.0 0.0 0.0 0.0
Lane LOS A
Approach Delay (s) 9.5 0.0 0.0
Approach LOS A
Intersection Summary
Average Delay 0.4
Intersection Capacity Utilization 22.5% ICU Level of Service A
Analysis Period (min) 15