81670124 pranavi-final
128
Ratio Analysis at Finance: Finance is the application of skills and care to manipulation, use and control of money. Finance has aptly been called the “science of money”. It deals with the principles and the method of money from those who have saved it and administrating it by those who control it passes. Finance is the process of converting accumulated funds to productive use. Different scholars have inter prated the term finance differently. Different views points on finance have categorized in to the 3 following major group. According to the first approach finance concerns with acquiring funds on reasonable terms and conditions to pay bills promptly. According to second approach to finance look on it as being concerned with cash. The third approach to finance looks on it as being concerned with procurement of funds and their wise application. Finance is one of the major elements, which activate the overall growth of the economy activity. A well-kit financial system directly contributes to the growth of the economy. An efficient financial system calls for the effective performance of institutions, financial instruments and financial markets. According to our present day economy, “Finance is defined as the provision of the money at the time when it is required. Every enterprise whether it is small, medium or big needs finance to carry on its operations and to achieve its targets. In fact, finance is so indispensable today that it is called the lifeblood of an enterprise. Without adequate finance no enterprise can possibly accomplish its objectives. BBM @ B.M.S.C.W, 2010 1
Transcript of 81670124 pranavi-final

Ratio Analysis at
Finance:
Finance is the application of skills and care to manipulation, use and control of
money. Finance has aptly been called the “science of money”. It deals with the
principles and the method of money from those who have saved it and
administrating it by those who control it passes. Finance is the process of
converting accumulated funds to productive use. Different scholars have inter
prated the term finance differently. Different views points on finance have
categorized in to the 3 following major group.
According to the first approach finance concerns with acquiring funds on
reasonable terms and conditions to pay bills promptly.
According to second approach to finance look on it as being concerned with cash.
The third approach to finance looks on it as being concerned with procurement of
funds and their wise application.
Finance is one of the major elements, which activate the overall growth of the
economy activity. A well-kit financial system directly contributes to the growth of
the economy. An efficient financial system calls for the effective performance of
institutions, financial instruments and financial markets.
According to our present day economy, “Finance is defined as the provision of the
money at the time when it is required. Every enterprise whether it is small,
medium or big needs finance to carry on its operations and to achieve its targets.
In fact, finance is so indispensable today that it is called the lifeblood of an
enterprise. Without adequate finance no enterprise can possibly accomplish its
objectives.
BBM @ B.M.S.C.W, 2010 1

Ratio Analysis at
According to Bonneville and Dewey “Finance consists of rising, providing and
managing of all the money, capital or funds of any kind to be used in connection
with business.”
A finance industry may be defined as the collection of organization that
intermediate and facilities financial transactions individuals and institutions.
The subject of finance has been classified in to two classes:
a) Public finance
b) Private finance
Public Finance:
The Public finance deals with the receipts and requirements and disbursement of
funds in government institutions like states, central government and local self-
governments.
Private Finance:
The Private finance is concerned with the receipts, requirements and
disbursements of an individual and non-profit seeking business organization and
non-profit organization. Personal or individual finance deals with the analysis of
principles and practices involved in managing daily needs of funds.
Organization of Finance Department:
The organization structure of finance is an important functional department.
Experts feel that finance has more significance than the other functional
BBM @ B.M.S.C.W, 2010 2

Ratio Analysis at
departments. It is established directly under the control of board of directors. The
structure and the size of finance department differ from one industry to another
industry. If the size of the industry is small, owners themselves will have the
responsibility of finance function. If the size of the organization is big an
individual finance department will be established. It may in form of centralized or
decentralized unit. The top management controls the finance function, because the
survival and growth mainly depends upon the sound financial decisions taken by
the firm.
The finance function, although is controlled by the top management. There will be
a separate expert team look after their activities and this function will be sub-
divided according to the needs. A common structure of finance department cannot
be evolved, as the size of the firm and nature of business vary from firm to firm.
However a general organizational structure can be thought of:
The finance function can be broadly dividend into two parts:
1) Routine matters or day to day functional transactions like custody of cash
and bank accounts, collection of loans, payments of cash for transactions
ect.
2) Special financial function like:
• Functional planning and budgeting
• Investment decisions
• Cost accounting
• Profit analysis
• Financial accounting
BBM @ B.M.S.C.W, 2010 3

Ratio Analysis at
• Internal audit
Finance Manager:
Finance manager is a person who heads the department of finance. He forms
important activities in connection with each of the general functions of
management. He groups activities in such a way that areas of responsibility and
accountability are clearly defined. His focus is on profitability of the firm. The
profit center is a technique by which activities are decentralized for the developed
of strategic control point. The determination of nature and extend of staffing is
aided by financial budgeting programmers. Planning involves heavy reliance on
financial tools and analysis. Control requires the use of techniques of financial
ratios and standard. Briefly, an informed and enlightened use of financial
information is necessary for the purpose of co-coordinating the activities of an
enterprise. Every business, irrespective of its size, should therefore, have a
financial manager who has to take key decisions on the allocation of funds to
various departments of the business. If the financial manager handles each of these
tasks well, his firm is on top management; he should shape his decisions and
recommendations to contribute to over all progress of the business. It is primarily
objective, to maximize the value of the firm to its stockholders.
Functions of Finance Manager:
The following are some of the important functions of the finance manager:
• He should anticipate and estimate the total financial requirements of the
firm.
BBM @ B.M.S.C.W, 2010 4

Ratio Analysis at
• He has to select the right sources at the right time and at the right cost.
• He has to allocate the available funds in the profitable avenues.
• He has to maintain liquidity position of firm at the peak.
• He should analyze financial performance and plan for its growth.
• He has to administrate of working capital management.
• He has to protect the interest of creditors, shareholders and employees.
• He has to concentrate more on fulfilling the social obligation of business
unit.
Financial Management:
Financial management as an academic discipline, has undergone, fundamental
changes with respect to its scope and coverage. In the early years of its evolution,
it was treated synonymously with the raising of funds. In the current literature
pertaining to these growing disciplines, a broader scope, so as to include in
addition to procurement of funds efficient use of resource is universally
recognized. The academic is thinking with respect to the objects of financial
management and also characterized by a change over the years.
Financial management is the area of business management devoted to a judicious
use of capital and a careful selection of sources of capital in order to enable a
business firm to move in the direction of reaching its goal. It is a managerial
activity, which is concerned with the planning and controlling of the firm’s
financial resources. As a separate activity on discipline it is of recent origin. It was
BBM @ B.M.S.C.W, 2010 5
Ratio Analysis at
a branch of economics till 1890. Still today, it has no unique body of knowledge of
its own, and draws heavily on economics for its theoretical concepts.
The company is made to know of cash. Management, inventory management, ratio
analysis account receivable management, working capital finance, the customer
delight, through proper observations findings, to enhance its strength over the
activities of financial management and service, where it is a need.
As the company is not so aware about the above aspects, I have taken an
opportunity to suggest the company, over its activities regarding financial
management to the customers, which help the company to enhance its sales, the
financial strength over the period of time, which helps me apply the theoretical
Study into practical to gain exposure about the activities of the company and gain
experience over companies.
Financial management helps the company to know where the funds will be
obtained, in what amount fund would be raised, how much to invest in a particular
work, how to plan the proper utilization of the available fund and also to avoid the
misuse of available fund.
Definitions of Financial Management:
According to Professor EZIRA SOLOMAN “Financial management has
concerned with the efficient use of and important economic resources namely
capital funds. The company is made to know of cash. Management, inventory
management, ratio analysis account receivables management, working capital
finance, the customer delight, through proper observations and findings, to
BBM @ B.M.S.C.W, 2010 6

Ratio Analysis at
enhance its strength over the activities of financial management and services,
where it is a need.
According to PHILIPPTOS “Financial management is concerned with the
managerial decision, the results in the acquisitions and financing of long term and
short term assets for the company. As such it deals with the situation that requires
the selection of specific assets, selection of specific liability as well as the problem
of size and growth of enterprise. The analysis of these decisions is based on the
expected and inflow and outflow of funds and their effects upon managerial
objectives.
Financial management has concerned with the efficient use of and important
economic resources namely capital funds. Financial management is concerned
with the managerial decision that results in the acquisitions and financing of long
term and short term assets for the company. As such it deals with the situation that
requires the selection of specific assets, selection of specific liability as well as the
problem of size and growth of enterprise. The analysis of these decisions is based
on the expected and inflow and outflow of funds and their effects upon managerial
objectives.
Financial management is the area of business management devoted to a judicious
use of capital and a careful selection of sources of capital in order to enable a
business firm to move in the direction of reaching its goal. It is a managerial
activity, which is concerned with the planning and controlling of the firms
financial resources. As a separate activity on discipline it is of recent origin. It was
a branch of economics till 1890. Still today, it has no unique body of knowledge of
its own and draws heavily on economics for its theoretical concepts.
BBM @ B.M.S.C.W, 2010 7
Ratio Analysis at
Objectives of Financial Management:
The objectives provide a framework for optimum financial decision-making. In
other words they are concerned with designing a method of operating the internal
investments and financing of a firm. We discuss in this section the alternative
approaches in financial literature.
Financial management of any business firm has to set goals for and to interpret
them in relation to the objectives of the firm. Broadly there are only two
alternatives goals/objectives of financial management.
The goals/objectives of financial management can be broadly classified into two
categories namely:
1) Primary objectives
2) Secondary objectives
Primary objective:
1) Maintenance of adequate liquid assets of the company:
Maintenance of adequate liquid assets in the company is one of the basic
objectives of financial management. This objective implies the financial
management should ensure the availability of adequate fund in the hands of
the organization throughout to meet its obligations.
2) Profit maximization:
Profit earning is the main aim of every economic activity. A business being an
economic institution must earn profits to cover its costs and provide funds for
growth. No business can survive without earning profits. Profits also serve as
BBM @ B.M.S.C.W, 2010 8

Ratio Analysis at
a measure of efficiency of a business enterprise. The accumulated profits
enable a business to face risks like fall in prices, competition from other units,
adverse government policies etc. Thus profit maximization is considered as
the main objective of business.
3) Wealth maximization:
It is the appropriate objective of an enterprise. Wealth maximization guides
the management in framing consistent strong dividend policy to reach
maximum returns to the equity holders. Financial theory asserts that wealth
maximizes the stockholders wealth; the individual stockholders can use this
wealth to maximize his utility. It means that by maximizing stockholders
wealth the firm is operating consistently towards maximizing stockholders
utility.
Secondary objectives:
1) Ensuring maximum operational efficiency through proper planning,
implementing and controlling the utilization of funds that is through
the effective employment of funds.
2) Enforcing financial management disciplines in the use of financial
management through the co-ordination of the operations of various
departments in the organizations.
3) Building up adequate reserves for financial growth and expansions.
4) Ensuring a fair retain of the shareholders of their investments.
BBM @ B.M.S.C.W, 2010 9
Ratio Analysis at
Importance of Financial Management:
1) Finance is the lifeblood of business. Every business unit needs money and
it happen only when it is managed properly. That means sound financial
management is absolutely necessary for every business units, which wants
to make more money.
2) “Bad production management and bad sales management make stain in
hundreds but faculty finance is changing thousands”- says Collin Brooks,
who elucidates has important, it is to manage the flow of funds in an
organization.
3) Financial management helps a company in making the effective
employment of funds by away fixed assets that is, fixed capital as well as
current assets that is working capital.
4) Financial management helps a company that is optimizing the output from
given input of funds.
5) Financial management helps a company n profit planning, capital
budgeting, controlling, inventories and account receivables etc.
6) Financial management is important even for non-profit making
organization as it helps them to control the costs and to use the funds at
their disposing the most useful manner.
7) Where the funds will obtained, in what amount fund would be raised, how
much to invest in a particular work, hoe to plan the proper utilization of the
available fund and also to avoid he misuse of available fund.
8) Financial management is absolutely necessary for every business unit,
which wants to make money.
BBM @ B.M.S.C.W, 2010 10

Ratio Analysis at
9) Financial management helps the company to optimize the output from the
given input of funds, and helps a company in profit planning.
10)Financial management is very important to manage the flow of funds in an
organization.
Financial Management Process:
The financial management process begins within the financial planning and
decisions. While implementations of these decisions the firm has to acquire
certain risk and return characteristic. These characteristics determine the
market process must include the feedback system to enable it take corrective
measures if required
Decisions in Financial Management:
1) Investment decision: Capital expenditure and revenue expenditure.
2) Financing decision: Long term and short term.
3) Dividend decisions: Increased dividend and increased capital gain.
4) Current asset management: Continuous flow of materials and money and
maintaining liquidates.
A’s of Financial Management:
• Anticipating financial needs
• Acquiring financial resources
• Allocating fund in business
BBM @ B.M.S.C.W, 2010 11

Ratio Analysis at
• Administrating the allocation of funds
• Analyzing the performance of finance
• Accounting and reporting to the management
Meaning of financial statements:
A Financial statement is an organized collection of data according to logical and
consistent accounting procedures. Its purpose is to convey an understanding of
some financial aspects of a business firm. It may show opposition at a movement
of time as in the case of balance sheet, or may reveal a series of activities over a
given period of time.
A financial statement is an organized collection of data according to logical and
consistent accounting procedures. Its purpose is to convey an understanding of
some financial aspects of a business firm. It may show opposition at a movement
of time as in the case of balance sheet, or may reveal a series of activities over a
given period of time.
Thus, the term financial statement generally refers to two basic statements:
• Income statement or balance sheet
• Profit and loss account
Balance sheet :
The balance sheet shows the financial condition of a business at a given point of
time, in terms of assets and liabilities.
BBM @ B.M.S.C.W, 2010 12

Ratio Analysis at
Assets are classified into the following categories:
1) Fixed assets
2) Investments
3) Current assets
4) Loans and advances
5) Miscellaneous expenditures and losses.
Liabilities are classified as follows:
1) Share capital
2) Reserves and surplus
3) Secured loans
4) Unsecured loans
5) Current liabilities and provisions
As per the companies act, the balance sheet of the company shall be in either the
horizontal form or the vertical form.
Profit and loss account :
The profit and loss account technically is an adjunct to the balance sheet because it
provides details relating to net profit, which reprints the change in owner’s equity.
Yet, in practice it is often considered to be more important than the balance sheet
because the details of revenues and expenses is provided in the profit and loss
account shed considerable light on the performance of the business. There is no
prescribed standard format to make this account. However, the companies act does
require that the information provided should be adequate to reflect a true and a fair
BBM @ B.M.S.C.W, 2010 13

Ratio Analysis at
picture if the operation of the company for the accounting period. The important
items in the profit and loss account are:
• Net sales
• Cost of goods sold
• Gross profit
• Operating expenses
• Operating profit
• Non-operating surplus/deficit
• Profit before interest and tax
• Interest
• Profit before tax
• Profit after tax
To these statements are added the statement of retained earnings and some other
statements (as fund flow statements, cash flow statements etc) and schedules of
fixed assets (as investments, current assets etc). All these statements are
collectively called as package of financial statements.
Statement of Retained Earnings:
It is also termed as profit and loss appropriation account. The statements or the
account gives details of the distribution of earnings during a particular accounting
period. The balance shown by the income statement is transferred to the balance
sheet through these statements after making necessary appropriations. The balance
of this account represents the retained earnings that is, accumulated excess of
BBM @ B.M.S.C.W, 2010 14

Ratio Analysis at
earnings over losses and dividends. The statements are connecting link between
the balance sheet and income statements.
Nature of Financial Statements:
a) These are reports or summarized reviews about the performance,
achievements and weakness of the business.
b) These are prepared at the end of the accounting period so that various
parties may take decision of their future actions in respect of the
relationship with the business.
c) The reliability of financial statements depends on the reliability of
accounting data. These statements cannot be said to be true and fair
representative of the strength or profitability of the concerned if there are
numerous frauds and defalcations in the accounts.
d) There may be certain developments and factors, which may be very
important for the business, are not taken into account, as these are not
recorded in the routine of accounting.
e) These statements are prepared as per accounting concepts and conventions.
Significance of Financial Statements:
1) OWNERS: The owners provide funds for the operations of a
business and they want to know whether their funds are being
properly utilized or not. The financial statements prepared from time
to time satisfy their curiosity.
BBM @ B.M.S.C.W, 2010 15

Ratio Analysis at
2) INVESTORS: Prospective investors, who want to invest money in a
firm, would like to make an analysis of the financial statements of
that firm to know how safe proposed investment will be.
3) GOVERNMENT: Central and state governments are interested in
the financial statements because they reflect the earnings for a
particular period for purposes of taxation. Moreover, these financial
are used for compiling statistics concerning business, which in turn,
help in compiling national accounts.
4) CONSUMERS: Consumers are interested I the establishment of
good accounting control so that cost of production may be reduced
with the resultant reduction of the prices of goods they buy.
Limitations of Financial Statements:
1) Interim and not final reports: Financial statements do not depict the exact
position and are essentially interim reports.
2) Lack of precision and definiteness: Financial statements may not be
realistic because these are prepared by following certain basic concepts and
conventions.
3) Lack of objective judgments: Financial statements are influenced by the
personal judgments of the accountant.
4) Record only monetary facts: Financial statements disclose only monetary
facts that are those transactions are recorded in the books of accountants,
which can be measured in monetary terms.
BBM @ B.M.S.C.W, 2010 16

Ratio Analysis at
5) Artificial view: These statements do not give a real and correct report
about the worth of the assets and their loss of value as these are shown on
historical cost basis.
6) Scope of manipulations: These statements are sometimes prepared
according to the needs of the situation or the whims of the management.
Analysis of Financial Statements:
Analysis is the process of critically examining in detail accounting information
given in the financial statements. For the purpose of analysis, individual items are
studied: their interrelationship with other related figures established, the data is
sometimes rearranged to have better understanding of the information with the
help of different techniques or tools for the purpose. Analysis financial statements
is a process of evaluating relationship between component parts of financial
statements to obtain a better understanding to obtain a better understanding of
firms position and performance.
In the words of Myer, “Financial statements analysis is largely a study of
relationship among the various financial factors in a business as disclosed by a
single set of statements and a study of the trend of these factors as shown in a
series of statements”.
Financial Performance:
Financial performance is about knowing how the firm is doing and what its
financial condition is. The stakeholders of a firm, viz. shareholder, creditors,
BBM @ B.M.S.C.W, 2010 17

Ratio Analysis at
suppliers, managers, employees, tax, authorized and others are interested in
broadly knowing about the firm’s financial conditions. Of course, their specific
concerns may differ. Trade creditors and short-term liquidity of the firm and its
ability to pay is due in next 12 months or so on. Term lending institution and
debentures holders have a relatively longer time horizon and are concerned
about the ability of the firm to services its debt over the next five to ten years.
Long-term shareholders and mangers that want to make a career with the firm
are interested in the profitability and growth of the firm over an extended
period of time.
To understand the financial performance and condition of a firm, its
stakeholders look at their financial statements:
a) The Balance sheet
b) The profit and loss account
c) The sources and uses of funds statements
Financial Analysis:
The term “financial analysis” is also known as the analysis and interpretation of
financial statement refers to the process of determining financial strength and
weakness of the firm establishing strategic relationship between the items of the
balance sheet, profit and loss account and operative data.
Definition of Financial Analysis:
According to Metalf and Titard, “It is a process of evaluating the relationship
between components part of a financial statement to obtain a better understanding
of a firm’s position and performance”.
BBM @ B.M.S.C.W, 2010 18

Ratio Analysis at
In the words of Myers “Financial statements analysis is largely a study or
relationship among the various financial factors in a business as described by a
single set of statements and a study of the trend of these factors as shown in a
series of statements.”
Needs of Financial Analysis:
Lenders’ need financial analysis for carrying out the following:
Technical Appraisal
Commercial Appraisal
Financial Appraisal
Economic Appraisal
Management Appraisal
Uses of Financial Analysis:
1) The present and future earning capacity or profitability of the
concern.
2) The operational efficiency of the concern as whole and of its various
parts or departments.
3) The short-term and long-term solvency of the concern for the benefit
of the debenture holders and trade creditors.
4) The financial stability of the business concern.
5) The long-term liquidity of its funds.
BBM @ B.M.S.C.W, 2010 19

Ratio Analysis at
Techniques of Financial Analysis:
The analysis and interpretation of financial statements is used to determine the
financial position and results of operations as well. A number of methods or
devices are used to study the relationship between different statements. They are
as follows:
1) Comparative financial statements :
Comparative financial statements are those statements that have been so
designed in a way so as to provide time perspective to the consideration of
various elements of financial position embodied in such statements. In these
statements, figures for two or more periods are placed side by side to facilitate
comparison. Both the income statements and balance sheet can be prepared in
the form of comparative financial statements.
a) Comparative income statement : The income statement discloses
net profit or net loss on account of operations. A comparative
income statement will show the absolute figures for two or more
periods, the absolute change from one period to another and if
desired the change in terms of percentage. Since the figures for two
or more periods are shown side by side, the reader can quickly
ascertain whether sales have increased or decreased, whether cost of
sales has increased or decreased etc. Thus, only a reading of data
BBM @ B.M.S.C.W, 2010 20

Ratio Analysis at
include in comparative income statements will be helpful in deriving
meaning full conclusions.
b) Comparative balance sheet : The comparative balance sheet as on
two or more different dates can be used for comparing assets and
liabilities and finding out any increase or decrease in those items.
Thus, while in a single balance sheet the emphasis is on present
position, it is on change in the comparative balance. Such a balance
sheet is very useful in studying the trends in an enterprise.
Comparative financial statements can be prepared for more than two
periods or on more than two decades. However, it becomes very
cumbersome to study the trend with more than two period data.
2)Common size financial statements:
Common size financial statements are those in which figures reported are
comforted into percentage to some common base. In the income statement the
sales figures is assumed to be 100 and all figures are expressed as a percentage
of sales. Similarly in the balance sheet the total of assets or liabilities is taken
100 and all the figures are expressed as a percentage of this total.
a) Common size balance sheet : In the common size balance sheet, total
assets or liabilities is taken as 100 and all the figures are expressed as
percentage of total. Comparative common size balance sheet for
different period helps to highlight the trends in different items.
BBM @ B.M.S.C.W, 2010 21
Ratio Analysis at
b) Common size income statements : In such statements, sales figure is
assumed to be equal to 100 and all other figures of cost or expenses are
expressed as a percentage of sales. Comparative income statements for
different periods help to reveal the efficiency or otherwise have
incurring any cost or expenses.
3) Trend percentages :
Trend percentages are immensely helpful in making a comparative study of
financial statements for several years. The method of calculating trend
percentages involves the calculation of percentage relationship that each item
bears to the same item in the base year. Any year item may be taken as the
base year. Each item of the base year is taken as 100 and on that basis the
percentages for each of the items of each of the years are calculated. These
percentages can be taken as index numbers showing the related changes in the
financial data resulting with the passage of time. The method of trend
percentages is a useful, analytical device for the management since by
substitution of percentages for large amounts; the brevity and readability are
achieved. However, trend percentages are not calculated for all the items in the
financial statements. They are usually calculated for major items since the
purpose is to highlight important changes.
4)Funds flow analysis:
Fund flow analysis has become an important tool in the analytical kit of
financial analysis; credit granting institution and financial managers. This is
BBM @ B.M.S.C.W, 2010 22
Ratio Analysis at
because the balance sheet of a business reveals its financial status at a
particular point of time. It does not sharply focus those major financial
transactions, which have been behind the balance sheet changes. Fund flow
analysis reveals the changes in working capital position. It tells about the
source from which it was used. It brings out in open the change, which have
taken place behind the balance sheet. Working capital being the lifeblood of
the business such an analysis is extremely useful growth of the business.
5) Cost volume profit analysis :
Cost volume profit analysis is an important tool of profit planning; it studied
the relationship between cost volume of production, sales and profit. Of course
it is not strictly a technique used for analysis of financial statements. It is an
important tool for the management for decision making from the data provided
by both cost and financial records. It tells the volume of sales at which the
firm will breakeven, the effort on profit on account of variation in output,
selling prices and cost, and finally, the quantity to be produced and sold to
reach the target profit level.
6) Cash flow analysis :
This statement is prepared to know clearly the various items of inflow and
outflow of cash. It is an essential tool for short-term financial analysis and is
very helpful in the evaluation of current liability of a business concern. It helps
the business executives in efficient cash management and the internal financial
management.
BBM @ B.M.S.C.W, 2010 23

Ratio Analysis at
7) Ratio analysis :
Ratio analysis is a technique of calculation of number of accounting ratios
from the data found in the financial statements, the comparison of these
accounting ratios with those of the previous years or with those of others
concerns engaged in similar line of activities or with those of standard ratios
and interpretation of its comparison. Ratio analysis means a tool used by
individuals to conduct a quantitative analysis of information in a company's
financial statements. Ratios are calculated from current year numbers and are
then compared to previous years, other companies, the industry, or even the
economy to judge the performance of the company. Ratio analysis is
predominately used by proponents of fundamental analysis.
RATIO ANALYSIS
Meaning of Ratio:
The term ratio refers to expressing the relationship between two quantities of the
same kind. In other words, it expresses one number in terms of another number. It
BBM @ B.M.S.C.W, 2010 24
Ratio Analysis at
is a measure of the relationship between two magnitudes. It may be defined as the
indicated quotient of two mathematical expression of the quant able between two
numbers.
Ratio analysis means a tool used by individuals to conduct a quantitative analysis
of information in a company's financial statements. Ratios are calculated from
current year numbers and are then compared to previous years, other companies,
the industry, or even the economy to judge the performance of the company. Ratio
analysis is predominately used by proponents of fundamental analysis.
It’s a tool, which enables the banker or lender to arrive at the following factors:
Liquidity position
Profitability
Solvency
Financial Stability
Quality of the Management
Safety & Security of the loans & advances to be or already been provide.
A ratio is a simple arithmetical expression of the relationship of one number to
another. According to ACCOUNTANTS HANDBOOK by WIXON, KELL and
BEDFORD, A ratio is “an expression of the quantitative relationship between two
numbers”.
BBM @ B.M.S.C.W, 2010 25

Ratio Analysis at
The ratio analysis is one of the most powerful tools of financial analysis. It is the
process of establishing and interpreting various ratios. It is with the help of ratios
that the financial statements can be analyzed more clearly and decisions can be
made more effectively.
A financial ratio is the relationship between two accounting figures expressed
mathematically. In simple terms it is one number expressed in terms of another
and can be worked out by dividing one number into the other. Therefore ratio
analysis is a tool to present the figures of financial statements in simple, concise
and intelligible form. Ratio analysis, in this way is the process of establishing
meaningful relationship between two figures or set of figures of financial
statements
Nature of Ratio Analysis:
Ratio analysis is a technique of analysis and interpretation of financial statements.
It is the process of establishing and interpreting various ratios for helping in
making certain decisions. It is a means of better understanding of financial
strengths and weakness of a firm.
The following are the four steps involved in the ratio analysis:
1) Selection of relevant data from the financial statements depending upon
the objectives of the analysis.
2) Calculation of appropriate ratios from the above data.
3) Comparison of calculated ratios with the ratios of the same firm in the
past, or the ratios developed from projected financial statements or the
ratios of some other firms or the comparison with ratios of the industry to
which the firm belongs.
BBM @ B.M.S.C.W, 2010 26

Ratio Analysis at
4) Interpretation of the ratios.
Interpretation of the Ratios:
The interpretation of ratios is an important factor. Though calculation of ratios is
also important but it is only a clerical task whereas interpretation needs skill,
intelligence and foresightedness.
The interpretation of the ratios can be made in the following ways:
1) Single Absolute Ratio : Generally speaking one cannot draw any
meaningful conclusion when a single ratio is considered insulation. But
single ratio may be studied in relation to certain rules of thumb which are
based upon well proven conventions are for examples 2:1 is considered to
be a good ratio for current assets to current liabilities.
2) Group of Ratios : Ratios may be interpreted by calculating a group of
related ratios. A single ratio supported by other related additional ratios
becomes more understandable and meaningful. For example, the ratio of
current assets to current
Liabilities may be supported by the ratio of liquid assets to liquid liabilities
to draw more dependable conclusions.
3) Historical Comparison : One of the easiest and most popular ways of
evaluating the performance of the firm is to compare its present ratios with
BBM @ B.M.S.C.W, 2010 27
Ratio Analysis at
the past ratios called comparison overtime. When financial ratios compared
over a period of time, it gives an indication of the direction of change and
reflects whether the firm’s performance and financial position has
improved, deteriorated or remained constant over a period of time. But
while interpreting ratios from comparison over time, one has to be careful
about the changes, if any, in the firm’s policies and accounting procedures.
4) Projected Ratios : Ratios can also be calculated for future standards based
upon the projected or Performa financial statements. These future ratios
may be taken as standard for comparison and the ratios calculated on actual
financial statements can be compared with the standard ratios to find out
variance, if any. Such variances help in interpreting and taking corrective
action for improvement in future.
5) Inter-firm Comparison : Ratios of one firm can also be compared with the
ratios of some other selected firms in the same industry at the same point of
time. This kind of comparison helps in evaluating relative financial position
and performance of the firm. But while making use of such comparison one
has to be very careful regarding the different accounting methods, policies
and procedures adopted by different firms.
Ways of Ratio expressed:
As Percentage - such as 25% or 50%. For example if net profit is Rs.25,
000/- and the sales is Rs.1, 00,000/- then the net profit can be said to be
25% of the sales.
BBM @ B.M.S.C.W, 2010 28

Ratio Analysis at
As Proportion - The above figures may be expressed in terms of the
relationship between net profits to sales as 1: 4.
As Pure Number /Times - The same can also be expressed in an
alternatively way such as the sale is 4 times of the net profit or profit is 1/4th
of the sales.
Significance of Ratio Analysis:
• Helps in decision making
• Helps in financial forecasting and planning
• Helps in communication strength and weakness of the firm
• Helps in co-ordination
• Helps in control
• Useful in budgetary control and standard costing
BBM @ B.M.S.C.W, 2010 29

Ratio Analysis at
Uses of Ratio Analysis:
• Ratio analysis simplifies the understanding of financial statements.
• Ratio analysis establishes the inter-relationship between the he various
financial figures.
• Ratio analysis is an instrument for diagnosing the financial health of the
business
• Ratio analysis facilitates inter-firm and intra-firm comparison.
• Ratio analysis is invaluable aid to the management in the efficient
discharge of its basic functions.
• Ratios are very helpful in establishing standard costing system and
budgetary control system.
• Ratio analysis is useful not only to the management but also to the
outsiders like creditor’s investor’s banks and other financial institutions.
Objectives of Ratio:
1) Measurement of the profitability
2) Judging the operational efficiency of management
3) Assessing the efficiency of the business
4) Measuring short and long term financial position of the company
5) Facilitating comparative analysis of the performance
6) Indicator of true efficiency
7) Helpful in budgeting and forecasting
8) Helpful in simplifying accounting figures
BBM @ B.M.S.C.W, 2010 30
Ratio Analysis at
Limitations of Ratios Analysis:
• Ratios are calculated from the financial statements. The financial
statements are suffering from a number a number of limitations. The
ratios derived from such financial statements are also subject to those
limitations.
• There is no consistency in the meaning of certain accounting ratios.
• There is a danger of window dressing (that is showing the position in a
favorable manner than what actual it is) in ratio analysis.
• Ratios become meaningless if they detached from the details from
which they are derived.
• Rations alone are not adequate for judging the financial position of the
business.
• Ratios are tools of quantitative analysis only. Qualitative aspects such
as efficiency, honesty etc are ignored in ratio analysis.
• Ratios may give misleading impression especially to a layman.
Classifications of Ratios:
As there are many ratios, they may be classified into different categories.
According to some writers, there are as many as 429 business ratios. But all
these ratios need not be calculated at a time. Depending upon the nature of the
business, purpose of the analysis, and the particular questions to be answered
from ratio analysis, certain ratios are generally selected.
BBM @ B.M.S.C.W, 2010 31

Ratio Analysis at
Ratios may be classified on different bases depending on their nature,
importance, source and function.
On the basis of their nature : on the basis of the nature of items. The
relationships of which are explained by the ratio, they may be classified as
financial ratio and operating ratios financial ratio deal with items, which are
financial [or non-operational] in nature current ratio. Quick ratio, Debt-equity
ratio etc, are examples s of financial ratio. On the other hand the operating
ratios explain the relationship between items of operations of the enterprise.
Turnover ratios, earning ratios expenses ratios, etc are examples of these
ratios.
On the basis of their importance : ratios may also be classified on the basis
of their importance as primary ratios and secondary ratios. Operating profit to
operating capital employed is generally described a primary ratio. Other
related ratios under this category are net sales to capital employed, operating
profit to value of production etc. on the other hand, some examples of
secondary ratios of direct material cost to value of production, ratio of output
to factory employees, etc.
On the basis of their function : ratio con also be classified on the basis of the
purpose served or function, which the ratios are expected to perform. This
basis of classification is called functional classification and the ratios called
functional ratios. In fact, this the most commonly adopted classifications of
ratios. Examples of functional ratios are liquidity ratios, solvency ratios,
turnover ratios and profitability ratios.
BBM @ B.M.S.C.W, 2010 32

Ratio Analysis at
On the basis of source of data: on the basis of the source from which they are
calculated, ratios may also be classified into three categories:
1) Balance sheet ratios
2) Profit and loss account ratios
3) Combined ratios
Balance sheet ratios deal with the relationship between two items or groups of
items contained in balance sheet and they generally indicate short-term or
long-term financial position of business.
Profit and loss account ratios deals with the relationship between items or
group of items contained in profit and loss account. They generally indicate
the profitability and efficiency of control over expenses of the business.
Combined ratios deal with the relationship between items or group of items
contained in both profit and loss account and balance sheet. They generally
indicate the operational efficiency of the business.
Types of Ratios:
Balance sheet ratios:
1) Current ratio:
Current ratio establishes the relationship between current assets and current
liabilities. The difference between current assets and current liabilities is
known as working capital. Therefore, the current ratio is also called
BBM @ B.M.S.C.W, 2010 33
Ratio Analysis at
working capital ratio. The purpose of this ratio is to find out the extend of
current assets available against each rupee of current liability of the firm.
Current ratio=Current assets/current liabilities
Interpretation: The current ratio reveals the ability of the firm to meet all the
obligations maturing within a year. Conventionally it is said that the current ratio
should be 2:1. It means that for every one rupee for current liability the firm must
have to rupee worth of current assets. The reason for this conventional norm is
that, all the current assets cannot be converted into cash immediately.
2) Liquid ratio:
Liquid ratio is also called quick ratio or acid test ratio. It established=s the
relationships between liquid assets are those which can be converted into
cash without any loss or delay. All current assets, excepting stock and
prepaid expenses, are considered to be liquid assets. Liquid liabilities are
those liabilities which are payable immediately. All current liabilities,
excepting bank overdraft, are considered to be liquid liabilities.
Liquid ratio=Liquid assets/liquid
liabilities
Interpretation: Generally, a quick ratio of 1:1 is considered to be satisfactory,
because it takes into account only liquid assets whose realizable value is almost
certain. A firm with 1:1 quick ratio is expected to be able discharge all its current
obligations.
BBM @ B.M.S.C.W, 2010 34
Ratio Analysis at
3) Absolute liquid ratio:
Absolute liquid ratio establishes the relationship between absolute liquid
assets and liquid liabilities. Absolute liquid assets include cash in hand,
cash at bank and marketable securities.
Absolute liquid ratio=Absolute liquid assets/liquid
liabilities
Interpretation: Generally, an absolute liquid ratio of 0.5:1 is considered to be
satisfactory.
4) Debt-equity ratio:
Debt-equity ratio shows the relationship between borrowed funds and
owner’s funds. The purpose of this ratio is to show the extend of the firm’s
dependence on external liabilities. In order to calculate its ratio, the
required components are external liabilities and owner’s equity. External
liability includes both long-term as well as short-term borrowings. He term
owners funds include equity share capital, preference share capital.,
reserves and surplus, but excludes past accumulated losses such preliminary
expenses, discount on issue of share or debentures, underwriting
commission and profit and loss account debit balance ect.
Debt-equity ratio=long term
debt/equity
BBM @ B.M.S.C.W, 2010 35

Ratio Analysis at
Debt-equity ratio=total debt/equity
Interpretation: For analyzing the capital structure, debt-equity ratio gives an idea
about the relative share of funds of outside and owners invested in the business.
The ratio of long-term debt of equity is generally regarding as safe if it is 2:1.
5) Proprietary ratio:
Proprietary ratio shows the relationship between owner’s equity and total
assets of the firms. This ratio is also known as equity ratio or net worth to
total assets ratio. The purpose of this ratio is to indicate the extend of
owner’s contribution towards the total value of assets. In, other words, it
gives an idea about the extent to which the owners own the firm. The
components required to compute this ratio are proprietor’s funds and total
assets.
Interpretation: There is no definite norm for this ratio. Some financial experts hold
the view that proprietor’s funds should be 33% to 55% of the total capital
employed and outsider’s fund should from 67% to 50% of the total assets.
Profit and loss account ratio:
1) Gross profit ratio:
BBM @ B.M.S.C.W, 2010 36

Ratio Analysis at
Gross profit ratio is the ratio, which establishes the relationship between
gross profit and net sales. This is also known as gross profit to sales ratio.
This ratio is useful particularly in the case of wholesale and retail trading
firms. Its purpose is the shown the amount of gross profit generated for
each rupee of sales.
Gross profit ratio=Gross profit /net
sales*100
Interpretation: A high margin enables all operating expenses to be covered and
provide a reasonable return to the shareholders. In order to keep the ratio high,
management has to minimize cost of goods sold and improve sale performance.
2) Net profit ratio:
Net profit ratio is also called net profit to sales ratio and explains the
relationship between net profit after taxes and net sales.
Net profit ratio=Net profit after taxes/net
sales*100
Interpretation: It is a measure of overall profitability of the firm. The higher the
ratio, the greater would be the returns to the shareholder and vice versa. A net
profit margin of 10% is considered normal. This ratio is very useful to control cost
and to increase the sales.
3) Operating ratio:
BBM @ B.M.S.C.W, 2010 37

Ratio Analysis at
Operating ratio establishes the relationship between operating cost and sales.
Interpretation: The operating ratio shows the overall operating efficiency of the
business. High operating ratio is undesirable as it leaves a small portion of income
to meet other non-operating expenses like interest on loans. A low ratio is better
and reflects the efficiency of the management. The lower ratio, the higher would
be the profitability.
4) Operating profit ratio:
Operating profit ratio studies the relationship between operating profit (that is
EBIT-Earnings before Interest and Tax) and sales. The purpose of this ratio is to
find out the amount of operating profit for each rupee of sales.
Interpretation: A high ratio is an indicator of the operational efficiency and a low
ratio stands for operational inefficiency of the firm.
Combined ratios:
BBM @ B.M.S.C.W, 2010 38
Operation ratio= operation cost/net
sales*100.
Operating profit ratio=Operating profit/net
sales*100.

Ratio Analysis at
The ratio which is calculated by taking one item or one group of item form trading
and profit and loss account and another item or the group of another item is taken
from balance sheet is called mixed ratio.
Some of the important mixed ratios are:
1) Debtor turnover ratio:
Debtor turn over ratio shows the relationship between credit sales and
debtor. In other words, it indicates the number of times on an average the
debts are collected in year.
Debtors turnover ratio=credit sales/average debtors or debtors.
Interpretation: A high debtor’s turnover ratio reflects short collection period and
indicates that debtors are prompt in their payment. On the contrary, a low debtor’s
turnover ratio or a high collusion period implies that debtors pay their dues very
slowly.
2) Debt collection period ratio:
The debt collection period ratio indicates the average numbers of days that
the firm has to wait for collecting the money after goods are sold on credit.
This ratio is also known as “average collection period ratio” or “debtor’s
velocity ratio”.
Debt collection period ratio=Average debtors/credit sales*365.
BBM @ B.M.S.C.W, 2010 39

Ratio Analysis at
3) Creditors turnover ratio:
Creditor’s turnover ratio establishes relationship between credit purchases
and average creditors. The purpose of this ratio is to know the speed with
which payments are made to the creditors.
Creditors turnover ratio=Credit purchases/average creditors
Interpretation: The shorter the turnover ratio, the longer would be the average
payments period and vice versa.
4) Debt payment period ratio :
Debt payment ratio indicates the number of days that the firm can postpone,
on an average, its payments to the creditors. This is also known as
creditor’s velocity ratio.
Debt payment ratio=Average creditors/credit purchases*365.
5) Total assets turnover ratio:
Total assets turnover ratio establishes the relationship between sales and
total assets. The purpose is to judge weather the firm is generating adequate
sales from the total assets employed. Further, it is also used to determine
whether there is adequate investment, or over investment or under
investment in assets of the firm.
Total assets turnover ratio=Sales/total assets
BBM @ B.M.S.C.W, 2010 40

Ratio Analysis at
Interpretation: A high ratio is an indication of efficient utilization of assets in
generating sales and a low ratio is an index of inefficient utilization of assets.
Ratios used for the study:
1) Cost of deposits
2) Cost of funds
3) Yield on advances
4) Net interest margin (on average earning assets)
5) Credit deposit ratio
6) %Low cost deposit to total deposit
7) Cost income ratio
8) Return on average assets
9) Return on equity
10) Net interest income/Total income
11) Other income/Total income
12) Staff cost/Total income
13) Gross NPA ratio
14) Net NPA ratio
BBM @ B.M.S.C.W, 2010 41

Ratio Analysis at
15) Capital adequacy ratio
16) Net profit to average working funds
INDIAN BANKING STURUCTURE:
BBM @ B.M.S.C.W, 2010 42

Ratio Analysis at
Introduction to bank:
BBM @ B.M.S.C.W, 2010 44
Ratio Analysis at
The name bank derives from the Italian word banco”desk/bench”, used during the
Renaissance by Florentines bankers, who used to make their transactions above
the desk covered by a green table cloth. However, there are traces of banking
activity even in ancient times.
In, fact the word traces its origin back to the Ancient Roman Empire, where
money lenders would set up their stalls in the middle of the enclosed courtyards
called macella on a long bench called a bench, from which the words banco and
bank are derived. As a moneychanger, the merchant at the banco did not so much
invest money as merely convert the foreign currency into the only legal tender in
Rome – that of the imperial mint.
Meaning of bank:
Bank is an institution, which deals with money and credit. It borrows money by
accepting deposits from the public and lend to those who are in needs of funds. It
also helps the businessmen in receiving and making payments.
A bank is a financial institution whose primary activity is to act as a payment
agent for customers and to borrow and lend money. It is an institution for
receiving, keeping, and lending the money. The first modern bank was founded in
Italy in Genoa in 1406, [citation needed] its name was Banco di San Giorgio (bank
of St.George).
Banking industry has revolutionized the transaction and financial services system
worldwide. Through the development in technology banking services has been
BBM @ B.M.S.C.W, 2010 45

Ratio Analysis at
vailed to the customers at all times, even after the normal banking hours, on a 24/7
basis. Banking industry services is nothing but the access of most of the banking
services (such as verification of account details, going with the transaction, etc.).
In today’s world, progress of online services is available to all customers of the
concerned bank and can be accessed at any point of time and from anywhere
provided the place is equipped with the internet facility. Now a day, almost all the
banks all over the world, especially the multinational ones, provide their
customers with online banking facility.
Definition of bank:
According to Herbert.L.Hart, “The banker is a person or company carrying on the
business of receiving money and collecting drafts for customers subject to the
obligation of honoring the cheque drawn upon him from time to time by customers
up to the amount available on their current account”.
• Receiving money on current account
• Paying against cheque drawn by account holders
• Collecting of draft on behalf of the customers
According to the bank regulation act 1949 section(1)(bandc) a bank is “ the
accepting of for the purpose of lending or investing of deposits of money from the
public repayable on demand or other and with drawl by cheque, draft, or order
form”.
BBM @ B.M.S.C.W, 2010 46
Ratio Analysis at
According to John Paget suggest that a bank is an institution which:
• Take deposits account
• Take current accounts
• Issues and pays cheques
Main functions of bank:
• Borrowing
• Lending
• Agency service
• General service
Indian banking industry:
The Indian Banking industry, which is governed by the Banking Regulation Act of
India, 1949 can be broadly classified into two major categories, non-scheduled
banks and scheduled banks. Scheduled banks comprise commercial banks and the
co-operative banks. In terms of ownership, commercial banks can be further
grouped into nationalized banks and private sector banks (the old/new domestic
and foreign). These banks have over 67000 branches spread across the country.
The first phase of financial reforms resulted in the nationalization of 14 major
banks in 1969 and resulted in a shift from class banking to mass banking. This in
turn resulted in a significant growth in the geographical coverage of banks. Every
bank had to earmark a minimum percentage of their loan portfolio to sectors
identified as “priority sectors”. The manufacturing sector also grew during the
BBM @ B.M.S.C.W, 2010 47

Ratio Analysis at
1970’s in protected environs and the banking sector was a critical source. The next
wave of reforms saw the nationalization of 6 more commercial banks in 1980.
Since then the number of scheduled commercial banks increased in four-fold and
the number of bank branches increased eight-fold.
After the second phase of financial sector reforms and liberalization of the sector
in the early nineties, the public sector banks (PSB) found it extremely difficult to
compete with the new private sector banks and foreign banks. The new private
sector banks first made their appearance after the guidelines permitting them were
issued in January 1993. Eight new private sector banks are presently in operation.
The bank due to their late start have access to state-of-the –art technology, which
in turn helps them to save on manpower cost and provide better services.
Evolution of banking industry in India:
Banking in India originated in the last decades of the 18th century. The first banks
were the General Bank of India, which started in 1786, and the bank of Hindustan,
both of which are now defunct. The oldest bank in existence in India is the State
Bank of India, which originated in the bank of Calcutta in June 1806, which
almost immediately became the bank of Bengal. This was one of the presidency
banks, the other two being the bank of Bombay and bank of Madras, all were of
which were established under charters from the British East India company. For
many years the presidency banks acted as quasi-central banks, as did their
successors. The three banks merged in 1925 to form the Imperial Bank of India,
which, upon, India’s independence, became the State bank of India.
BBM @ B.M.S.C.W, 2010 48

Ratio Analysis at
The first fully Indian owned bank was the Allahabad Bank, established in 1865.
When the American Civil War stopped the supply of cotton to Lancashire from the
Confederate States, promoters opened banks to finance trading in Indian cotton.
With large exposure to speculative ventures, most of the banks opened in India
during that period failed. The depositors lost money and lost interest in keeping
deposits with banks. Subsequently, banking in India remained the exclusive
domain of Europeans for the next several decades until the beginning of the 20th
century.
Foreign banks too start to arrive, particularly in Calcutta, in the 1860s. The
comptoired Escompte de Paris opened a branch in Calcutta in 1860 and another in
Bombay in 1862, branches in Madras and Pondicherry, then in French colony,
followed. Calcutta was the most active trading port in India, mainly due to trade of
British Empire and so became a banking center.
Around the turn of 20th century, the Indian economy was passing through relative
period so stability. Around five decades had elapsed since the Indian mutiny and
the social, industrial and other infrastructure had improved. Indians had
established small banks, most of which served particular ethnic and religious
communities.
By the 1900s, the market expanded with the establishment of banks such as Punjab
national bank in 1859 in Lahore and bank of India in 1906, in Mumbai – both of
which were founded under private ownership. Punjab national bank was the first
swadeshi bank founded by the leaders like Lala Lajpat Rai, Sardar Dyal Singh
matithian. The swadeshi movement particularly inspired local businessmen and
political figures to found bank of and for Indian community. A number of banks
BBM @ B.M.S.C.W, 2010 49
Ratio Analysis at
established then have survived to the present such as bank of India, corporation
bank Indian bank, bank of Baroda, Canary bank and central bank of India.
Current scenario of India banking industry:
The industry is currently in a transition phase. On the one hand, the PSBs, which
are the mainstay of the Indian Banking systems, are in progress of shedding their
flab in terms of excessive manpower, excessive non-performing asset and
excessive governmental equity, while on the other hand the private sector banks
are consolidating themselves through mergers and acquisitions.
The private players however cannot match the PSBs great reach great size and
successes to low cost deposits. Therefore one of the means for them to combat the
PSBs has been through the mergers and acquisitions route. Over the last two years,
the industry has witnessed several such instances. For instances, HDFC bank
mergers with Times bank, ICICI bank’s acquisition of ITC Classic, Anagram
Finance and bank of Madura. Centurion bank, Indusind bank, bank of Punjab,
Vysya bank are said to be on the lookout. The UTI bank-Global Trust bank
mergers however opened a Pandora’s box and brought about the realization that all
was not well in the functioning of many of the private sector banks.
Private sector banks have pioneered internet banking, phone banking, anywhere
banking mobile banking, debit cards, automatic teller machines (ATM) and
combined various other services and integrated them into the mainstream banking
arena, while the PSBs are still grappling with disgruntled employees in the
aftermath of successful VRS schemes. Also, following India’s commitment to the
BBM @ B.M.S.C.W, 2010 50
Ratio Analysis at
agreement in respect of the services sector, foreign banks, including both new and
the existing ones, have been permitted to open up to 12 branches a year with effect
from 1998-99 as against the earlier stipulation of 8 branches.
Future of the banking industry:
The futures of banking industry are into the area of the following:
1) Rural banking
2) Ban assurance
3) Financial cards
4) Mobile banking
5) Role of technology in rural banking
6) Pension funds-pension fund industry to be taken at Marco level
7) Customer relationship through technology and innovations
8) Enterprise CRM in retail banking
9) Fresh openings in retail operations
10)Micro finance
11)Opportunities in non agricultural credit
12)Risk management and Basel 2
13)Customer protection
14)Skilled manpower
15)Non-performing assets
16)Technology
BBM @ B.M.S.C.W, 2010 51

Ratio Analysis at
Indian banking sector scenario:
1) Central bank :
The reserve bank of India is the central bank that is fully owned by the
government. It is governed by a central board (headed by a governor)
appointed by the central government. It issues guidelines for the functioning of
all banks operating within the country.
2) Public sector banks:
The public sector banks of in India are as follows:
State bank of India and its associated banks called the State Bank
Group.
20 nationalized banks
Regional rural banks mainly sponsored by public sector banks
3) Private sector banks:
The types of private sector banks in India are as follows:
Old generation private banks
New generation private banks
Foreign banks operating in India
Scheduled co-operative banks
BBM @ B.M.S.C.W, 2010 52

Ratio Analysis at
Non-scheduled banks
4) Co-operative sector:
The types of co-operative banks in India are as follows:
The co-operative sector is very much useful for rural people. The co-
operative banking sector is divided into the following categories.
State co-operative banks
Central co-operative banks
Primary agriculture credit societies
5) Development banks/financial institutions:
The types of development credit banks in India are as follows:
IFCI
IDBI
ICICI
IIBI
SCICI ltd
NABARD
Export-import bank of India
National housing bank
Small industries development bank of India
North eastern development finance corporation
BBM @ B.M.S.C.W, 2010 53
Ratio Analysis at
6) Retail banking sector:
Retail banking refers to the banking in which banking institution executes
transaction directly with consumers, rather than corporations or other banks.
Services offered include: savings and checking accounts, mortgages, personal
loans, debit cards and so forth.
7) Opportunities and challenges of Indian banking industry:
The banking industry in India is undergoing a major transformation due to changes
in economic conditions and continuous deregulation.
Deregulation: This continuous deregulation has made the Banking market
extremely competitive with greater autonomy, operational flexibility, and
decontrolled interest rate and liberalized norms for foreign exchange. The
deregulation of the industry coupled with decontrol in interest rates has led to
entry of a number of players in the banking industry. At the same time reduced
corporate credit off take thanks to sluggish economy has resulted in large number
of competitors battling for the same pie.
New rules: As a result, the market place has been redefined with new rules of the
game. Banks are transforming to universal banking, adding new channels with
lucrative pricing and freebees to offer. Natural fall out of this has led to a series of
innovation product offerings catering to various customers segments, specifically
retail credit.
BBM @ B.M.S.C.W, 2010 54

Ratio Analysis at
Efficiency: This in turn has made it necessary to look for efficiencies in the
business. Banks need to access low cost funds and simultaneously improve the
efficiency. The banks facing pricing pressure, squeeze on spread and have to give
thrust on retail assets.
Diffused customer loyalty: This will definitely impact customer preferences, as
they are bound to react to the value added offerings. Customers have become
demanding and the loyalties are diffused. There are multiple choices; the wallet
share is reduced per bank with demand on flexibility and customized service and
hassle free, flawless service delivery.
Key business services:
Banking in India is so convenient and hassle free that one (individual, groups or
whatever the case may be) can easily process transactions as when required. The
most common services offered by banks in India are as follow:
• Bank accounts: It is the most common services of the banking sector. An
individual can open a bank account, which can be savings, current or term
deposits.
• Loans: You can approach all banks for different kinds of loans. It can be a
home loan, car loan, personal loans, loan against shares and educational
loans.
• Money transfer: Banks can transfer money from one corner of the globe to
the other by issuing demand drafts, money orders or cheques.
• Credit and debit cards: Most banks offer credit cards to their customers,
which can be used to purchase products and services, or borrow money.
BBM @ B.M.S.C.W, 2010 55

Ratio Analysis at
• Lockers: Most banks have safe deposits lockers, which can be used by the
customers for storing valuables, like important documents or jewelers.
Meaning of Research:
A systematic search for an answer to a question or a solution to a problem is called
research. Research simply means a search for facts-answers to questions and
solutions to problems. It is a purposive investigation. It is an “organized inquiry”.
It seeks to find explained phenomenon, to clarify the doubtful propositions and to
correct the misconceived facts.
Definition of Research:
Ker linger defines research as a “systematic, controlled, empirical and critical
investigation of hypothetical propositions about the presumed relations among
natural phenomena.”
Research design:
Research design is the arrangements of conditions of the study and collection of
data in a manner that aims to continue relevance to continue relevance to the
BBM @ B.M.S.C.W, 2010 56
Ratio Analysis at
purpose of the study. A research design is a logical and systematic plan prepared
for directing a research study. It specified the objectives of the study, the
methodology and technique to be adopted for achieving the objectives. It
constitutes the blue print for the collection, measurement and analysis of data. It
provides a systematic plan of procedure for the researcher to follow.
Definition of research design :
According to C. Selltic” A research design is the arrangement of conditions for
collection and analysis of data in a manner that aims to combine relevance to the
research purpose with the economy in procedure”
Types of research design:
According to the nature and purpose of the research study we can classify the
research designs into three broad categories:
1) Exploratory research design
2) Descriptive and diagnostic research design
3) Hypothesis testing research design
Title of the study:
A REPORT ON FINANCIAL STATEMENT THROUGH RATIO ANALYSIS
AT ING-VYSYA BANK
Objectives of the study :
BBM @ B.M.S.C.W, 2010 57

Ratio Analysis at
To know myself about the subject and to get better and good knowledge
regarding the financial matters as well as analyze that to in an ING-
VYSYA BANK.
To know from where the funds will be obtained in what amount fund would
be raised, how mush to invest in a particular work, how to plan the proper
utilizations of the available fund and also to avoid the misuse of available
fund.
To analyze the management efficiency of the company.
To study the financial matters in detail.
To evaluate the liquidity and profitability of the company.
To gain a practical knowledge about the various financial activities of the
company
Rationale behind the study:
The main reason for selecting the “financial management and ratio analysis” as
field of my project work is to know the financial activities as well as economic
and marketing role-played by the company and to get the knowledge about the
difference in theory and practice. It also helps me to know more about the
financial management system in practice as I have selected “finance” as my
optional subject in my final year BBM, it will help me future and for my higher
studies.
Scope of the study:
BBM @ B.M.S.C.W, 2010 58

Ratio Analysis at
This report is mainly done for academic purpose and for the employees of the
company. This report would give details of financial statements through ratio
analysis of ING-VYSYA BANK. The study was conducted as per the
requirements of Bangalore University BBM program.
Statement of the study:
Financial soundness in terms of liquidity, leverage, profitability and activity is the
main objectives in from of growing organization. To analyze in this view and
drawn meaningful conclusion to come to a right decision, analytical techniques are
required, among such techniques ratio analysis is one valuable technique in the
hands of a financial analyst. Therefore the study conducted to analyze the financial
management and financial ratios in the evaluation of ING-VYSYA BANK limited
financial soundness.
Methodology used:
By taking the financial statements of the company the various financial details,
analysis and interpretation have been done.
Graphical representations are been given with the analysis and the interpretation.
Limitations of the study:
1) The data has been collected through secondary sources; there are
possibilities of occurrence of errors.
2) Only ratio analysis has been performed to evaluate the financial
performance of ING-VYSYA BANK.
3) A detailed analysis in respect of external, internal, horizontal, vertical
analysis and the others could not be performed due to time constraint.
BBM @ B.M.S.C.W, 2010 59

Ratio Analysis at
4) Inviolability of secondary data
5) The data was collected across predefined parameters.
6) The research work is limited only to the information provided in ING-
VYSYA BANK only.
7) The research work could have been done in more than one bank for a
comparison study, but to time constraint it was not possible.
8) The study has been made considering board criteria’s and there may be
insufficient to draw any conclusions.
9) Certain parameters in the study change over time. The study is limited in
scope and cannot be applied to the industry as the whole.
10)The study is only based on financial management.
11)Much of the information is related to financial activities have not been
gathered due to company secrecy maintenance.
Need for the study:
1) To gain an exposure towards the actual management f the organization.
2) To gain the theoretical and practical knowledge of the subject.
3) To find out the variations from the actual and theoretical organization.
4) To gain experience and knowledge from the study.
Sources of data:
Data is collected from primary and secondary sources.
1) Primary data:
BBM @ B.M.S.C.W, 2010 60

Ratio Analysis at
Primary data is collected by conducting informal interviews with the
key personnel’s that is with the manager and also with the concerned
staff of the bank.
2) Secondary data:
Secondary data was collected from the sources such as annual reports of
the last 5 years, brochures, from standard banking books and website
(www.ingvysyzabank.com)
Importance of the report:
The increasing profit of the company year after, in terms of amount as well as in
terms percentages helps to know the entrepreneurs to feel that the company is in
good position but they must give importance to only to the past, but also for the
present and future situation. This gives an idea to the promoters of the company
that they must maintain their increasing trends of earnings profit for the
organization that is future also.
Research methodology
Company documents
Published sources
Personal observation
The above are the materials that have been adopted to carry out thesis. With the
above I have added relevant graphs and charts related to my research, which
BBM @ B.M.S.C.W, 2010 61
Ratio Analysis at
are drawn from the company’s financial aspects to make this more interesting
to reader.
Period of study:
The study was conducted for a period of one month, from 10december 2009 till
10january 2010.
Chart representation:
The diagrammatic representation used by the researcher in this research is BAR
DIAGRAM. Bar diagram consists of rectangular bars on a common base. Bars
with equal width and are equally spaced. Comparisons are based on the length of
the bars.
Sampling procedure:
The sampling procedure followed in the study is the random study is the random
sampling.
Plan of analysis:
The analysis is done using various statistical techniques like graphs and charts for
better comparison and interpretation.
BBM @ B.M.S.C.W, 2010 62
Ratio Analysis at
Overview of the chapters:
Chapter-1: INTRODUCTION
The report starts with an introduction of finance, organization of finance
department, finance manager, meaning and definition of financial management,
Financial statements, techniques of financial analysis, meaning and definition of
ratio analysis, interpretation of ratios, uses of ratios, significance of ratios,
objectives of ratio, limitations of ratio, classifications of ratios, types of ratios,
ratios used in the study, , Indian banking structure
Chapter-2: RESEARCH DESIGN
The second chapter provides information regarding meaning and definition of
research and research design, statement of problem, methodology, scope of study,
limitations of study, types of research, rational behind the study title of study,
source of data, need of study, period of study, chart representation.
Chapter-3: COMPANY PROFILE
The third chapter contains the profile of bank, history of bank, milestones of bank.
Overview of company, origin, profile, vision, mission, corporate statement,
identity, strengths, functions, achievements, award, strategy, latest news, product
profile, brand positioning, management, key competitors, knowledge management
tool, quick review.
Chapter-4: DATA ANALYSIS AND INTREPATION
The forth chapter contains the ratios, tables, analysis and interpretations.
BBM @ B.M.S.C.W, 2010 63

Ratio Analysis at
Chapter-5: FINIDINGS, SUGGESTIONS AND CONCLUSION
The fifth chapter put forth the findings of the study, conclusion that have been
arrived and suggestions given and SWOT analysis.
BIBLIOGRAPHY
ANNEXURE
ING-VYSYA BANK:
History:
ING Vysya Bank Ltd is the prominent Bank in India, formed with the Vysya Bank
Ltd, a premier bank in the Indian Private Sector and ING Group, a global financial
BBM @ B.M.S.C.W, 2010 64

Ratio Analysis at
powerhouse of Dutch origin, in the year 2002. With their core Banking Solution,
IT oriented products and focused Retail Banking and Wholesale Banking Services,
the Bank aims for sustainable growth to benefit all the stakeholders, clients and
employees and society at large.
Bank was originally incorporated on March 29, 1930 as The Vysya Bank Ltd. In
the year 1948, the Bank acquired the status of Scheduled Bank. Since then the
Bank has grown in size and stature and has reached the coveted position of
number one private sector bank in India. Since then the Bank has grown in size
and stature and has carved a distinct identity of being India's Premier Private
Sector Bank. Subsequent to acquisition of stake in the Bank by ING Group NV in
August 2002, the name of the Bank was changed from Vysya Bank Ltd to ING
Vysya Bank Ltd. In the year 1987, the Bank incorporated the Vysya Bank Leasing
Ltd for leasing and merchant banking activities along with Karur Vysya Bank Ltd.
In the year 1990, they incorporated Vysya Bank Housing Finance Ltd for housing
finance activities.
In the year 1996, the Bank signed a Strategic Alliance with BBL. In March 2000,
The Vysya Leasing Ltd became the wholly owned subsidiary of the Bank and in
November 2000, they opened data center at Information Technology Park Ltd,
Bangalore. In the year 2001, the Bank along with ING Group promoted a joint
venture company called ING Vysya Life Insurance Company Pvt Ltd for
undertaking life insurance business throughout India. In the year 2002, the Bank
launched a range of products & services like the Vys Vyapar Plus, the range of
loan schemes for traders, ATM services, Smart services, personal assistant service,
Save & Secure, an account that provides accident hospitalization and insurance
BBM @ B.M.S.C.W, 2010 65

Ratio Analysis at
cover, Sambandh, the International Debit Card and the mi-bank net banking
service.
ING takes over the Management of the Bank from October 7, 2002 and the name
of the Bank was changed from The Vysya Bank Ltd to ING Vysya Bank Ltd with
effect from December 7, 2002. Bank Brussels Lambarta made a strategic
investment in our bank between 1996 and 2002. ING Group N.V., a global
financial conglomerate of Dutch origin, later acquired bank Brussels Lambert. The
name of our bank was consequently changed to “ING VYSYA BANK Ltd” on
November 1 2002 and our license to carry on RBI to reflect our new name
amended the banking business. ING Group N.V. as its presence in India trough
ING VYSYA LIFE INSURANCE COMPANY LIMITED and ING
INVESTMENT MANAGEMENT (India) private limited.
During the year 2003-04, the wholly owned subsidiary of the Bank, Vysya Bank
Financial Services Ltd commenced the distribution of various financial products
such as insurance products, mutual funds etc. The name of the company was
changed to ING Vysya Financial Services Ltd. Also, they introduced customer
friendly products like Orange Savings, Orange Current and Protected Home
Loans.
In July 2003, the Bank divested their entire stake in Vysya Bank Housing Finance
Ltd to Dewan Housing Finance Ltd for Rs 23.20 crore. In September 2003, the
bank issued Tier II Bonds (second series) aggregating to Rs 200 crore at a
competitive coupon rate of 6.25%. During the year 2005-06, the company divested
their entire stake of 14.87% in ING Vysya Life Insurance Company Pvt Ltd to
Gujarat Abuja Cements Ltd. In April 2007, the Bank sold their entire shareholding
BBM @ B.M.S.C.W, 2010 66

Ratio Analysis at
of 9930000 shares in Investment Management (India) Pvt Ltd, during the year
2007-08, the Retail Branch Banking business launched a slew of products to
provide clients with enhanced solutions to meet their financial needs besides the
traditional deposit products. ING Bank N V is investing in the Tier I issue of ING
Vysya Bank Ltd, by way of Innovative Perpetual Bonds (IPDs) in foreign
currency for an amount of Rs 94.50 crore with a call option at the end of 10 years.
The table below sets for the certain key information about the bank:
As of June 30, 2009 as of march 31, 2009
Total advances 161487 167509
Total deposits 226083 248899
Total low-cost deposits 65016 67129
Retail loans 94564 98252
ING are one of the oldest private sector banks in India with a 79year long history
and are engaged in offering a wide variety of wholesale, retail and private banking
products and service to our customer.
As of March 31, 2008 ING-VYSYA were the seventh largest private sector bank
in India in terms of deposits and the eighth largest private sector bank in India in
terms of advances.
BBM @ B.M.S.C.W, 2010 67

Ratio Analysis at
Company overview:
It's been a long journey since then and the Bank has grown in size and stature to
encompass every area of present-day banking activity and has carved a distinct
identity of being India's Premier Private Sector Bank.
The company was originally incorporated as” The Vysya Bank Limited” on march
29,1930 with limited liability under the Mysore companies regulations, 1917.
They received certificate of commencement of business on July 24, 1930. RBI
granted them license to carry on banking business in India under the banking
regulations act 1949 on June 6, 1958. ING-VYSYA is a scheduled commercial
bank within the meaning of the RBI act 1934.
In 1980, the Bank completed fifty years of service to the nation and post 1985; the
Bank made rapid strides to reach the coveted position of being the number one
private sector bank. In 1990, the bank completed its Diamond Jubilee year. At the
Diamond Jubilee Celebrations, the then Finance Minister Prof. Madhu Dandavate,
had termed the performance of the bank ‘Stupendous’. The 75th anniversary, the
Platinum Jubilee of the bank was celebrated during 2005.
ING Vysya Bank Ltd., is an entity formed with the coming together of erstwhile,
Vysya Bank Ltd, a premier bank in the Indian Private Sector and a global financial
powerhouse.
ING of Dutch origin, during Oct 2002. The origin of the erstwhile Vysya Bank
was pretty humble. It was in the year 1930 that a team of visionaries came together
BBM @ B.M.S.C.W, 2010 68
Ratio Analysis at
to found a bank that would extend a helping hand to those who weren't privileged
enough to enjoy banking services.
It's been a long journey since then and the Bank has grown in size and stature to
encompass every area of present-day banking activity and has carved a distinct
identity of being India's Premier Private Sector Bank.
In 1980, the Bank completed fifty years of service to the nation and post 1985; the
Bank made rapid strides to reach the coveted position of being the number one
private sector bank. In 1990, the bank completed its Diamond Jubilee year. At the
Diamond Jubilee Celebrations, the then Finance Minister Prof. Madhu Dandavate,
had termed the performance of the bank ‘Stupendous’. The 75th anniversary, the
Platinum Jubilee of the bank was celebrated during 2005.
The origin of ING Group:
On the other hand, ING group originated in 1990 from the merger between
National – Nederland NV the largest Dutch Insurance Company and NMB Post
Bank Group NV. Combining roots and ambitions, the newly formed company
called “International Nederland Group”. Market circles soon abbreviated the name
to I-N-G. The company followed suit by changing the statutory name to “ING
Group N.V.”.
BBM @ B.M.S.C.W, 2010 69
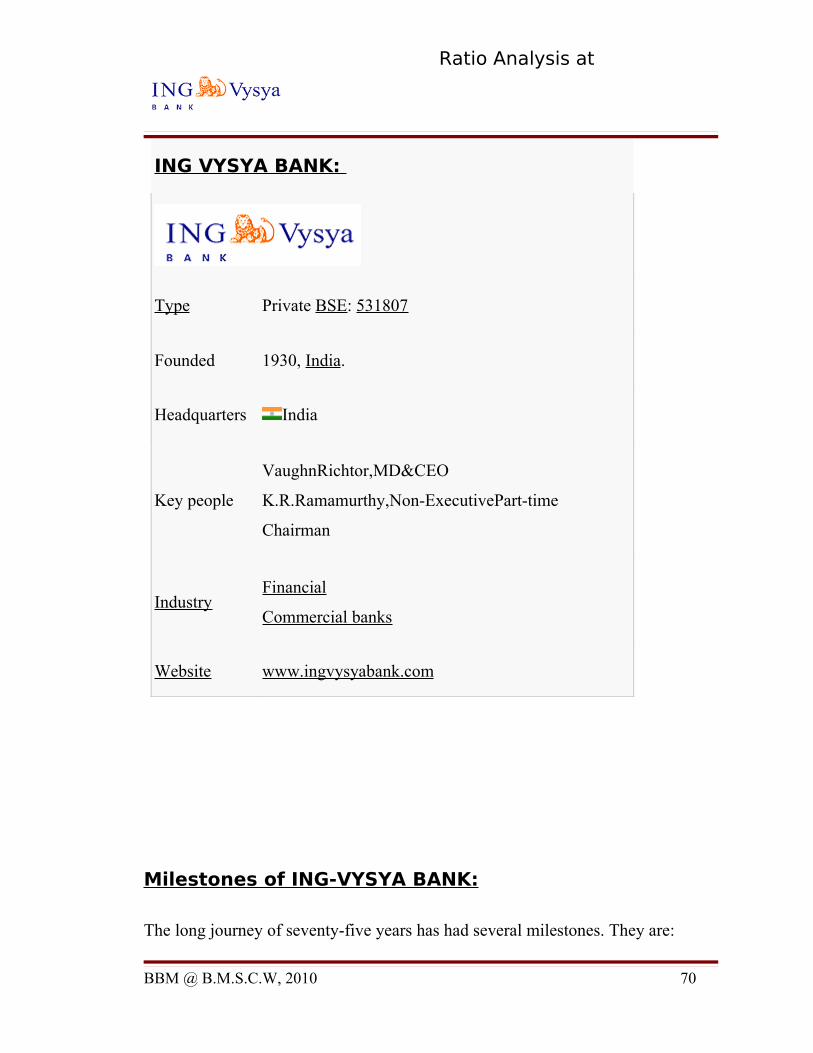
Ratio Analysis at
ING VYSYA BANK:
Type Private BSE: 531807
Founded 1930, India.
Headquarters India
Key people
VaughnRichtor,MD&CEO
K.R.Ramamurthy,Non-ExecutivePart-time
Chairman
IndustryFinancial
Commercial banks
Website www.ingvysyabank.com
Milestones of ING-VYSYA BANK:
The long journey of seventy-five years has had several milestones. They are:
BBM @ B.M.S.C.W, 2010 70
Ratio Analysis at
≈ 1930: Set up in Bangalore
≈ 1948: Scheduled bank
≈ 1985: Largest private sector bank
≈ 1987: The VYSYA bank leasing Ltd. Commenced
≈ 1988: Pioneered the concept of co-branding of credit cards
≈ 1990: Promoted VYSYA bank housing finance Ltd
≈ 1992: Deposits cross Rs.1000 crores
≈ 1993: Number of branches crossed 300
≈ 1996: Signs strategic alliance with BBL, Belgium, Two national awards by
Gem and Jeweler export promotion council for excellent performance in
export promotion.
≈ 1998: Cash management services and commissioning of VSAT.
≈ 1999: “Golden Peacock award”- for the best HR practices by Institute of
directors. Rated as domestic bank in India by global finance(International
finance journal-June 1999)
≈ 2000: State-of –the-art, date centre at ITPL, Bangalore. RBI clears setting up
of “ING-VYSYA LIFE INSURANCE”.
≈ 2001: ING-VYSYA commenced “LIFE INSURANCE BUSINESS”.
≈ 2002: The bank launched a range of products and services like the Vyaya
Vyapar plus, the range of loan schemes for traders, ATM service, smart
services, personal assistance service, save and secure, an account that provides
BBM @ B.M.S.C.W, 2010 71
Ratio Analysis at
accident hospitalization and insurance cover, sambandh, the international
debit card and the mi-bank net banking service.
≈ 2002: ING takes over the Management of the bank from October 7th 2002.
≈ 2002: RBI clears the name of the bank as “ING VYSYA BANK ltd”; vide
their letter of 17/12/02.
≈ 2003: Introduced customer friendly products like orange savings, orange
current and protected home loans.
≈ 2004: Introduced protected home loans-a housing loan product.
≈ 2005: Introduced solo- my own account for youth and customer service line
and also introduced “Phone banking.
≈ 2006: Bank has networked all the branches to facilitate “AAA: transactions
that is “Anywhere banking, anytime banking and anyhow banking”.
ING in India:
In India, ING is present in all three fields of banking, insurance and asset
management in the form of ING, ING Vysya Life Insurance and ING Investment
Management respectively. The presence in all three fields signifies the importance
that the group attaches to the Indian markets and the group's operations here, as
well as its bullish future outlook on the country. ING and ING Vysya Life
Insurance are headquartered at Bangalore, while the corporate office of ING
Investment Management is situated at Mumbai. The synergies arising out of the
three distinct but complimentary businesses are bound to be an asset to the group
BBM @ B.M.S.C.W, 2010 72
Ratio Analysis at
in the changing market dynamics of the future. The first such signs are already
visible on the horizon with combined products being successfully launched by the
different entities of the group in conjunction with each other.
Profile:
ING has gained recognition for its integrated approach of banking, insurance and
asset management. Furthermore, the company differentiates itself from other
financial service providers by successfully establishing life insurance companies
in countries with emerging economies, such as Korea, Taiwan, Hungary, Poland,
Mexico and Chile. Another specialization is ING Direct, an Internet and direct
marketing concept with which ING is rapidly winning retail market share in
mature markets. Finally, ING distinguishes itself internationally as a provider of
‘employee benefits’, i.e. arrangements of nonwage benefits, such as pension plans
for companies and their employees.
Mission Statement:
ING`s mission is to be a leading, global, client-focused, innovative and low-cost
provider of financial services through the distribution channels of the client’s
preference in markets where ING can create value.ING Financial Markets, based
out of Mumbai is a leading player in the Indian Financial Markets providing one
of the widest ranges of products for large corporate, small and medium enterprises
as well as individual needs. Supported by state-of-the-art systems and the
capabilities of the ING Group, we offer competitive pricing and efficient
execution across markets and a comprehensive suite of products.
BBM @ B.M.S.C.W, 2010 73

Ratio Analysis at
Financial Markets unit is an active market maker on most rupee interest rate and
currency products. Within the bank, we play a key role in the Asset Liability
Management and ALM strategy. To our corporate and institutional clients, we
offer a comprehensive range of products for transactions and risk management
needs through the sales desks at Mumbai, Delhi, and Bangalore & Chennai.The
Financial Markets business is driven by a highly qualified and knowledge driven
team that brings together a deep understanding of local and global markets as well
as complex financial products.
ING’s Corporate Statement:
At ING life, we strongly believe that the life is different at every stage; life
insurance must offer flexibility and choice to go with that stage. We are fully
prepared and committed to guide you on insurance products and services through
our well-trained advisors, backed by competent and customer services, in best
possible way. It is our aim to become one of the top private life insurance
companies in India and to become a cornerstone of ING’s integrated financial
service business in India.
BBM @ B.M.S.C.W, 2010 74
Ratio Analysis at
The new identity:
The immediate benefit to the bank, ING Vysya Bank, has been the pride of having
become a Member of the global financial giant ING. As at the end of the year
December 2008, ING's total assets exceeded 1332 billion Euros, employed over
125000 people, and served over 85 million customers, across 50 countries. This
global identity coupled with the backup of a financial powerhouse and the status
of being the first Indian International Bank, would also help to enhance
productivity, profitability, to result in improved performance of the bank, for the
benefit of the entire stakeholder.
Functions of ING Vysya:
• Business Compliance
• Regulatory Guidelines Dissemination & Advisory
• Financial Economic Crime (FEC) & Sanctions Desk
• Policy Framework & MIS
• Training & Communication
Strengths:
• Banking experience of 79years
• Association with ING Group N.V.
• Professional management
• Strong market presence and recognition among small and medium
enterprise customers
• Centralized and modern technology platform
BBM @ B.M.S.C.W, 2010 75

Ratio Analysis at
• Multiple delivery channels and distribution infrastructure
Distribution Channels:
ING Vysya Life has a diversified distribution platform. While Tied Agency
remains the strongest channel, the alternate Channels business within ING Vysya
Life is one of the fastest growing distribution channels. ING Vysya Life has
strengthened its position as the unparallel leader in the life insurance industry in
cooperative banks tie-ups. The company currently has tie-ups with 130 Co-
operative banks across the country. The Alternate Channels division has Banc
assurance, ING, Corporate Agents and SMINCE.
The Brand Positioning:
In 2007, ING Vysya Life developed its unique brand positioning ‘Mera farz’. This
positioning means, ING Vysya Life helps its customers fulfill their responsibilities
towards themselves and their families. This powerful positioning has helped ING
Vysya Life create a distinct identity for itself. The latest brand campaign with a
very catchy jingle dwells on how a little planning and a helping hand from ING
Vysya life can help lighten the burden of responsibilities that often come with
happy moments and let you enjoy your life without any worries.
Achievements:
A few achievements are highlighted below:
First investment manager to launch a packaged concept in Asset
Management Industry.
BBM @ B.M.S.C.W, 2010 76
Ratio Analysis at
Awarded “Abby Gold 2006” for its advertising Campaign for ING LION
Fund.
Two CRISIL AAAf * products in Debt Fund space. (ING Liquid Fund &
ING Floating Rate Fund).
First Asset Manager to launch a debt fund based on Credit risk with a
portfolio based on credit monitor. (ING Select Debt Fund).
First Private Sector Mutual Fund to launch a concept dedicated to women.
(Mahilanivesh).
Asia Asset Monitor awarded “Most Innovative Product” ING Dynamic
Asset Allocation Fund.
ING Mutual Fund recently launched India’s first DAILY TRANSFER
PLAN called Zoom Investment Pac (ZIP).
ING Mutual fund has also pioneered a new reality show on television called
Indian Investor of the year.
Strategy:
ING’s objective is to enhance its position as a premier provider of banking and
other financial services in India. Some of the business strategies that have
envisaged are as follows:
• Enhance the quality and spread of banking franchise
BBM @ B.M.S.C.W, 2010 77
Ratio Analysis at
• Continue to leverage on the synergies with ING Grope N.V.
• Attract and retain talent
• Continue the focus on operational efficiency and risk management
Social Objectives:
The key objective of the ING Chances for Children program is to improve the
well-being of children aged 4-12 worldwide by giving them access to free,
compulsory basic schooling that aims to develop each child's ability to the fullest.
ING Chances for Children will be doing this by giving children access to
education, by providing the necessary skills and through investment in educational
organizations.
The main targets of the ING Chances for Children program are:
To provide primary education for 50,000 children over a period of three years.
To improve the quality of education in the communities in which ING business are
active.
To involve as many of the ING group’s 115,000 employees as possible , either as
ambassadors, volunteers or donors.
ING News:
News release on the working result of the bank for the quarter year ended 30th
September 2009.
ING VYSYA BANK shareholders approve capital rising.
BBM @ B.M.S.C.W, 2010 78
Ratio Analysis at
ING VYSYS BANK raises 415 crores through successful QIP and a preferential
placement.
Shailendra Bhandari appointed as MD and CEO of ING VYSYA BANK Ltd.
ING VYSYA BANK Q1 net profit up 48%.
ING VYSYA BANK CEO steps down on completion of tenure.
ING VYSYA BANK launches kids portal www.kidzzbank.com.
Banking and Financial News - November 2009
(updated as of 30-11-2009):
Banks should reach unbanked areas:Patel
RBI to fine tine norms on credit default swaps.
RBI may hire external hands.
Banks asked to disclose to customer’s fees, commissions received from mutual
funds.
Move for single regulator gathers steam.
Stimulus rollback not at one go.
Crisis management-effect on the RBI’s balance sheet.
Behave wants IPO processing time cut to 7 days.
Center asks PSB’s to hunt for mergers and acquisitions.
Banks sitting on pile of sanctioned loans.
Banks find DRT a better recovery mechanism.
Moody’s retains its negative view on Indians banking sector.
Banks to get six more months to cover NPAs.
Government may do away with lock in period for FDI in real estate.
BBM @ B.M.S.C.W, 2010 79

Ratio Analysis at
Products and Services
Foreign Exchange Transaction
Hedging Solutions
Money Market Products
Management of risk continues to be one of the most important aspects of
running successful businesses. Financial Markets at ING help manage different
kinds of risks by matching client’s risk management needs with appropriate
solutions; offering them world-class solutions and services for managing
different risks in their businesses, dealings in foreign currency for
import/export or short term assets or liabilities.
Mutual Funds:
As a distributor of Mutual Funds, they are tied up with almost all the Asset
Management Companies thereby assisting their clients to invest in mutual fund
schemes, which meet with their investment requirements.
Life Insurance:
ING is actively engaged in selling ING Life Insurance products.ING Life
Insurance provides a range of products including endowment, pension & unit
BBM @ B.M.S.C.W, 2010 80

Ratio Analysis at
linked plans.More details on ING Life Insurance products are available at the link
www.ingvysyalife.com
Product profile of ING-VYSYA bank:
The product profile of ING-VYSYA bank are given in brief, the product offered
by ING-VYSYA are the Platinum preferred banking: savings account (orange
savings account, general savings account, solo savings account, saral savings
account, orange salary account, advantage salary account, freedom account, ING
formula savings account).
The current accounts( orange current account advantage current account, general
current account and comfort current account), and the term deposits (fixed
deposits, cumulative deposits, akshaya deposits, and advantage deposits) and
demat account.
Services:
The services offered by ING-VYSYA bank are advisory services, non-
discretionary, portfolio management, operational and regulatory services,
transactions services, trust and estate planning, private investment banking among
the others.
NRI services:
The NRI services rendered by ING-VYSYA BANK are accounts and deposits
(rupee savings account, NRE savings account, NRO savings account, rupee
current account, NRE current account, NRO current account, rupee fixed deposits,
BBM @ B.M.S.C.W, 2010 81

Ratio Analysis at
NRE fixed deposits, NRO fixed deposits, NRO Akshya deposits, NRE Akshya
deposits, NRE cumulative deposits, NRO cumulative deposits, foreign currency
deposits, FCNR Akshya deposits, FCNR deposits, NRI home loans remittances
(Mi-remi, Telegraphic/wire transfers, funds transfers’ cheque, DDs/TCs/Western
union money transfer, corporate services, (small and medium enterprise, agri and
rural banking, Wholesale banking and financial markets).
Loans:
The loans and advances rendered and offered by ING-VYSYA BANK are
personal loans, home loans, home equity loans and NRI loans, agricultural loans
(terms loans and short term loans).
Cards:
The different types of credit cards and debit cards offered by ING-VYSYA BANK
are credit cards and debit cards (ING regular debit card, ING formula debit Card
and ING patina debit card).
Insurance:
ING Vysya Life Insurance Company Limited, a part of the ING Group, the
world’s largest financial services provider, entered the private life insurance
industry in India in September 2001. Headquartered at Bangalore, ING Vysya Life
is currently present in 246 cities and has a network of over 300 branches, staffed
by 7,000 employees and over 51,000 advisors, serving over 5.5 lakhs customers.
Investments:
BBM @ B.M.S.C.W, 2010 82
Ratio Analysis at
ING-VYSYA BANK offers Mutual funds and Government of India and tax
savings bonds.
Management:
Board of directors:
K R Ramamurthy (Non-Executive Part-time Chairman)
Shailendra Bhandari (Managing Director & Chief Executive Officer)
Arun Thiagarajan (Director)
Wilfred Nagel (Director)
Aitya Krishna (Director)
Philippe Damas (Director)
Richard Cox (Director)
Ryan Andre Padgeet (Director)
Santosh Raamesh Desai (Director)
M.Damodaran (Director)
Santosh Ramesh Desai(Director)
Vaughn Nigel Richto (director)
BBM @ B.M.S.C.W, 2010 83
Ratio Analysis at
Senior Management Team:
Kshitij Jain (Managing Director and Chief Executive officer)
B. Ashwin (Chief Operating officer)
Rahul Agarwal (Chief Distribution Officer)
Marco Fredrik (Financial Controller)
Amit Gupta (Director - Marketing & Communication)
Priya Gopalakrishnan (Director - Human Resources)
T K Uthappa (Director, Sales - Tied Agency)
Rene van der Poel (Director - Alternate Channels)
Ravishankar Subramanian (Director-Information Technology & Corporate
Services)
Hemamalini Ramakrishna (Appointed Actuary and CIRO -Chief Insurance
Risk Officer)
Corporate Social Responsibility:
The bank as a part of its Corporate Social Responsibility has undertaken many
purposeful activities.
ING Vysya Foundation was set up almost three years ago actively supported by
the three business units of ING Vysya (ING Vysya Bank, ING Vysya Life
Insurance and ING Vysya Mutual Fund) to promote its Corporate Social
Responsibility. The mandate for the foundation is to promote primary education
for under privileged children.
BBM @ B.M.S.C.W, 2010 84
Ratio Analysis at
Accordingly, ING Vysya Foundation’s commitment to empower children through
primary education has been the focus in the last three years. In a country with an
estimated 50 million children deprived of basic primary education and health care,
enormous support, dedication and firm belief is necessary to make a difference
and to change the scenario. The foundation's efforts have been very successful in
reaching out to underprivileged children and providing them with a platform to
learn, grow and achieve through partnerships with 4 nonprofit organizations
located in India.
Today, the Foundation partners with eight organizations in India. It contributes
hugely to the Global initiative – ING Chances for Children in partnership with
UNICEF.
The Foundation has been able to support 1 lakhs children from all over India to be
in school with the active support of the employees across the ING businesses in
India.
Responsibility:
ING strives to be a good citizen. Ethical, social and environmental
considerations play an integral part in their business decisions. ING is
committed to playing an active role as a community sponsor. It does this
through a wide range of local sponsorships and through its global Chances
for Children initiative, which provides access to primary education to
underprivileged children in developing countries who would otherwise not
have the chance to attend school.
Key competitors :
BBM @ B.M.S.C.W, 2010 85
Ratio Analysis at
The key competitors of ING-VYSYA BANK are ICICI Bank, HDFC Bank, Axis
Bank, Kotak Mahindra Bank, Federal Bank, Yes Bank, JK Bank, IndusInd Bank
and Karur Vysya Bank.
Product Portfolio:
ING Vysya Life follows a “customer centric approach” while designing its
products. The Company’s product portfolio offers products that cater to every
financial requirement, at all life stages.
In fact, the company has developed the LifeMakerTM a simple tool, which can be
used to choose a plan most suitable to a specific customer, based on his needs,
requirements and current life stage. This tool helps you build a complete financial
plan for life at every life stage, whether the requirement is Protection, Savings,
Investment or Retirement. Suitable products from ING Vysya Life Insurance’s
product portfolio for each such requirement, makes selection of your plan an easy
exercise.
The Company aims to make customers look at life insurance afresh, not just as a
tax saving device but as a means to live life to the fullest. It believes in enhancing
the very quality of life, in addition to safeguarding an individual's security
ING Chances for Children - India initiative:
In India, along with the ING Vysya Foundation, the ING and UNICEF partnership
is focused to provide quality education for working children in Tamil Nadu.
15,000 children will benefit from quality education in 200 learning centers
for former child workers under the National Child Labor Elimination
BBM @ B.M.S.C.W, 2010 86

Ratio Analysis at
Project (NCLP).
The project focuses on strategies to provide quality education for children
who is either already working in low-paid, low-skilled industries or who are
out-of-school and therefore extremely vulnerable to becoming child
laborers. In Tamil Nadu the project emphasizes on child-friendly schools,
quality education, community involvement and responsibility in ensuring
children can learn and build a solid foundation for a hopeful future and
make a strong basis for ensuring that children remain in school and
complete a course in primary education. Activities will especially focus on
preventing child labor, protecting children’s rights and promoting quality
education.600 teachers will be reinvigorated through capacity building and
professional training pedagogy and motivation. Through workshops with
some 180 staff from government departments, UNICEF will cultivate and
reinforce supportive alliances in order to ensure quality education.
Knowledge Management Tools:
Bank has to follow the norms prescribed by various regulatory authorities on a
wide range of issues for the protection of investors, consumers and for the
development of the country as a whole. These norms are amended / modified by
the regulators from time to time. Functional Departments, Branches, Regional
Offices and employees in the bank find it difficult to search these guidelines. To
provide easy search and access, Compliance Department has availed the KMT.
Knowledge Management Tool (KMT) is a tool availed from M/s. Alpha plus
Technologies Ltd. by Compliance Department for the purpose of instant
references by all the employees of our bank branches/departments with
BBM @ B.M.S.C.W, 2010 87

Ratio Analysis at
easy search options, on the rules, regulations, guidelines, policies, laws,
statutes, Circulars, Master circulars, Compliance etc. of various
regulators. This is a tool of External Guidelines. i.e., guidelines by
regulatory and other authorities. However for internal operations, the
manuals and circulars may be referred and where there is some doubt,
Compliance Department may be approached for clarification.
Quick review:
VYSYA BANK-Founded in 1930
Number.1 Private Sector bank 1985
Scheduled bank 1948
ING- International Netherladen Group
Founded 1990
Merge between National Dutch Insurance Company and NNB post bank group
43.99% share in the bank
7/15 directors in the board
ING-VYSYA BANK merged in 2002
300 branches
BBM @ B.M.S.C.W, 2010 88

Ratio Analysis at
Cost of deposits ratio:
Table 1:
YEAR
INTEREST ON
DEPOSITS
AVERAGE
DEPOSITS PERCENTAGE
2005 516 10526 4.90%
BBM @ B.M.S.C.W, 2010 89
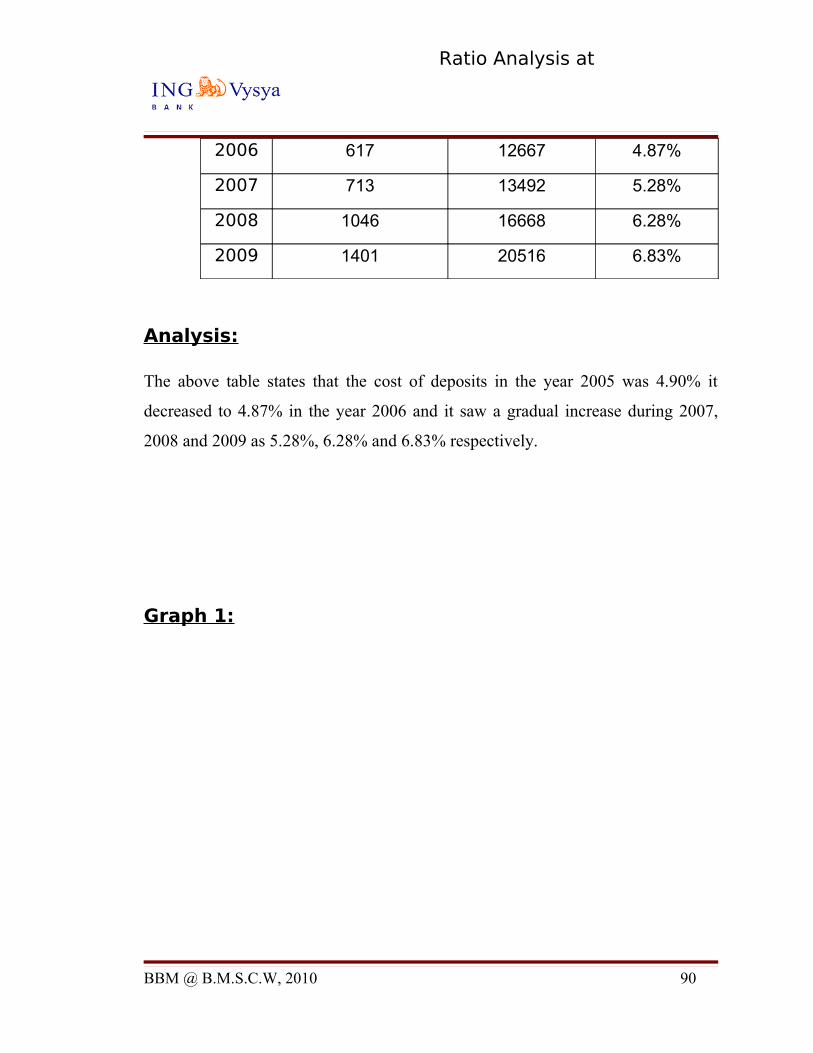
Ratio Analysis at
2006 617 12667 4.87%
2007 713 13492 5.28%
2008 1046 16668 6.28%
2009 1401 20516 6.83%
Analysis:
The above table states that the cost of deposits in the year 2005 was 4.90% it
decreased to 4.87% in the year 2006 and it saw a gradual increase during 2007,
2008 and 2009 as 5.28%, 6.28% and 6.83% respectively.
Graph 1:
BBM @ B.M.S.C.W, 2010 90

Ratio Analysis at
Interpretation:
Graph showing the cost of deposits of ING-VYSYA BANK of past five years.
The cost of deposits of ING VYSYA BANK increased year to year because the
rate of interest at bank was also increasing year to year.
Cost of funds ratio :
BBM @ B.M.S.C.W, 2010 91

Ratio Analysis at
Table 2:
YEAR
INTEREST
EXPENDED
AVERAGE
LIABILITIES
PERCENTAG
E
2005 647 7503 5.42%
2006 825 9393 5.29%
2007 960 10278 5.78%
2008 1297 12361 6.56%
2009 1748 15220 6.92%
Analysis:
The above table states that in the year 2005 the cost of funds was 5.42%, it has
decreased to 5.29% in the year 2006, and there was again increase in the year 2007
to 5.78%, in 2008 it has increased to 6.56% and also in the year to 6.92%.
Graph 2:
BBM @ B.M.S.C.W, 2010 92

Ratio Analysis at
Interpretation:
Graph showing the cost of funds of ING-VYSYA BANK of past five year.
From the above graph we can see the cost of funds ratio has been gradually
increasing year to year as the company showed more interest on the investments of
the company and funded on them more.
Yield on advances ratio:
BBM @ B.M.S.C.W, 2010 93

Ratio Analysis at
Table 3:
YEAR
INTEREST ON
ADVANCES
AVG
ADVANCES PERCENTAGE
2005 647 7503 8.62%
2006 825 9393 8.78%
2007 960 10278 9.34%
2008 1297 12361 10.49%
2009 1748 15220 11.48%
Analysis:
The above table gives you the percentage of yield on advances of ING-VYSYA
BANK.
In the year 2005 the yield on advances was 8.62%, increase to 98.78% in 2006, in
the year 2007 the yield on advances was 9.34% and increased to 10.49% and also
again increase in 2009 by 11.48%.
Graph 3:
BBM @ B.M.S.C.W, 2010 94

Ratio Analysis at
Interpretation:
Graph showing the yield on advances of ING-VYSYA BANK of past five years.
The yield on advances of ING VYSYA BANK has increased year to year because
the company has concentrated on their deposits.
Net interest margin ratio:
BBM @ B.M.S.C.W, 2010 95

Ratio Analysis at
Table 4:
YEAR
NET
INTEREST
AVG EARNING
ASSETS PERCENTAGE
2005 357 12217 2.92%
2006 481 14865 3.24%
2007 446 5952 2.79%
2008 498 18008 2.77%
2009 650 22892 2.84%
Analysis:
From the above table we get the information about Net interest margin (on average
earning assets) of ING-VYSYA BANK.
In the year 2005 the net interest margin percentage was 2.92% and increased to
3.24% in the year 2006, suddenly the net interest margin was decreased to 2.79%
in 2007 and again decrease to2.77% in 2008 and in the next financial year 2009 it
increase to 2.84%.
Graph 4:
BBM @ B.M.S.C.W, 2010 96

Ratio Analysis at
Interpretation:
Graph showing the net interest margin (on average assets) of ING-VYSYA BANK
of past five years.
There is lot of fluctuations on net interest margin due to fewer sales and direct
expenses are increased. To increase the net interest margin the company has to
increase the sales and decrease the direct expenses.
.
Credit deposit ratio:
BBM @ B.M.S.C.W, 2010 97

Ratio Analysis at
Table 5:
YEAR
ADVANCE
S
DEPOSIT
S PERCENTAGE
2005 9081 12569 72.24%
2006 10232 13335 76.73%
2007 11976 15419 77.67%
2008 14650 20458 71.61%
2009 16751 24890 67.30%
Analysis:
From the above table we get the information about credit deposit ratio of ING-
VYSYA BANK of past five years.
In the year 2005 credit deposit ratio percentage was 72.24% and increased to
76.73% in the year 2006, and was again increased by 77.67%, gradually the credit
deposit ratio was decreased to 71.61% in 2008 and again decrease to 67.30% in
2009.
Graph 5:
BBM @ B.M.S.C.W, 2010 98

Ratio Analysis at
Interpretation:
Graph showing the credit deposit ratio of ING-VYSYA BANK of past five years.
The graph states that there is lot of fluctuations on credit deposit ratio due to the
deposits that the company have to be received by public have not received
properly and if the ratio must be raised then the company should look after their
deposits on correct time.
Percentage low cost deposit to total deposits ratio:
BBM @ B.M.S.C.W, 2010 99
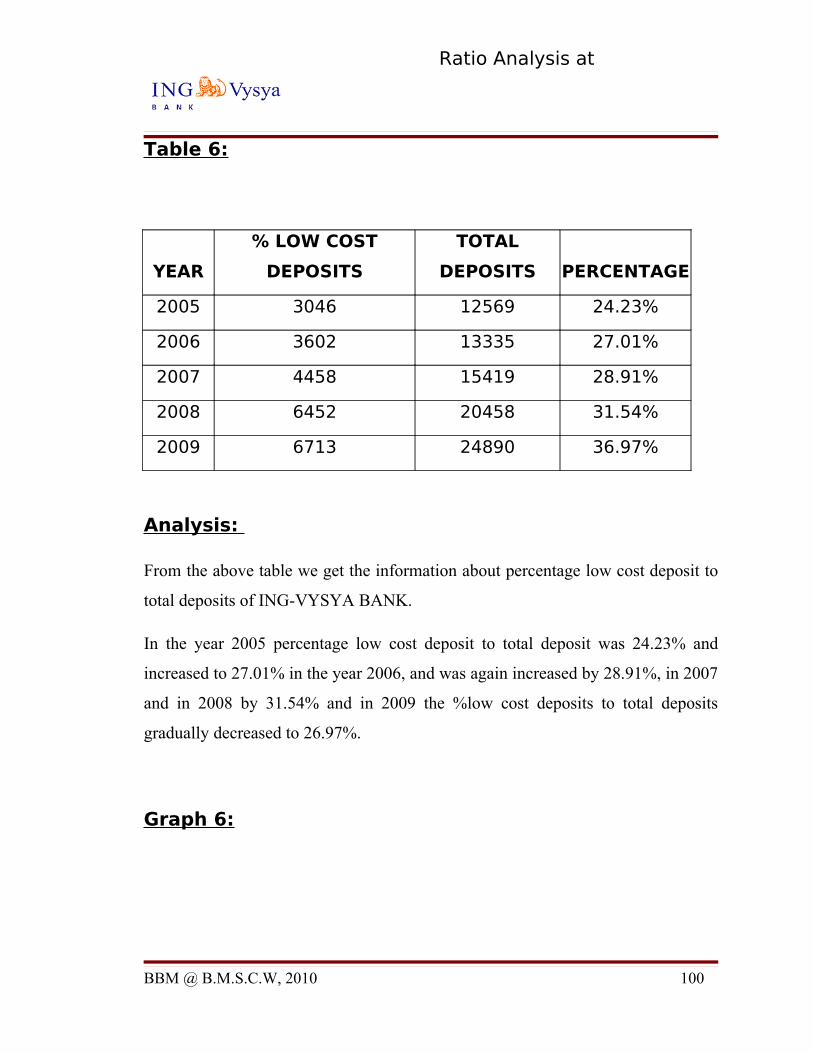
Ratio Analysis at
Table 6:
YEAR
% LOW COST
DEPOSITS
TOTAL
DEPOSITS PERCENTAGE
2005 3046 12569 24.23%
2006 3602 13335 27.01%
2007 4458 15419 28.91%
2008 6452 20458 31.54%
2009 6713 24890 36.97%
Analysis:
From the above table we get the information about percentage low cost deposit to
total deposits of ING-VYSYA BANK.
In the year 2005 percentage low cost deposit to total deposit was 24.23% and
increased to 27.01% in the year 2006, and was again increased by 28.91%, in 2007
and in 2008 by 31.54% and in 2009 the %low cost deposits to total deposits
gradually decreased to 26.97%.
Graph 6:
BBM @ B.M.S.C.W, 2010 100

Ratio Analysis at
Interpretation:
Graph showing the percentage low cost deposit to total deposit of ING VYSYA
BANK of past five years.
The graph states that the percentage low cost deposits have been gradually
increased year to year as the company’s rate of interest is low on the deposits and
the company have received more deposits.
Cost income ratio:
BBM @ B.M.S.C.W, 2010 101
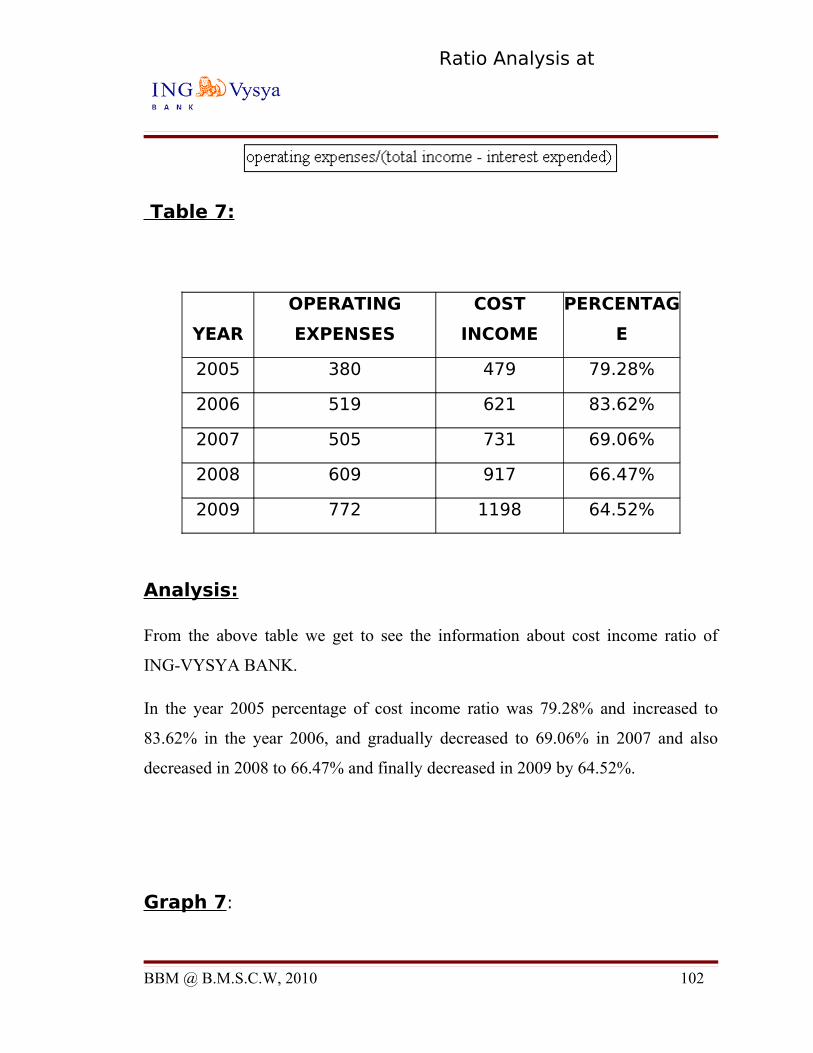
Ratio Analysis at
Table 7:
YEAR
OPERATING
EXPENSES
COST
INCOME
PERCENTAG
E
2005 380 479 79.28%
2006 519 621 83.62%
2007 505 731 69.06%
2008 609 917 66.47%
2009 772 1198 64.52%
Analysis:
From the above table we get to see the information about cost income ratio of
ING-VYSYA BANK.
In the year 2005 percentage of cost income ratio was 79.28% and increased to
83.62% in the year 2006, and gradually decreased to 69.06% in 2007 and also
decreased in 2008 to 66.47% and finally decreased in 2009 by 64.52%.
Graph 7:
BBM @ B.M.S.C.W, 2010 102

Ratio Analysis at
Interpretation:
Graph showing the cost income ratio f ING VYSYA BANK of past five years.
The graph states that the cost income ratio is decreasing gradually form year to
year as the income of the company is decreasing because of the low sales, if the
sales of the company increase then the cost income ratio also increases.
Return on average assets;
BBM @ B.M.S.C.W, 2010 103

Ratio Analysis at
Table 8:
YEAR
NET
PROFIT
AVG
ASSETS
PERCENTAG
E
2005 -38 13203 2.00%
2006 9 15839 0.06%
2007 89 17265 0.51%
2008 157 20832 1.75%
2009 189 26751 0.71%
Analysis:
From the above table we get to see the information about return on average assets
of ING-VYSYA BANK.
In the year 2005 the percentage of return on average assets was 2.00% and
gradually decreased to 0.06% in the year 2006 and increased to 0.51% in 2007,
0.75% increased in 2008 and decreased to 0.71% in 2009.
Graph 8:
BBM @ B.M.S.C.W, 2010 104

Ratio Analysis at
Interpretation:
Graph showing the return on average assets ratio of ING VYSYA BANK of past
five years.
The graph states that the return on average assets ratio is decreasing gradually
from year to year because the current assets converted into cash immediately.
Return on equity ratio:
BBM @ B.M.S.C.W, 2010 105

Ratio Analysis at
Table 9:
YEAR
NET
PROFIT
AVG
EQUITY
PERCENTAG
E
2005 -38 723 -5.28%
2006 9 1009 0.90%
2007 89 1066 8.34%
2008 157 1305 12.03%
2009 189 1624 11.62%
Analysis:
From the above table we get to see the information about return on equity of ING-
VYSYA BANK of past five years.
In the year 2005 the percentage of return on equity ratio was negative value
-5.28% and gradually increased to 0.90% in the year 2006 and increased to 8.34%
in 2007, 12.03% increased in 2008 and decreased to 11.62% in 2009
Graph 9:
BBM @ B.M.S.C.W, 2010 106
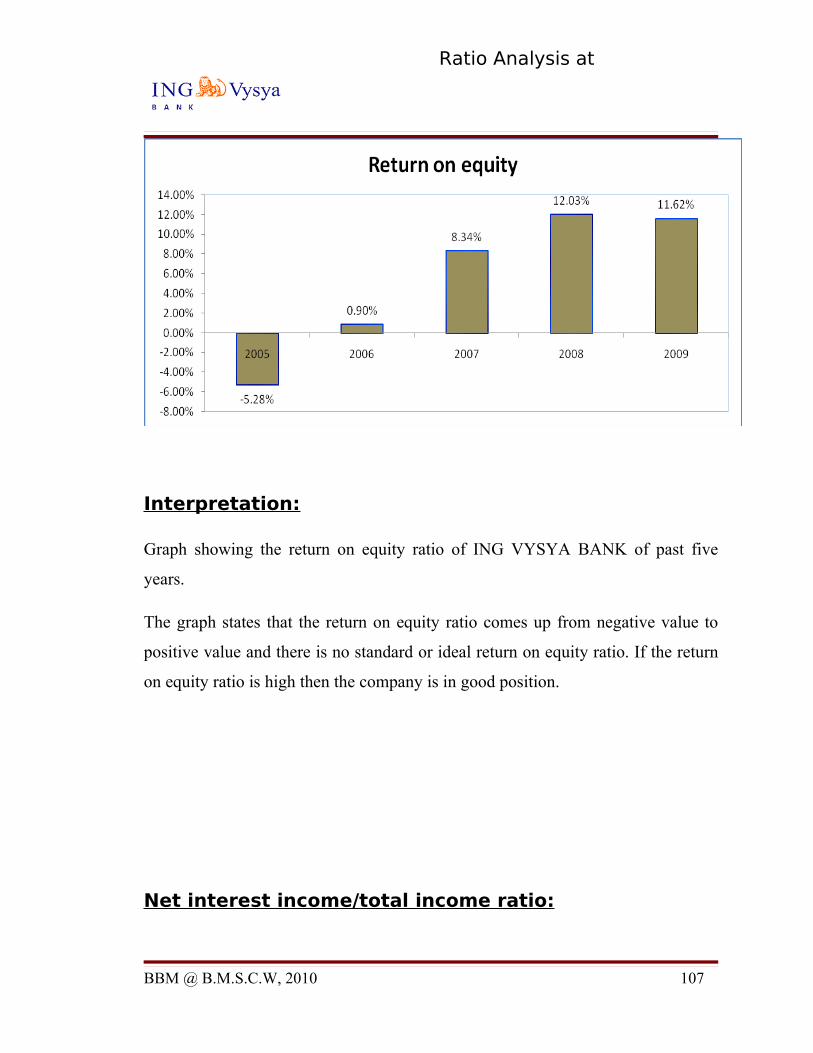
Ratio Analysis at
Interpretation:
Graph showing the return on equity ratio of ING VYSYA BANK of past five
years.
The graph states that the return on equity ratio comes up from negative value to
positive value and there is no standard or ideal return on equity ratio. If the return
on equity ratio is high then the company is in good position.
Net interest income/total income ratio:
BBM @ B.M.S.C.W, 2010 107

Ratio Analysis at
Table 10:
YEAR
NET INTEREST
INCOME
TOTAL
INCOME
PERCENTAG
E
2005 357 479 74.41%
2006 481 621 77.56%
2007 446 731 60.93%
2008 498 917 54.35%
2009 650 1198 54.26%
Analysis:
From the above table we get to see the information about net interest /total income
of ING-VYSYA BANK of past five years.
In the year 2005 the percentage of net interest income/total income was 74.41%
and gradually increased to 77.56% in the year 2006 and gradually decreased to
60.93% in 2007, 54.35% decreased in 2008 and decreased to 54.26% in 2009.
Graph 10:
BBM @ B.M.S.C.W, 2010 108

Ratio Analysis at
Interpretation:
Graph showing the net interest income /total income ratio of ING VYSYA BANK
of past five years.
The graph states that the net interest income of the company is gradually
decreasing due to the company is not potential enough to meet its immediate
commitments on time to increase their interest income.
Other income ratio:
BBM @ B.M.S.C.W, 2010 109

Ratio Analysis at
Table 11:
YEAR
0THER
INCOME
TOTAL
INCOME
PERCENTAG
E
2005 123 1113 11.02%
2006 139 1362 10.22%
2007 286 1553 18.39%
2008 419 2099 19.65%
2009 548 2788 19.65%
Analysis:
From the above table we get to see the information about other income/total
income of ING-VYSYA BANK of past five years.
In the year 2005 the percentage of other income/total income was 11.02% and
decreased to 10.22% in the year 2006 and gradually increased to 18.39% in 2007,
and again increased to 19.65% in 2008 an remain same in 2009.
Graph 11:
BBM @ B.M.S.C.W, 2010 110

Ratio Analysis at
Interpretation:
Graph showing the other income ratio of ING VYSYA BANK of past five years.
The graph states that the other income ratio is gradually increasing year to year
because assets or other income investment are mostly financed out of loans. This
type of indication means the financial soundness of the company is increasing year
to year.
Staff cost ratio :
BBM @ B.M.S.C.W, 2010 111
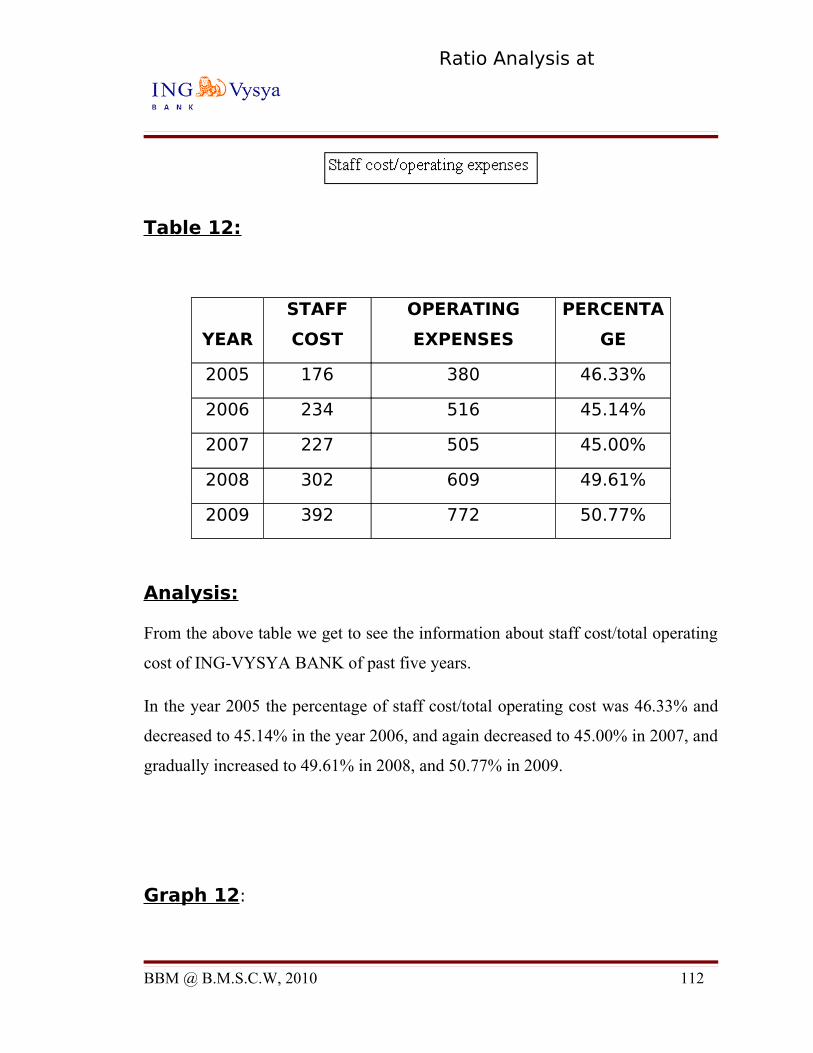
Ratio Analysis at
Table 12:
YEAR
STAFF
COST
OPERATING
EXPENSES
PERCENTA
GE
2005 176 380 46.33%
2006 234 516 45.14%
2007 227 505 45.00%
2008 302 609 49.61%
2009 392 772 50.77%
Analysis:
From the above table we get to see the information about staff cost/total operating
cost of ING-VYSYA BANK of past five years.
In the year 2005 the percentage of staff cost/total operating cost was 46.33% and
decreased to 45.14% in the year 2006, and again decreased to 45.00% in 2007, and
gradually increased to 49.61% in 2008, and 50.77% in 2009.
Graph 12:
BBM @ B.M.S.C.W, 2010 112

Ratio Analysis at
Interpretation:
Graph showing the staff cost ratio of ING VYSYA BANK of past five years.
The graph states that the staff cost ratio has lot of fluctuations due to maintaince of
the management in the company is not efficient, there must be much rotation of
the employees.
Gross net profit ratio:
BBM @ B.M.S.C.W, 2010 113
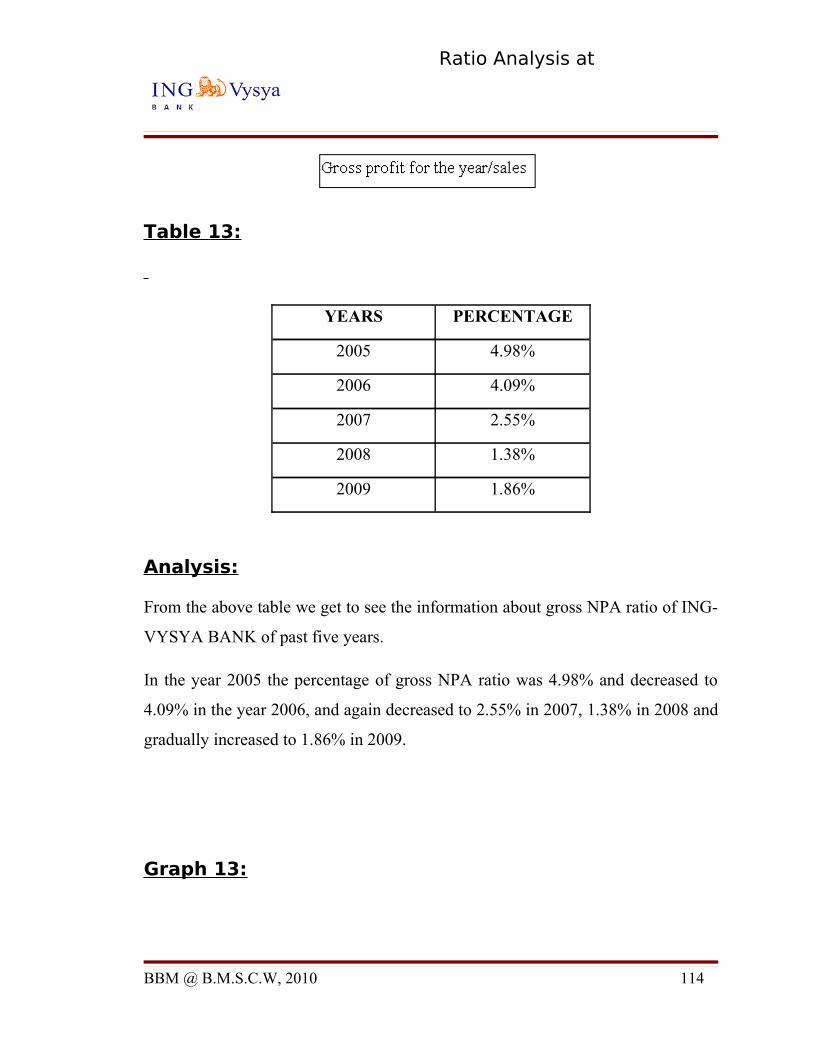
Ratio Analysis at
Table 13:
YEARS PERCENTAGE
2005 4.98%
2006 4.09%
2007 2.55%
2008 1.38%
2009 1.86%
Analysis:
From the above table we get to see the information about gross NPA ratio of ING-
VYSYA BANK of past five years.
In the year 2005 the percentage of gross NPA ratio was 4.98% and decreased to
4.09% in the year 2006, and again decreased to 2.55% in 2007, 1.38% in 2008 and
gradually increased to 1.86% in 2009.
Graph 13:
BBM @ B.M.S.C.W, 2010 114

Ratio Analysis at
Interpretation:
Graph showing the gross NPA ratio of ING VYSYA BANK of past five years.
The graph states that the gross NPA ratio has lot of fluctuations due to the sales of
the company must be low and the direct expenses must be increased, to overcome
the sales of the company must be increased.
Net profit ratio :
BBM @ B.M.S.C.W, 2010 115

Ratio Analysis at
Table 14:
YEARS PERCENTAGE
2005 2.14%
2006 1.76%
2007 0.95%
2008 0.70%
2009 1.23%
Analysis:
From the above table we get to see the information about net NPA ratio of ING-
VYSYA BANK of past five years.
In the year 2005 the percentage of net NPA was 2.14% and decreased to 1.76% in
the year 2006, and again decreased to 0.95% in 2007 and 0.70% in 2008, increased
to1.23% in 2009
Graph 14:
BBM @ B.M.S.C.W, 2010 116

Ratio Analysis at
Interpretation:
Graph showing the net NPA ratio of ING VYSYA BANK of past five years.
The graph states that the net NPA ratio has lot of fluctuations due to the company
profits have gradually decreased, it the net profit ratio is high it indicates that the
profitability of the company is good
Capital adequacy ratio:
BBM @ B.M.S.C.W, 2010 117

Ratio Analysis at
Table 15:
YEARS PERCENTAGE
2005 9.10%
2006 10.67%
2007 10.56%
2008 10.20%
2009 11.68%
Analysis:
From the above table we get to see the information about capital adequacy ratio of
ING-VYSYA BANK of past five years.
In the year 2005 the percentage of capital adequacy ratio was 9.10% and increased
to 10.67% in the year 2006, and decreased to 10.56% in 2007, and again decreased
to 10.20% in 2008, and increased to11.68% in 2009.
Graph 15:
BBM @ B.M.S.C.W, 2010 118
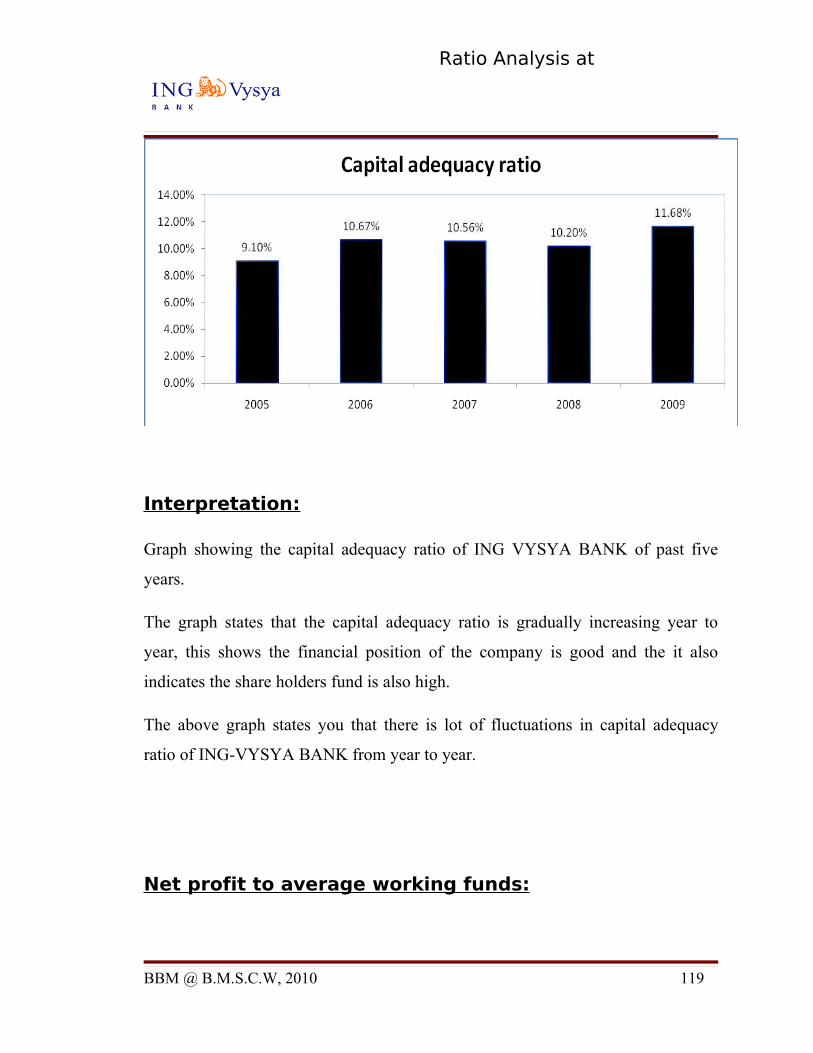
Ratio Analysis at
Interpretation:
Graph showing the capital adequacy ratio of ING VYSYA BANK of past five
years.
The graph states that the capital adequacy ratio is gradually increasing year to
year, this shows the financial position of the company is good and the it also
indicates the share holders fund is also high.
The above graph states you that there is lot of fluctuations in capital adequacy
ratio of ING-VYSYA BANK from year to year.
Net profit to average working funds:
BBM @ B.M.S.C.W, 2010 119
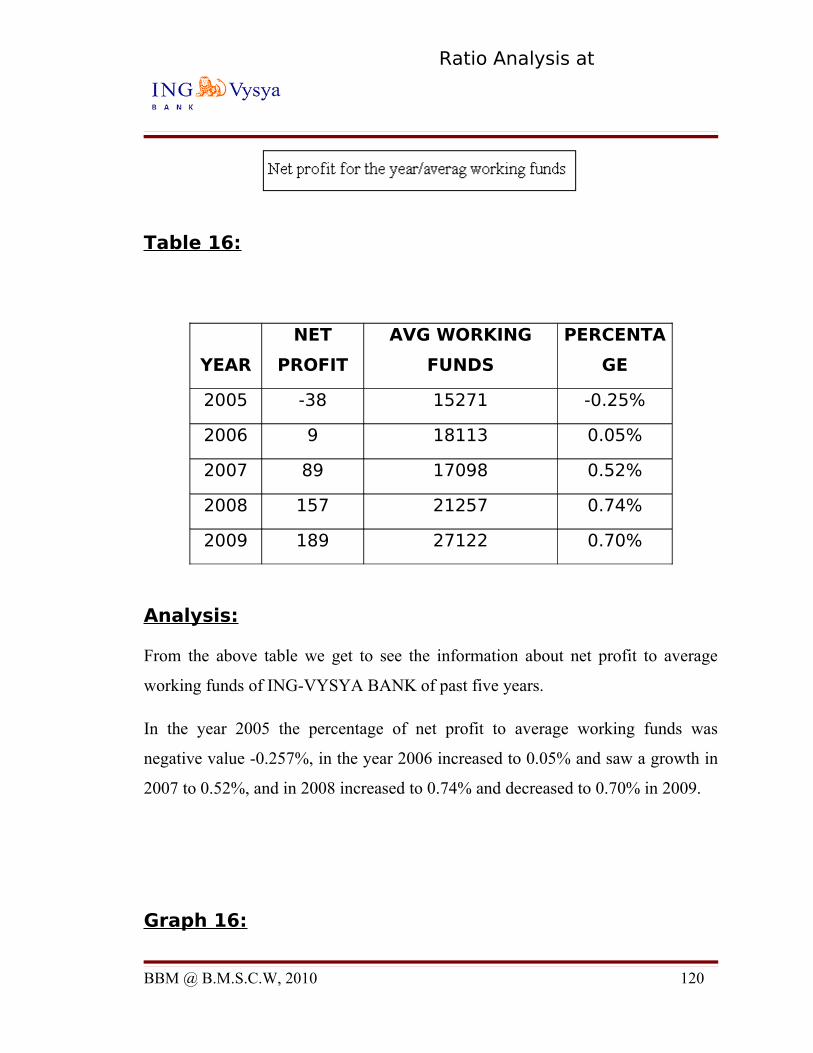
Ratio Analysis at
Table 16:
YEAR
NET
PROFIT
AVG WORKING
FUNDS
PERCENTA
GE
2005 -38 15271 -0.25%
2006 9 18113 0.05%
2007 89 17098 0.52%
2008 157 21257 0.74%
2009 189 27122 0.70%
Analysis:
From the above table we get to see the information about net profit to average
working funds of ING-VYSYA BANK of past five years.
In the year 2005 the percentage of net profit to average working funds was
negative value -0.257%, in the year 2006 increased to 0.05% and saw a growth in
2007 to 0.52%, and in 2008 increased to 0.74% and decreased to 0.70% in 2009.
Graph 16:
BBM @ B.M.S.C.W, 2010 120

Ratio Analysis at
Interpretation:
Graph showing the net profit to average working funds of ING VYSYA BANK of
past five years.
The graph states that the net profit to average working funds have grown up from
negative value to positive value and it also indicates that the current assets and
current liabilities are also high and the company is financial good.
.FINDINGS:
BBM @ B.M.S.C.W, 2010 121

Ratio Analysis at
1) It is observed that the cost of deposits ratio increased from year to year that
is from 4.90% to 6.83%.
2) It is observed that the cost of funds ratio is 5.42% in 2005 and it is
decreased in 2006 at 5.29%and it showed again increase in 2007,2008 and
2009 as 5.78%, 6.56%and 6.92% respectively.
3) It is observed that yield on advances ratio have been gradually increased
from 8.62% to 11.48%.
4) It is observed that the net interest margin ratio on average earning assets
was 2.92% during 2005 and it decreased to 2.79% during 2007 and
increased thereafter.
5) It is observed that the credit deposit ratio was decreased during 2008 and
2009 by 71.61% and 67.30%.
6) It is observed that the percentage low cost deposit ratio was decreased
during the year 2009 by 26.97%.
7) It is observed that the cost income ratio was 83.62%in 2006 and decreased
during the 220,2008 and 2009 by 69.06%, 66.47%and 64.52%.
8) It is observed that the return on average assets was decreased during 2006
and 2009 by 0.06% and 0.71%.
9) It is observed that the return on equity ratio was increased from negative
value to positive value that is from –5.28% in 2005 and increased to
11.62%in 2009.
BBM @ B.M.S.C.W, 2010 122

Ratio Analysis at
10)It is observed that the net interest ration was decreased during 2007, 2008
and 2009 by 60.93%, 54.35% and 54.26% respectively.
11)It is observed that the other income ratio was decreased during the year
2006 by 10.22% and increased thereafter and remains same during 2008
and 2009 by 19.65%.
12)It is observed that the staff cost ratio was decreased during the year 2006
and 2007 by 45.14% and 45.00% and increased thereafter.
13)It is observed that the gross NPA ratio was 4.98% during the year 2005 and
decreased thereafter to 4.09% in 2006, 2.55% in 2007 and 1.38% in 2008
and increased during 2009 by 1.86%.
14)It is observed that the net NPA ratio was decreased during the year 2006,
2007 and 2008 by 1.76%, 0.95%, and 0.70% respectively and increased
thereafter
15)It is observed that the capital adequacy ratio was decreased during the year
2007 and 2008 by 10.56% and 10.20% and increased thereafter.
16)It is observed that the net profit to average working funds ratio was
increased from negative value to positive value that is from the year 2005
to 2008 by –0.257% to 0.74% and decreased during 2009 by 0.70%.
BBM @ B.M.S.C.W, 2010 123

Ratio Analysis at
GENERAL FINDINGS:
1) ATM (Automated teller machine): ING-VYSYA BANK has at present 207
ATM’s all over the country.
2) Branches: ING-VYSYA BANK has 480 branches all over the country.
3) Products: ING-VYSYA BANK has a total of 18 products to its credit.
4) Total number of loans: ING-VYSYA BANK offers 8 types of loans
BBM @ B.M.S.C.W, 2010 124
Ratio Analysis at
SUGGESTIONS:
ING-VYSYA Bank has shown a better performance in the
parameters like deposits, advances, total assets, other income and
profit after tax, cost of deposits, yield on advances and cost of funds.
Whereas the net interest income, operating expenses, credit deposits
ratio, cost income ratio, return on equity, net profit to average
working funds, percentage low cost deposits to total deposits have
shown a competitive edge over the industry,
At the same time, gross NPA ratio, net NPA ratio, capital adequacy
ratio, staff cost/total operating cost, net interest income, return on
average assets and net interest margin are areas that need more
focus, so that they are on par with the industry as a whole part.
Proper planning of internal and external funds is suggested.
The company must maintain their issuing of finance effectively.
A financial aid for other financial institution and company’s has to
be effectively utilized.
ING VYSYA should finance all sort of companies in India.
Customers delight has to be ensured so that they don’t divert to other
companies.
BBM @ B.M.S.C.W, 2010 125
Ratio Analysis at
CONCLUSION:
• The ING VYSYS BANK LIMITED is a company with a history of more
than 79years.
• The company has spread its roots and branches all over the world widely.
• It has the international partnership, which has added up to its reputation and
goodwill.
• Bank is offering good services to customers at right time
• Performance of ING-VYSYA BANK is satisfactory in the current year
compare to its previous year.
• Bank is offering more attractive ways to increase its customers.
• Bank is offering more number of loans schemes for the developments of the
business.
• The net sales of the company and net income of the company has been
increasing which shows that increase in sales increase the income and the
profitability position of the company is good.
• ING VYSYA BANK has joined feathers to its wings to render service in
various fields such as:
1) ING VYSYA Banking.
2) ING VYSYA Mutual funds
BBM @ B.M.S.C.W, 2010 126

Ratio Analysis at
3) ING VYSYA Life insurance.
SWOT ANALYSIS:
Swot analysis stands for strengths, weakness, opportunities and threats.
STRENGTHS:
o The brand is ING VYSYA BANK LIMITED, dedicated to
excellence completely for financing.
o VYSYA BANK has international partnership with ING LIMITED.
o ING VYSYA group caters to the financial needs of individual and
corporate.
o ING VYSYA uses modern and top software technologies.
o It is a premiere global provider of the best quality.
WEAKNESS:
o There is less diversification.
OPPORTUNITIES:
o More number of competitors.
o They are planning to establish their branches all over India.
o Market share can be covered at a much possible rate.
THREATS:
BBM @ B.M.S.C.W, 2010 127

Ratio Analysis at
o The main threat is from private sector organization because of
liberalization.
BBM @ B.M.S.C.W, 2010 128