8.1 A FORECAST STRATEGY FOR ANTICIPATING …cstar.cestm.albany.edu/coolmeso/preprint.pdf · BAND...
9
8.1 A FORECAST STRATEGY FOR ANTICIPATING COLD SEASON MESOSCALE BAND FORMATION WITHIN DEVELOPING EXTRATROPICAL CYCLONES David R. Novak 1* , Jeff S. Waldstreicher 1 , Lance F. Bosart 2 , Daniel Keyser 2 1 NOAA/National Weather Service Eastern Region, Scientific Services Division, Bohemia, NY 2 Department of Earth and Atmospheric Sciences University at Albany, State University of New York, Albany, NY 1. INTRODUCTION Mesoscale band formation in extratropical cyclones can dramatically affect the timing, intensity, and subsequent accumulation of precipitation. The effects of mesoscale bands are especially evident during the cold season, when mesoscale snowbands can be responsible for snowfall rates of 3–5 in h –1 and their limited scale can create extreme gradients in snow accumulation. Such mesoscale characteristics have made the diagnosis and prediction of mesoscale bands challenging. Previous studies have established frontogenesis in the presence of near-neutral moist gravitational or symmetric stability as the primary mechanism for band development (e.g., Thorpe and Emanuel 1985; Sanders and Bosart 1985; Nicosia and Grumm 1999). The assessment of frontogenesis and moist gravitational and symmetric stability in an operational forecasting environment has been discussed by Wiesmueller and Zubrick (1998) and Schultz and Schumacher (1999) among others; however, the synoptic context in which favorable environments for band development are established and in which such assessment may be employed has only recently been studied. Novak et al. (2003) in a study of 48 single-banded events in the northeast United States (US) found that band formation in the comma head portion of cyclones was associated with cyclogenesis, as the development of a closed midlevel (600–800 hPa) circulation supported deformation and associated frontogenesis northwest of the surface cyclone center. These results are consistent with the work of Martin (1998a,b), Nicosia and Grumm (1999), Moore et al. (2002), and Banacos (2003) who have documented similar synoptic and mesoscale flow evolutions in case studies of mesoscale banding in the northeast and central US. These emerging conceptual models of the synoptic and mesoscale flow environments supportive of band formation are providing forecasters awareness of the potential for mesoscale banding one to two days in advance. At the same time, new datasets are providing powerful short-range (< 12 h) forecasting tools. The *Corresponding author address: David Novak, NOAA/NWS Eastern Region Headquarters, 630 Johnson Avenue, Bohemia, NY 11716 email: [email protected] Rapid Update Cycle (RUC) model (Benjamin et al. 1994) provides hourly three-dimensional mesoscale analyses incorporating high temporal and spatial resolution remote sensing datasets [radar, profiler, Aircraft Communication Addressing and Reporting System (ACARS), etc.]. Forecasts initialized with these analyses are integrated out to 12 h, providing important guidance between conventional 6-hourly operational model runs. Also the availability of data from high- resolution (< 15 km) models, such as the Eta, Workstation Eta, and MM5, are providing explicit forecasts of mesoscale banded features (Han et al. 2003). This paper presents a scale- and time- dependent strategy to anticipate cold-season mesoscale band formation, incorporating emerging conceptual models of band development, model guidance, and observational tools available to forecasters. The advantages and challenges associated with this strategy will be illustrated through operational application to the 25 December 2002 northeast US snowstorm, which exhibited intense mesoscale snowband formation. 2. FORECAST STRATEGY 2.1 24–48 h before the event Climatological and case study results have demonstrated the dynamical link between the process of cyclogenesis, attendant deformation zones, and associated frontogenesis. The degree of cyclogenesis has impact on the development and magnitude of deformation zones, subsequent intensity of fronts, and the juxtaposition of dry and moist airstreams conducive to reducing the moist gravitational and symmetric stability (Nicosia and Grumm 1999; Fig. 1a). Of particular interest is the development of midlevel deformation, which can be maximized north and west of the surface cyclone as the midlevel circulation develops and/or in diffluent flow ahead of the surface cyclone (Fig. 1b). Deformation is important since, in the presence of a temperature gradient, it can contribute to frontogenesis, which serves as mesoscale forcing for banded precipitation. It is noted that although cyclogenesis often provides a favorable environment for single-band formation, bands may form in other synoptic environments given an environment of
-
Upload
truongmien -
Category
Documents
-
view
216 -
download
0
Transcript of 8.1 A FORECAST STRATEGY FOR ANTICIPATING …cstar.cestm.albany.edu/coolmeso/preprint.pdf · BAND...
8.1 A FORECAST STRATEGY FOR ANTICIPATING COLD SEASON MESOSCALE BAND FORMATION WITHIN DEVELOPING EXTRATROPICAL CYCLONES
David R. Novak1*, Jeff S. Waldstreicher1, Lance F. Bosart2, Daniel Keyser2
1NOAA/National Weather Service Eastern Region, Scientific Services Division, Bohemia, NY
2Department of Earth and Atmospheric Sciences University at Albany, State University of New York, Albany, NY
1. INTRODUCTION
Mesoscale band formation in extratropical cyclones can dramatically affect the timing, intensity, and subsequent accumulation of precipitation. The effects of mesoscale bands are especially evident during the cold season, when mesoscale snowbands can be responsible for snowfall rates of 3–5 in h–1 and their limited scale can create extreme gradients in snow accumulation. Such mesoscale characteristics have made the diagnosis and prediction of mesoscale bands challenging.
Previous studies have established frontogenesis in the presence of near-neutral moist gravitational or symmetric stability as the primary mechanism for band development (e.g., Thorpe and Emanuel 1985; Sanders and Bosart 1985; Nicosia and Grumm 1999). The assessment of frontogenesis and moist gravitational and symmetric stability in an operational forecasting environment has been discussed by Wiesmueller and Zubrick (1998) and Schultz and Schumacher (1999) among others; however, the synoptic context in which favorable environments for band development are established and in which such assessment may be employed has only recently been studied.
Novak et al. (2003) in a study of 48 single-banded events in the northeast United States (US) found that band formation in the comma head portion of cyclones was associated with cyclogenesis, as the development of a closed midlevel (600–800 hPa) circulation supported deformation and associated frontogenesis northwest of the surface cyclone center. These results are consistent with the work of Martin (1998a,b), Nicosia and Grumm (1999), Moore et al. (2002), and Banacos (2003) who have documented similar synoptic and mesoscale flow evolutions in case studies of mesoscale banding in the northeast and central US. These emerging conceptual models of the synoptic and mesoscale flow environments supportive of band formation are providing forecasters awareness of the potential for mesoscale banding one to two days in advance.
At the same time, new datasets are providing powerful short-range (< 12 h) forecasting tools. The *Corresponding author address: David Novak, NOAA/NWS Eastern Region Headquarters, 630 Johnson Avenue, Bohemia, NY 11716 email: [email protected]
Rapid Update Cycle (RUC) model (Benjamin et al. 1994) provides hourly three-dimensional mesoscale analyses incorporating high temporal and spatial resolution remote sensing datasets [radar, profiler, Aircraft Communication Addressing and Reporting System (ACARS), etc.]. Forecasts initialized with these analyses are integrated out to 12 h, providing important guidance between conventional 6-hourly operational model runs. Also the availability of data from high-resolution (< 15 km) models, such as the Eta, Workstation Eta, and MM5, are providing explicit forecasts of mesoscale banded features (Han et al. 2003).
This paper presents a scale- and time- dependent strategy to anticipate cold-season mesoscale band formation, incorporating emerging conceptual models of band development, model guidance, and observational tools available to forecasters. The advantages and challenges associated with this strategy will be illustrated through operational application to the 25 December 2002 northeast US snowstorm, which exhibited intense mesoscale snowband formation. 2. FORECAST STRATEGY
2.1 24–48 h before the event
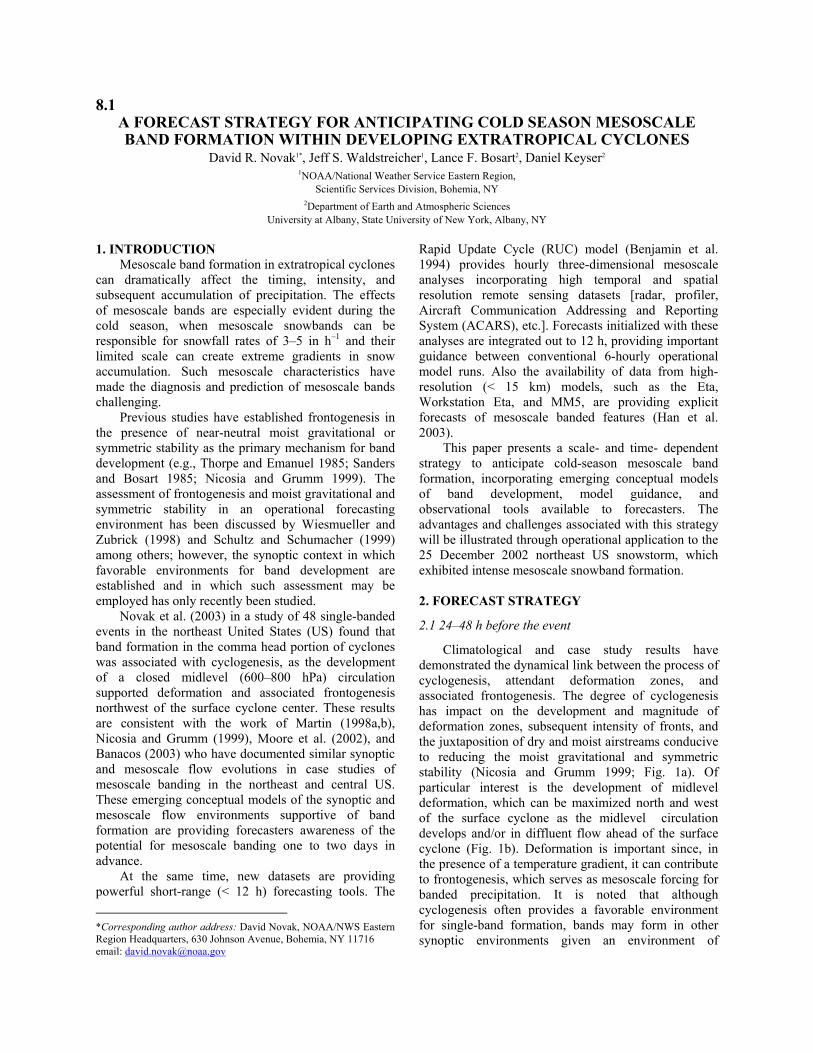
Climatological and case study results have demonstrated the dynamical link between the process of cyclogenesis, attendant deformation zones, and associated frontogenesis. The degree of cyclogenesis has impact on the development and magnitude of deformation zones, subsequent intensity of fronts, and the juxtaposition of dry and moist airstreams conducive to reducing the moist gravitational and symmetric stability (Nicosia and Grumm 1999; Fig. 1a). Of particular interest is the development of midlevel deformation, which can be maximized north and west of the surface cyclone as the midlevel circulation develops and/or in diffluent flow ahead of the surface cyclone (Fig. 1b). Deformation is important since, in the presence of a temperature gradient, it can contribute to frontogenesis, which serves as mesoscale forcing for banded precipitation. It is noted that although cyclogenesis often provides a favorable environment for single-band formation, bands may form in other synoptic environments given an environment of
deformation and associated frontogenesis in the presence of small gravitational or symmetric stability and sufficient moisture [as shown by Banacos (2003)].
The relation between the mesoscale forcing environment and the synoptic-scale flow evolution affords forecasters an opportunity to assess the possibility of a banded event one to two days in advance. Similar to predictions of other mesoscale phenomena such as lake-effect snow or severe thunderstorms, the identification of favorable synoptic environments can provide forecasters a heightened awareness to the possible event occurrence, although the uncertainty in cyclone and frontal positions at this forecast projection limits prediction of the explicit timing and location of the event.
Fig. 1. Conceptual models of synoptic and mesoscale environments of banded cyclones from (a) Nicosia and Grumm (1999) and (b) Novak et al. (2003). 2.2 12–24 h before the event
Within a day before the event confidence in the synoptic-scale flow evolution is generally established. This allows the forecaster to assess possible band development by examining the plan view and cross-sectional environment of identified deformation zones and frontogenesis maxima. Since frontogenesis in the presence of near-neutral moist gravitational or symmetric stability has been identified as the primary forcing mechanism for band development, assuming sufficient moisture the location and timing of the coincidence of these parameters can outline the banded threat area. However, a number of challenges arise with
the operational assessment of frontogenesis and moist gravitational and symmetric stability.
Since frontal zones and the associated frontogenesis maxima slope into the cold air, the level a forecaster chooses to assess frontogenesis can dramatically affect the area outlined for possible band development. In practice, assessment has focused on levels between 850–600 hPa (Banacos 2003; Schumacher 2003), however, depending on which level or sub-layer is chosen the outlined location may vary by more than 200 km. Observational studies have suggested that bands tend to form near the location where a layer of small moist gravitational or symmetric stability lies just above the midlevel frontogenesis maximum (e.g., Trapp et al. 2001; Novak et al. 2002a).
Once a threat area is outlined, there remains the question of if the frontogenetical forcing is strong enough to support band formation? Operational experience has shown that no single threshold value can be correlated to band development, since the gravitational and symmetric stability modulates the frontogenetical response, and other factors such as microphysics and moisture availability can alter precipitation development. An additional complication is the fact that the frontogenesis magnitude varies depending on the resolution of the grids on which it was calculated. Similar challenges are noted when interpreting the moist symmetric stability as the calculation of saturation equivalent potential vorticity (EPV) has shown to be quite sensitive to the choice of representative wind (geostrophic versus full wind) (e.g., Schultz and Schumacher 1999; Clark et al. 2002) and model resolution.
Model accumulated precipitation forecasts can aid assessment of band potential, providing evidence to support or refute the hypothesis of band formation. The possibility of band formation is supported when a narrow axis of precipitation is correlated with the analyzed forecast location of midlevel frontogenesis and small moist gravitational or symmetric stability (Schumacher 2003). Although the explicit timing, intensity, and placement of a model forecast precipitation band may be in question, the fact that the associated model dynamics are resulting in banded precipitation suggests a favorable environment. Precipitation fields from high-resolution models can provide additional insight into the nature of the precipitation event given their fine horizontal resolution and hourly accumulation periods (as demonstrated by Roebber et al. 2002 for convective precipitation events). 2.3 0–12 h before the event
Within 12 h of the banded event, short-range forecast models, such as the RUC, can be used to
narrow the forecast area of band formation and anticipate the band evolution (Banacos 2003). Similar to longer forecast projections, focus is placed on the evolution of the midlevel frontogenesis and moist gravitational/symmetric stabilities, however the temporal proximity to the event provides greater confidence in the model forecast placement and magnitude of favorable banding dynamics. Additionally, short-range forecast model parameters are often available on an hourly time resolution, allowing for a detailed assessment of the timing of the event. Finally, the proximity to the event allows for comparison of observations (radar, soundings, satellite, profilers) with model forecasts, from which adjustments can be made (Banacos 2003).
2.4 During the event
The existence of a banded feature allows for direct correlation of short-range model analyses with radar, sounding, satellite, and wind profiler observations. As shown in case studies, the correlation of the observed band with midlevel frontogenesis and small EPV allows prediction of band development, movement, intensity, and dissipation based upon the forecast frontogenesis and stability evolutions. 3. CASE EXAMPLE
During December 2002, training outlining this mesoscale band forecast strategy was presented to National Weather Service forecast offices (Novak et al. 2002b), of which the Albany, NY (ALY) and Binghamton, NY (BGM) Weather Forecast Offices (WFOs) were participants. Just days later on the afternoon and evening of 25 December 2002 (Christmas Day) the ALY and BGM County Warning Areas (CWAs) (Fig. 2) were directly affected by a mesoscale snowband as a strong coastal storm developed off the northeast US coast. Storm total snowfall accumulations exceeding 30 in were widespread in central and eastern NY due largely to the snowband, with snowfall rates of 5 in h-1 officially recorded as the band moved through Albany, NY. Awareness of the proposed forecast strategy was evident in Area Forecast Discussions (AFDs) and forecast products issued by the BGM and ALY WFOs, providing an opportunity to illustrate this strategy’s application and potential benefit in forecast operations.
3.1 24–48 h before the event On 23 December 2002 confidence in a major cyclogenesis event occurring Christmas Day off the northeast US coast was supported by individual operational model runs and ensemble consensus. Both the Global Forecast System (GFS) and Eta models were
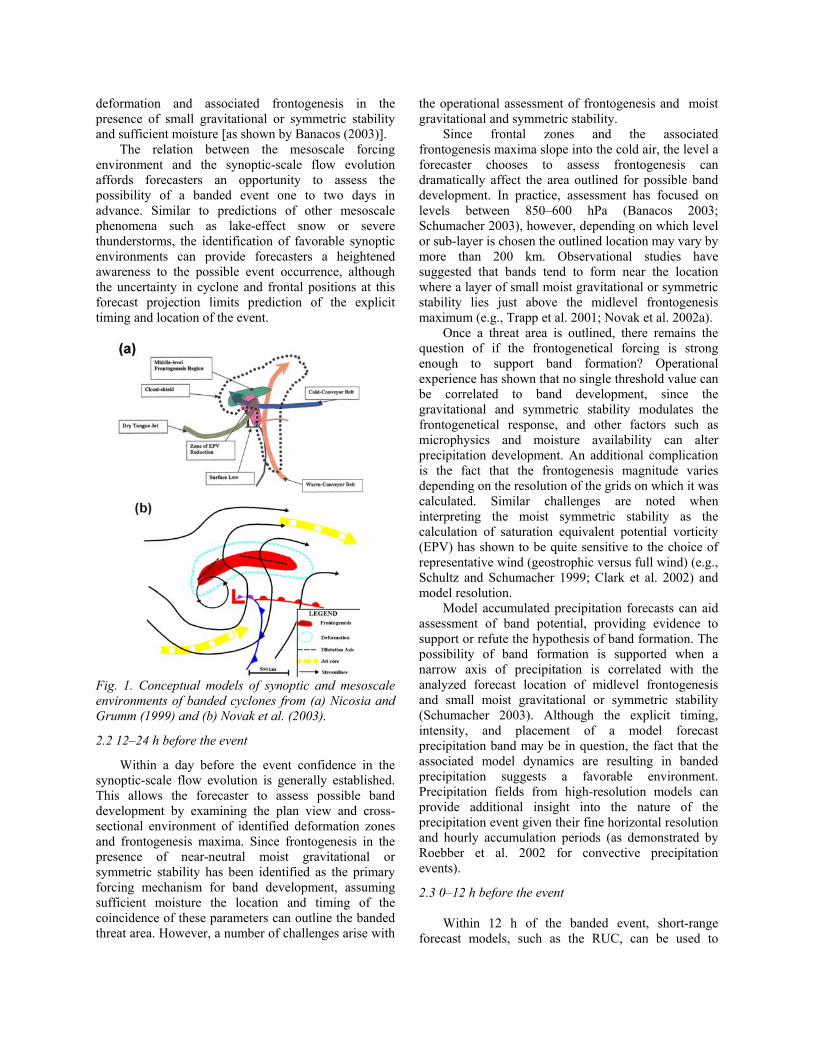
Fig. 2. Topographic map of the BGM, ALY, and surrounding WFO County Warning Areas (outlined in black). Topography is colored according to scale (kft) with primary features labeled. predicting the formation of a closed 700 hPa low and associated deformation and frontogenesis over Pennsylvania and New York (Fig. 3), although differences in the midlevel circulation resulted in differences in deformation location [to the north (west) of the surface low in the Eta (GFS)] and associated frontogenesis orientation [east-west (northeast-southwest) for the Eta (GFS)]. Although the details varied, the forecast synoptic flow environment and associated upper-level wind, midlevel deformation, and frontogenesis fields resembled conceptual models of favorable banding environments (compare Figs. 1 and 3). AFDs highlighted forecasters’ awareness of the favorable banding environment, as the possibility of significant mesoscale band formation was recognized as early as 36 h before the banding event (Fig. 4). Focus on the occurrence of a cyclogenesis event and the location of the primary midlevel deformation zone and frontogenesis maximum is evident in the 3:13 am EST 24 December 2002 BGM discussion. As model data from the 1200 UTC 24 December 2002 operational model runs continued to show strong deformation and frontogenesis collocated with small geostrophic saturation equivalent potential vorticity (EPVg) over eastern Pennsylvania and New York during Christmas Day, forecasters recognized the potential for heavy snowfall (Fig. 4). Winter Storm Warnings for Christmas Day were issued by the BGM and ALY WFOs at 3:25 pm and 3:41 pm EST 24 December 2002, respectively. It should be noted that although forecasters expressed confidence in the occurrence of a major storm with possible band formation, identifying the explicit location of the band was recognized as a remaining forecast question to be addressed closer to the event (Fig. 4).
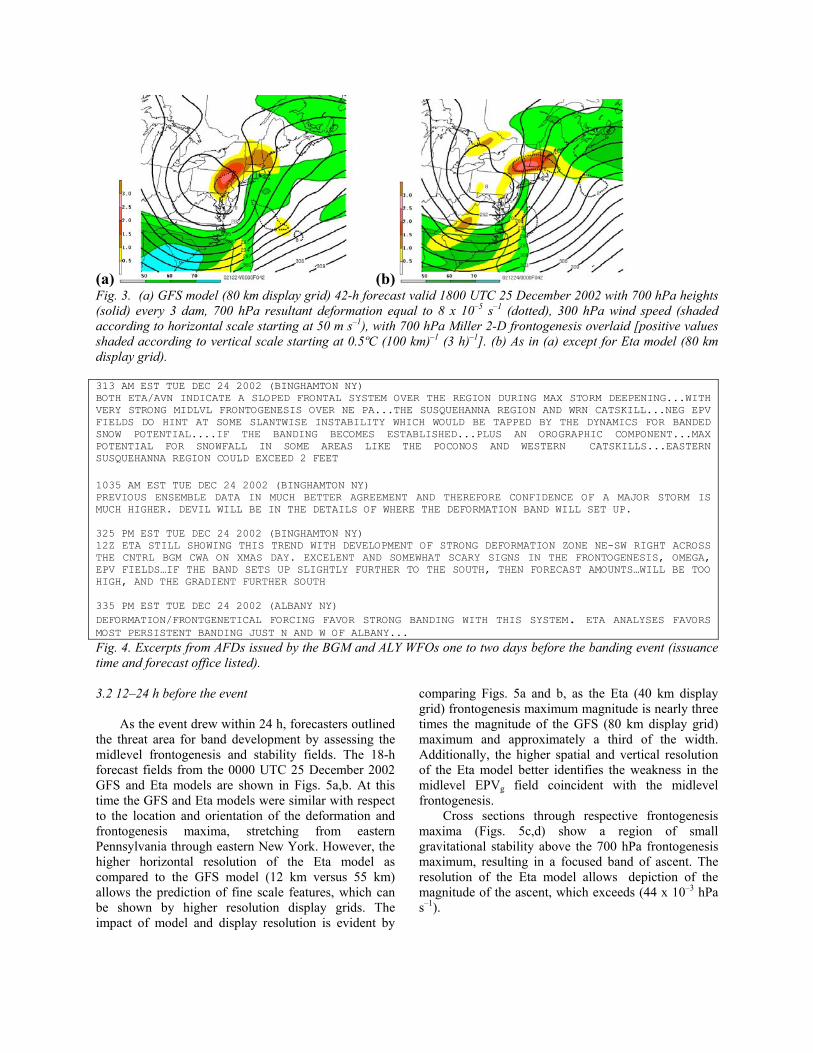
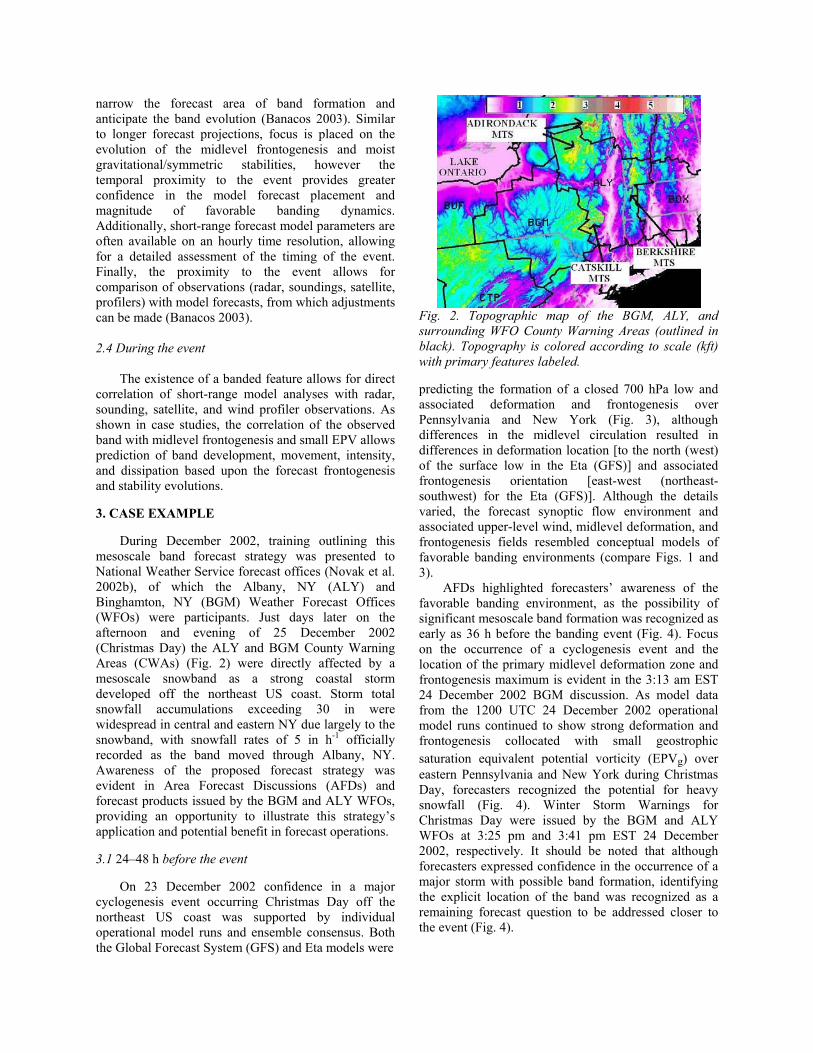
(a) (b) Fig. 3. (a) GFS model (80 km display grid) 42-h forecast valid 1800 UTC 25 December 2002 with 700 hPa heights (solid) every 3 dam, 700 hPa resultant deformation equal to 8 x 10⁻⁵ s–1 (dotted), 300 hPa wind speed (shaded according to horizontal scale starting at 50 m s–1), with 700 hPa Miller 2-D frontogenesis overlaid [positive values shaded according to vertical scale starting at 0.5ºC (100 km)–1 (3 h)–1]. (b) As in (a) except for Eta model (80 km display grid). 313 AM EST TUE DEC 24 2002 (BINGHAMTON NY) BOTH ETA/AVN INDICATE A SLOPED FRONTAL SYSTEM OVER THE REGION DURING MAX STORM DEEPENING...WITH VERY STRONG MIDLVL FRONTOGENESIS OVER NE PA...THE SUSQUEHANNA REGION AND WRN CATSKILL...NEG EPV FIELDS DO HINT AT SOME SLANTWISE INSTABILITY WHICH WOULD BE TAPPED BY THE DYNAMICS FOR BANDED SNOW POTENTIAL....IF THE BANDING BECOMES ESTABLISHED...PLUS AN OROGRAPHIC COMPONENT...MAX POTENTIAL FOR SNOWFALL IN SOME AREAS LIKE THE POCONOS AND WESTERN CATSKILLS...EASTERN SUSQUEHANNA REGION COULD EXCEED 2 FEET 1035 AM EST TUE DEC 24 2002 (BINGHAMTON NY) PREVIOUS ENSEMBLE DATA IN MUCH BETTER AGREEMENT AND THEREFORE CONFIDENCE OF A MAJOR STORM IS MUCH HIGHER. DEVIL WILL BE IN THE DETAILS OF WHERE THE DEFORMATION BAND WILL SET UP. 325 PM EST TUE DEC 24 2002 (BINGHAMTON NY) 12Z ETA STILL SHOWING THIS TREND WITH DEVELOPMENT OF STRONG DEFORMATION ZONE NE-SW RIGHT ACROSS THE CNTRL BGM CWA ON XMAS DAY. EXCELENT AND SOMEWHAT SCARY SIGNS IN THE FRONTOGENESIS, OMEGA, EPV FIELDS…IF THE BAND SETS UP SLIGHTLY FURTHER TO THE SOUTH, THEN FORECAST AMOUNTS…WILL BE TOO HIGH, AND THE GRADIENT FURTHER SOUTH 335 PM EST TUE DEC 24 2002 (ALBANY NY) DEFORMATION/FRONTGENETICAL FORCING FAVOR STRONG BANDING WITH THIS SYSTEM. ETA ANALYSES FAVORS MOST PERSISTENT BANDING JUST N AND W OF ALBANY... Fig. 4. Excerpts from AFDs issued by the BGM and ALY WFOs one to two days before the banding event (issuance time and forecast office listed). 3.2 12–24 h before the event
As the event drew within 24 h, forecasters outlined the threat area for band development by assessing the midlevel frontogenesis and stability fields. The 18-h forecast fields from the 0000 UTC 25 December 2002 GFS and Eta models are shown in Figs. 5a,b. At this time the GFS and Eta models were similar with respect to the location and orientation of the deformation and frontogenesis maxima, stretching from eastern Pennsylvania through eastern New York. However, the higher horizontal resolution of the Eta model as compared to the GFS model (12 km versus 55 km) allows the prediction of fine scale features, which can be shown by higher resolution display grids. The impact of model and display resolution is evident by
comparing Figs. 5a and b, as the Eta (40 km display grid) frontogenesis maximum magnitude is nearly three times the magnitude of the GFS (80 km display grid) maximum and approximately a third of the width. Additionally, the higher spatial and vertical resolution of the Eta model better identifies the weakness in the midlevel EPVg field coincident with the midlevel frontogenesis.
Cross sections through respective frontogenesis maxima (Figs. 5c,d) show a region of small gravitational stability above the 700 hPa frontogenesis maximum, resulting in a focused band of ascent. The resolution of the Eta model allows depiction of the magnitude of the ascent, which exceeds (44 x 10–3 hPa s–1).

(a) (b)
(c) (d) Fig. 5. (a) GFS model (80 km display grid) 18-h forecast valid 1800 UTC 25 December 2002 with 700 hPa heights (solid) every 3 dam, geostrophic saturation equivalent potential vorticity calculated in the 700–600 hPa layer contoured (blue solid) every 0.5 PVU (1 PVU = 10–6 m2 K s–1 kg–1) where negative at and below 0 PVU, and 700 hPa Miller 2-D frontogenesis [positive values shaded according to vertical scale in units of ºC (100 km)–1 (3 h)–1]. (b) As in (a) except for Eta model (40 km display grid). (c) Cross section through midlevel frontogenesis [orientation shown in (a)] showing saturated equivalent potential temperature (solid) contoured every 3 K, Miller 2-D frontogenesis [shaded for positive values according to scale in units of ºC (100 km)–1 (3 h)–1],and vertical velocity contoured every 4 x 10⁻³ hPa s–1 (dashed) at and below –4 x 10⁻³ hPa s–1. (d) As in (c) except for Eta model.
Fig. 6. (a) 6-h precipitation accumulation (shaded according to color scale in mm) ending 0000 UTC 26 December 2002 from the 0000 UTC 25 December 2002 initialized GFS model (80 km display grid). (b) As in (a) except for the Eta model (40 km display grid). (c) As in (a) except 1-h precipitation accumulation ending 2100 UTC 25 December 2002 from the 12 km SUNY Stony Brook MM5.
Model QPF fields also were referenced by forecasters to confirm the likelihood of banding and refine its predicted location. The 6-h accumulated precipitation ending 0000 UTC 26 December 2002 showed marked differences in precipitation between the GFS (Fig. 6a) and Eta models (Fig. 6b), with the Eta model clearly depicting a precipitation band from northeast Pennsylvania into eastern NY. This solution
was further substantiated by forecast hourly precipitation fields from the 12 km SUNY Stony Brook MM5 (Colle et al. 2003), which showed the explicit formation and movement of a precipitation band (Fig. 6c).
The early Christmas morning AFD (Fig. 7) shows that given similar forcing fields between the GFS and Eta, forecasters favored the precipitation solution from
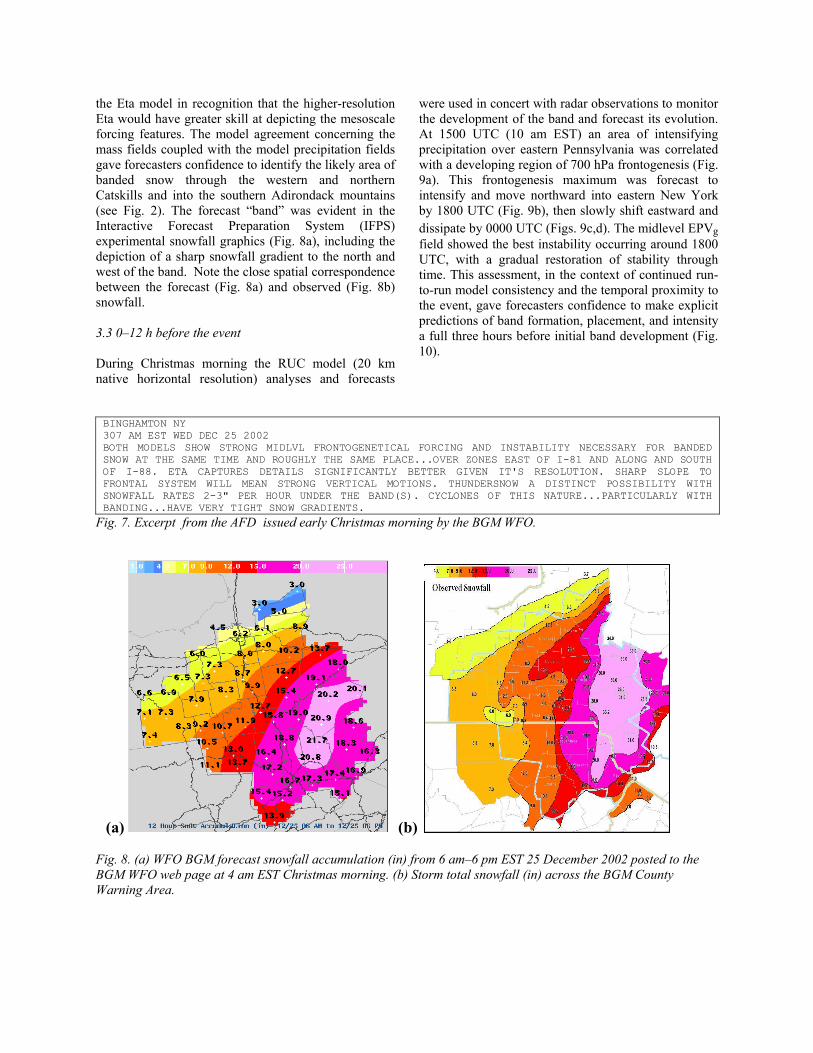
the Eta model in recognition that the higher-resolution Eta would have greater skill at depicting the mesoscale forcing features. The model agreement concerning the mass fields coupled with the model precipitation fields gave forecasters confidence to identify the likely area of banded snow through the western and northern Catskills and into the southern Adirondack mountains (see Fig. 2). The forecast “band” was evident in the Interactive Forecast Preparation System (IFPS) experimental snowfall graphics (Fig. 8a), including the depiction of a sharp snowfall gradient to the north and west of the band. Note the close spatial correspondence between the forecast (Fig. 8a) and observed (Fig. 8b) snowfall.
3.3 0–12 h before the event During Christmas morning the RUC model (20 km native horizontal resolution) analyses and forecasts
were used in concert with radar observations to monitor the development of the band and forecast its evolution. At 1500 UTC (10 am EST) an area of intensifying precipitation over eastern Pennsylvania was correlated with a developing region of 700 hPa frontogenesis (Fig. 9a). This frontogenesis maximum was forecast to intensify and move northward into eastern New York by 1800 UTC (Fig. 9b), then slowly shift eastward and dissipate by 0000 UTC (Figs. 9c,d). The midlevel EPVg field showed the best instability occurring around 1800 UTC, with a gradual restoration of stability through time. This assessment, in the context of continued run-to-run model consistency and the temporal proximity to the event, gave forecasters confidence to make explicit predictions of band formation, placement, and intensity a full three hours before initial band development (Fig. 10).
BINGHAMTON NY 307 AM EST WED DEC 25 2002 BOTH MODELS SHOW STRONG MIDLVL FRONTOGENETICAL FORCING AND INSTABILITY NECESSARY FOR BANDED SNOW AT THE SAME TIME AND ROUGHLY THE SAME PLACE...OVER ZONES EAST OF I-81 AND ALONG AND SOUTH OF I-88. ETA CAPTURES DETAILS SIGNIFICANTLY BETTER GIVEN IT'S RESOLUTION. SHARP SLOPE TO FRONTAL SYSTEM WILL MEAN STRONG VERTICAL MOTIONS. THUNDERSNOW A DISTINCT POSSIBILITY WITH SNOWFALL RATES 2-3" PER HOUR UNDER THE BAND(S). CYCLONES OF THIS NATURE...PARTICULARLY WITH BANDING...HAVE VERY TIGHT SNOW GRADIENTS.
Fig. 7. Excerpt from the AFD issued early Christmas morning by the BGM WFO.
(a) (b) Fig. 8. (a) WFO BGM forecast snowfall accumulation (in) from 6 am–6 pm EST 25 December 2002 posted to the BGM WFO web page at 4 am EST Christmas morning. (b) Storm total snowfall (in) across the BGM County Warning Area.

(a) (b)
(c) (d)
Fig. 9. (a) WSR-88D radar mosaic at 1500 UTC 25 December 2002 with the 1500 UTC RUC analysis (80 km display grid) 700 hPa 2-D Miller frontogenesis field overlaid [black solid, labeled in units of ºC (100 km)–1 (3 h)–1]. (b) RUC 3-h forecast 700 hPa height (solid), frontogenesis [shaded according to scale in units of ºC (100 km)–1 (3 h)–1], and geostrophic saturation equivalent potential vorticity calculated in the 700–600 hPa layer contoured (blue solid) every 0.25 PVU (1 PVU = 10–6 m2 K s–1 kg–1) at and below 0.25 PVU valid 1800 UTC 25 December 2002. (c) As in (b) except 6-h forecast valid 2100 UTC 25 December 2002. (d) As in (b) except 9-h forecast valid 0000 UTC 26 December 2002. 1050 AM EST WED DEC 25 2002 CURRENT RUC/MESO-ETA FRONTOGENESIS PATTERNS ARE MATCHING WELL WITH AN AREA OF HEAVY PRECIPITATION OVER EASTERN PA INTO CENTRAL NY. THE RUC AND MESO-ETA BOTH INDICATE THAT THIS AREA OF ENHANCED FRONTOGENESIS WILL REMAIN ACROSS EASTERN PA AND CENTRAL NY THROUGH EARLY AFTERNOON...THEN SLOWLY SHIFT OFF TO THE NORTHEAST THIS AFTERNOON. RUC/MESO-ETA CROSS-SECTION ANALYSIS ARE ALSO INDICATING A GOOD INSTABILITY SIGNATURE WITH A LAYER OF NEGATIVE EPV LOCATED IN THE LAYER JUST ABOVE THE FRONTOGENESIS AROUND 500 TO 600 MB….BASED ON THE LIKELIHOOD OF VERY INTENSE BANDING OVER THE NEXT 6 HOURS WILL MENTION SOME LOCALIZED 2 FOOT AMOUNTS OVER THE EASTERN CWA.
Fig. 10. Excerpt from AFD issued by the BGM WFO 3 h before the banding event. 3.4 During the event
Band formation occurred just after 1900 UTC (2 pm EST) in eastern New York. As the event progressed through the afternoon, short-term forecasts noted the extreme nature of the snowfall including the possibility of more than a foot of snowfall accumulation in a three hour period within the band (Fig. 11). It is unlikely forecasts of such extreme snowfall would have been made in the absence of prior assessment and situational awareness. As the 1800 UTC RUC forecast (not shown)
predicted the weakening of midlevel frontogenesis and the restoration of symmetric stability after 0000 UTC 26 December 2002 (7 pm EST), subsequent nowcasts predicted the demise of the band by 10:30 pm EST (0330 UTC 26 December 2002) (Fig. 11). Radar and 700 hPa frontogenesis analyses (Fig. 12) show the close correlation between the 700 hPa frontogenesis maximum and the observed band through the evolution of the event.
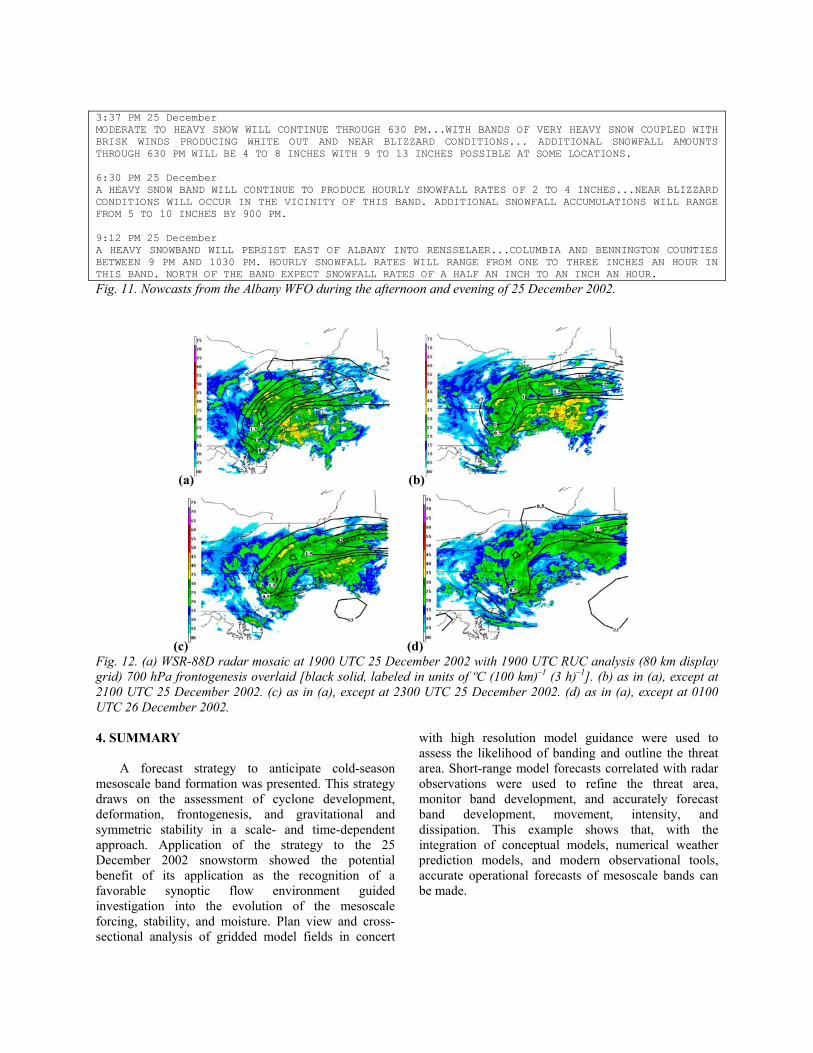
3:37 PM 25 December MODERATE TO HEAVY SNOW WILL CONTINUE THROUGH 630 PM...WITH BANDS OF VERY HEAVY SNOW COUPLED WITH BRISK WINDS PRODUCING WHITE OUT AND NEAR BLIZZARD CONDITIONS... ADDITIONAL SNOWFALL AMOUNTS THROUGH 630 PM WILL BE 4 TO 8 INCHES WITH 9 TO 13 INCHES POSSIBLE AT SOME LOCATIONS. 6:30 PM 25 December A HEAVY SNOW BAND WILL CONTINUE TO PRODUCE HOURLY SNOWFALL RATES OF 2 TO 4 INCHES...NEAR BLIZZARD CONDITIONS WILL OCCUR IN THE VICINITY OF THIS BAND. ADDITIONAL SNOWFALL ACCUMULATIONS WILL RANGE FROM 5 TO 10 INCHES BY 900 PM. 9:12 PM 25 December A HEAVY SNOWBAND WILL PERSIST EAST OF ALBANY INTO RENSSELAER...COLUMBIA AND BENNINGTON COUNTIES BETWEEN 9 PM AND 1030 PM. HOURLY SNOWFALL RATES WILL RANGE FROM ONE TO THREE INCHES AN HOUR IN THIS BAND. NORTH OF THE BAND EXPECT SNOWFALL RATES OF A HALF AN INCH TO AN INCH AN HOUR. Fig. 11. Nowcasts from the Albany WFO during the afternoon and evening of 25 December 2002.
(a) (b)
(c) (d) Fig. 12. (a) WSR-88D radar mosaic at 1900 UTC 25 December 2002 with 1900 UTC RUC analysis (80 km display grid) 700 hPa frontogenesis overlaid [black solid, labeled in units of ºC (100 km)–1 (3 h)–1]. (b) as in (a), except at 2100 UTC 25 December 2002. (c) as in (a), except at 2300 UTC 25 December 2002. (d) as in (a), except at 0100 UTC 26 December 2002. 4. SUMMARY
A forecast strategy to anticipate cold-season mesoscale band formation was presented. This strategy draws on the assessment of cyclone development, deformation, frontogenesis, and gravitational and symmetric stability in a scale- and time-dependent approach. Application of the strategy to the 25 December 2002 snowstorm showed the potential benefit of its application as the recognition of a favorable synoptic flow environment guided investigation into the evolution of the mesoscale forcing, stability, and moisture. Plan view and cross-sectional analysis of gridded model fields in concert
with high resolution model guidance were used to assess the likelihood of banding and outline the threat area. Short-range model forecasts correlated with radar observations were used to refine the threat area, monitor band development, and accurately forecast band development, movement, intensity, and dissipation. This example shows that, with the integration of conceptual models, numerical weather prediction models, and modern observational tools, accurate operational forecasts of mesoscale bands can be made.

5. ACKNOWLEDGMENTS The authors wish to thank Heather Hauser (NWS, Eastern Region Headquarters), Mike Evans (NWS Binghamton, NY), Dave Nicosia (NWS Binghamton, NY), Warren Snyder (NWS Albany, NY), Phil Schumacher (NWS Sioux Falls, SD), Peter Banacos (SPC), and David Schultz (NSSL/CIMMS) for insightful comments and discussions concerning this work. Dolores Kiessling (COMET) aided in acquiring data necessary to this study. This work was supported in part by NOAA Grant 1007941-1-012365, awarded to the University at Albany/SUNY as part of the CSTAR program. Additional information concerning the University at Albany CSTAR project may be found at http://cstar.cestm.albany.edu REFERENCES Banacos, P. C., 2003: Short-range prediction of banded
precipitation associated with deformation and frontogenetic forcing. Preprints, 10th Conference on Mesoscale Processes, Portland, OR, Amer. Meteor. Soc., CD-ROM, P1.7.
Benjamin, S. G., K. J. Brundage, P. A. Miller, T. L. Smith, G. A. Grell, D. Kim, J. M. Brown, and T. W. Schlatter, 1994: The Rapid Update Cycle at NMC. Preprints, 10th Conf. On Numerical Weather Prediction, Portland, OR, Amer. Meteor. Soc., 566–568.
Clark, J. H. E., R. P. James, and R. H. Grumm, 2002: A reexamination of the mechanisms responsible for banded precipitation. Mon. Wea. Rev., 130, 3074–3086.
Colle, B. A, J. B. Olson, and J. S. Tongue, 2003: Multiseason verification of the MM5. Part I: Comparison with the Eta model over the central and eastern United States and impact of MM5 resolution. Wea. Forecasting, 18, 431–457.
Han, M., M. K. Ramamurthy, R. M. Rauber, B. F. Jewett, and J. A. Grim, 2003: A modeling study of the frontal circulations associated with a heavy snowband in an extratropical cyclone. Preprints, 10th Conference on Mesoscale Processes, Portland, OR, Amer. Meteor. Soc., CD-ROM, 1.11.
Martin, J. E., 1998a: The structure and evolution of a continental winter cyclone. Part I: Frontal structure and the occlusion process. Mon. Wea. Rev., 126, 303–328.
——,1998b: The structure and evolution of a continental winter cyclone. Part II: Frontal forcing of an extreme snow event. Mon. Wea. Rev., 126, 329–348.
Moore, J. T., S. Ng, M. Singer, and C. E. Graves, 2002: Common characteristics of heavy banded snowfall events in the central United States. Preprints, 19th Conference on Weather Analysis and Forecasting, San Antonio, TX, Amer. Meteor. Soc., 3–6.
Nicosia, D. J., and R. H. Grumm, 1999: Mesoscale band formation in three major northeastern United States snowstorms. Wea. Forecasting, 14, 346–368.
Novak, D. R., J. S. Waldstreicher, L. F. Bosart, and D. Keyser, 2003: An observational study of cold season mesoscale band formation in the Northeast United States. Preprints, 31st Conference on Radar Meteorology, Seattle, WA, Amer. Meteor. Soc., 969–972.
Novak, D. R., 2002a: A climatological and composite study of cold season banded precipitation in the northeast United States. M. S. thesis, University at Albany, State University of NY, 182 pp. [Available from the Dept. of Earth and Atmospheric Sciences, University at Albany, State University of NY, Albany, NY 12222].
——, 2002b: Anticipating mesoscale band formation in winter storms. Available online at: http://www.cira.colostate.edu/ramm/visit/banding.html
Roebber, P. J., D. M. Schultz, and R. Romero, 2002: Synoptic regulation of the 3 May 1999 tornado outbreak. Wea. Forecasting, 13, 399–429.
Sanders, F.., and L. F. Bosart, 1985: Mesoscale structure in the megalopolitan snowstorm of 11-12 February 1983. Part I: Frontogenetical forcing and symmetric instability. J. Atmos. Sci., 42, 1050–1061.
Schultz, D. M., and P. N. Schumacher, 1999: The use and misuse of conditional symmetric instability. Mon.. Wea. Rev., 127, 2709–2732.
Schumacher, P. N., 2003: An example of forecasting mesoscale bands in an operational environment. Preprints, 10th Conference on Mesoscale Processes, Portland, OR, Amer. Meteor. Soc., CD-ROM, P 1.11.
Thorpe, A. J., and K. A. Emanuel, 1985: Frontogenesis in the presence of small stability to slantwise convection. J. Atmos. Sci., 42, 1809–1824.
Trapp, R. J., D. M. Schultz, A. V. Ryzhkov, and R. L. Holle, 2001: Multiscale structure and evolution of an Oklahoma winter precipitation event. Mon. Wea. Rev., 129, 486–501.
Wiesmueller, J. L., and S. M. Zubrick, 1998: Evaluation and application of conditional symmetric instability, equivalent potential vorticity, and frontogenetical forcing in an operational forecasting environment. Wea. Forecasting, 13, 84–101.