8 Grade Math Third Quarter Module 4: Linear Equations … UNIFIED SCHOOL DISTRICT INSTRUCTIONAL...
24
HIGLEY UNIFIED SCHOOL DISTRICT INSTRUCTIONAL ALIGNMENT 9/25/2013 Page 1 of 24 8 th Grade Math Third Quarter Module 4: Linear Equations (40 days) Unit 3: Systems of Linear Equations This unit extends students’ facility with solving problems by writing and solving equations. Big Idea: The solution to a system of two linear equations in two variables is an ordered pair that satisfies both equations. Some systems of equation have no solution (parallel lines) and others have infinite solutions (be the same line). Essential Questions: What makes a solution strategy both efficient and effective? How is it determined if multiple solutions to an equation are valid? How does the context of the problem affect the reasonableness of a solution? Why can two equations be added together to get another true equation? Vocabulary Simultaneous equations, intersecting, parallel lines, coefficient, distributive property, like terms, substitution, system of linear equations, substitution, elimination Grade Cluster Standard Common Core Standards Explanations & Examples Comments 8 EE. C 8 C. Analyze and solve linear equations and pairs of simultaneous linear equations Analyze and solve pairs of simultaneous linear equations. a. Understand that solutions to a system of two linear equations in two variables correspond to points of intersection of their graphs, because points of intersection satisfy both equations simultaneously. b. Solve systems of two linear equations in two variables algebraically, and estimate solutions by graphing the equations. Solve simple cases by inspection. For example, 3x + 2y = 5 and 3x + 2y = 6 have no solution because 3x + 2y cannot simultaneously be 5 and 6. 8.EE.8 Systems of linear equations can also have one solution, infinitely many solutions or no solutions. Students will discover these cases as they graph systems of linear equations and solve them algebraically. Students graph a system of two linear equations, recognizing that the ordered pair for the point of intersection is the x-value that will generate the given y-value for both equations. Students recognize that graphed lines with one point of intersection (different slopes) will have one solution, parallel lines (same slope, different y-intercepts) have no solutions, and lines that are the same (same slope, same y-intercept) will have infinitely many solutions. By making connections between algebraic and graphical solutions and the context of the system of linear equations, students are able to make sense of their solutions. Students need opportunities to work with equations and context that include whole number and/or Students’ perseverance in solving real-world problems with systems of equations requires that they work with various solution methods and learn to discern when each method is most appropriate (MP.1). As with the previous unit, writing and solving systems require that students make use of structure (MP.7) and attend to precision (MP.6) as students apply
-
Upload
hoangquynh -
Category
Documents
-
view
246 -
download
3
Transcript of 8 Grade Math Third Quarter Module 4: Linear Equations … UNIFIED SCHOOL DISTRICT INSTRUCTIONAL...

HIGLEY UNIFIED SCHOOL DISTRICT INSTRUCTIONAL ALIGNMENT
9/25/2013 Page 1 of 24
8th Grade Math Third Quarter
Module 4: Linear Equations (40 days) Unit 3: Systems of Linear Equations
This unit extends students’ facility with solving problems by writing and solving equations.
Big Idea: The solution to a system of two linear equations in two variables is an ordered pair that satisfies both equations.
Some systems of equation have no solution (parallel lines) and others have infinite solutions (be the same line).
Essential Questions:
What makes a solution strategy both efficient and effective?
How is it determined if multiple solutions to an equation are valid?
How does the context of the problem affect the reasonableness of a solution?
Why can two equations be added together to get another true equation?
Vocabulary Simultaneous equations, intersecting, parallel lines, coefficient, distributive property, like terms, substitution, system of linear equations, substitution, elimination
Grad
e
Clu
ster
Stand
ard
Common Core Standards Explanations & Examples Comments
8 EE.C
8 C. Analyze and solve linear equations and pairs of simultaneous linear equations
Analyze and solve pairs of simultaneous linear equations.
a. Understand that solutions to a system of two linear equations in two variables correspond to points of intersection of their graphs, because points of intersection satisfy both equations simultaneously.
b. Solve systems of two linear equations in two variables algebraically, and estimate solutions by graphing the equations. Solve simple cases by inspection. For example, 3x + 2y = 5 and 3x + 2y = 6 have no solution because 3x + 2y cannot simultaneously be 5 and 6.
8.EE.8 Systems of linear equations can also have one solution, infinitely many solutions or no solutions. Students will discover these cases as they graph systems of linear equations and solve them algebraically. Students graph a system of two linear equations, recognizing that the ordered pair for the point of intersection is the x-value that will generate the given y-value for both equations. Students recognize that graphed lines with one point of intersection (different slopes) will have one solution, parallel lines (same slope, different y-intercepts) have no solutions, and lines that are the same (same slope, same y-intercept) will have infinitely many solutions. By making connections between algebraic and graphical solutions and the context of the system of linear equations, students are able to make sense of their solutions. Students need opportunities to work with equations and context that include whole number and/or
Students’ perseverance in solving real-world problems with systems of equations requires that they work with various solution methods and learn to discern when each method is most appropriate (MP.1). As with the previous unit, writing and solving systems require that students make use of structure (MP.7) and attend to precision (MP.6) as students apply

9/25/2013 Page 2 of 24
c. Solve real-world and mathematical problems leading to two linear equations in two variables. For example, given coordinates for two pairs of points, determine whether the line through the first pair of points intersects the line through the second pair.
8.MP.1. Make sense of problems and persevere in solving them. 8.MP.2. Reason abstractly and quantitatively. 8.MP.3. Construct viable arguments and critique the reasoning of others. 8.MP.4. Model with mathematics. 8.MP.5. Use appropriate tools strategically. 8.MP.6. Attend to precision. 8.MP.7. Look for and make use of structure. 8.MP.8. Look for and express regularity in repeated reasoning.
decimals/fractions. Students define variables and create a system of linear equations in two variables Example 1: 1. Plant A and Plant B are on different watering schedules. This affects their rate of growth. Compare the growth of the two plants to determine when their heights will be the same. Solution: Let W = number of weeks Let H = height of the plant after W weeks
2. Based on the coordinates from the table, graph lines to represent each plant. Solution:
3. Write an equation that represents the growth rate of Plant A and Plant B.
properties of operations to transform equations into simpler forms.
9/25/2013 Page 3 of 24
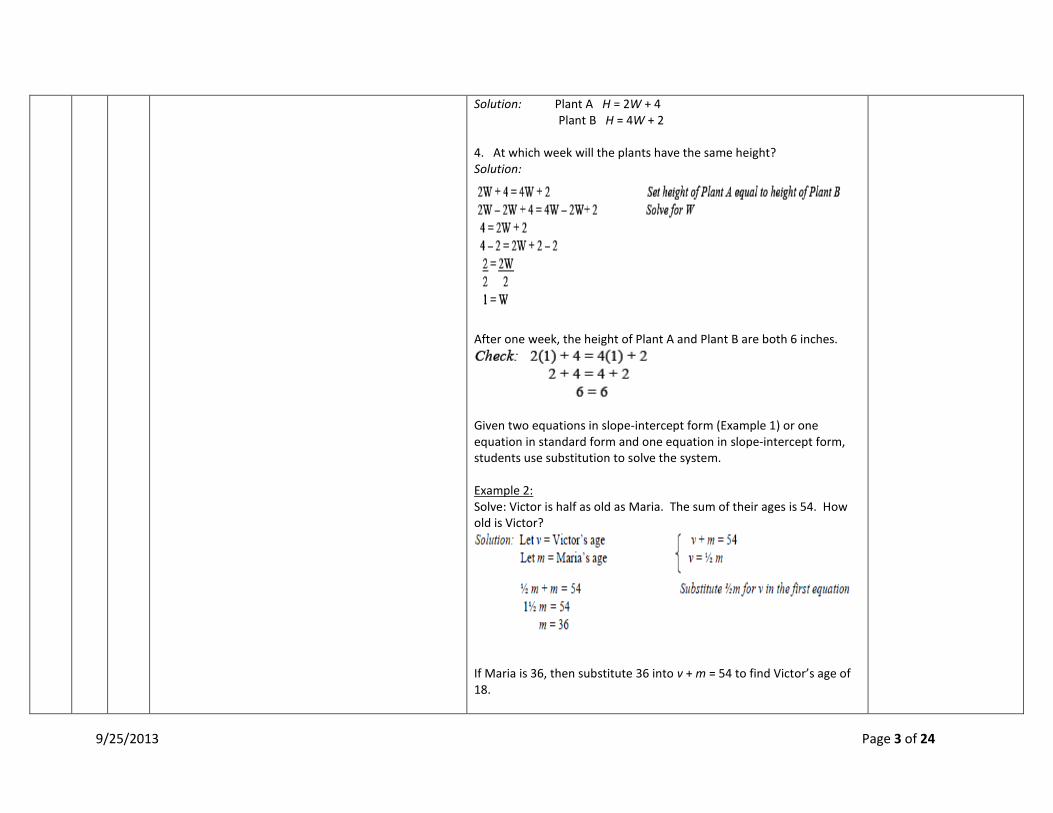
Solution: Plant A H = 2W + 4 Plant B H = 4W + 2 4. At which week will the plants have the same height? Solution:
After one week, the height of Plant A and Plant B are both 6 inches.
Given two equations in slope-intercept form (Example 1) or one equation in standard form and one equation in slope-intercept form, students use substitution to solve the system. Example 2: Solve: Victor is half as old as Maria. The sum of their ages is 54. How old is Victor?
If Maria is 36, then substitute 36 into v + m = 54 to find Victor’s age of 18.

9/25/2013 Page 4 of 24
Note: Students are not expected to change linear equations written in standard form to slope-intercept form or solve systems using elimination. For many real world contexts, equations may be written in standard form. Students are not expected to change the standard form to slope-intercept form. However, students may generate ordered pairs recognizing that the values of the ordered pairs would be solutions for the equation. For example, in the equation above, students could make a list of the possible ages of Victor and Maria that would add to 54. The graph of these ordered pairs would be a line with all the possible ages for Victor and Maria.

9/25/2013 Page 5 of 24
8th Grade Math Third Quarter
Module 5: Examples of Functions from Geometry (15 days) Unit 1: Functions
In this unit, the term function is formally introduced for both linear and non-linear functions. Students model functions in different ways (algebraically, graphically, numerically in tables, or by verbal descriptions) and interpret those representations qualitatively and quantitatively. Patterns are sequences, and sequences are functions with a domain consisting of whole numbers. Students build on previous work with proportional relationships, unit rates and graphing to connect these ideas and understand that the points (x, y) lie on a non-vertical line. Students also formalize their previous work with linear relationships by working with functions as they build on their experiences with graphs and tables. Students will understand that functions describe relationships and will be able to compare and construct a function. The equation y = mx + b will be interpreted as a straight line, where m and b are constants. Students learn to recognize linearity in a table when constant differences between input values produce constant differences between output values, and they can use the constant rate of change and initial value appropriately in a verbal description of a context. Students will establish a routine of exploring functional relationships algebraically, graphically, and numerically in tables and verbal descriptions. When using functions to model a linear relationship between quantities, students learn to determine the rate of change of the function which is the slope of a graph. Students are introduced to functions in the context of linear equations and area/volume formulas in Module 5. They define, evaluate, and compare functions using equations of lines as a source of linear functions and area and volume formulas as a source of nonlinear functions.
Big Idea:
A function is a specific topic of relationship in which each input has a unique output which can be represented in a table.
A function can be represented graphically using ordered pairs that consist of the input and the output of the function in the form (input, output).
A function can be represented with an algebraic rule.
Linear functions may be used to represent and generalize real situations.
Rounded object volume can be calculated with specific formulas.
Pi is necessary when calculating volume of rounded objects.
Essential Questions:
What defines a function and how can it be represented?
What makes a function linear?
How can linear relationships be modeled and used in real-life situations?
How do we determine the volume of rounded objects?
Vocabulary Function, graph of a function, domain, range, linear function, nonlinear function, vertical line test, cylinder, cone, sphere, volume
Grad
e
Clu
ster
Stand
ard
Common Core Standards Explanations & Examples Comments
9/25/2013 Page 6 of 24
8 F.A 1 A. Define, evaluate, and compare functions
Understand that a function is a rule that assigns to each input exactly one output. The graph of a function is the set of ordered pairs consisting of an input and the corresponding output. (Function notation is not required in Grade 8.)
8.MP.2. Reason abstractly and quantitatively. 8.MP.6. Attend to precision.
Students understand rules that take x as input and gives y as output is a function. Functions occur when there is exactly one y-value is associated with any x-value. Using y to represent the output we can represent this function with the equations y = x
2 + 5x + 4. Students are
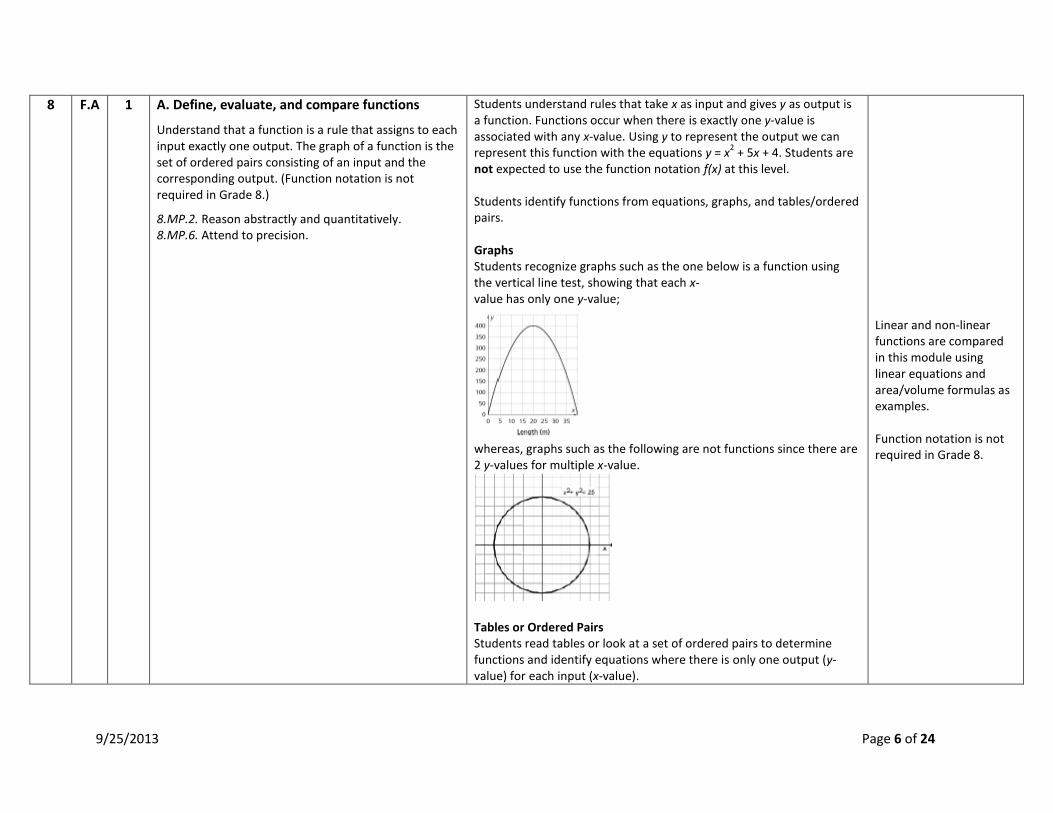
not expected to use the function notation f(x) at this level. Students identify functions from equations, graphs, and tables/ordered pairs. Graphs Students recognize graphs such as the one below is a function using the vertical line test, showing that each x- value has only one y-value;
whereas, graphs such as the following are not functions since there are 2 y-values for multiple x-value.
Tables or Ordered Pairs Students read tables or look at a set of ordered pairs to determine functions and identify equations where there is only one output (y-value) for each input (x-value).
Linear and nonlinear functions are compared in this module using linear equations and area/volume formulas as examples. Function notation is not required in Grade 8.

9/25/2013 Page 7 of 24
Equations Students recognize equations such as y = x or y = x
2 + 3x + 4 as
functions; whereas, equations such as x2 + y
2 = 25 are not functions.
Example: The rule that takes x as input and gives x
2+5x+4 as output is a function.
Using y to stand for the output we can represent this function with the equation y = x
2+5x+4, and the graph of the equation is the graph of the
function. Students are not yet expected use function notation such as f(x) = x
2+5x+4.
8 F.A 2 A.Define, evaluate, and compare functions
Compare properties of two functions each represented in a different way (algebraically, graphically, numerically in tables, or by verbal descriptions). For example, given a linear function represented by a table of values and a linear function represented by an algebraic expression, determine which function has the greater rate of change.
8.MP.1. Make sense of problems and persevere in solving them. 8.MP.2. Reason abstractly and quantitatively. 8.MP.3. Construct viable arguments and critique the reasoning of others. 8.MP.4. Model with mathematics. 8.MP.5. Use appropriate tools strategically. 8.MP.6. Attend to precision.
Students compare two functions from different representations. Example 1: Compare the following functions to determine which has the greater rate of change.
Solution: The rate of change for function 1 is 2; the rate of change for function 2 is 3. Function 2 has the greater rate of change.

9/25/2013 Page 8 of 24
8.MP.7. Look for and make use of structure. 8.MP.8. Look for and express regularity in repeated reasoning.
Example 2: Compare the two linear functions listed below and determine which has a negative slope. Function 1: Gift Card Samantha starts with $20 on a gift card for the bookstore. She spends $3.50 per week to buy a magazine. Let y be the amount remaining as a function of the number of weeks, x.
Function 2: Calculator rental The school bookstore rents graphing calculators for $5 per month. It also collects a non-refundable fee of $10.00 for the school year. Write the rule for the total cost (c) of renting a calculator as a function of the number of months (m). c = 10 + 5m Solution: Function 1 is an example of a function whose graph has a negative slope. Both functions have a positive starting amount; however, in function 1, the amount decreases 3.50 each week, while in function 2, the amount increases 5.00 each month. NOTE: Functions could be expressed in standard form. However, the intent is not to change from standard form to slope-intercept form but to use the standard form to generate ordered pairs. Substituting a zero (0) for x and y will generate two ordered pairs. From these ordered pairs, the slope could be determined.
9/25/2013 Page 9 of 24
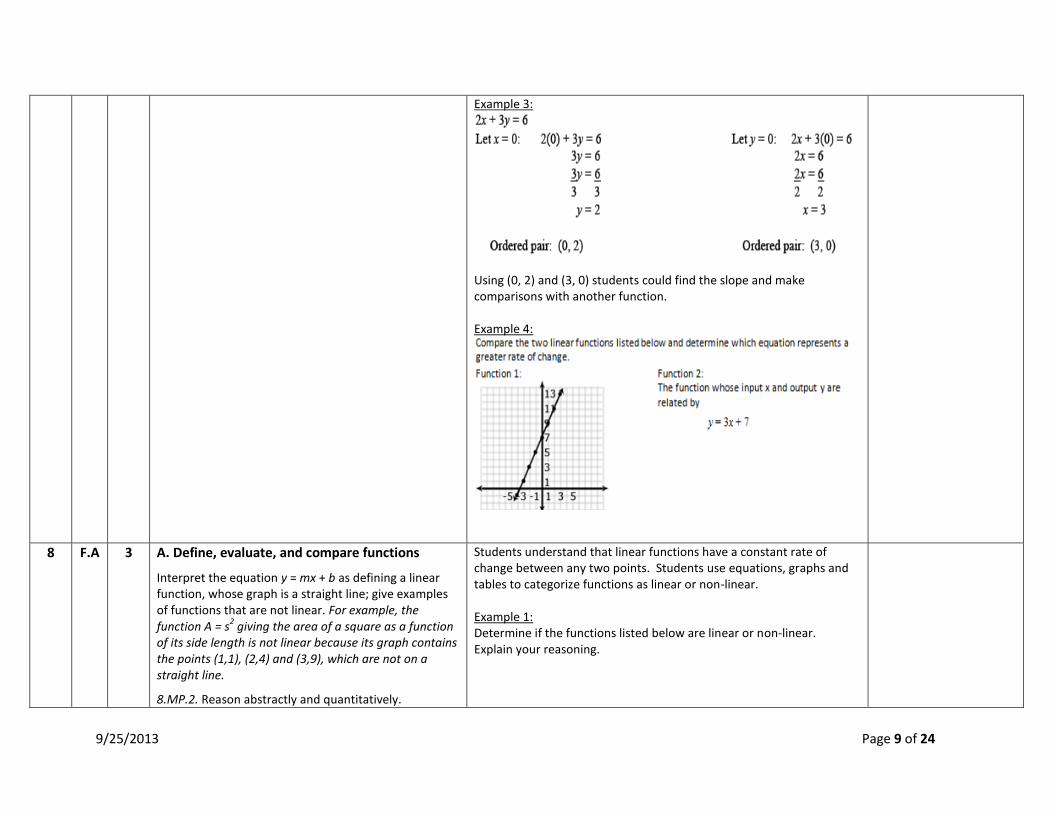
Example 3:
Using (0, 2) and (3, 0) students could find the slope and make comparisons with another function. Example 4:
8 F.A 3 A. Define, evaluate, and compare functions
Interpret the equation y = mx + b as defining a linear function, whose graph is a straight line; give examples of functions that are not linear. For example, the function A = s
2 giving the area of a square as a function
of its side length is not linear because its graph contains the points (1,1), (2,4) and (3,9), which are not on a straight line.
8.MP.2. Reason abstractly and quantitatively.
Students understand that linear functions have a constant rate of change between any two points. Students use equations, graphs and tables to categorize functions as linear or non-linear. Example 1: Determine if the functions listed below are linear or non-linear. Explain your reasoning.

9/25/2013 Page 10 of 24
8.MP.4. Model with mathematics. 8.MP.5. Use appropriate tools strategically. 8.MP.6. Attend to precision. 8.MP.7. Look for and make use of structure.
Solution: 1. Non-linear 2. Linear 3. Non-linear 4. Non-linear; there is not a constant rate of change 5. Non-linear; the graph curves indicating the rate of change is not constant.
8 G.C 9 C. Solve real-world and mathematical problems involving volume of cylinders, cones, and spheres
Know the formulas for the volumes of cones, cylinders, and spheres and use them to solve real-world and mathematical problems.
Students build on understandings of circles and volume of cylinders, finding the area of the base and multiplying by the number of layers (the height).
Solutions that introduce irrational numbers are not introduced until Module 7.

9/25/2013 Page 11 of 24
8.MP.1. Make sense of problems and persevere in solving them. 8.MP.2. Reason abstractly and quantitatively. 8.MP.3. Construct viable arguments and critique the reasoning of others. 8.MP.4. Model with mathematics. 8.MP.5. Use appropriate tools strategically. 8.MP.6. Attend to precision. 8.MP.7. Look for and make use of structure. 8.MP.8. Look for and express regularity in repeated reasoning
Students understand that the volume of a cylinder is 3 times the volume of a cone having the same base area and height or that the volume of a cone is 1/3 the volume of a cylinder having the same base area and height.
A sphere can be enclosed with a cylinder, which has the same radius and height of the sphere (Note: the height of the cylinder is twice the radius of the sphere). If the sphere is flattened, it will fill 2/3 of the cylinder. Based on this model, students understand that the volume of a sphere is 2/3 the volume of a cylinder with the same radius and height. The height of the cylinder is the same as the diameter of the sphere or 2 Using this information, the formula for the volume of the sphere can be derived in the following way:
Students find the volume of cylinders, cones and spheres to solve real world and mathematical problems. Answers could also be given in

9/25/2013 Page 12 of 24
terms of Pi. Example 1: James wanted to plant pansies in his new planter. He wondered how much potting soil he should buy to fill it. Use the measurements in the diagram below to determine the planter’s volume.
Example 2: How much yogurt is needed to fill the cone below? Express your answers in terms of Pi.

9/25/2013 Page 13 of 24
Example 3: Approximately, how much air would be needed to fill a soccer ball with a radius of 14 cm?
“Know the formula” does not mean memorization of the formula. To “know” means to have an understanding of why the formula works and how the formula relates to the measure (volume) and the figure. This understanding should be for all students. Note: At this level composite shapes will not be used and only volume will be calculated.

9/25/2013 Page 14 of 24
8th Grade Math Third Quarter
Module 6: Linear Functions (20 days) Unit 11: Patterns of Association in Bivariate Data
In Module 6, students return to linear functions in the context of statistics and probability as bivariate data provides support in the use of linear functions. In this unit, students will investigate bivariate categorical and numerical data. The work with categorical data connects with students’ prior work with proportional relationships and rational numbers; the work with numerical data builds on students’ learning from earlier units around linear functions and modeling. In Grade 7, students studied numerical measures of center and spread and terms such as cluster, peak, gap, symmetry, skew, and outlier. Earlier grades view statistical reasoning as a four-step process, which included formulating the question, designing a plan to collect data, analyzing the data, and interpreting the results. Then students moved into producing data including the need of an efficient plan for collecting data and understanding what qualifies as a reasonable answer. Students also learned probability and mean absolute deviation. The Grade 8 discussions of slope and y-intercept will directly impact the study of the line of best fit. Students will apply experience with coordinate planes and linear functions in the study of association between two variables related to a question of interest. They will analyze bivariate measurements on a scatter plot describing shape, center, and spread. The shape is a description of the cloud of points on a plane, the center is the line of best fit, and the spread is how far data points are from the line.
Big Idea:
Written descriptions, tables, graphs, and equations are useful in representing and investigating relationships between varying quantities.
Different representations (written descriptions, tables, graphs, and equations) of the relationships between varying quantities may have different strengths and weaknesses.
Linear functions may be used to represent and generalize real situations.
Slope and y-intercept are keys to solving real problems involving linear relationship models of data.
Some data may be misleading based on representation.
Essential Questions:
What relationships can be seen in bivariate data?
What conclusions can be drawn from data displayed on a graph?
What do the slope and -intercept of a line of best fit signify on a graph?
How can graphs, tables, or equations be used to predict data?
Vocabulary Bivariate data, scatter plot, line of best fit, clustering, outlier, positive/negative correlation
Grad
e
Clu
ster
Stand
ard
Common Core Standards Explanations & Examples Comments
8 F.B 4 B. Use functions to model relationships between quantities
Construct a function to model a linear relationship
Students identify the rate of change (slope) and initial value (y-intercept) from tables, graphs, equations or verbal descriptions to write a function (linear equation). Students understand that the equation represents the relationship between the x-value and the y-

9/25/2013 Page 15 of 24
between two quantities. Determine the rate of change and initial value of the function from a description of a relationship or from two (x, y) values, including reading these from a table or from a graph. Interpret the rate of change and initial value of a linear function in terms of the situation it models, and in terms of its graph or a table of values.
8.MP.1. Make sense of problems and persevere in solving them. 8.MP.2. Reason abstractly and quantitatively. 8.MP.3. Construct viable arguments and critique the reasoning of others. 8.MP.4. Model with mathematics. 8.MP.5. Use appropriate tools strategically. 8.MP.6. Attend to precision. 8.MP.7. Look for and make use of structure. 8.MP.8. Look for and express regularity in repeated reasoning.
value; what math operations are performed with the x-value to give the y-value. Slopes could be undefined slopes or zero slopes. Tables: Students recognize that in a table the y-intercept is the y-value when x is equal to 0. The slope can be determined by finding the ratio y/x between the change in two y-values and the change between the two corresponding x-values. Example 1: Write an equation that models the linear relationship in the table below.
Solution: The y-intercept in the table below would be (0, 2). The distance between 8 and -1 is 9 in a negative direction (-9); the distance between -2 and 1 is 3 in a positive direction. The slope is the ratio of rise to run or y/x or −9/3 = -3. The equation would be y = -3x + 2 Graphs: Using graphs, students identify the y-intercept as the point where the line crosses the y-axis and the slope as the rise/run. Example 2: Write an equation that models the linear relationship in the graph below.

9/25/2013 Page 16 of 24
Equations: In a linear equation the coefficient of x is the slope and the constant is the y-intercept. Students need to be given the equations in formats other than y = mx + b, such as y = ax + b (format from graphing calculator), y = b + mx (often the format from contextual situations), etc. Point and Slope: Students write equations to model lines that pass through a given point with the given slope. Example 2: A line has a zero slope and passes through the point (-5, 4). What is the equation of the line? Solution: y = 4 Example 3: Write an equation for the line that has a slope of ½ and passes though the point (-2, 5) Solution: y = ½ x + 6 Students could multiply the slope ½ by the x-coordinate -2 to get -1. Six (6) would need to be added to get to 5, which gives the linear equation. Students also write equations given two ordered pairs. Note that

9/25/2013 Page 17 of 24
point-slope form is not an expectation at this level. Students use the slope and y-intercepts to write a linear function in the form y = mx +b. Contextual Situations: In contextual situations, the y-intercept is generally the starting value or the value in the situation when the independent variable is 0. The slope is the rate of change that occurs in the problem. Rates of change can often occur over years. In these situations it is helpful for the years to be “converted” to 0, 1, 2, etc. For example, the years of 1960, 1970, and 1980 could be represented as 0 (for 1960), 10 (for 1970) and 20 (for 1980). Example 4: The company charges $45 a day for the car as well as charging a one-time $25 fee for the car’s navigation system (GPS). Write an expression for the cost in dollars, c, as a function of the number of days, d, the car was rented. Solution: C = 45d + 25 Students might write the equation c = 45d + 25 using the verbal description or by first making a table.
Days (d) Cost (c) in dollars
1 70
2 115
3 160
4 205
Students interpret the rate of change and the y-intercept in the context of the problem. In Example 3, the rate of change is 45 (the cost of renting the car) and that initial cost (the first day charge) also includes paying for the navigation system. Classroom discussion about one-time fees vs. recurrent fees will help students model contextual situations. Example 5: When scuba divers come back to the surface of the water, they need to be careful not to ascend too quickly. Divers should not come to the

9/25/2013 Page 18 of 24
surface more quickly than a rate of 0.75 ft per second. If the divers start at a depth of 100 feet, the equation d = 0.75t – 100 shows the relationship between the time of the ascent in seconds (t) and the distance from the surface in feet (d).
o Will they be at the surface in 5 minutes? How long will it take the divers to surface from their dive?
o Make a table of values showing several times and the corresponding distance of the divers from the surface. Explain what your table shows. How do the values in the table relate to your equation?
8 F.B 5 B. Use functions to model relationships between quantities
Describe qualitatively the functional relationship between two quantities by analyzing a graph (e.g., where the function is increasing or decreasing, linear or nonlinear). Sketch a graph that exhibits the qualitative features of a function that has been described verbally.
8.MP.2. Reason abstractly and quantitatively. 8.MP.3. Construct viable arguments and critique the reasoning of others. 8.MP.4. Model with mathematics. 8.MP.5. Use appropriate tools strategically. 8.MP.6. Attend to precision. 8.MP.7. Look for and make use of structure.
Given a verbal description of a situation, students sketch a graph to model that situation. Given a graph of a situation, students provide a verbal description of the situation. Example 1: The graph below shows a John’s trip to school. He walks to his Sam’s house and, together, they ride a bus to school. The bus stops once before arriving at school. Describe how each part A – E of the graph relates to the story.
Solution: A John is walking to Sam’s house at a constant rate. B John gets to Sam’s house and is waiting for the bus. C John and Sam are riding the bus to school. The bus is moving at a constant rate, faster than John’s walking rate. D The bus stops.

9/25/2013 Page 19 of 24
E The bus resumes at the same rate as in part C. Example 2: Describe the graph of the function between x = 2 and x = 5?
8 SP.A
1 A. Investigate patterns of association in bivariate data
Construct and interpret scatter plots for bivariate measurement data to investigate patterns of association between two quantities. Describe patterns such as clustering, outliers, positive or negative association, linear association, and nonlinear association.
8.MP.2. Reason abstractly and quantitatively. 8.MP.4. Model with mathematics. 8.MP.5. Use appropriate tools strategically. 8.MP.6. Attend to precision. 8.MP.7. Look for and make use of structure.
Bivariate data refers to two-variable data, one to be graphed on the x-axis and the other on the y-axis. Students represent numerical data on a scatter plot, to examine relationships between variables. They analyze scatter plots to determine if the relationship is linear (positive, negative association or no association) or non- linear. Students can use tools such as those at the National Center for Educational Statistics to create a graph or generate data sets. (http://nces.ed.gov/nceskids/createagraph/default.aspx) Data can be expressed in years. In these situations it is helpful for the years to be “converted” to 0, 1, 2, etc. For example, the years of 1960, 1970, and 1980 could be represented as 0 (for 1960), 10 (for 1970) and 20 (for 1980). Example 1: Data for 10 students’ Math and Science scores are provided in the chart. Describe the association between the Math and Science scores.
Solution: This data has a positive association. Example 2: Data for 10 students’ Math scores and the distance they live from
8.SP standards are used as applications to the work done with 8.F standards.

9/25/2013 Page 20 of 24
school are provided in the table below. Describe the association between the Math scores and the distance they live from school.
Solution: There is no association between the math score and the distance a student lives from school. Example 3: Data from a local fast food restaurant is provided showing the number of staff members and the average time for filling an order are provided in the table below. Describe the association between the number of staff and the average time for filling an order.
Solution: There is a positive association. Example 4: The chart below lists the life expectancy in years for people in the United States every five years from 1970 to 2005. What would you expect the life expectancy of a person in the United States to be in 2010, 2015, and 2020 based upon this data? Explain how you determined your values.
Solution: There is a positive association. Students recognize that points may be away from the other points (outliers) and have an effect on the linear model. NOTE: Use of the formula to identify outliers is not expected at this level.

9/25/2013 Page 21 of 24
Students recognize that not all data will have a linear association. Some associations will be non-linear as in the example below:
8 SP.A
2 A. Investigate patterns of association in bivariate data
Know that straight lines are widely used to model relationships between two quantitative variables. For scatter plots that suggest a linear association, informally fit a straight line, and informally assess the model fit by judging the closeness of the data points to the line.
8.MP.2. Reason abstractly and quantitatively. 8.MP.4. Model with mathematics. 8.MP.5. Use appropriate tools strategically. 8.MP.6. Attend to precision. 8.MP.7. Look for and make use of structure.
Students understand that a straight line can represent a scatter plot with linear association. The most appropriate linear model is the line that comes closest to most data points. The use of linear regression is not expected. If there is a linear relationship, students draw a linear model. Given a linear model, students write an equation. Example: The capacity of the fuel tank in a car is 13.5 gallons. The table below shows the number of miles traveled and how many gallons of gas are left in the tank. Describe the relationship between the variables. If the data is linear, determine a line of best fit. Do you think the line represents a good fit for the data set? Why or why not? What is the average fuel efficiency of the car in miles per gallon?
8 SP.A
3 A. Investigate patterns of association in bivariate data
Linear models can be represented with a linear equation. Students interpret the slope and y-intercept of the line in the context of the problem.

9/25/2013 Page 22 of 24
Use the equation of a linear model to solve problems in the context of bivariate measurement data, interpreting the slope and intercept. For example, in a linear model for a biology experiment, interpret a slope of 1.5 cm/hr as meaning that an additional hour of sunlight each day is associated with an additional 1.5 cm in mature plant height.
8.MP.2. Reason abstractly and quantitatively. 8.MP.4. Model with mathematics. 8.MP.5. Use appropriate tools strategically. 8.MP.6. Attend to precision. 8.MP.7. Look for and make use of structure.
Example 1: 1. Given data from students’ math scores and absences, make a scatterplot.
2. Draw a linear model paying attention to the closeness of the data points on either side of the line.

9/25/2013 Page 23 of 24
3. From the linear model, determine an approximate linear equation that models the given data
4. Students should recognize that 95 represents the y-intercept and -25/3 represents the slope of the line. In the context of the problem, the y-intercept represents the math score a student with 0 absences could expect. The slope indicates that the math scores decreased 25 points for every 3 absences. 5. Students can use this linear model to solve problems. For example, through substitution, they can use the equation to determine that a student with 4 absences should expect to receive a math score of about 62. They can then compare this value to their line.
8 SP.A
4 A. Investigate patterns of association in bivariate data
Understand that patterns of association can also be seen in bivariate categorical data by displaying frequencies and relative frequencies in a two-way table. Construct and interpret a two-way table summarizing data on two categorical variables collected from the same subjects. Use relative frequencies calculated for rows or columns to describe possible association between the two variables. For example,
8.SP.4 Students understand that a two-way table provides a way to organize data between two categorical variables. Data for both categories needs to be collected from each subject. Students calculate the relative frequencies to describe associations. Example 1: Twenty-five students were surveyed and asked if they received an allowance and if they did chores. The table below summarizes their responses.
9/25/2013 Page 24 of 24
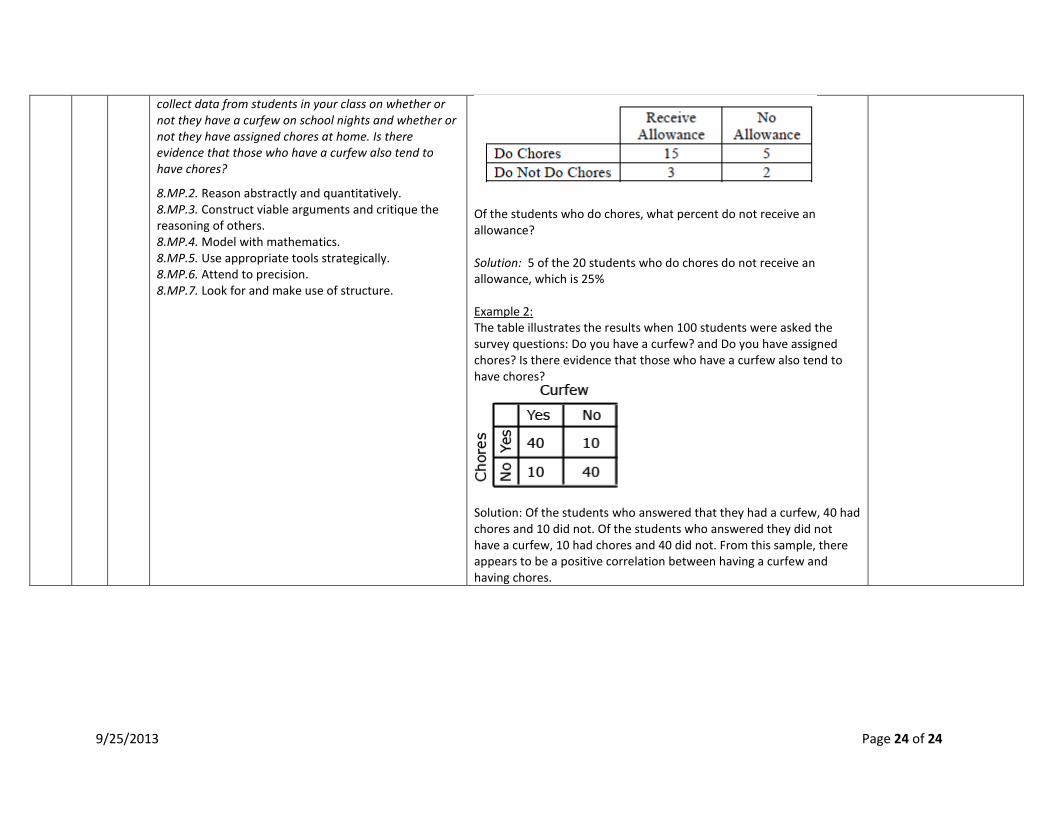
collect data from students in your class on whether or not they have a curfew on school nights and whether or not they have assigned chores at home. Is there evidence that those who have a curfew also tend to have chores?
8.MP.2. Reason abstractly and quantitatively. 8.MP.3. Construct viable arguments and critique the reasoning of others. 8.MP.4. Model with mathematics. 8.MP.5. Use appropriate tools strategically. 8.MP.6. Attend to precision. 8.MP.7. Look for and make use of structure.
Of the students who do chores, what percent do not receive an allowance? Solution: 5 of the 20 students who do chores do not receive an allowance, which is 25% Example 2: The table illustrates the results when 100 students were asked the survey questions: Do you have a curfew? and Do you have assigned chores? Is there evidence that those who have a curfew also tend to have chores?
Solution: Of the students who answered that they had a curfew, 40 had chores and 10 did not. Of the students who answered they did not have a curfew, 10 had chores and 40 did not. From this sample, there appears to be a positive correlation between having a curfew and having chores.