
8 EUROPE’S HYDROPOWER POTENTIAL TODAY … · EuroWasser: Europe’s hydropower potential today...
22
EuroWasser: Europe’s hydropower potential today and in the future 8-1 8 EUROPE’S HYDROPOWER POTENTIAL TODAY AND IN THE FUTURE Bernhard Lehner #* , Gregor Czisch + , Sara Vassolo # # Center for Environmental Systems Research, University of Kassel, Germany + Institut für Solare Energieversorgungstechnik (ISET), Kassel, Germany * [email protected] 8.1 Introduction Today, electricity generation from hydropower makes a substantial contribution to meeting the increasing world electricity demands. In the mid 1990s hydropower plants accounted for some 19% (or approx. 2500 TWh/a) of total electricity production worldwide. The installed capacity amounted to 22% (or approx. 700 GW) of the total installed capacity for electricity generation (European Commission, 2000; IEA, 1999; Voigtländer and Gattinger, 1999; EIA, 1998; DOE, 1996; figures vary slightly by authors). The situation within Europe, although locally differentiated, is also generally in the same relative order of magnitude. The role of hydropower, along with other renewable energy sources, is expected to become increasingly important in future. World production of hydroelectricity has grown steadily by about 2.3% per year on average since 1980 (European Commission, 2000; increase in total electricity production 3.1% per year). Worldwide average growth rates of hydroelectricity generation in the future are estimated from about 2.4% (Voigtländer and Gattinger, 1999) to 3.6% (Eurelectric, 1997a) per year between 1990 and 2010 or 2020, respectively. The highest growth rates are expected in developing or strongly industrializing countries with high, yet unexploited hydropower potential, e.g. parts of Eastern Europe, while for Western Europe only a 1% annual increase is assumed (Voigtländer and Gattinger, 1999). In contrast to the arguments above, there are indications that since the 1970s annual energy production of some existing hydropower stations in Europe has decreased, in particular in Portugal, Spain and other Southern European countries (UCTE, 1999). This reduction has been attributed to changes in average discharge; but whether this is due to temporary fluctuations or already the consequences of long-term changing climate conditions is not yet known. However, given the importance of hydropower, and anticipating the scenarios of increasing water stress combined with prolonged low flow periods for some parts of Europe, as described in Chapters 5 and 7 of this report, the assessment of climate change impacts on discharge and the linked hydroelectricity production is of high interest. This study aims to provide an overview of today’s hydropower potential for electricity generation in Europe and its future prospects. Knowledge from natural and social sciences and engineering are combined in an integrated assessment by applying the global integrated water model WaterGAP. The approach of this study is twofold: First, we try to analyze the gross hydropower potential (i.e. the potential if all runoff at all locations were to be
Transcript of 8 EUROPE’S HYDROPOWER POTENTIAL TODAY … · EuroWasser: Europe’s hydropower potential today...

EuroWasser: Europe’s hydropower potential today and in the future 8-1
8 EUROPE’S HYDROPOWER POTENTIAL TODAY AND IN THE FUTURE
Bernhard Lehner#*, Gregor Czisch+, Sara Vassolo# #Center for Environmental Systems Research, University of Kassel, Germany +Institut für Solare Energieversorgungstechnik (ISET), Kassel, Germany *[email protected] 8.1 Introduction
Today, electricity generation from hydropower makes a substantial contribution to meeting the increasing world electricity demands. In the mid 1990s hydropower plants accounted for some 19% (or approx. 2500 TWh/a) of total electricity production worldwide. The installed capacity amounted to 22% (or approx. 700 GW) of the total installed capacity for electricity generation (European Commission, 2000; IEA, 1999; Voigtländer and Gattinger, 1999; EIA, 1998; DOE, 1996; figures vary slightly by authors). The situation within Europe, although locally differentiated, is also generally in the same relative order of magnitude.
The role of hydropower, along with other renewable energy sources, is expected to become increasingly important in future. World production of hydroelectricity has grown steadily by about 2.3% per year on average since 1980 (European Commission, 2000; increase in total electricity production 3.1% per year). Worldwide average growth rates of hydroelectricity generation in the future are estimated from about 2.4% (Voigtländer and Gattinger, 1999) to 3.6% (Eurelectric, 1997a) per year between 1990 and 2010 or 2020, respectively. The highest growth rates are expected in developing or strongly industrializing countries with high, yet unexploited hydropower potential, e.g. parts of Eastern Europe, while for Western Europe only a 1% annual increase is assumed (Voigtländer and Gattinger, 1999).
In contrast to the arguments above, there are indications that since the 1970s annual energy production of some existing hydropower stations in Europe has decreased, in particular in Portugal, Spain and other Southern European countries (UCTE, 1999). This reduction has been attributed to changes in average discharge; but whether this is due to temporary fluctuations or already the consequences of long-term changing climate conditions is not yet known. However, given the importance of hydropower, and anticipating the scenarios of increasing water stress combined with prolonged low flow periods for some parts of Europe, as described in Chapters 5 and 7 of this report, the assessment of climate change impacts on discharge and the linked hydroelectricity production is of high interest.
This study aims to provide an overview of today’s hydropower potential for electricity generation in Europe and its future prospects. Knowledge from natural and social sciences and engineering are combined in an integrated assessment by applying the global integrated water model WaterGAP. The approach of this study is twofold: First, we try to analyze the gross hydropower potential (i.e. the potential if all runoff at all locations were to be

EuroWasser: Europe’s hydropower potential today and in the future 8-2
transformed into energy) as a general indicator. Second, we focus on the developed hydropower potential of existing power plants in order to get a closer and more realistic view.
The primary goal of both approaches is not to provide quantitative results in terms of absolute capacities or electricity production. Rather we aim to analyze the following question: In which European countries can we expect a significant increase or decrease of the potential to generate hydroelectricity due to climate change? In order to answer this question, we develop a spatially consistent methodology to arrive at comparable results throughout the whole of Europe.
8.2 General overview of hydropower utilization in Europe
Besides the fact that hydropower currently makes up a substantial share of the total amount of electricity generated, the arguments for continued and increased utilization of hydropower are based on its advantages when compared to other sources of energy (see Appendix 8.1). The key positive characteristics of hydroelectricity can be summarized as being a low-cost, effective, sustainable and renewable energy resource which can be stored in large quantities and which plays a major role in power system management (Eurelectric, 1997a, c). However, it should be noted that hydropower projects have also been known for their negative effects concerning environmental and social issues (Appendix 8.1).
8.2.1 Classification of hydroelectric power stations
Hydroelectric power stations can be classified according to the way they make use of the inflow that they receive, depending on whether this cumulative flow must be used within a short period of time or whether it can be retained for a certain time period (UCTE, 2000). The classification applied in this study distinguishes between run-of-river stations, pondage and reservoir stations, and pumped stations (for definitions see Appendix 8.2). Based on the operational mode, the stations are further grouped into run-of-river and reservoir (pondage, reservoir and pumped) stations only. Run-of-river stations show fluctuations in energy production induced by low flow or overflow periods, whereas reservoir stations can store water (i.e. energy) over long time periods and generate a steady supply of electricity, relatively independent from variations in short-term inflows.
8.2.2 Today’s hydropower utilization in Europe
Table 8.1 provides an overview of today’s hydropower utilization in Europe. The share of hydropower within the total electricity generation varies considerably between countries, ranging from negligible to 99%. The composition of types of hydropower stations installed for energy production is also not equal. These differences in countries and categories reflect both geographic and climatic constraints or suitability as well as, to some degree, political guidelines in operation.

EuroWasser: Europe’s hydropower potential today and in the future 8-3
Installed capacity for generation of hydroelectricity2 Annual generation
of hydroelectricity1 in total by category
Table 8.1: Today’s hydropower utilization in Europe.
Ener
gy U
nion
TWh
% of total electricity
generation
GW
% of total capacity for electricity
generation3
Run-of-river, incl. pondage
GW
Reservoir and mixed pumped
GW
Pure pumped storage
GW
Austria 42.2 78.0 10.9 67.7 5.5 5.4 0.0 Belgium 1.7 2.1 1.4 8.9 0.1 0.0 1.3 Croatia 5.8 59.0 2.0 57.0 n.a. n.a. n.a. France 66.9 13.3 24.3 22.1 10.8 11.6 1.9 Germany 23.6 4.8 8.3 8.3 2.7 1.4 4.2 Greece 4.1 9.0 3.0 32.9 0.7 2.3 0.0 Italy 50.3 19.2 19.8 27.5 8.2 7.4 4.2 Luxembourg 0.9 77.1 1.1 93.2 0.0 0.0 1.1 The Netherlands 0.0 0.0 0.0 0.0 0.0 0.0 0.0 Portugal 11.6 30.9 4.2 45.5 2.1 2.1 0.0 Slovenia 3.5 28.0 0.8 32.1 n.a. n.a. n.a. Spain 31.4 16.1 16.3 35.4 6.1 7.7 2.5 Switzerland 37.8 57.9 13.8 77.2 4.0 9.5 0.3 Yugoslavia, Macedonia, Bosnia-Herzegovina
UC
TE
13.2 32.0 4.6 36.6 1.9 2.0 0.7
Czech Republic 2.3 3.4 2.0 14.3 0.2 0.7 1.1 Hungary 0.2 0.5 0.1 0.7 0.1 0.0 0.0 Poland 4.0 2.8 2.0 6.4 0.4 1.4 0.2 Slovakia C
ENTR
EL
5.0 17.5 2.4 35.1 0.8 0.9 0.7
Denmark 0.0 0.1 0.0 0.1 n.a. n.a. n.a. Finland 12.6 18.9 2.9 17.8 n.a. n.a. n.a. Iceland 6.0 84.1 1.0 77.8 n.a. n.a. n.a. Norway 122.1 99.4 27.6 98.9 n.a. n.a. n.a. Sweden
NO
RD
EL
70.4 46.8 16.2 48.5 n.a. n.a. n.a.
Albania 5 96 n.a. n.a. n.a. n.a. n.a. Belarus 0 0 0 0 n.a. n.a. n.a. Bulgaria 3 9 2 17 n.a. n.a. n.a. Cyprus 0 0 n.a. n.a. n.a. n.a. n.a. Estonia 0 0 0 0 n.a. n.a. n.a. Ireland 1 5 0 0 n.a. n.a. n.a. Latvia 4 77 n.a. n.a. n.a. n.a. n.a. Lithuania 1 3 0 0 n.a. n.a. n.a. Malta 0 0 n.a. n.a. n.a. n.a. n.a. Moldova 0 7 n.a. n.a. n.a. n.a. n.a. Romania 19 37 6 27 n.a. n.a. n.a. Russian Federation (Europe and Asia) 158 20 44 22 n.a. n.a. n.a. Turkey 42 39 10 44 n.a. n.a. n.a. Ukraine 16 10 5 9 n.a. n.a. n.a. United Kingdom
othe
rs
5 2 1 1 n.a. n.a. n.a.
1 data sources: UCTE and CENTREL: UCTE 2001 (values of 2000); NORDEL: NORDEL 2000 (values of 1999); others: EIA 1999 (values of 1998)
2 data sources: UCTE and CENTREL: UCTE 2000 (values of 31.12.1998); NORDEL: NORDEL 2000 (values of 31.12.1999); others: EIA 1999 (values of 01.01.1999)
3 data source for UCTE and CENTREL: UCTE 2000 (values of 31.12.1999), NORDEL and others as in 2 n.a.: no data available note: for values of EIA 1999 it is not defined whether data includes pumped storage
8.2.3 Perspectives of hydropower development independent from climate change
When assessing the future of hydropower utilization in Europe, two basic influencing factors must be distinguished: (i) a change in exploitable river flow, mainly induced by climate change, and (ii) a change in the existing hydropower park of the individual countries. This study will investigate the first factor only. However, the latter, being dominated by political and economical decisions, will also have a major impact on the future changes of hydropower

EuroWasser: Europe’s hydropower potential today and in the future 8-4
potentials. Therefore, although it is difficult to assess, a brief overview of expected developments in the hydropower facilities is provided here, in order to allow for the reader to put the further investigated impact of climate change into perspective.
Looking at the future, in Eastern Europe and the former Soviet Union most of the development of hydroelectricity in the short to mid-term is expected to occur as expansion or refurbishment of existing hydroelectric plants (EIA, 2000), as the persistent economic problems interfere with the construction of new plants.
In East-Central Europe, hydroelectricity already represents a substantial source of power in some countries such as Albania (96% of total electricity generation), Croatia (59%) or Romania (37%). Most of the potential for future hydropower expansion lies in Albania, Bulgaria and Romania, as well as in the former Yugoslav republics. But despite a very large potential for future expansion, as yet, these countries have found it difficult to secure financing for such projects (European Commission, 2000).
The Nordic European countries generally show good suitability for hydroelectricity production, both from geographic and climatic aspects, and already have high shares of hydropower forming part of their energy supply. However, in the case of Sweden, for example, there is no scheme for building new large hydropower plants, as proposals for this meet strong opposition. Only old units are refurbished and some new small units are installed. Consequently, no major additions to the current production capacity are expected (UNIPEDE, 1998). Also for Norway, only small increases of the cumulative volume of power stations are expected (Lovseth, 1995).
In Western Europe most of the region’s hydroelectric resources have already been developed (EIA, 2000). In some cases, however (e.g. Italy) there is evidence of some power plants being constructed or planned in the near future (Eurelectric, 1997b).
All in all, due to political and economical reasons the prediction of the future development of Europe’s hydropower park is difficult. Nevertheless, whatever changes are expected by the various authors, there is clear agreement that a dismantling of the existing plants is unlikely, but rather that they will continue to operate and perhaps their number and capacities will be increased.
8.3 General methodology
8.3.1 Types of hydropower potentials
Numerous attempts have been made to assess the hydropower potential of countries, continents and the world, its present use and the future prospects for its utilization. But the results of these surveys reveal striking inconsistencies (Eurelectric, 1997a). Partly, the discrepancies are attributed to differing or inaccurate information or, in some regions, a general lack of data. Partly, ambiguous definitions of energy terms have been deemed

EuroWasser: Europe’s hydropower potential today and in the future 8-5
responsible. In order to prevent such confusion, in this study we focus on just two types of hydropower potentials, the gross hydropower potential (Section 8.4) and the developed hydropower potential (Section 8.5).
According to Eurelectric (1997a), the gross hydropower potential is defined as the annual energy that is potentially available if all natural runoff at all locations were to be harnessed down to the sea level (or to the border line of a country) without any energy losses. The share of this highly theoretical potential which has been or could be developed under current technology, regardless of economic and other restrictions, forms the technical hydropower potential. From this, the economic hydropower potential is the portion, which can or has been developed at costs competitive with other energy sources. Finally, the exploitable hydropower potential takes into account environmental or other special restrictions. For comparison of magnitudes, Eurelectric (1997a) estimates the world’s gross hydropower potential at 51 000 TWh/a, the economic hydropower potential at 13 100 TWh/a, and the exploitable hydropower potential at 10 500 TWh/a. While the gross hydropower potential can be directly calculated applying the results of the WaterGAP model, the estimation of the other three types of hydropower potentials requires additional definitions, data and information which are not available within this study.
The gross hydropower potential gives a first impression of Europe’s total resources of hydropower. However, it is just a theoretical value, only a small part of which is actually developed at existing power stations. Hence the impact of climate change on the gross hydropower potential will provide an indication of the general trends, but this cannot be directly interpreted as a proportional change in actual hydroelectricity production. For example, a decrease of discharges in a part of Europe with no hydropower stations will not alter the existing hydroelectricity production; thus it is important for a comprehensive assessment to know where the hydropower stations are located.
In a second step, we therefore focus on the developed hydropower potential of existing hydropower stations (synonymous for actually supplied electricity by hydropower or mean annual energy capability). With some 2240 TWh/a, the developed global hydropower potential in 1990 accounted for about 21% of the world’s estimated exploitable hydropower potential, or about 4% of the world’s gross hydropower potential. As for Europe, from the estimated exploitable hydropower potential of 1670 TWh/a only 745 TWh/a were actually supplied by hydropower in 1990, and some 1080 TWh/a are expected to be available in 2020 (Eurelectric, 1997a).
8.3.2 The WaterGAP 2.1 model
For the studies presented within this chapter, the global integrated water model WaterGAP is applied in its version 2.1. A detailed model description is provided in Chapter 2 of this report. Here, only the aspects most relevant for hydropower calculations are highlighted:

EuroWasser: Europe’s hydropower potential today and in the future 8-6
Water use. All calculations carried out within this hydropower study are performed applying the water use simulations of WaterGAP 2.1 as introduced in Chapters 2 (today) and 4 (Baseline-A scenario). Actual river discharge is thus derived as natural discharge minus consumptive water use.
Land cover. Although in principle WaterGAP is able to take into account the impact of changing land cover on runoff generation via its direct or indirect effect on root depth, albedo, soil moisture and interception, all following discharge calculations are performed without a change in land cover or land use. This is mainly due to the absence of realistic, reliable macroscale land use change scenarios, which are expected to be available at a later stage. For the interpretation of the results, this simplification has to be considered.
Lakes and reservoirs. For discharge calculations, WaterGAP 2.1 explicitly considers lakes and reservoirs. However, the global wetlands, lakes and reservoirs map developed for this purpose (Lehner and Döll, 2001) only distinguishes large reservoirs (reservoir volume > 1 km3, all other possible reservoirs are defined to be lakes). Furthermore, it is not known to what extent or in what operational mode these reservoirs are applied for hydroelectricity generation. Hence, in order to estimate the developed hydropower potentials, additional data sets with more comprehensive information on even small scale hydropower plants had to be assessed (see Appendix 8.4 and Section 8.5).
Evaluation of WaterGAP. The WaterGAP 2.1 model has been evaluated with regard to different aspects (see Chapters 2, 3, 6 and 7). As a general finding, WaterGAP shows increasing uncertainties the shorter the time steps and the smaller the areas under investigation. However, it proves to deliver reliable results when looking at long-term average discharges and larger basins, which are the basis of the following calculations. Therefore the quality of WaterGAP’s discharge calculations is considered to be acceptable for the hydropower assessment and no additional evaluation is performed.
8.4 Gross hydropower potential
8.4.1 Methodology
The gross hydropower potential GP is defined as
GP = m · g · h (8.1)
m: Mass of runoff g: Gravitational acceleration h: Height (elevation above sea level)
In order to calculate Europe’s gross hydropower potential, the potential of each single 0.5° grid cell of the WaterGAP model has to be derived. Basically, two methods can be applied:
EuroWasser: Europe’s hydropower potential today and in the future 8-7
A) The total gross hydropower potential down to sea level is assigned to each cell (Figure 8.1A). According to Equation 8.1, 1 m3 of runoff generated at an elevation of 1000 m above sea level represents 9.8 MJ of potential energy, or 2.8 KWh, regardless of whether this potential can be harnessed within the cell or not.
B) Only that portion of the gross hydropower potential that can be locally utilized down to the next downstream cell (Figure 8.1B) is allocated to each cell. For this type of energy calculation both the runoff generated within the cell and the inflowing discharge from upstream cells must be locally accounted for. They are accordingly referred to differences in elevation both within the cell and to the next downstream cell.
The standard approach of method A mainly describes where the hydropower potential is formed, but does not indicate where the potential can actually be utilized. Despite this limitation, the approach is still adequate when looking for total sums, e.g. for a basin or a continent. The here introduced method B, on the other hand, locates the gross hydropower potential and thus leads to a more realistic distribution of the potential on a cell-to-cell basis. For a total basin, both methods come to the same result except for losses (evaporation or water use) during lateral discharge routing in method B.
8.4.2 Calculation of the gross hydropower potential with WaterGAP
Both methods A and B are analyzed applying runoff and discharge calculations of WaterGAP in combination with the model’s implemented drainage direction map DDM30 (Döll and Lehner, 2001). In order to incorporate elevation values at best possible accuracy at continental scale, a resampled version (see Appendix 8.3) of the digital elevation model of the HYDRO1k data set (USGS, 1999) is applied. From this high resolution grid (1 km x 1 km), both a mean and a minimum elevation for each 0.5° WaterGAP cell (in Europe approx. 30 km x 50 km) is derived. The minimum is assumed to represent the outflow elevation of the cell.
For method A, WaterGAP runoff values (runoff generated within the cell) and the cell’s mean elevation are applied to calculate the cell’s gross hydropower potential. For method B, a distinction is made between cell-internal runoff and inflow from upstream. The cell-internal runoff is assumed to be equally distributed over the cell and the potential energy is calculated considering the difference between mean and minimum elevation within the cell. The inflowing discharge, on the other hand, is allowed to “fall” from the minimum elevation of the upstream cell to the minimum elevation of the cell considered. The sum of both potentials gives the gross hydropower potential of the cell.
For both methods an additional correction is made such that the gross hydropower potential is not calculated down to sea level but down to the elevation of the basin’s final outlet cell (in method B only the outlet cell itself is affected). This accounts for the effect that within endorheic basins (inland sinks), as found in Turkey, the lowest elevation does not occur at sea level.

EuroWasser: Europe’s hydropower potential today and in the future 8-8
8.4.3 Results
Figure 8.1 shows the gross hydropower potential in GWh per year for Europe under today’s climate, calculated following methods A and B as described above. Method A directly reflects the product of runoff generation and total elevation, thus resulting in high potentials e.g. for the Alps and the Norwegian coast (both high precipitation and high elevation), or for Eastern Turkey (high elevation). Method B presents a more scattered view, still showing high hydropower potentials in mountainous regions (high precipitation and high cell-internal elevation gradients). Additionally, major rivers, e.g. the Rhine, the lower Rhone or parts of the Danube show high values. Here, high river discharge at still medium cell-to-cell elevation gradients accounts for the high hydropower potentials. In large areas of Eastern Europe, the gross potentials of method B are lower than in method A, due to the plain landscape that leads to small gradients. In contrast, high potentials arise at further downstream cells of rivers, where high discharge (accumulated from the plains) coincides with somewhat steeper gradients, e.g. certain cells along the course of the rivers Dnjepr, Don, or Volga.
Figure 8.1: Gross hydropower potentials for Europe, calculated by applying average (1961-90) runoff and discharge values of WaterGAP 2.1. A) Each cell is assigned its total gross hydropower potential down to sea level. B) Only the portion of the gross hydropower potential that can be locally utilized down to the next downstream cell is allocated to each cell.
Table 8.2 (Section 8.5.3 below) lists the calculated gross hydropower potentials for both methods by country. Portugal shows a nearly doubled gross potential in method B as compared to A, reflecting the fact that Portugal receives substantial discharge inflows from Spain. Switzerland, on the other hand, loses about a third of the gross potential generated within the country (method A) through river outflows. Luxembourg shows a higher actual generation of hydroelectricity than its computed gross potential, which can be explained by energy generation from pumped stations. The total gross hydropower potential for Europe

EuroWasser: Europe’s hydropower potential today and in the future 8-9
accounts for approx. 2500 TWh/a. The same calculations for the entire global land surface (except Antarctica) result in a gross hydropower potential of approx. 45 000 TWh/a.
In order to estimate the impact of climate change on the gross hydropower potential, runoff and river discharge for all grid cells of Europe are calculated for different climate and water use scenarios and different time slices. As for water use, we apply the Baseline-A scenario (as described in Chapter 4); for climate change, the results of the two state-of-the-art General Circulation Models (GCMs) ECHAM4 and HadCM3 (which consider an average annual increase of global carbon dioxide emissions by about 1% per year until 2100) for the time slices of the 2020s and the 2070s are used (for further details on scenario applications see Chapter 4). The induced changes in the gross hydropower potential are directly proportional to the changes in runoff or discharge. Figure 8.3 (Section 8.5.3 below) presents the relative changes in total discharge for the described scenarios. Therefore we here refrain from visualizing the changes in gross hydropower potential as they are very similar to Figure 8.3 (both method A and, with some exceptions, method B). Table 8.2 lists, for the HadCM3 climate model in the 2070s, the changes of gross hydropower potentials by country. In total, the gross hydropower potential of Europe in the 2070s is derived at approx. 2400 TWh/a, hence about 4% lower than today. The country results are further discussed in Section 8.5.3.
8.5 Developed hydropower potential
8.5.1 Methodology
The calculated changes of the gross hydropower potential due to climate change provide a first indicator of a country’s trend towards criticality in its future hydropower situation. But only that part of the gross potential which is or will be utilized through power plants will affect future hydropower production. In order to assess this so-called developed hydropower potential, detailed information is required on existing hydropower stations throughout Europe, including their location, their installed capacity (rated power) and their type of power generation. As no data set comprising these parameters was available at the time of conducting this study, we generated a new data set which geo-references 5991 hydropower stations in Europe and distinguishes run-of-river and reservoir stations. An evaluation of the accuracy of this data set was performed by comparison with given country statistics. The results show good overall correlation (see Appendix 8.4).
The developed hydropower potential is restricted, on the one hand, by the maximum installed electrical capacities of the power plants. On the other hand, the actual load of a hydropower plant is dependent on the available discharge, supplied either by river flow or by a reservoir. Accordingly, the supplied hydroelectricity can be increased (or decreased) in the future by changes in the installed capacity and/or changes in available discharge. However, due to lack of adequate data and the discussed difficulties in quantifying expected refurbishment or new constructions of hydropower plants (see Section 8.2.3), it is not possible

EuroWasser: Europe’s hydropower potential today and in the future 8-10
to estimate the future development of total installed hydropower capacities within the scope of this study. The future change in developed hydropower potential is thus only assessed by changes in discharge. Nevertheless, this is believed to provide a representative indicator to whether the impacts of global change will lead to a general growth or decline in the overall developed hydropower potential.
As the individual plant efficiency-factors and the discharge at which the maximum work load is reached are unknown, it is not possible to model absolute electricity production by simply applying WaterGAP’s discharge simulations. In order to allow for an assessment of relative changes, two general assumptions are made:
a) All existing hydropower stations are assumed to have comparable efficiency-rates of discharge utilization and they are designed to match today’s discharge. This means that, on the one hand, they are big enough to be able to harness the total amount of utilizable (see below) discharge, and, on the other hand, they are not oversized. Thus, to give an example, a 30 MW station is generally assumed to have three times the potential to produce electricity than a 10 MW station at their present discharge conditions. This assumption is mainly based on the fact that power stations are designed to be cost effective and to produce optimum yields.
b) A change in utilizable discharge has a directly proportional effect on electricity production. For example, a decrease in utilizable discharge of 50% for a power station will decrease its potential to produce energy by 50%, independent from its installed capacity.
In both assumptions the utilizable discharge is considered. This portion of the total discharge takes into account the fact that whether the full discharge can be harnessed depends on the operational mode of the power stations. In the following, utilizable discharge of run-of-river and reservoir stations is distinguished (see Appendix 8.5). The main difference is that reservoir stations are generally assumed to be able to store and to fully harness today’s as well as (even increasing) future inflow volumes (in reasonable limits). Hence all discharge is utilizable discharge. Conversely, a run-of-river station cannot utilize the portion of flood discharges that overflows the station (compare Appendix 8.2), independent of the magnitude of discharge excess. Hence a cut-off or threshold level is defined, above which discharge cannot be harnessed by run-of-river stations, neither today nor in the future.
8.5.2 Calculation of the developed hydropower potential with WaterGAP
Using the above assumptions and definitions, it is possible to analyze the impact of climate change on the developed hydropower potential. The main steps of the assessment by applying the WaterGAP model are as follows:
1. The geo-referenced hydropower stations (see Appendix 8.4) are allocated to the 0.5° grid cells and with this to the discharge simulations of WaterGAP. (Note: A stations within a
EuroWasser: Europe’s hydropower potential today and in the future 8-11
particular cell might in reality not lie on the main river course represented by this cell according to the drainage direction map of WaterGAP, but on a tributary with much smaller discharge. However, due to WaterGAP’s coarse spatial resolution of 0.5°, these smaller basins can not be represented. But as only relative changes in discharge are considered, which are assumed to reflect the general regional behavior, this errors in allocation are considered acceptable for a regional approach.)
2. Following the different scenarios (climate and water use scenarios), the relative changes in utilizable discharge (in %) for all WaterGAP cells are calculated for run-of-river stations and for reservoir stations, separately.
3. For a single station, the relative change in utilizable discharge (selected according to the type of station) directly represents the relative change in hydropower potential. On a country scale, the relative changes in utilizable discharge are weighed by the stations’ installed capacities. For example: a 10 MW reservoir with a discharge decrease of 50% and a 30 MW reservoir with a discharge decrease of 10% will lead to a total decrease in the developed hydropower potential of 20%.
8.5.3 Results
In the following figures all results are visualized at the cell level of WaterGAP’s calculation grid at 0.5° resolution. This, however, should not create the impression that every single cell result is meaningful by itself. But the more uniform and the larger a regional pattern occurs, the higher we assume its significance to be. Additionally, country averages are calculated and provided in Table 8.2.
In order to estimate the impact of climate change on the developed hydropower potential, the utilizable river discharges were calculated with WaterGAP for today and for future scenarios (as described in Section 8.4.3) for all grid cells of Europe. Figure 8.2 shows an example for the 2070s (HadCM3 climate model and Baseline-A water use scenario), where the relative change of total discharge is visualized. Superimposed are all geo-referenced hydropower plants, classified according to their capacities and assigned types. In the case of a reservoir station, the relative change in total (= utilizable) discharge at its location directly represents the power plant’s relative change in power potential. In the case of a run-of-river station, the relative change in utilizable discharge would somewhat differ from the relative change in total discharge but shows similar tendencies, thus no separate figure is presented.
Figure 8.2. indicates an uneven distribution of power stations and their assigned types across Europe, which might, to some degree, be influenced by incompleteness of the data source. Stations in mountainous areas or with larger capacities are primarily of type reservoir, reflecting the criteria of the applied regionalization (Appendix 8.4). (Please note that due to the large number of stations visualized many of them overlap in the figure.)

EuroWasser: Europe’s hydropower potential today and in the future 8-12
A strong tendency for declining discharge volumes occurs in Southern and parts of East-Central Europe, with maximum decreases of more than 25%. Conversely, strong increases in discharge volumes apply for large areas in Northern Europe with maximum rises of more than 25%. These results are generally in accordance with the areas identified in the ACACIA study as having significant increases or decreases in average annual river discharge (Parry, 2000).
Besides reflected trends in future precipitation, the change of temperature is assumed to have a significant impact on runoff generation via its effect on evapotranspiration rates. Additionally, in Eastern Europe a strong rise in water use is assumed (compare Chapters 5 and 7).
Figure 8.2: Relative change of average (1961-90) total discharge volumes calculated with WaterGAP 2.1 for the 2070s (HadCM3 climate model and Baseline-A water use scenario), superimposed by geo-referenced European hydropower plants, classified according to their type and capacity.

EuroWasser: Europe’s hydropower potential today and in the future 8-13
Looking at countries like Poland, Germany or Russia, which comprise areas with both increasing and decreasing discharges, the spatial distribution of hydropower stations is significant for the country’s overall trend in developed hydropower potential (compare Table 8.2). The change depends on where the majority of stations are located, namely in areas with decreasing discharge in Poland and Germany, but with increasing discharge in Russia.
Figure 8.3 finally provides an overview of changes in total discharge applying two different GCMs for two different time slices. The location and types of power stations here are omitted for reasons of clarity.
Figure 8.3: Relative change of average (1961-90) total discharge volumes calculated with WaterGAP 2.1 for the 2020s and 2070s (ECHAM4 and HadCM3 climate models and Baseline-A water use scenario).

EuroWasser: Europe’s hydropower potential today and in the future 8-14
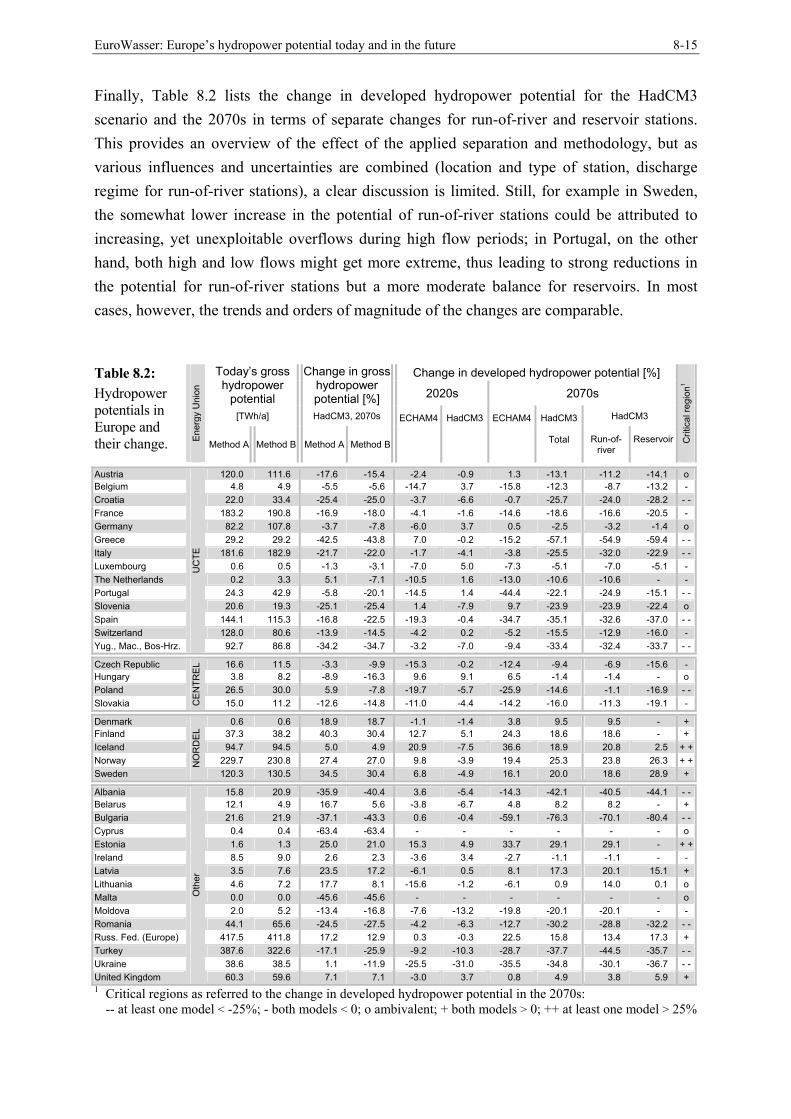
Table 8.2 summarizes the computed changes in developed hydropower potentials on a country basis. (Note: For final judgment whether a relative change in developed hydropower potential has a significant impact on a country’s total energy supply, the actual annual generation of hydroelectricity of the country, as provided in Table 8.1, has to be taken into account.) Both climate models agree in their estimates of more pronounced changes in discharge for the 2070s, leading to changes of +/-25% or more in the developed hydropower potential for some countries. The most significant decreases occur in Spain, Bulgaria, Ukraine, and Turkey, while increases are strongest in Norway, Sweden, Finland and Russia. The predictions of changes in discharge of both ECHAM4 and HadCM3 are contradictory in several regions for their respective 2020s and 2070s (e.g. Italy, Northern Germany, Bulgaria, Greece for ECHAM4; Norway, Sweden, Iceland, Portugal, Spain, Bulgaria, Greece for HadCM3). Generally, the results with ECHAM4 seem to be more monotonic in time. For the 2020s, ECHAM4 and HadCM3 lead to opposite results for large areas in Western Europe (Iberian Peninsula, Great Britain, France, Germany, Norway, Sweden, Iceland). In the 2070s, the Mediterranean region around Italy, and Southern Great Britain develop differently depending on which of the two GCMs is applied, but commonly the agreement is closer than in the 2020s.
The induced changes in developed hydropower potentials generally reflect the changes in discharge as visualized in Figure 8.3. However, some exceptions occur, one of the most significant being that Spain’s country total shows a negative change in developed hydropower potential for the 2020s in the HadCM3 scenario. Possible explanations for this are that either most (or the largest) power stations are located in the Pyrenees (where the discharges decrease), or that the increases in discharge are due to more peak flows which exceed the cut-off level of the run-of-river stations and are, thus, not utilizable.
Table 8.2 additionally lists the gross hydropower potential and its change for the HadCM3 scenario in the 2070s, both for method A and B (see Section 8.4). Comparison of these relative changes with the corresponding changes in developed hydropower potential indicates that in most cases the trends and the order of magnitude are similar. Generally, method B shows a closer agreement, as it accounts for the located gross hydropower potential on a cell-to-cell basis (compare Section 8.4) – this seems to better reflect the concept underlying the calculations for the developed hydropower potential. In Portugal, for example, method A leads to a reduction of about 5% in gross hydropower potential, which refers to all runoff generated within Portugal. Method B, on the other hand, leads to a reduction of about 20%, as it takes the largely reduced inflows from Spain into account. The developed hydropower potential of Portugal, which is dominated by reservoirs along inflowing rivers from Spain, shows a similar tendency with a reduction of about 22%. Thus, it can be argued that the relative change in gross hydropower potential calculated according to method B provides a good indicator for the change in developed hydropower potential.
EuroWasser: Europe’s hydropower potential today and in the future 8-15
Finally, Table 8.2 lists the change in developed hydropower potential for the HadCM3 scenario and the 2070s in terms of separate changes for run-of-river and reservoir stations. This provides an overview of the effect of the applied separation and methodology, but as various influences and uncertainties are combined (location and type of station, discharge regime for run-of-river stations), a clear discussion is limited. Still, for example in Sweden, the somewhat lower increase in the potential of run-of-river stations could be attributed to increasing, yet unexploitable overflows during high flow periods; in Portugal, on the other hand, both high and low flows might get more extreme, thus leading to strong reductions in the potential for run-of-river stations but a more moderate balance for reservoirs. In most cases, however, the trends and orders of magnitude of the changes are comparable.
Change in developed hydropower potential [%] Today’s gross hydropower
potential
Change in gross hydropower potential [%] 2020s 2070s
[TWh/a] HadCM3, 2070s HadCM3
Table 8.2: Hydropower potentials in Europe and their change.
Ener
gy U
nion
Method A Method B Method A Method B
ECHAM4
HadCM3
ECHAM4
HadCM3
Total
Run-of-river
Reservoir
Crit
ical
regi
on1
Austria 120.0 111.6 -17.6 -15.4 -2.4 -0.9 1.3 -13.1 -11.2 -14.1 o Belgium 4.8 4.9 -5.5 -5.6 -14.7 3.7 -15.8 -12.3 -8.7 -13.2 - Croatia 22.0 33.4 -25.4 -25.0 -3.7 -6.6 -0.7 -25.7 -24.0 -28.2 - -France 183.2 190.8 -16.9 -18.0 -4.1 -1.6 -14.6 -18.6 -16.6 -20.5 - Germany 82.2 107.8 -3.7 -7.8 -6.0 3.7 0.5 -2.5 -3.2 -1.4 o Greece 29.2 29.2 -42.5 -43.8 7.0 -0.2 -15.2 -57.1 -54.9 -59.4 - -Italy 181.6 182.9 -21.7 -22.0 -1.7 -4.1 -3.8 -25.5 -32.0 -22.9 - -Luxembourg 0.6 0.5 -1.3 -3.1 -7.0 5.0 -7.3 -5.1 -7.0 -5.1 - The Netherlands 0.2 3.3 5.1 -7.1 -10.5 1.6 -13.0 -10.6 -10.6 - - Portugal 24.3 42.9 -5.8 -20.1 -14.5 1.4 -44.4 -22.1 -24.9 -15.1 - -Slovenia 20.6 19.3 -25.1 -25.4 1.4 -7.9 9.7 -23.9 -23.9 -22.4 o Spain 144.1 115.3 -16.8 -22.5 -19.3 -0.4 -34.7 -35.1 -32.6 -37.0 - -Switzerland 128.0 80.6 -13.9 -14.5 -4.2 0.2 -5.2 -15.5 -12.9 -16.0 - Yug., Mac., Bos-Hrz.
UC
TE
92.7 86.8 -34.2 -34.7 -3.2 -7.0 -9.4 -33.4 -32.4 -33.7 - -
Czech Republic 16.6 11.5 -3.3 -9.9 -15.3 -0.2 -12.4 -9.4 -6.9 -15.6 - Hungary 3.8 8.2 -8.9 -16.3 9.6 9.1 6.5 -1.4 -1.4 - o Poland 26.5 30.0 5.9 -7.8 -19.7 -5.7 -25.9 -14.6 -1.1 -16.9 - -Slovakia C
ENTR
EL
15.0 11.2 -12.6 -14.8 -11.0 -4.4 -14.2 -16.0 -11.3 -19.1 -
Denmark 0.6 0.6 18.9 18.7 -1.1 -1.4 3.8 9.5 9.5 - + Finland 37.3 38.2 40.3 30.4 12.7 5.1 24.3 18.6 18.6 - + Iceland 94.7 94.5 5.0 4.9 20.9 -7.5 36.6 18.9 20.8 2.5 + +Norway 229.7 230.8 27.4 27.0 9.8 -3.9 19.4 25.3 23.8 26.3 + +Sweden
NO
RD
EL
120.3 130.5 34.5 30.4 6.8 -4.9 16.1 20.0 18.6 28.9 +
Albania 15.8 20.9 -35.9 -40.4 3.6 -5.4 -14.3 -42.1 -40.5 -44.1 - -Belarus 12.1 4.9 16.7 5.6 -3.8 -6.7 4.8 8.2 8.2 - + Bulgaria 21.6 21.9 -37.1 -43.3 0.6 -0.4 -59.1 -76.3 -70.1 -80.4 - -Cyprus 0.4 0.4 -63.4 -63.4 - - - - - - o Estonia 1.6 1.3 25.0 21.0 15.3 4.9 33.7 29.1 29.1 - + +Ireland 8.5 9.0 2.6 2.3 -3.6 3.4 -2.7 -1.1 -1.1 - - Latvia 3.5 7.6 23.5 17.2 -6.1 0.5 8.1 17.3 20.1 15.1 + Lithuania 4.6 7.2 17.7 8.1 -15.6 -1.2 -6.1 0.9 14.0 0.1 o Malta 0.0 0.0 -45.6 -45.6 - - - - - - o Moldova 2.0 5.2 -13.4 -16.8 -7.6 -13.2 -19.8 -20.1 -20.1 - - Romania 44.1 65.6 -24.5 -27.5 -4.2 -6.3 -12.7 -30.2 -28.8 -32.2 - -Russ. Fed. (Europe) 417.5 411.8 17.2 12.9 0.3 -0.3 22.5 15.8 13.4 17.3 + Turkey 387.6 322.6 -17.1 -25.9 -9.2 -10.3 -28.7 -37.7 -44.5 -35.7 - -Ukraine 38.6 38.5 1.1 -11.9 -25.5 -31.0 -35.5 -34.8 -30.1 -36.7 - -United Kingdom
Oth
er
60.3 59.6 7.1 7.1 -3.0 3.7 0.8 4.9 3.8 5.9 + 1 Critical regions as referred to the change in developed hydropower potential in the 2070s:
-- at least one model < -25%; - both models < 0; o ambivalent; + both models > 0; ++ at least one model > 25%
EuroWasser: Europe’s hydropower potential today and in the future 8-16
8.6 Conclusions
This chapter described a new concept of analyzing the impacts of climate and global change on future hydropower potentials on a country scale. In a first assessment, today’s gross hydropower potential of all European countries is estimated at approx. 2500 TWh/a, providing an indicator of both actual state and future possibilities of utilizing hydropower as a renewable source of energy. In comparison to other existing studies, the advantage of applying the macroscale integrated WaterGAP model to calculate the gross hydropower potential lies in the possibility to arrive at comparable results for the whole continent. Additionally, the drainage direction map included in the WaterGAP model enabled a new, sophisticated allocation of the gross hydropower potential along the river courses with respect to local differences in elevations on a cell-to-cell basis.
A new data set has been developed which geo-references 5991 hydropower stations in Europe and distinguishes them into run-of-river and reservoir stations. An evaluation of the accuracy of this data set as compared to given country statistics showed good overall correlation. This data set, in combination with WaterGAP discharge calculations, allows for an individual assessment of the effects of changing discharges on reservoir and run-of-river stations.
To assess the impact of climate change, both the effect on gross and developed (existing plants only) hydropower potentials were investigated on a country scale. As main findings of applying two different climate scenarios (results of ECHAM4 and HadCM3 GCMs as described in Chapter 4) and the Baseline-A water use scenario for future discharge calculations within WaterGAP, the following statements can be distilled for the 2070s: In strong correlation to changes in discharge, mainly driven by future precipitation patterns, the potential of existing hydropower plants to produce electricity increases in Northern Europe, but decreases in the South. Scandinavia and Northern Russia show an increase in hydropower potential of 15-30% and above. The regions most prone to a decrease in developed hydropower potential are Portugal and Spain in Western Europe, as well as Ukraine, Bulgaria and Turkey in the East, with decreases of 20-50% and more. Germany and Great Britain maintain a rather stable developed hydropower potential compared to other European countries.
Additionally, with results derived from the HadCM3 scenario for the 2070s it could be shown that the relative change in gross hydropower potential, calculated according to the newly developed, locally distributed method, provides a good indicator for the change in developed hydropower potential. For the whole of Europe, the gross hydropower potential is estimated to decline by about 4% to approx. 2400 TWh/a in the 2070s.
For a qualification of the presented findings, however, one should not forget the limits of discharge modeling on a global scale. The calculations are inherently uncertain as the involved processes are complex and difficult to predict. In addition, human activities and

EuroWasser: Europe’s hydropower potential today and in the future 8-17
political decisions (suspension, refurbishment or construction of power plants, the issue of renewable energy resources and environmental impacts) will strongly regulate the actual level of utilization of the given gross potential to generate hydroelectricity.
8.7 References
Döll, P., Lehner, B. (2001): Validation of a new global 30-minute drainage direction map. Journal of Hydrology (accepted).
EIA (U.S. Energy Information Administration) (2000): International Energy Outlook 2000. EIA, Department of Energy, 251 pp. http://www.eia.doe.gov/oiaf/ieo/index.html.
EIA (U.S. Energy Information Administration) (1999): International Energy Annual 1999, Electricity. EIA, Department of Energy. http://www.eia.doe.gov/emeu/iea/elec.html.
ESRI (1998): ArcAtlas. http://www.esri.com/data/catalog/esri/esri_aa.html. Eurelectric (Union of the Electric Industry) (1997a): Study on the importance of harnessing the hydropower
resources of the world. Hydro Power and other Renewable Energies Study Committee. EURELECTRIC, Brussels, 20pp. http://www.eurelectric.org.
Eurelectric (Union of the Electric Industry) (1997b): The cost of hydroelectricity. Hydro Power and other Renewable Energies Study Committee. EURELECTRIC, Brussels, 15pp. http://www.eurelectric.org.
Eurelectric (Union of the Electric Industry) (1997c): Hydroelectricity, energy vector for progress and development. Hydro Power and other Renewable Energies Study Committee. EURELECTRIC, Brussels, 11pp. http://www.eurelectric.org.
European Commission (2000): Energy in Europe – 1999 Annual Energy Review. Special Issue January 2000, Directorate-General for Energy.
Feix, O. (2000): Personal communication (supply of data on reservoir storage capacity for UCTE countries, 1997). UCTE, Berlin.
IEA (International Energy Agency) (1999): Key world energy statistics. 75 pp. http://www.iea.org. Lehner, B., Döll, P. (2001): WELAREM1 - A global lakes, reservoirs and wetlands data set. Data set description
sheet, Center for Environmental Systems Research, University of Kassel, Germany. Lovseth, J. (1995): The renewable energy potential of Norway and strategies for its development. Renewable
Energy, Vol.6, No. 3, pp. 207-214. NIMA (National Imagery and Mapping Agency) (2001): Database of foreign geographic feature names.
Available via The GEOnet Names Server (GNS), http://164.214.2.59/gns/html/index.html. NORDEL (Organization for Nordic power cooperation) (2000): Statistics 1999.
http://www.nordel.org/eng/4/40/eng99.pdf Parry, M. (ed.) (2000): The Europe ACACIA project: Assessment of Potential Effects and Adaptations for
Climate Change in Europe, Jackson Environment Institute, Norwich, U.K. UCTE (Union for the Coordination of Transmission of Electricity) (2000): UCPTE Annuaire Statistique /
Statistisches Jahrbuch / Statistical Yearbook 1999, Luxembuorg. http://www.ucte.org. UCTE (Union for the Coordination of Transmission of Electricity) (1999): Langfristige Entwicklung von
Abflußreihen im UCPTE-Raum. Bericht der UG Wasserwirtschaft, Wien, 9pp. http://www.ucte.org. UDI (Utility Data Institute) (2000): World Electric Power Plants Database. Platts Energy InfoStore,
http://www.platts.com. UNIPEDE (International Union of Producers and Distributors of Electrical Energy) (1998): EUROPROG 1998.
Programmes and Prospects for the European Electricity Sector. EURPROG Report – final version, 26th edition, 232 pp. http://unipede.eurelectric.org.
USGS (US Geological Survey) (1999): HYDRO1k Elevation Derivative Database. Eros Data Centre. http://edcwww.cr.usgs.gov/landdaac/gtopo30/hydro/index.html.
Voigtländer, P., Gattinger, M. (1999): Potentiale: Wasserkraft. In: Brauch, H., Czisch, G., Knies, G. (Eds.): Regenerativer Strom für Europa durch Fernübertragung elektrischer Energie. Moosbach, AFES-Press, September 1999 (1), ISBN 3-926979-71-2, pp. 15-25.
EuroWasser: Europe’s hydropower potential today and in the future 8-18
Appendix 8.1: Advantages and disadvantages of hydropower
Table 8.3: Advantages and disadvantages of hydropower projects (Eurelectric, 1997a, modified). Advantages Disadvantages
Low energy production cost considering the long effective lifetime of the plants and the low operation and maintenance costs
Greater efficiency than of all other major type of plants, using non-renewable and renewable energy resources
Low emission of greenhouse gases (with exceptions)
Possibility of multipurpose water use and water management, such as irrigation and regulation of river flows both during flood seasons and low flow periods
Efficient output regulation, facilitating rapid response to variable energy demand
Possibility to store large quantities of energy (pondage, seasonal storage)
High investment costs associated with along return period
Long lead times for project realization
Environmental and social problems, mainlydue to inundation of areas by large waterreservoirs causing possible destruction ofunique biomes, biodiversity and endemicspecies. Additionally, possible destruction ofhuman habitats, incurring high costs ofnecessary resettlements
Possible conflicts due to multipurpose useof the resource “water” (water supply,electricity generation, flood control,irrigation, recreation, etc.)
Appendix 8.2: Classification of hydropower stations
The classification of hydropower stations applied in this study is based on the reservoir’s filling period (time to completely fill the storage volume), calculated using the annual characteristic average flow (UCTE, 2000):
Run-of-river stations. Run-of-river stations operate on base load and use the incoming river flow continuously with a filling period of less than 2 hours. The advantage of low-cost investments and constructions is countered by fluctuations in energy production. During low flow periods the stations cannot operate at their full installed capacity. Flood flows, on the other hand, overflow the installation unexploited.
Pondage and reservoir stations. Pondage and reservoir stations store their cumulative flows wholly or partly in their retaining works in order to generate electricity during times of higher demand. According to the filling period of a reservoir it can be defined as follows: Pondage: 2 hours < filling period < 400 hours. Reservoir: Filling period > 400 hours.
Depending on their storage capacity and operational management, reservoir stations can store water (i.e. energy) over long time periods and generate a steady supply of electricity, relatively independent from variations in short-term inflow.
Pumped stations (or stations with pumping). In stations with pumping, water can be raised by means of pumps and stored in an upper reservoir to be used for the generation of electrical energy during times of peak demand. Besides the various arrangements of pumps and turbines in the hydraulic circuits, a distinction is made based on whether the upper reservoir is additionally fed by significant natural inflows (mixed pumped storage) or not (pure pumped storage). Typically, pumped stations produce electricity at rather high selling prices for spells of peak consumption (in particular pumping at night, electricity generation during the day).
A given hydropower station can be influenced by upstream stations of the same or a different type such that a clear classification of its category is often difficult or ambiguous. Furthermore, the main purpose of a reservoir is often not the production of electricity, but for example flood control, forcing the type of operation to be adaptive (e.g. no full exploitation of storage capacity).

EuroWasser: Europe’s hydropower potential today and in the future 8-19
Appendix 8.3: Resampling of HYDRO1k for hydroelectricity calculations
With a spatial resolution of 1 km x 1 km, the digital elevation model of the HYDRO1k data set (USGS, 1999) typically provides about 30 x 50 (depending on latitude) individual elevation values per 0.5° WaterGAP cell (compare Figure 8.4). Each of these values marks the mean elevation at its location. For calculating the gross hydropower potential, it is essential to define at what elevation water is generated as runoff, or, to be more precise, at what elevation it can be utilized. WaterGAP delivers one runoff value per 0.5° grid cell which, due to lack of other criteria, is assumed to be equally distributed within the 0.5° cell. After averaging the original HYDRO1k elevations for each WaterGAP cell, however, it cannot be argued that the full runoff volume of each WaterGAP cell is utilizable at the cell’s mean elevation, as partly it is generated below, partly above this average altitude. This concept would only be valid for virtual power stations at infinitesimally small areas. A somewhat more “realistic”, yet arbitrary, point of view is adopted in this study which assumes that all runoff generated within a 5 km x 5 km environment can be utilized at the lowest HYDRO1k elevation found within this area. Therefore, the relief of HYDRO1k is slightly moderated by a resampling procedure such that every HYDRO1k cell is assigned the lowest elevation found in its 5 x 5 cell neighborhood. Only then, the such resampled HYDRO1k grid is averaged to arrive at mean or minimum elevations for the WaterGAP cells.
Figure 8.4: A grid of 0.5° x 0.5° cells and the DDM30 drainage directions as applied in the WaterGAP model superimposed on the HYDRO1k digital elevation model.
Appendix 8.4: A new data set for European hydropower stations
A new geo-referenced data set on existing hydropower stations throughout Europe, including their location, their installed capacity (rated power) and their type of power generation, has been developed by combining various existing data sources:
Hydropower stations and installed capacity. The World Electric Power Plants Database of the Utility Data Institute (UDI, 2000) provides comprehensive global data on all types of electric power plants. From this data set the information on European hydroelectric power plants was extracted. These comprise 5991 single stations, including their names, their country and their installed capacity ranging from 4 KW to 3600 MW. However, no information on the exact location or type of these stations is provided.

EuroWasser: Europe’s hydropower potential today and in the future 8-20
Location of hydropower stations. In order to locate the hydropower stations of the UDI data set, the National Imagery and Mapping Agency's Database of foreign geographic feature names (NIMA, 2001) was used. This database is a global repository of place-names (excluding the USA), comprising some 3.7 million features with their respective geographic coordinates. As the names in the UDI data set, in their majority, reflect the names of the places where the hydropower stations are operated (some are additionally provided with names of the nearest city), most of the stations could be allocated via an automated spreadsheet join. The missing stations were allocated manually and the result was checked for general errors (e.g. incorrect country). Although the location of hydropower stations via their names represents a best-guess approach only, the achieved quality and completeness proved to be very good on the country scale. Figure 8.5 presents a comparison of capacities with country statistics (from Table 8.1 in Section 8.2.2) showing a modeling efficiency of 0.98. The tendency of the geo-referenced data set to exceed the values given in the country statistics can be explained by the fact that UCTE and CENTREL data comprises only hydropower stations with capacities above 1 MW, thus neglecting the smaller stations. (Note: Hydropower capacities provided by EIA for UCTE and CENTREL countries showed systematic differences from the capacities provided by UCTE and CENTREL themselves, with the difference being approximately equal to the capacities of pure pumped storage stations. The data given by EIA are not defined whether or not they include pumped storage, thus Figure 8.5 excludes the data of EIA and refers only to the 23 UCTE, CENTREL and NORDEL countries.)
Type of hydropower stations. Finally, a type of operational mode was assigned to the geo-referenced hydropower stations, distinguishing run-of-river and reservoir stations (pumped and mixed pumped stations are treated as reservoirs). For this purpose, a statistical model was set up in order to derive the types of the power plants from station characteristic parameters (i.e. capacity, elevation and slope). Two new data sets were utilized:
A subset of the ArcAtlas database (ESRI, 1998), which supplies location and installed capacity of large hydropower stations. This data set, however, only comprises about 800 larger European stations (and was therefore rejected as general data source in the first place), but it promised higher accuracy in correctly allocated stations than the geo-referenced UDI data.
UCTE data tables (UCTE, 2000) which, on a country basis, list the inventory of hydropower stations above 1 MW, classified into categories of capacity and types of operational mode.
Utilizing these two sets of information, the type of some ArcAtlas hydropower stations could be assigned with high probability. Two examples of Greece are given for illustration: (i) UCTE lists in the 50-100 MW category two reservoir (and no run-of-river) stations with a total installed capacity of 120 MW; ArcAtlas also shows two hydropower stations in this category, with a total capacity of 120 MW, hence they are both defined as reservoirs. (ii) In the 10-50 MW category UCTE lists four run-of-river (and no reservoir) stations, with a total installed capacity of 73 MW; ArcAtlas shows only two hydropower stations in this category, with a total capacity of 29 MW, hence these two are defined as run-of-river stations, and the other two are assumed to be missing in the ArcAtlas data.
However, this methodology was not unambiguously applicable for all stations. In these cases, two additional criteria were applied in order to support the decision: (i) Reservoir stations tend to have higher installed capacities than run-of-river stations (this criteria is based on an analysis of the given UCTE data where reservoirs significantly dominate the high capacity categories throughout Europe). (ii) Reservoirs are more likely to exist in higher elevation and areas with steeper slopes (this assumption is based on the general geographical requirements for the construction of a reservoir or run-of-river station). To assess the latter information, additional information was generated from the digital elevation model of the HYDRO1k data set (USGS, 1999): average elevation and slope values were derived for all ArcAtlas hydropower stations (averaged for a 5 km x 5 km neighborhood to smooth local inaccuracies).
Combining all the above information and criteria, 348 ArcAtlas hydropower stations (in UCTE countries) could be manually attributed with a “most probable” type of power generation.
In a last step, the type of all geo-referenced UDI hydropower stations was regionalized throughout Europe. For this purpose, a discriminant function analysis was conducted for the 348 ArcAtlas stations in order to derive a statistical function that allows a prediction of the type of power station from the given characteristic parameters capacity, elevation and slope. The derived statistical model could

EuroWasser: Europe’s hydropower potential today and in the future 8-21
correctly reproduce 81% of the originally attributed types and is therefore considered adequate for the purpose. The statistical model was then applied to the complete geo-referenced data set. Figure 8.6 presents a validation of the thus regionalized hydropower types by capacities per country against literature values (from Table 8.1 in Section 8.2.2) and shows a good overall agreement. The complete geo-referenced data set of hydropower stations in Europe is visualized in Figure 8.2 in Section 8.5.3.
0
5
10
15
20
25
0 5 10 15 20 25 30Country statistics
Geo
-refe
renc
ed h
ydro
pow
er d
ata
set b
ased
on
UD
I
Modeling efficiency = 0.98
0 5 10 15 20 25Hydropower data set
Yugosl., MacedoniaBosnia-Herzegovina
Belgium
Czech Republic
France
Germany
Greece
Italy
Luxembourg
Poland
Portugal
Slovakia
Spain
Switzerland
Capacity [GW]
0510152025Country statistics
Capacity [GW]
Run-of-river stations
Figure 8.5: Validation of the geo-referenced hydropower data set by comparison of hydropower capacities for 23 European countries.
Figure 8.6: Validation of the geo-referenced hydropower data set by comparison of hydropower capacities distinguished into run-of-river and reservoir plants for selected European countries.
Appendix 8.5: Utilizable discharge for different types of hydropower stations
Utilizable discharge of reservoir and run-of-river stations is distinguished as follows:
Reservoir stations. It is generally assumed that reservoir stations are able to store and to fully harness today’s as well as (even increasing) future inflow volumes (in reasonable limits). Hence all discharge is utilizable discharge. This assumption is based on data supplied by UCTE (2000a, b) and NORDEL (1997a, b). Table 8.4 shows that the maximum possible work load of UCTE and NORDEL reservoirs is only utilized by about 10-25% (or 1000-2000 hours at full work load per year). At the same time the storage capacity of the reservoir stations is in the range of 30% or more of the total annual energy production. This combination of large storage capacities and not fully exploited work load allows a management of the reservoirs in a way such that they can balance increasing inflows. In certain cases, however, this “average” finding might not be applicable or an adaptation in reservoir management might be restricted by other objectives, e.g. flood control. (Note: pumped and mixed pumped stations are treated as reservoirs; their ability to adapt to future discharge is not further assessed.)
Installed capacity1
Annual generation2 Average work load Storage capacity3
Table 8.4: Hydroelectricity generation from reservoirs and mixed pumped storage.
Ener
gy U
nion
GW TWh Hours at full work load
% of max. (8760h/a) TWh
% of annual generation
Austria 5.4 7.0 1296 14.8 3.2 45.7 France 11.6 18.2 1569 17.9 9.8 53.8 Germany 1.4 1.1 786 9.0 0.3 27.3 Greece 2.3 3.2 1391 15.9 2.4 75.0 Italy 7.4 17.4 2260 25.8 7.9 45.4 Portugal 2.1 4.1 1952 22.3 2.6 63.4 Spain 7.7 16.7 2169 24.8 18.4 110.2 Switzerland
UC
TE
9.5 18.5 1947 22.2 8.4 45.4 1 data source: UCTE 2000 (values of 31.12.1998) 2 data source: UCTE 2000 (values of 1998) 3 data source: Feix 2000 (values of 1997)
301:1 Line
Capacity for hydroelectricitygeneration per country [GW]
Reservoirs and pumped storage
Austria

EuroWasser: Europe’s hydropower potential today and in the future 8-22
Run-of-river stations. A run-of-river station cannot utilize the portion of flood discharges that overflows the station (compare Appendix 8.2), independent of the magnitude of discharge excess. Hence, a cut-off or threshold level has to be taken into account, above which discharge cannot be harnessed, neither today nor in the future (see Figure 8.7).
The cut-off level is difficult to estimate as it depends on various factors, in particular the given technical installations and the maximum load of the run-of-river station. Due to insufficient data, it was not possible to assign an individual cut-off level to each station throughout Europe. Instead, a “representative” level is applied. To derive this level, the seasonal regime (i.e. the average discharge for each month of the year) was calculated for each grid cell of the WaterGAP model based on the time series 1961-90. The second highest mean monthly discharge within the year (in m3/s) was then chosen as the cell representative cut-off level.
0
20
40
60
80
100
0 6 12 18 24 30 36 42 48Time [months]
Mon
thly
dis
char
ge [m
3 /s]
Cut-off level
Harnessed discharge volume
Monthly streamflowhydrograph Overflow
Figure 8.7: Harnessing discharge for power generation in run-of-river stations.
In order to evaluate the applied cut-off level, a comparison was conducted for all German run-of-river stations with rated powers between 1 MW and 100 MW:
On the one hand, data supplied by UCTE (2000) lists 288 run-of-river stations (incl. pondage) in this category with a total installed capacity of 2715 MW. Considering a permanent electricity production throughout the year (8760 h), these stations have a potential production of 23.8 TWh. However, the mean annual electricity production is published at 14.7 TWh. This means that from the possible energy production the stations actually harness on average 62% (or they operate 5431 hours at full work load).
On the other hand, the geo-referenced data set on hydropower stations (see Appendix 8.4), shows 310 run-of-river stations for Germany between 1 MW and 100 MW, with a total maximum capacity of 3456 MW. It is assumed that the maximum electrical capacity per station is fully utilized at the above defined cut-off level, and a lower discharge leads to proportionally lower energy production. With this assumption and applying WaterGAP discharge calculations (1961-90) to all 310 stations, an average plant utilization of 67% is achieved (or 5860 hours at full work load).
This example proves that the chosen cut-off level is adequate for Germany, at least for long-term calculations. For other countries and other conditions, however, this approach might not be fully appropriate.