8-1 fileInventory Issues Physical Goods Included in Inventory Cost Included in Inventory Cost Flow...
59
8-1
Transcript of 8-1 fileInventory Issues Physical Goods Included in Inventory Cost Included in Inventory Cost Flow...
8-1

C H A P T E R C H A P T E R 88
VALUATION OF INVENTORIES: A VALUATION OF INVENTORIES: A COSTCOST--BASIS APPROACHBASIS APPROACH
8-2
Intermediate AccountingIFRS Edition
Kieso, Weygandt, and Warfield

1. Identify major classifications of inventory.
2. Distinguish between perpetual and periodic inventory
systems.
3. Identify the effects of inventory errors on the financial
Learning ObjectivesLearning Objectives
8-3
statements.
4. Understand the items to include as inventory cost.
5. Describe and compare the methods used to price
inventories.

Inventory IssuesInventory IssuesPhysical Goods Physical Goods
Included in Included in InventoryInventory
Cost Included in Cost Included in InventoryInventory
Cost Flow Cost Flow AssumptionsAssumptions
Valuation of Inventories:Valuation of Inventories:CostCost--Basis ApproachBasis Approach
8-4
Goods in transit
Consigned goods
Special sales agreements
Inventory errors
Classification
Cost flow
Control
Basic inventory valuation
Product costs
Period costs
Purchase discounts
Specific identification
Average cost
FIFO
Summary analysis
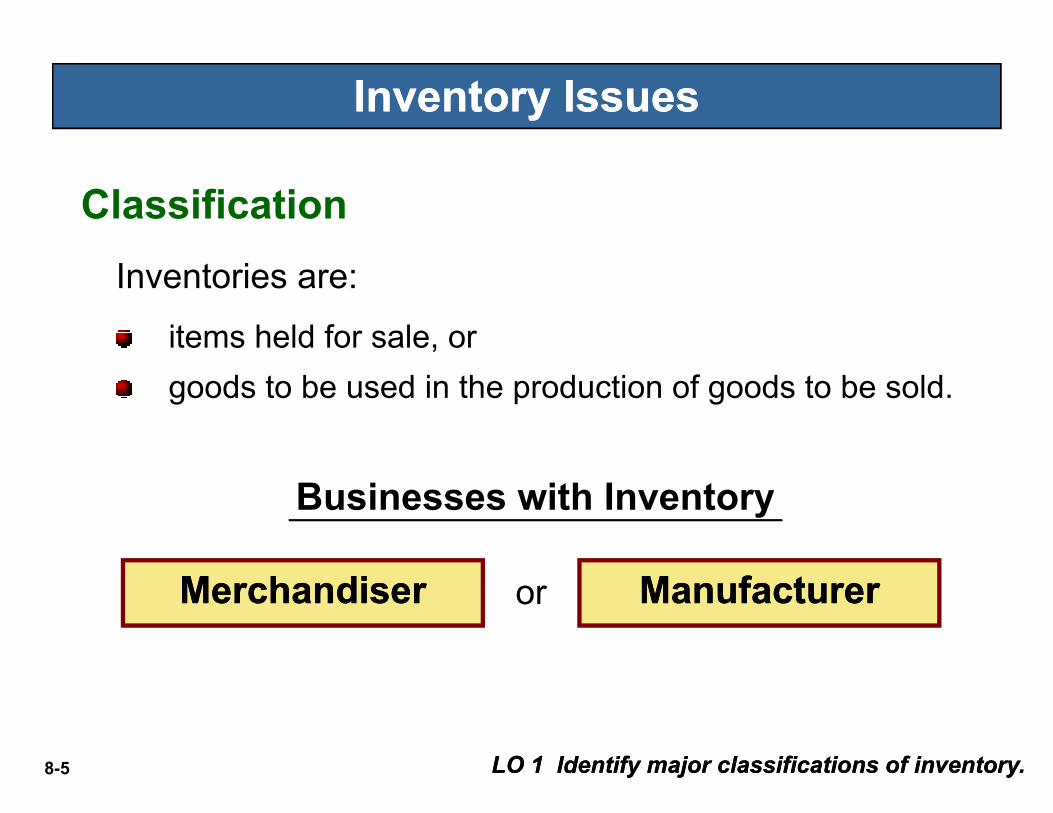
Inventories are:
items held for sale, or
goods to be used in the production of goods to be sold.
Inventory IssuesInventory Issues
Classification
8-5 LO 1 Identify major classifications of inventory.LO 1 Identify major classifications of inventory.
MerchandiserMerchandiser ManufacturerManufacturer
Businesses with Inventory
or

One inventory
account.
Classification
Inventory IssuesInventory Issues
Illustration 8-1
8-6
Purchase goods
in form ready for
sale.
LO 1 Identify major classifications of inventory.LO 1 Identify major classifications of inventory.

Three accounts
• Raw materials
Classification
Inventory IssuesInventory Issues
Illustration 8-1
8-7
• Raw materials
• Work in process
• Finished goods
LO 1LO 1
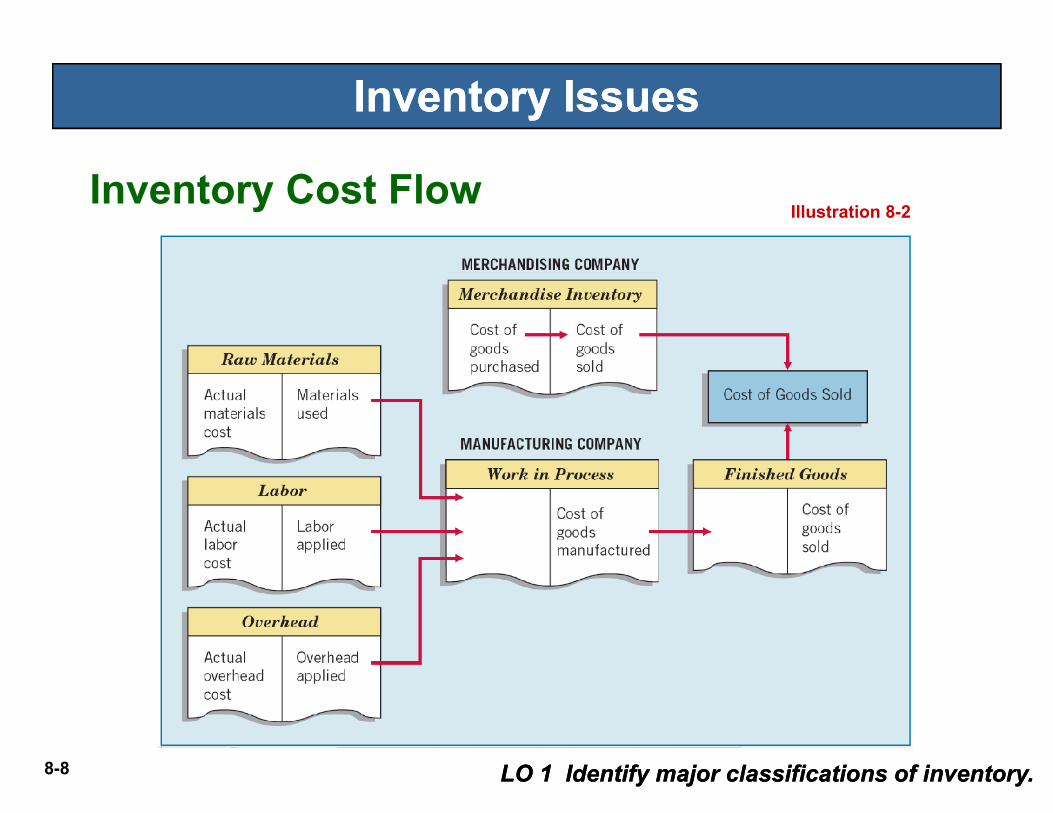
Inventory Cost Flow
Inventory IssuesInventory Issues
Illustration 8-2
8-8 LO 1 Identify major classifications of inventory.LO 1 Identify major classifications of inventory.

Inventory Cost Flow
Inventory IssuesInventory Issues
Illustration 8-3
8-9 LO 1 Identify major classifications of inventory.LO 1 Identify major classifications of inventory.
Companies use one of two types of systems for maintaining inventory records — perpetual system or periodic system.

Inventory Cost FlowInventory Cost Flow
Perpetual System
1. Purchases of merchandise are debited to Inventory.
2. Freight-in is debited to Inventory. Purchase returns and
allowances and purchase discounts are credited to Inventory.
8-10 LO 2 Distinguish between perpetual and periodic inventory systems.LO 2 Distinguish between perpetual and periodic inventory systems.
3. Cost of goods sold is debited and Inventory is credited for each
sale.
4. Subsidiary records show quantity and cost of each type of
inventory on hand.
The perpetual inventory system provides a continuous record of Inventory and Cost of Goods Sold.

Inventory Cost FlowInventory Cost Flow
Periodic System
1. Purchases of merchandise are debited to Purchases.
2. Ending Inventory determined by physical count.
3. Calculation of Cost of Goods Sold:
8-11 LO 2 Distinguish between perpetual and periodic inventory systems.LO 2 Distinguish between perpetual and periodic inventory systems.
3. Calculation of Cost of Goods Sold:
Beginning inventory $ 100,000
Purchases, net 800,000
Goods available for sale 900,000
Ending inventory 125,000
Cost of goods sold $ 775,000
Inventory Cost FlowInventory Cost Flow
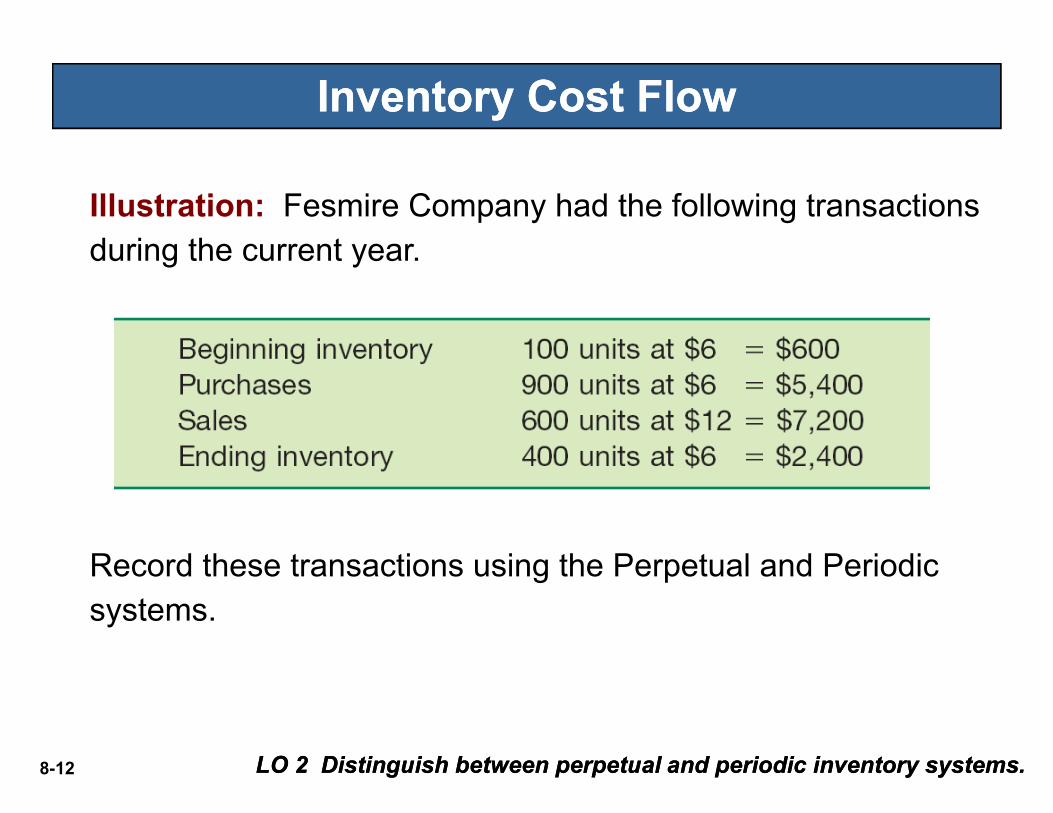
Illustration: Fesmire Company had the following transactions during the current year.
8-12 LO 2 Distinguish between perpetual and periodic inventory systems.LO 2 Distinguish between perpetual and periodic inventory systems.
Record these transactions using the Perpetual and Periodic systems.
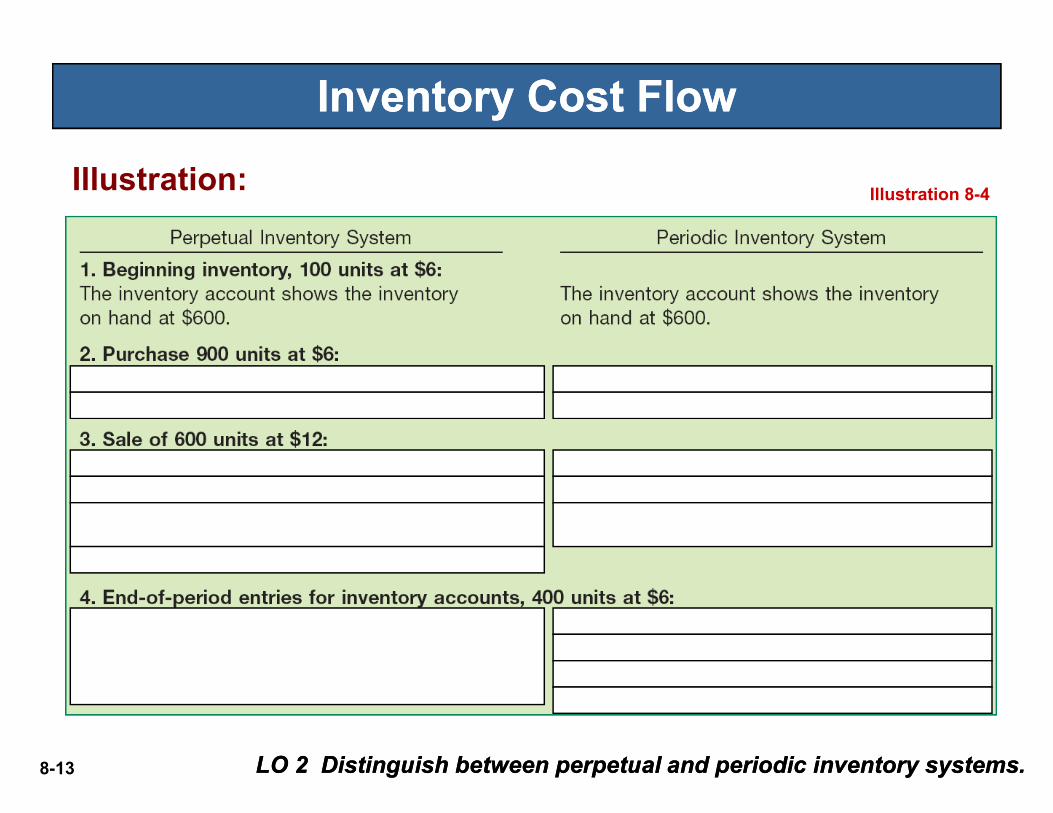
Inventory Cost FlowInventory Cost Flow
Illustration 8-4Illustration:
8-13 LO 2 Distinguish between perpetual and periodic inventory systems.LO 2 Distinguish between perpetual and periodic inventory systems.
Inventory Cost FlowInventory Cost Flow
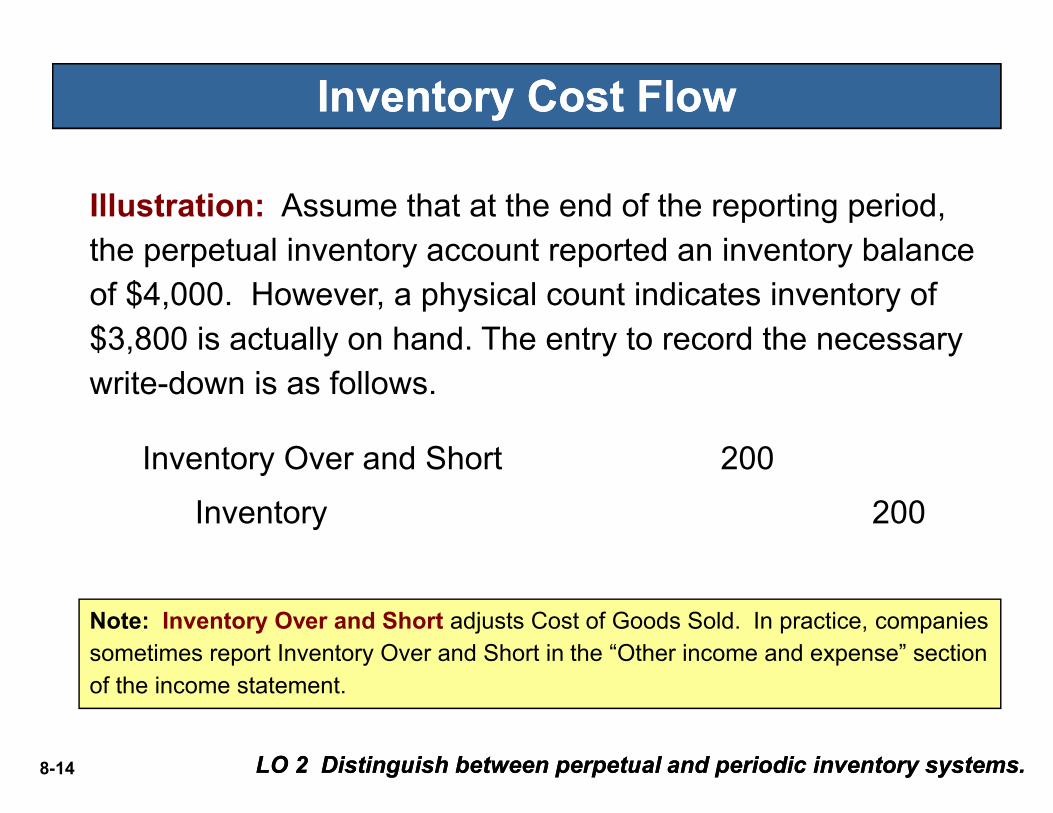
Illustration: Assume that at the end of the reporting period, the perpetual inventory account reported an inventory balance of $4,000. However, a physical count indicates inventory of $3,800 is actually on hand. The entry to record the necessary write-down is as follows.
8-14 LO 2 Distinguish between perpetual and periodic inventory systems.LO 2 Distinguish between perpetual and periodic inventory systems.
Inventory Over and Short 200
Inventory 200
Note: Inventory Over and Short adjusts Cost of Goods Sold. In practice, companies sometimes report Inventory Over and Short in the “Other income and expense” section of the income statement.

Inventory Control
Inventory IssuesInventory Issues
All companies need periodic verification of the inventory
records by actual count, weight, or measurement, with the
counts compared with the detailed inventory records.
8-15 LO 2 Distinguish between perpetual and periodic inventory systems.LO 2 Distinguish between perpetual and periodic inventory systems.
Companies should take the physical inventory near the
end of their fiscal year, to properly report inventory
quantities in their annual accounting reports.

Inventory IssuesInventory Issues
Basic Issues in Inventory Valuation
Companies must allocate the cost of all the goods available for sale (or use) between the goods that were sold or used and those that are still on hand.
8-16 LO 2 Distinguish between perpetual and periodic inventory systems.LO 2 Distinguish between perpetual and periodic inventory systems.
Illustration 8-5

Basic Issues in Inventory ValuationBasic Issues in Inventory Valuation
The physical goods (goods on hand, goods in transit,
consigned goods, special sales agreements).
The costs to include (product vs. period costs).
Valuation requires determining
8-17 LO 2 Distinguish between perpetual and periodic inventory systems.LO 2 Distinguish between perpetual and periodic inventory systems.
The costs to include (product vs. period costs).
The cost flow assumption (specific Identification,
average cost, FIFO, retail, etc.).

A company should record purchases when it obtains legal title to the goods.
Physical Goods Included in InventoryPhysical Goods Included in Inventory
Illustration 8-6
8-18 LO 2 Distinguish between perpetual and periodic inventory systems.LO 2 Distinguish between perpetual and periodic inventory systems.

Physical Goods Included in InventoryPhysical Goods Included in Inventory
Effect of Inventory Errors
Illustration 8-7
Ending Inventory Misstated
8-19 LO 3 Identify the effects of inventory errors on the financial statements.LO 3 Identify the effects of inventory errors on the financial statements.
The effect of an error on net income in one year (2010) will be counterbalanced in the next (2011), however the income statement will be misstated for both years.
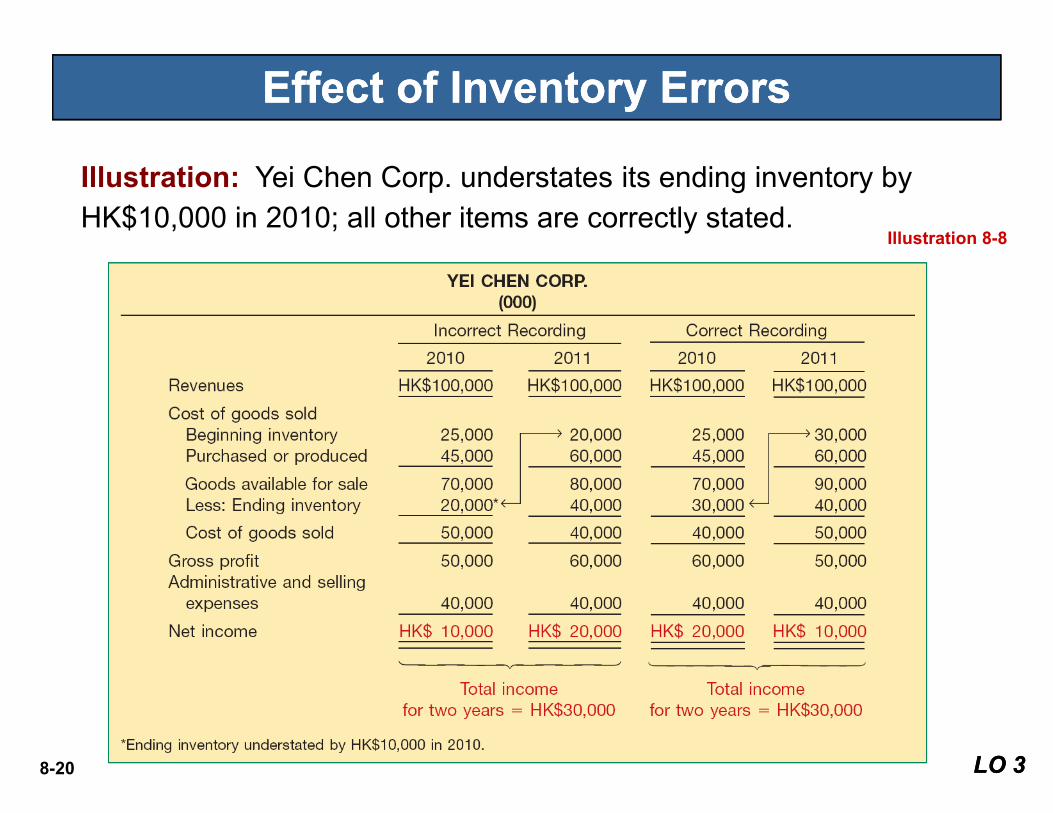
Effect of Inventory ErrorsEffect of Inventory Errors
Illustration: Yei Chen Corp. understates its ending inventory by HK$10,000 in 2010; all other items are correctly stated.
Illustration 8-8
8-20 LO 3LO 3
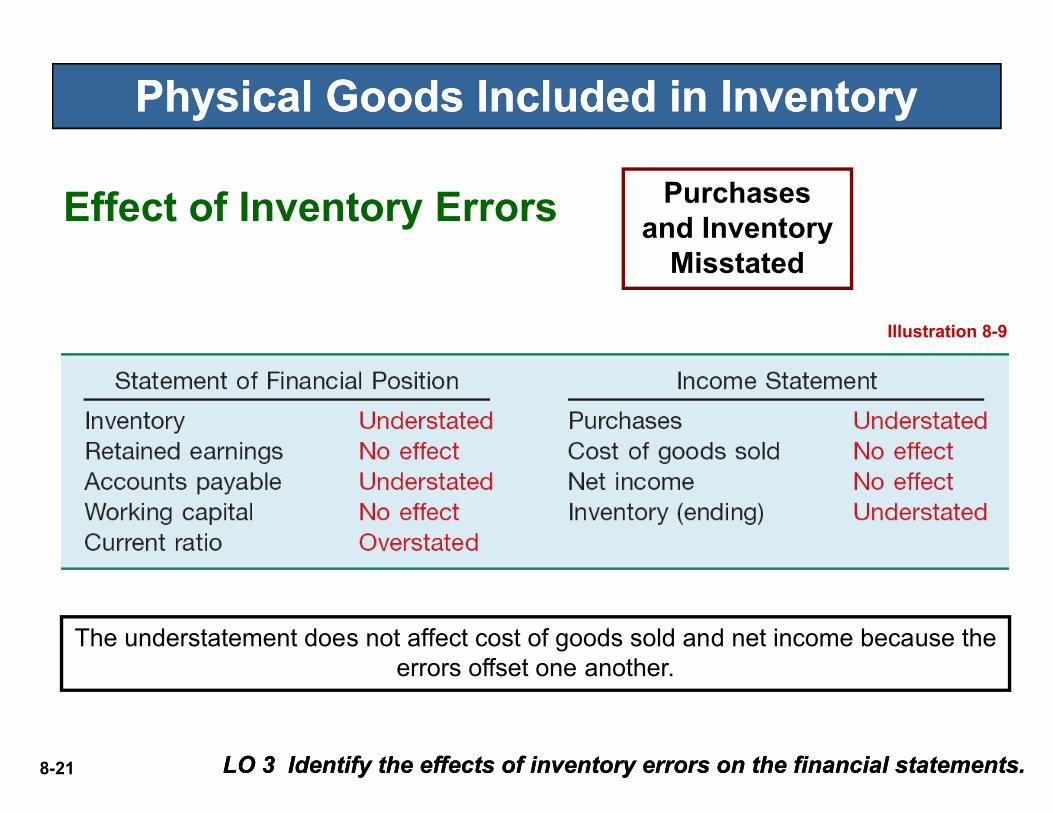
Physical Goods Included in InventoryPhysical Goods Included in Inventory
Effect of Inventory Errors
Illustration 8-9
Purchases and Inventory
Misstated
8-21 LO 3 Identify the effects of inventory errors on the financial statements.LO 3 Identify the effects of inventory errors on the financial statements.
The understatement does not affect cost of goods sold and net income because the errors offset one another.

Costs Included in InventoryCosts Included in Inventory
Product Costs - costs directly connected with
bringing the goods to the buyer’s place of business
and converting such goods to a salable condition.
Period Costs – generally selling, general, and
8-22 LO 4 Understand the items to include as inventory cost.LO 4 Understand the items to include as inventory cost.
Period Costs – generally selling, general, and
administrative expenses.
Treatment of Purchase Discounts – Gross vs.
Net Method
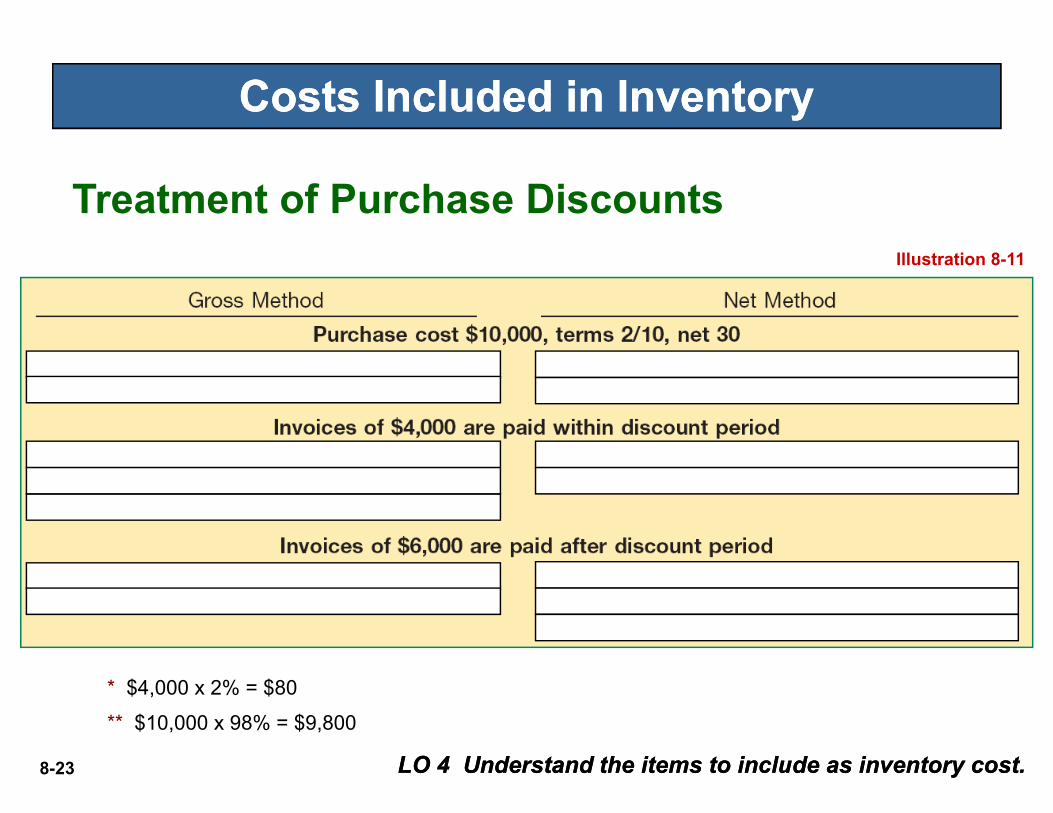
Costs Included in InventoryCosts Included in Inventory
Treatment of Purchase DiscountsIllustration 8-11
**
8-23 LO 4 Understand the items to include as inventory cost.LO 4 Understand the items to include as inventory cost.
* $4,000 x 2% = $80
*
** $10,000 x 98% = $9,800

Cost Flow Assumption Adopted
does not need to equal
Which Cost Flow Assumption to Adopt?Which Cost Flow Assumption to Adopt?
Specific Identification --- Average Cost --- LIFO
8-24
Method adopted should be one that most clearly reflects periodic income.
does not need to equal
Physical Movement of Goods
LO 5 Describe and compare the methods used to price inventories.LO 5 Describe and compare the methods used to price inventories.
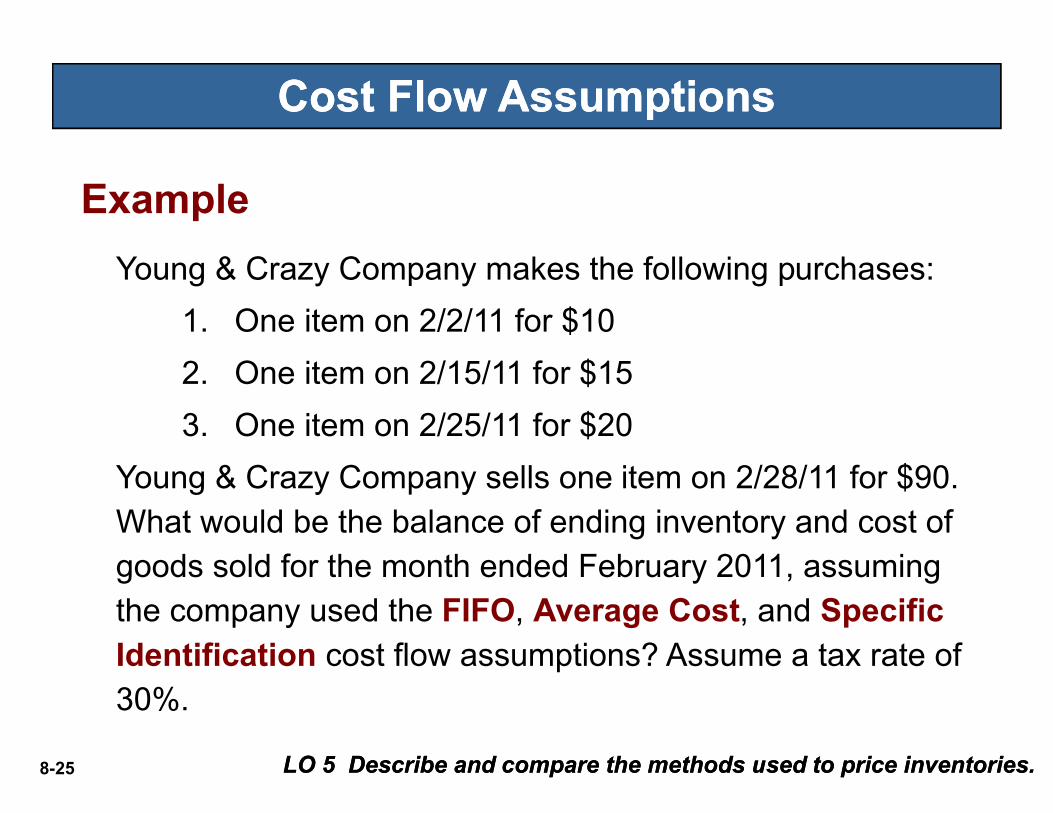
Young & Crazy Company makes the following purchases:
1. One item on 2/2/11 for $10
2. One item on 2/15/11 for $15
Example
Cost Flow AssumptionsCost Flow Assumptions
8-25
3. One item on 2/25/11 for $20
Young & Crazy Company sells one item on 2/28/11 for $90. What would be the balance of ending inventory and cost of goods sold for the month ended February 2011, assuming the company used the FIFO, Average Cost, and Specific Identification cost flow assumptions? Assume a tax rate of 30%.
LO 5 Describe and compare the methods used to price inventories.LO 5 Describe and compare the methods used to price inventories.
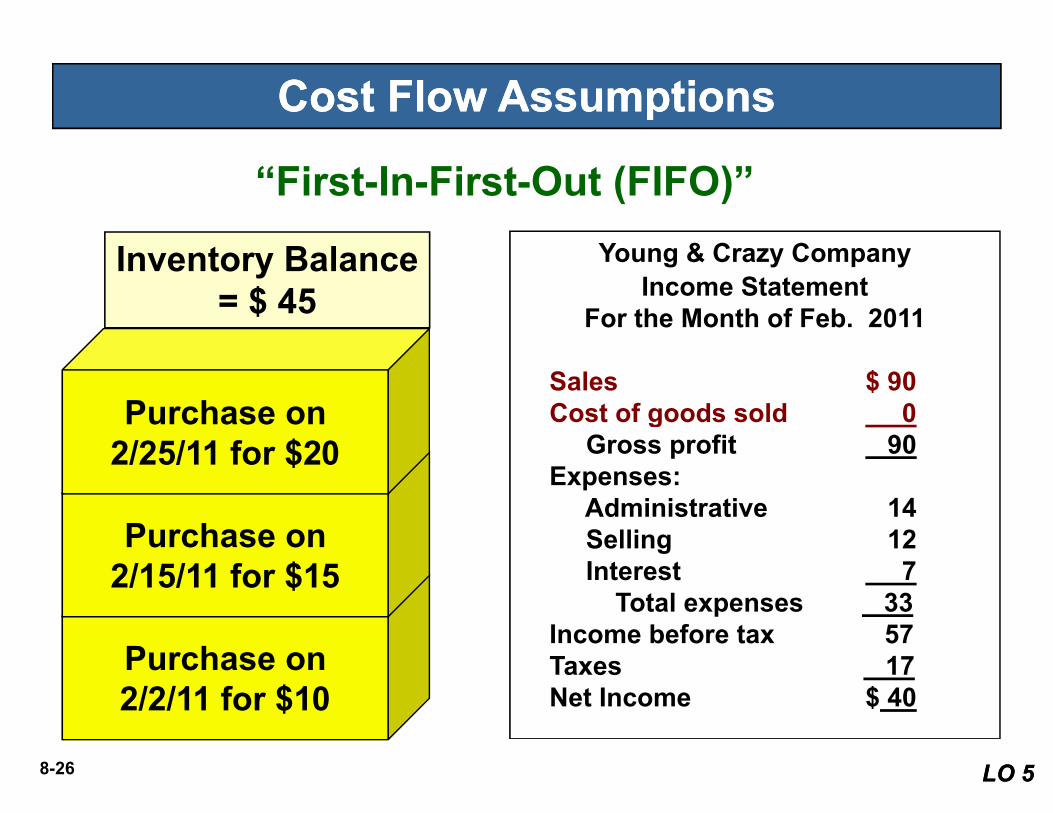
Purchase on
Inventory Balance = $ 45
Young & Crazy CompanyIncome Statement
For the Month of Feb. 2011
Sales $ 90Cost of goods sold 0
Cost Flow AssumptionsCost Flow Assumptions
“First-In-First-Out (FIFO)”
8-26
Purchase on 2/2/11 for $10
Purchase on 2/15/11 for $15
Purchase on 2/25/11 for $20
Cost of goods sold 0Gross profit 90
Expenses:Administrative 14Selling 12Interest 7
Total expenses 33Income before tax 57Taxes 17 Net Income $ 40
LO 5LO 5
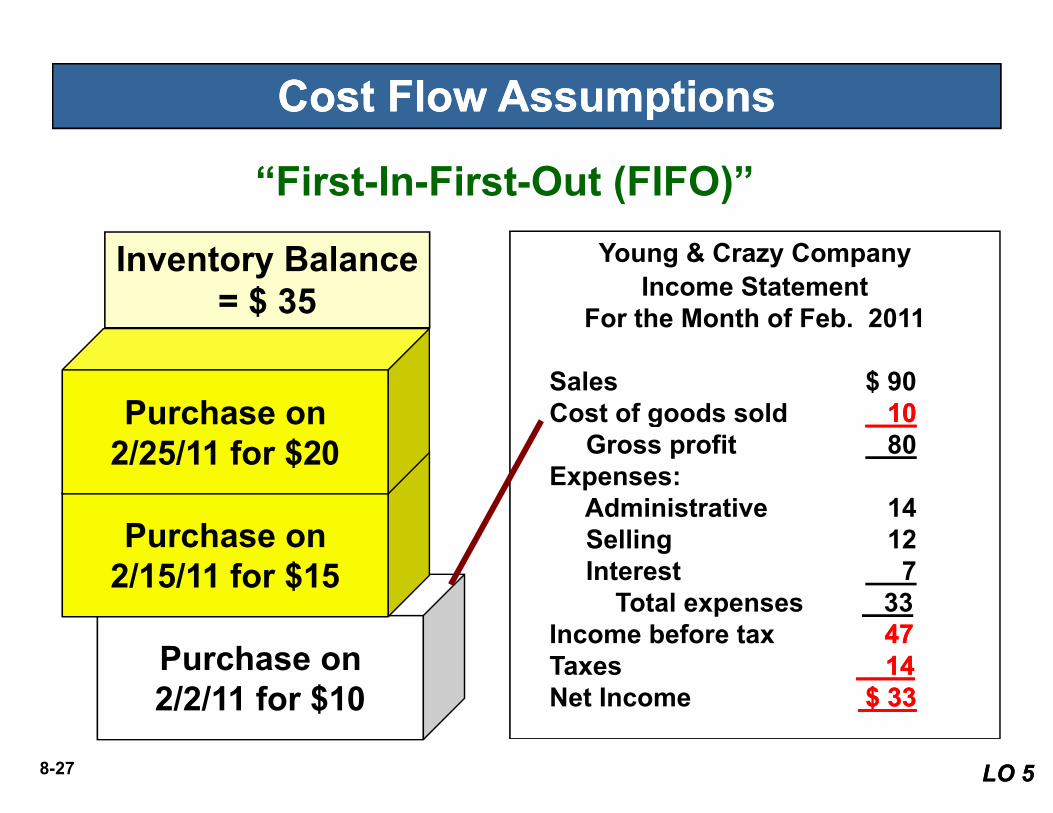
Purchase on
Cost Flow AssumptionsCost Flow Assumptions
Inventory Balance = $ 35
Young & Crazy CompanyIncome Statement
For the Month of Feb. 2011
Sales $ 90Cost of goods sold 1010
“First-In-First-Out (FIFO)”
8-27
Purchase on 2/2/11 for $10
Purchase on 2/15/11 for $15
Purchase on 2/25/11 for $20
Cost of goods sold 1010Gross profit 80
Expenses:Administrative 14Selling 12Interest 7
Total expenses 33Income before tax 4747Taxes 14 14 Net Income $ 33$ 33
LO 5LO 5
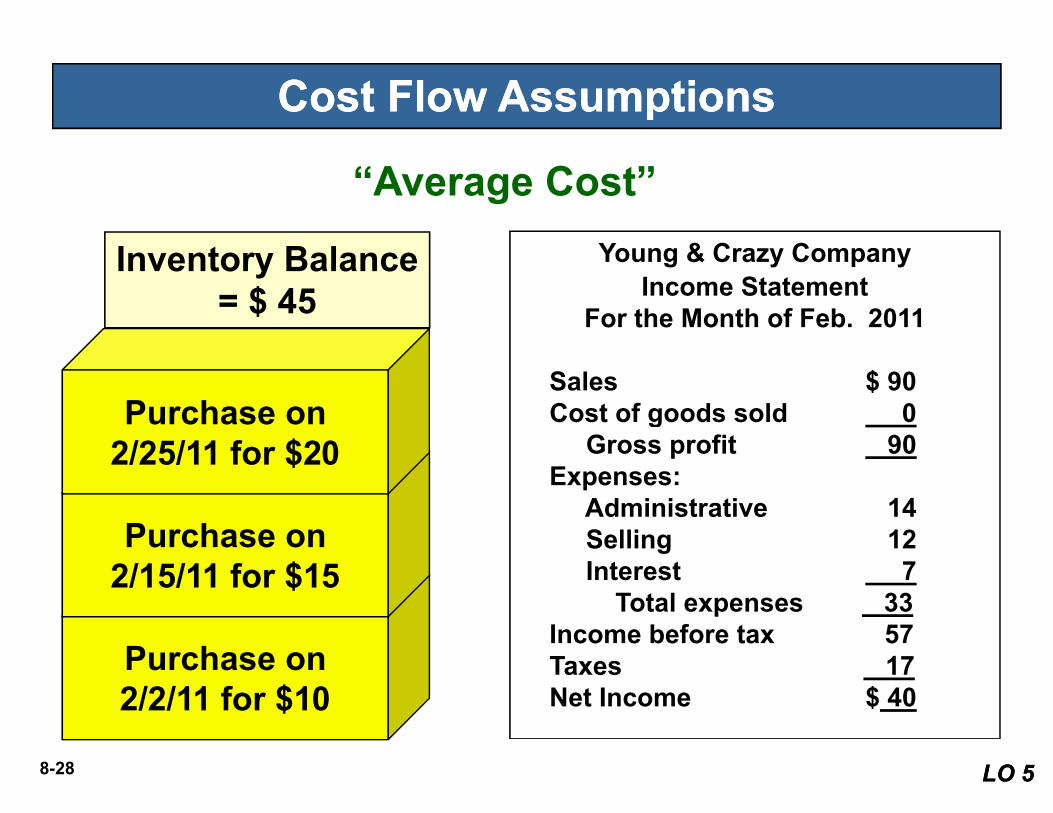
Purchase on
Inventory Balance = $ 45
Young & Crazy CompanyIncome Statement
For the Month of Feb. 2011
Sales $ 90Cost of goods sold 0
Cost Flow AssumptionsCost Flow Assumptions
“Average Cost”
8-28
Purchase on 2/2/11 for $10
Purchase on 2/15/11 for $15
Purchase on 2/25/11 for $20
Cost of goods sold 0Gross profit 90
Expenses:Administrative 14Selling 12Interest 7
Total expenses 33Income before tax 57Taxes 17 Net Income $ 40
LO 5LO 5
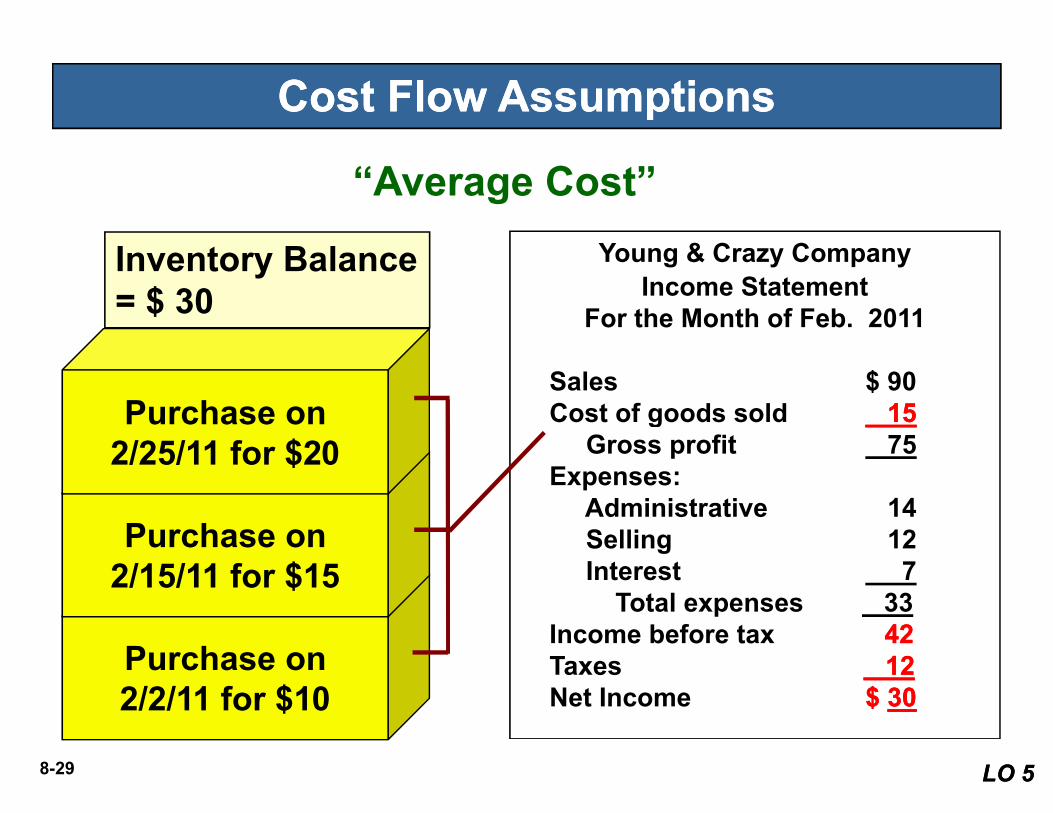
Purchase on
Inventory Balance = $ 30
Cost Flow AssumptionsCost Flow Assumptions
Young & Crazy CompanyIncome Statement
For the Month of Feb. 2011
Sales $ 90Cost of goods sold 1515
“Average Cost”
8-29
Purchase on 2/2/11 for $10
Purchase on 2/15/11 for $15
Purchase on 2/25/11 for $20
Cost of goods sold 1515Gross profit 75
Expenses:Administrative 14Selling 12Interest 7
Total expenses 33Income before tax 4242Taxes 12 12 Net Income $ $ 3030
LO 5LO 5
Purchase on
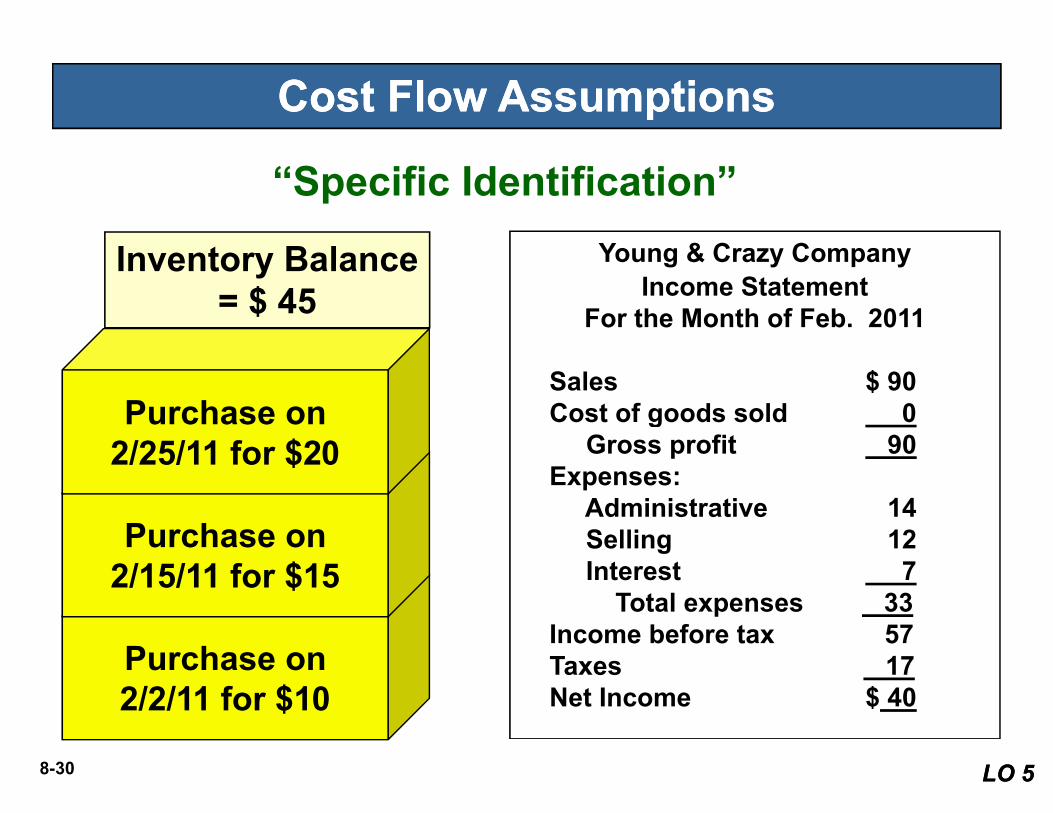
Inventory Balance = $ 45
Young & Crazy CompanyIncome Statement
For the Month of Feb. 2011
Sales $ 90Cost of goods sold 0
Cost Flow AssumptionsCost Flow Assumptions
“Specific Identification”
8-30
Purchase on 2/2/11 for $10
Purchase on 2/15/11 for $15
Purchase on 2/25/11 for $20
Cost of goods sold 0Gross profit 90
Expenses:Administrative 14Selling 12Interest 7
Total expenses 33Income before tax 57Taxes 17 Net Income $ 40
LO 5LO 5

Young & Crazy CompanyIncome Statement
For the Month of Feb. 2011
Sales $ 90Cost of goods sold 0
Depends which one is soldDepends which one is sold
Purchase on
Inventory Balance = $ 45
Cost Flow AssumptionsCost Flow Assumptions
“Specific Identification”
8-31
Cost of goods sold 0Gross profit 90
Expenses:Administrative 14Selling 12Interest 7
Total expenses 33Income before tax 57Taxes 17 Net Income $ 40
Purchase on 2/2/11 for $10
Purchase on 2/15/11 for $15
Purchase on 2/25/11 for $20
LO 5LO 5

Financial Statement Summary
FIFO AverageSales 90$ 90$ Cost of goods sold 10 15
Gross profit 80 75 Operating expenses:
Cost Flow AssumptionsCost Flow Assumptions
8-32
Operating expenses:Administrative 14 14 Selling 12 12 Interest 7 7
Total expenses 33 33 Income before taxes 47 42 Income tax expense 14 12 Net income 33$ 30$
Inventory Balance 3035
LO 5LO 5
Cost Flow AssumptionsCost Flow Assumptions
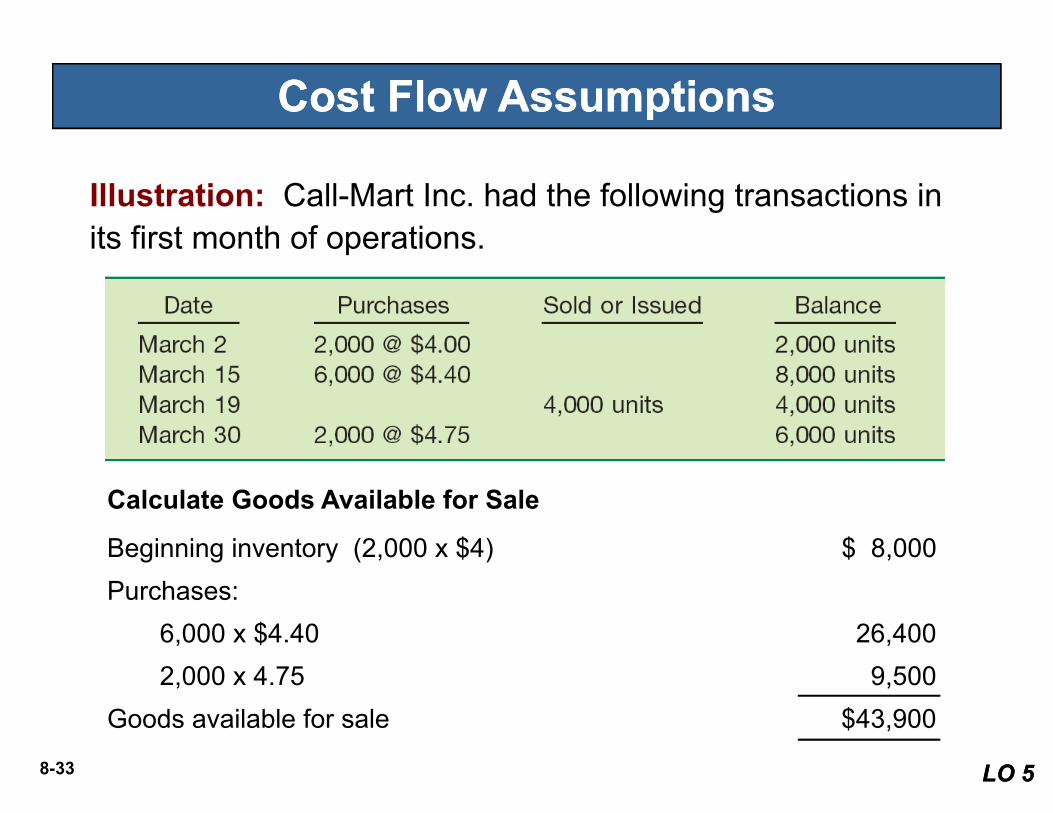
Illustration: Call-Mart Inc. had the following transactions in its first month of operations.
8-33 LO 5LO 5
Beginning inventory (2,000 x $4) $ 8,000
Purchases:
6,000 x $4.40 26,400
2,000 x 4.75 9,500
Goods available for sale $43,900
Calculate Goods Available for Sale
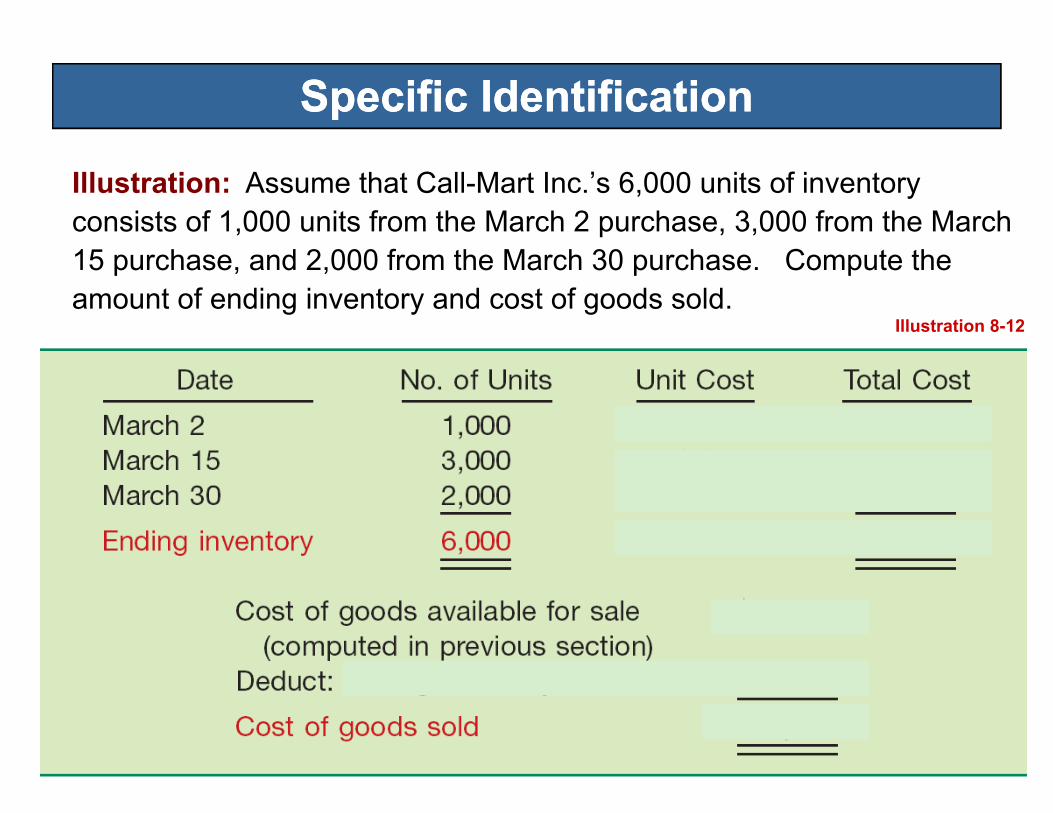
Specific IdentificationSpecific Identification
Illustration: Assume that Call-Mart Inc.’s 6,000 units of inventory consists of 1,000 units from the March 2 purchase, 3,000 from the March 15 purchase, and 2,000 from the March 30 purchase. Compute the amount of ending inventory and cost of goods sold.
Illustration 8-12
8-34

Average CostAverage Cost
Illustration 8-13Weighted-Average
8-35 LO 5 Describe and compare the methods used to price inventories.LO 5 Describe and compare the methods used to price inventories.
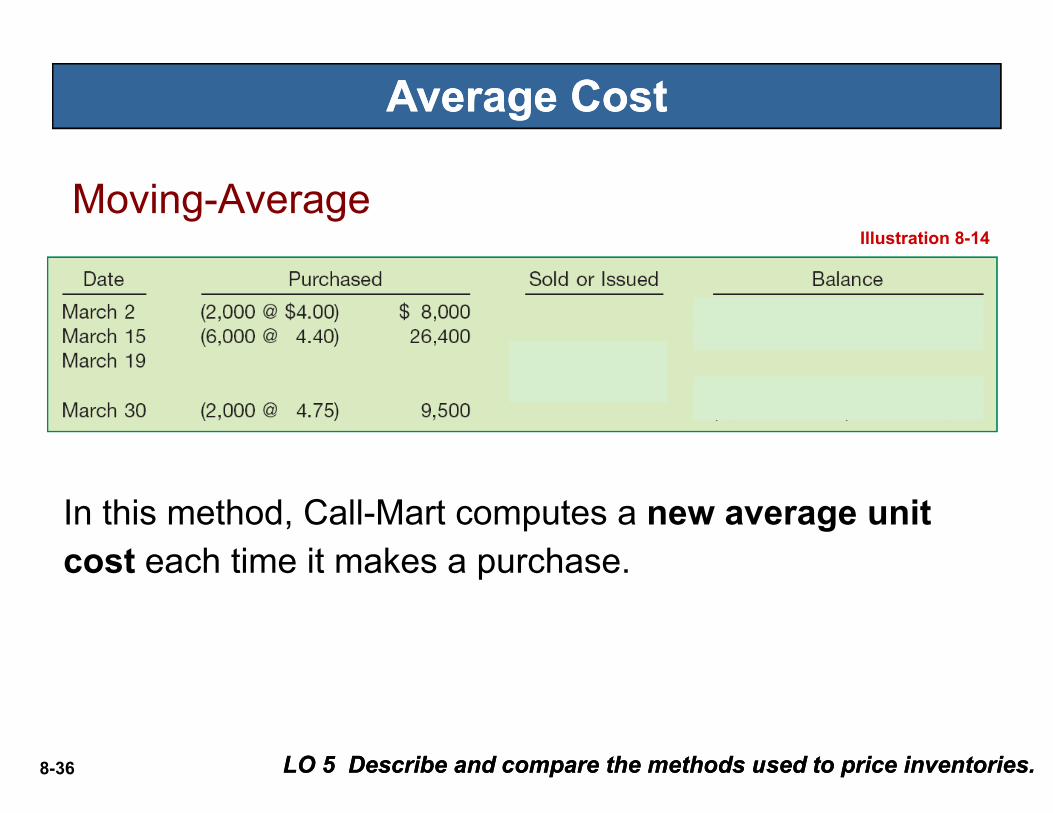
Average CostAverage Cost
Illustration 8-14
Moving-Average
8-36
In this method, Call-Mart computes a new average unit cost each time it makes a purchase.
LO 5 Describe and compare the methods used to price inventories.LO 5 Describe and compare the methods used to price inventories.
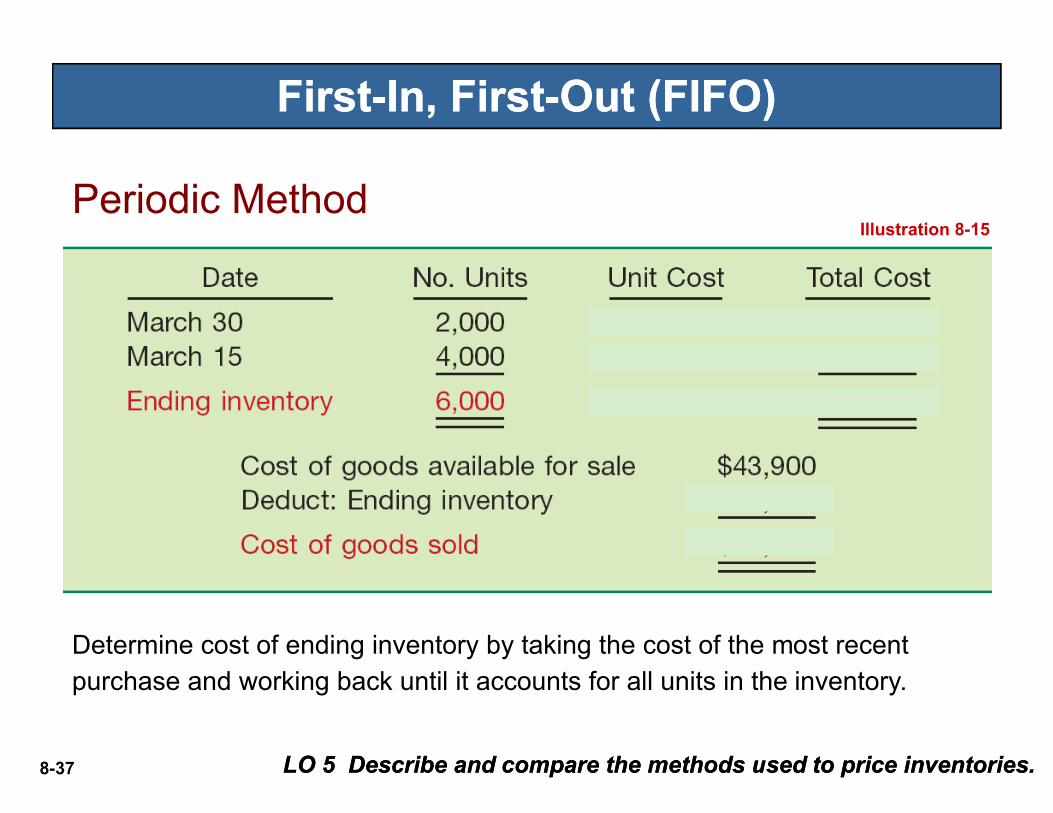
FirstFirst--In, FirstIn, First--Out (FIFO)Out (FIFO)
Illustration 8-15Periodic Method
8-37
Determine cost of ending inventory by taking the cost of the most recent purchase and working back until it accounts for all units in the inventory.
LO 5 Describe and compare the methods used to price inventories.LO 5 Describe and compare the methods used to price inventories.
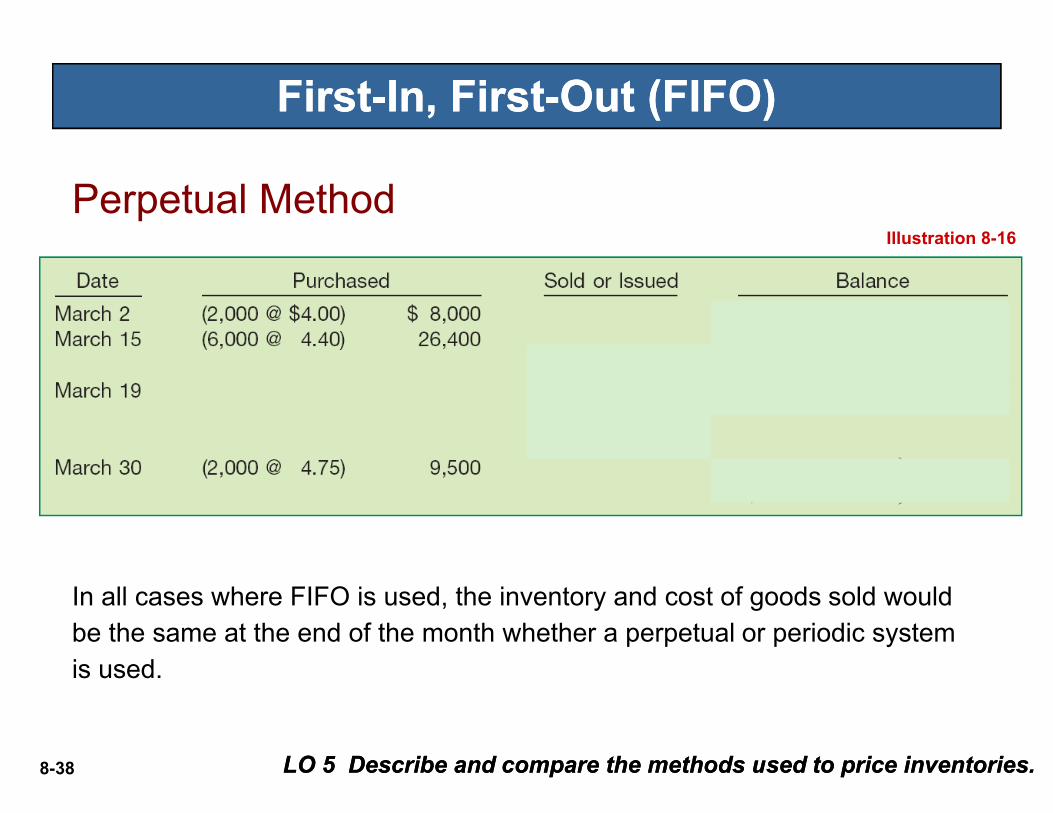
FirstFirst--In, FirstIn, First--Out (FIFO)Out (FIFO)
Illustration 8-16
Perpetual Method
8-38
In all cases where FIFO is used, the inventory and cost of goods sold would be the same at the end of the month whether a perpetual or periodic system is used.
LO 5 Describe and compare the methods used to price inventories.LO 5 Describe and compare the methods used to price inventories.

Inventory Valuation Methods Inventory Valuation Methods -- SummarySummary
Illustration 8-17
8-39 LO 5 Describe and compare the methods used to price inventories.LO 5 Describe and compare the methods used to price inventories.

Inventory Valuation Methods Inventory Valuation Methods -- SummarySummary
Illustration 8-18Balances of Selected Items under Alternative Inventory Valuation Methods
8-40 LO 5 Describe and compare the methods used to price inventories.LO 5 Describe and compare the methods used to price inventories.
Under IFRS, LIFO is not permitted for financial reporting
purposes.
Nonetheless, LIFO is permitted for financial reporting
purposes in the United States, it is permitted for tax purposes
8-41 LO 6 Describe the LIFO cost flow assumption.LO 6 Describe the LIFO cost flow assumption.
purposes in the United States, it is permitted for tax purposes
in some countries, and its use can result in significant tax
savings.

Illustration: Call-Mart Inc. had the following transactions in its first month of operations.
LastLast--In, FirstIn, First--Out (LIFO)Out (LIFO)
8-42 LO 6LO 6
Beginning inventory (2,000 x $4) $ 8,000
Purchases:
6,000 x $4.40 26,400
2,000 x 4.75 9,500
Goods available for sale $43,900
Calculate Goods Available for Sale
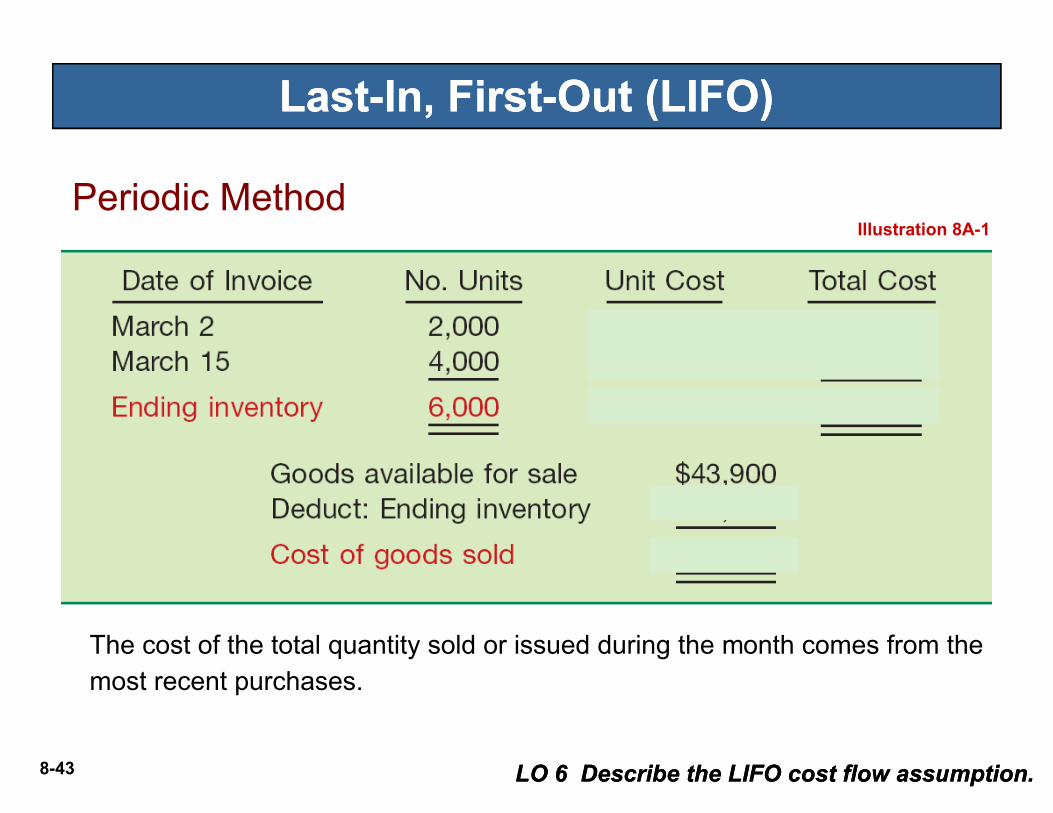
LastLast--In, FirstIn, First--Out (LIFO)Out (LIFO)
Illustration 8A-1
Periodic Method
8-43
The cost of the total quantity sold or issued during the month comes from the most recent purchases.
LO 6 Describe the LIFO cost flow assumption.LO 6 Describe the LIFO cost flow assumption.

LastLast--In, FirstIn, First--Out (LIFO)Out (LIFO)
Illustration 8A-2
Perpetual Method
8-44
The LIFO method results in different ending inventory and cost of goods sold amounts than the amounts calculated under the periodic method.
LO 6 Describe the LIFO cost flow assumption.LO 6 Describe the LIFO cost flow assumption.
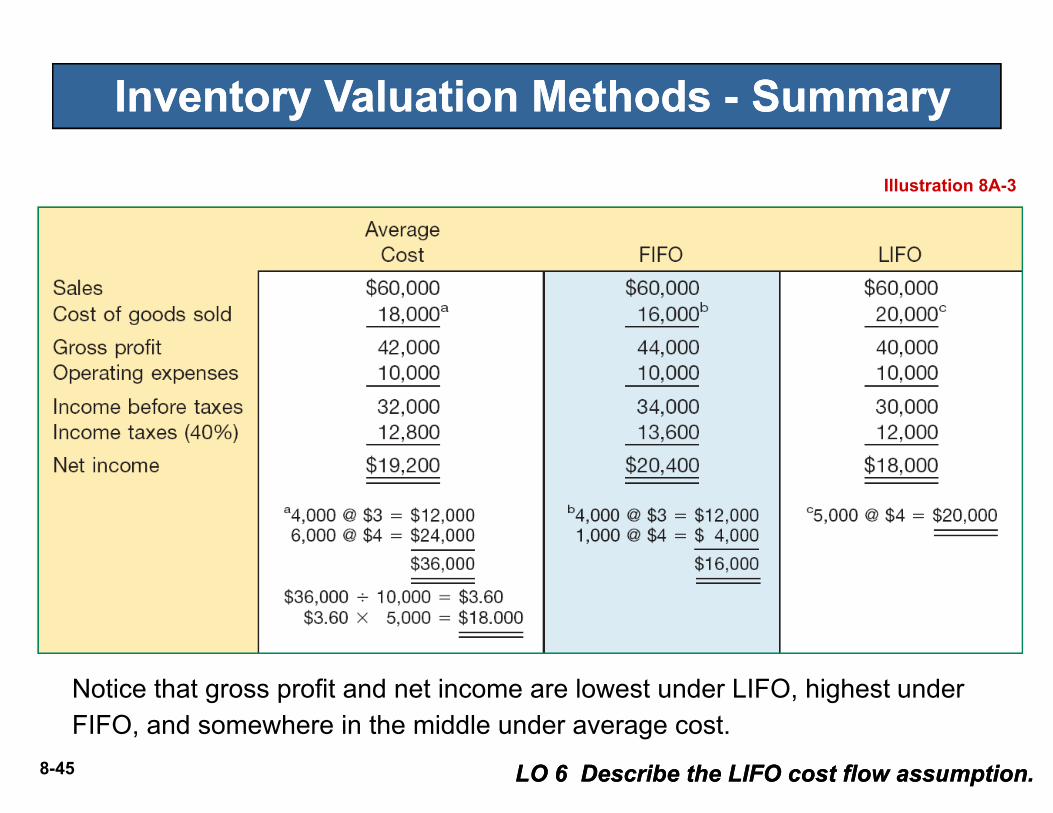
Illustration 8A-3
Inventory Valuation Methods Inventory Valuation Methods -- SummarySummary
8-45
Notice that gross profit and net income are lowest under LIFO, highest under FIFO, and somewhere in the middle under average cost.
LO 6 Describe the LIFO cost flow assumption.LO 6 Describe the LIFO cost flow assumption.
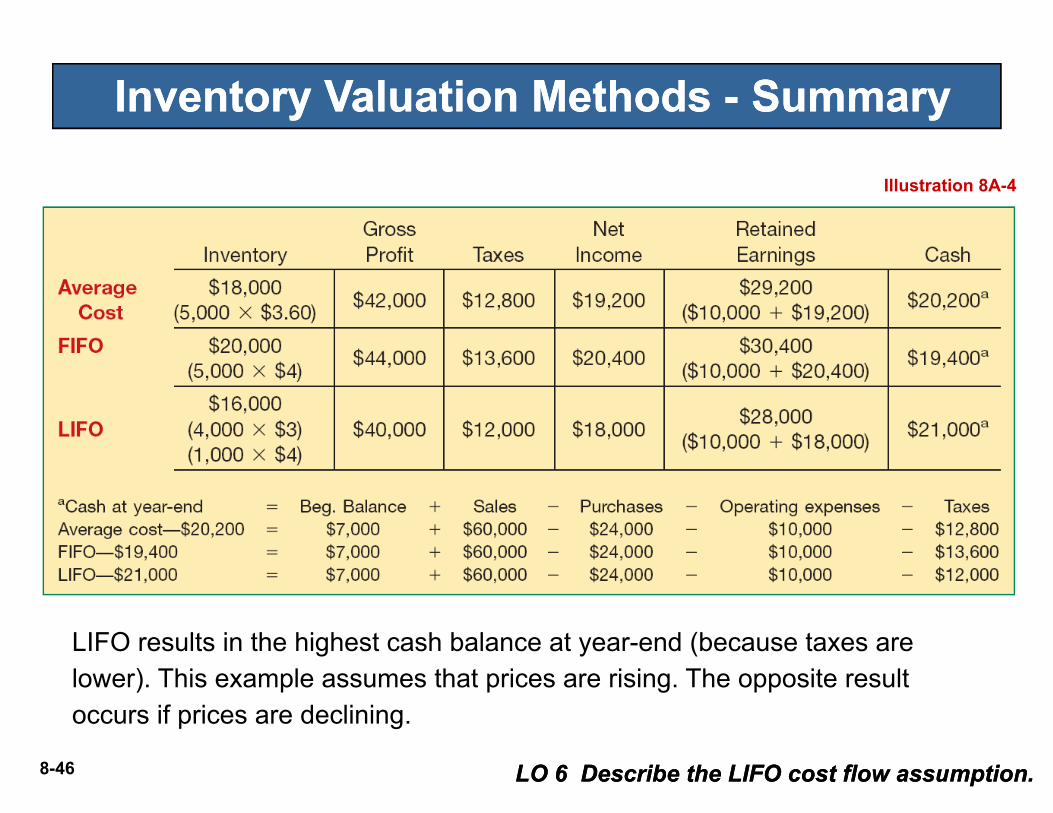
Illustration 8A-4
Inventory Valuation Methods Inventory Valuation Methods -- SummarySummary
8-46
LIFO results in the highest cash balance at year-end (because taxes arelower). This example assumes that prices are rising. The opposite result occurs if prices are declining.
LO 6 Describe the LIFO cost flow assumption.LO 6 Describe the LIFO cost flow assumption.
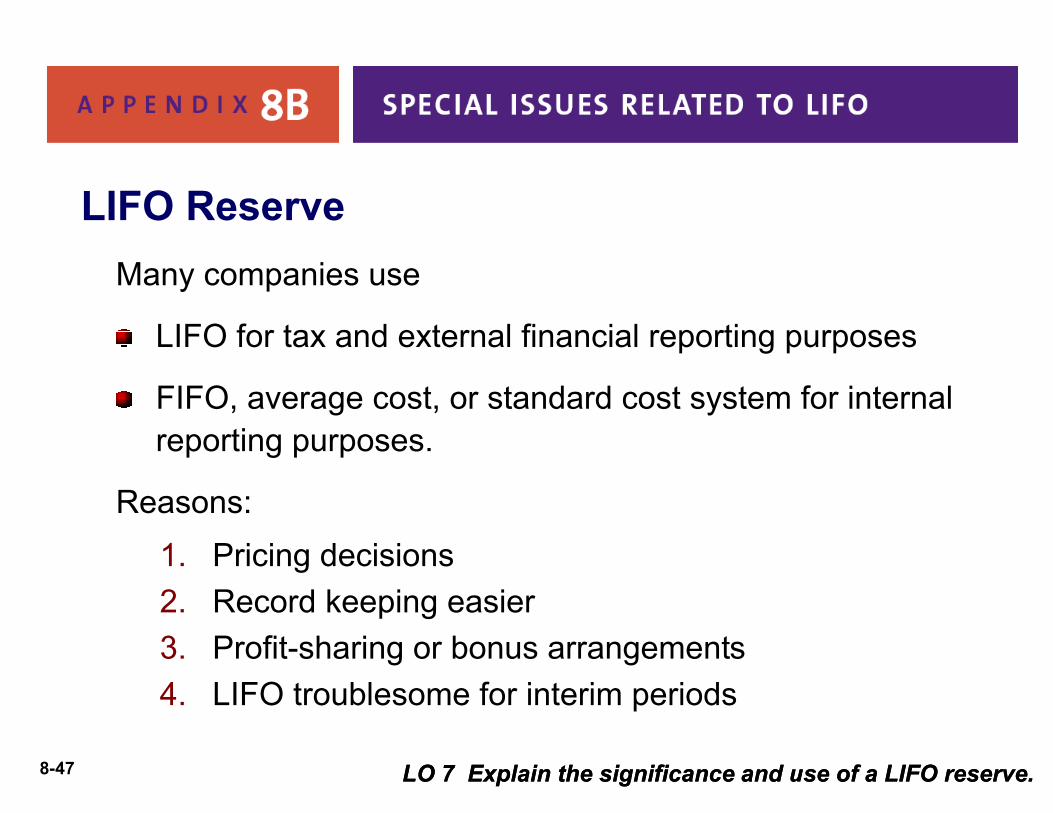
Many companies use
LIFO for tax and external financial reporting purposes
FIFO, average cost, or standard cost system for internal
LIFO Reserve
8-47
FIFO, average cost, or standard cost system for internal reporting purposes.
Reasons:
1. Pricing decisions
2. Record keeping easier
3. Profit-sharing or bonus arrangements
4. LIFO troublesome for interim periods
LO 7 Explain the significance and use of a LIFO reserve.LO 7 Explain the significance and use of a LIFO reserve.

LIFO Reserve is the difference between the inventory method used for internal reporting purposes and LIFO.
Illustration: Acme Boot Company uses the FIFO method for internalreporting purposes and LIFO for external reporting purposes. At January 1, 2011, the Allowance to Reduce Inventory to LIFO balance is
8-48
Cost of goods sold 30,000
Allowance to reduce inventory to LIFO 30,000
Journal entry to reduce inventory to LIFO:
$20,000. At December 31, 2011, the balance should be $50,000. As a result, Acme Boot realizes a LIFO effect and makes the following entry at year-end.
LO 7 Explain the significance and use of a LIFO reserve.LO 7 Explain the significance and use of a LIFO reserve.

Older, low cost inventory is sold resulting in a lower cost of goods sold, higher net income, and higher taxes.
LIFO Liquidation
Illustration: Basler Co. has 30,000 pounds of steel in its
8-49
Illustration: Basler Co. has 30,000 pounds of steel in its inventory on December 31, 2011, with cost determined on a specific-goods LIFO approach.
LO 8 Understand the effect of LIFO liquidations.LO 8 Understand the effect of LIFO liquidations.
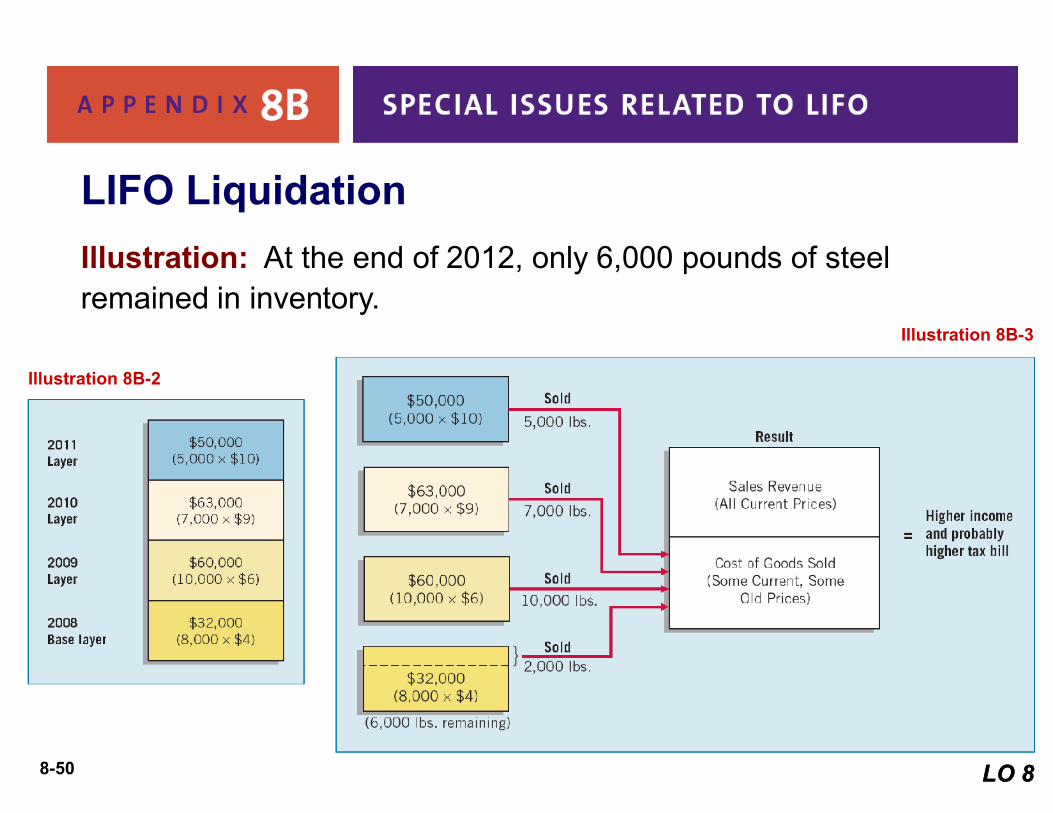
Illustration: At the end of 2012, only 6,000 pounds of steel remained in inventory.
LIFO Liquidation
Illustration 8B-3
Illustration 8B-2
8-50 LO 8LO 8

Changes in a pool are measured in terms of total dollar
value, not physical quantity.
Advantage:
Dollar-Value LIFO
8-51
Advantage:
Broader range of goods in pool.
Permits replacement of goods that are similar.
Helps protect LIFO layers from erosion.
LO 9 Explain the dollarLO 9 Explain the dollar--value LIFO method.value LIFO method.
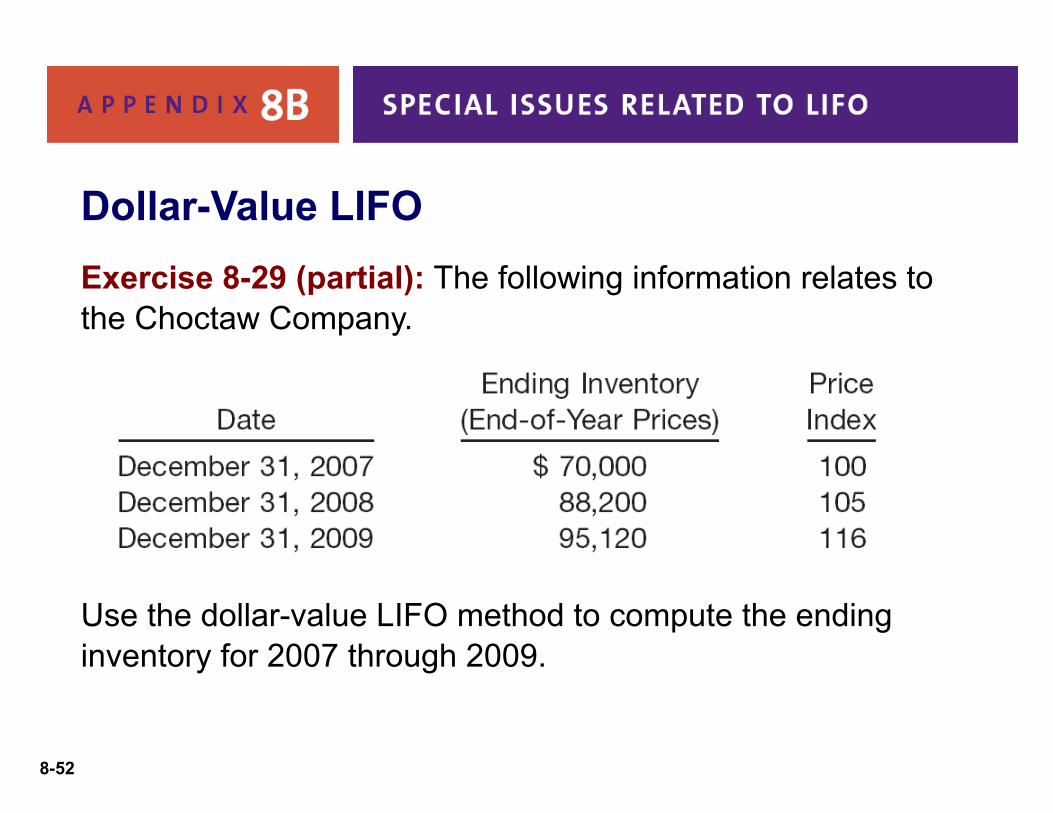
Exercise 8-29 (partial): The following information relates to the Choctaw Company.
Dollar-Value LIFO
8-52
Use the dollar-value LIFO method to compute the ending inventory for 2007 through 2009.

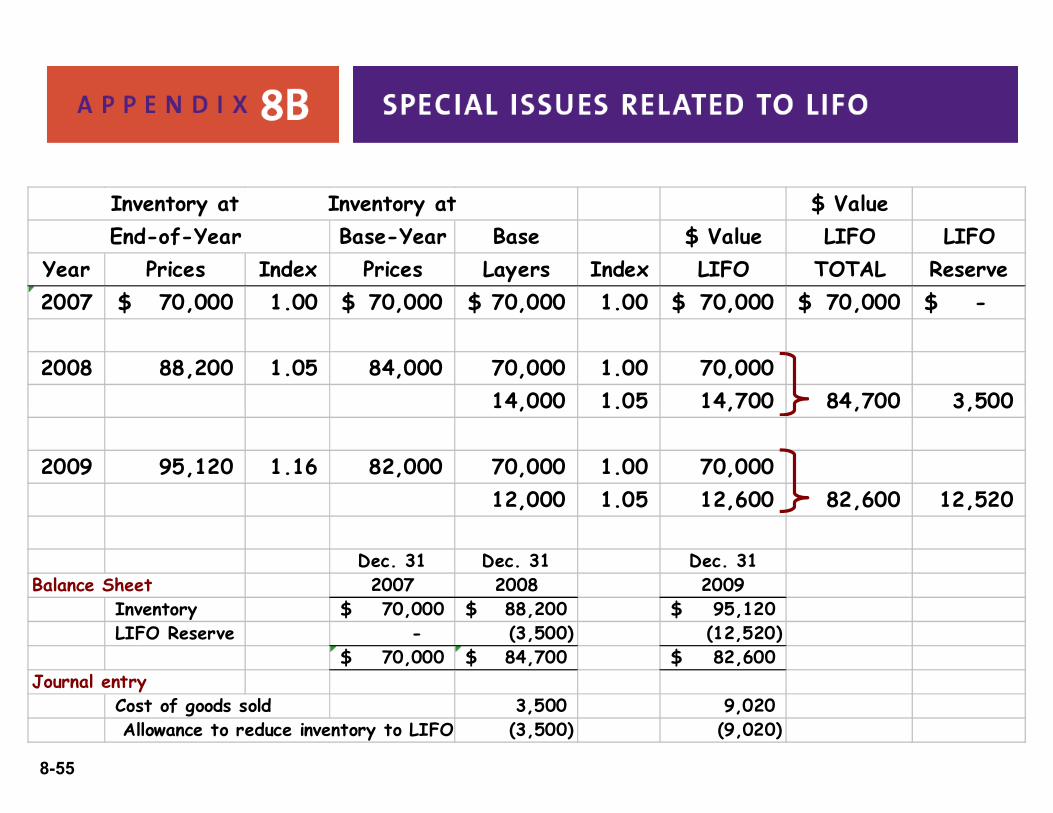
Inventory at Inventory at $ ValueEnd-of-Year Base-Year Base $ Value LIFO LIFO
Year Prices Index Prices Layers Index LIFO TOTAL Reserve2007 70,000$ 1.00 70,000$ 70,000$ 1.00 70,000$ 70,000$ -$
2008 88,200 1.05 84,000 70,000 1.00 70,000 14,000 1.05 14,700 84,700 3,500
8-53
14,000 1.05 14,700 84,700 3,500
2009 95,120 1.16 82,000 70,000 1.00 70,000 12,000 1.05 12,600 82,600 12,520
Dec. 31 Dec. 31 Dec. 31Balance Sheet 2007 2008 2009
Inventory 70,000$ 88,200$ 95,120$ LIFO Reserve - (3,500) (12,520)
70,000$ 84,700$ 82,600$ Journal entry
3,500 9,020 (3,500) (9,020)

Inventory at Inventory at $ ValueEnd-of-Year Base-Year Base $ Value LIFO LIFO
Year Prices Index Prices Layers Index LIFO TOTAL Reserve2007 70,000$ 1.00 70,000$ 70,000$ 1.00 70,000$ 70,000$ -$
2008 88,200 1.05 84,000 70,000 1.00 70,000 14,000 1.05 14,700 84,700 3,500
8-54
14,000 1.05 14,700 84,700 3,500
2009 95,120 1.16 82,000 70,000 1.00 70,000 12,000 1.05 12,600 82,600 12,520
Dec. 31 Dec. 31 Dec. 31Balance Sheet 2007 2008 2009
Inventory 70,000$ 88,200$ 95,120$ LIFO Reserve - (3,500) (12,520)
70,000$ 84,700$ 82,600$ Journal entry
Cost of goods sold 3,500 9,020 Allowance to reduce inventory to LIFO (3,500) (9,020)
Inventory at Inventory at $ ValueEnd-of-Year Base-Year Base $ Value LIFO LIFO
Year Prices Index Prices Layers Index LIFO TOTAL Reserve2007 70,000$ 1.00 70,000$ 70,000$ 1.00 70,000$ 70,000$ -$
2008 88,200 1.05 84,000 70,000 1.00 70,000 14,000 1.05 14,700 84,700 3,500
8-55
14,000 1.05 14,700 84,700 3,500
2009 95,120 1.16 82,000 70,000 1.00 70,000 12,000 1.05 12,600 82,600 12,520
Dec. 31 Dec. 31 Dec. 31Balance Sheet 2007 2008 2009
Inventory 70,000$ 88,200$ 95,120$ LIFO Reserve - (3,500) (12,520)
70,000$ 84,700$ 82,600$ Journal entry
Cost of goods sold 3,500 9,020 Allowance to reduce inventory to LIFO (3,500) (9,020)

Specific-goods LIFO - costing goods on a unit basis is
expensive and time consuming.
Specific-goods Pooled LIFO approach
Comparison of LIFO Approaches
8-56
Specific-goods Pooled LIFO approach
reduces record keeping and clerical costs.
more difficult to erode the layers.
using quantities as measurement basis can lead to
untimely LIFO liquidations.
Dollar-value LIFO is used by most companies.
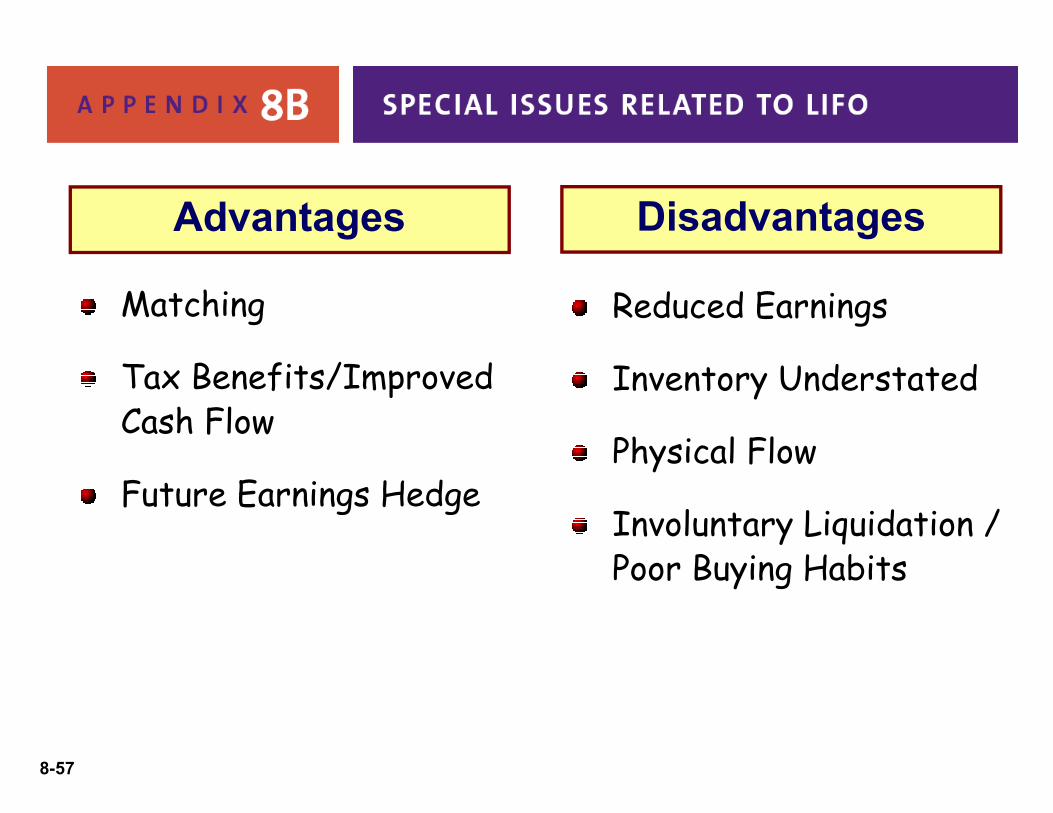
Matching
Tax Benefits/Improved Cash Flow
Advantages
Reduced Earnings
Inventory Understated
Disadvantages
8-57
Cash Flow
Future Earnings HedgePhysical Flow
Involuntary Liquidation / Poor Buying Habits
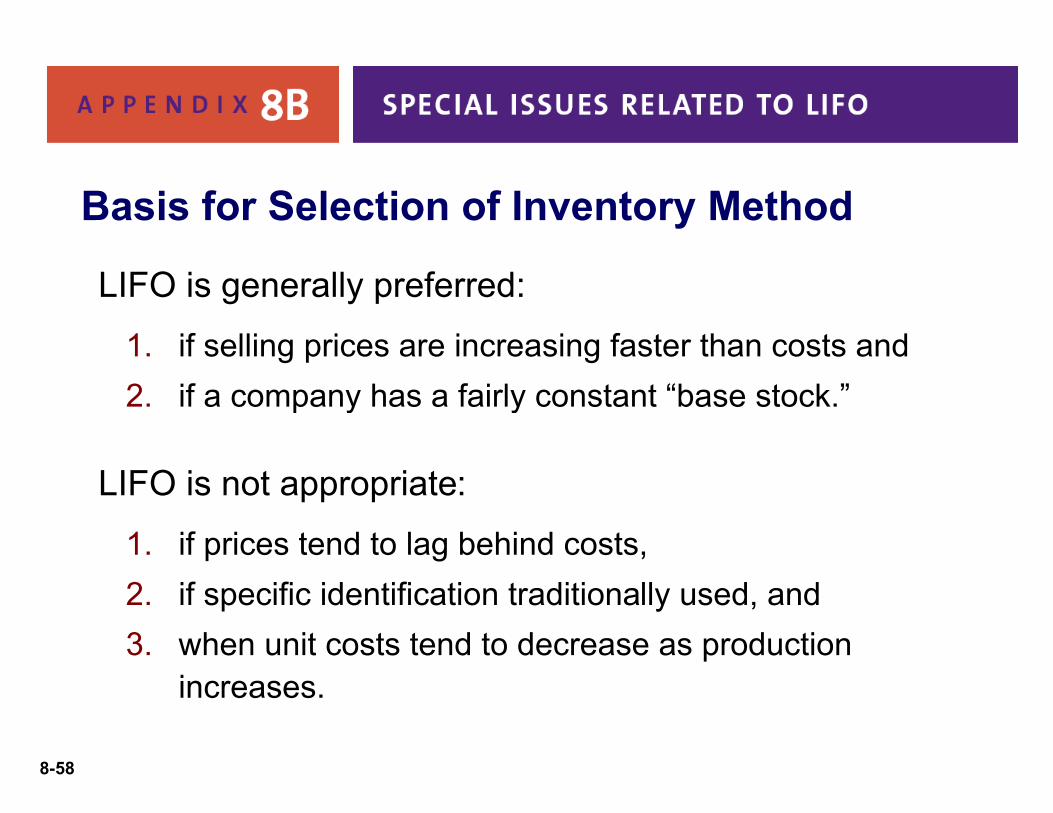
LIFO is generally preferred:
1. if selling prices are increasing faster than costs and
2. if a company has a fairly constant “base stock.”
Basis for Selection of Inventory Method
8-58
2. if a company has a fairly constant “base stock.”
LIFO is not appropriate:
1. if prices tend to lag behind costs,
2. if specific identification traditionally used, and
3. when unit costs tend to decrease as production increases.

Copyright © 2011 John Wiley & Sons, Inc. All rights reserved.
Reproduction or translation of this work beyond that permitted in
Section 117 of the 1976 United States Copyright Act without the
express written permission of the copyright owner is unlawful.
Request for further information should be addressed to the
CopyrightCopyright
8-59
Request for further information should be addressed to the
Permissions Department, John Wiley & Sons, Inc. The purchaser
may make back-up copies for his/her own use only and not for
distribution or resale. The Publisher assumes no responsibility for
errors, omissions, or damages, caused by the use of these
programs or from the use of the information contained herein.
![INV MGT WORK SHOP REVISED MAR 09 [Read-Only]€¦ · · 2009-08-11SAP Term Description Inventory Inventory refers to Materials that are managed on a Quantity and price basis or](https://static.fdocuments.us/doc/165x107/5acc2b0d7f8b9ad13e8c851b/inv-mgt-work-shop-revised-mar-09-read-only-2009-08-11sap-term-description-inventory.jpg)