8-1 Chapter 8 Stock Price Behavior and Market Efficiency Introductions to Market Efficiency...
58
8- 8-1 Chapter 8 Chapter 8 Stock Price Stock Price Behavior and Behavior and Market Market Efficiency Efficiency • Introductions to Market Introductions to Market Efficiency Efficiency • What does “Beat the Market” What does “Beat the Market” Mean? Mean? • Foundations of Market Efficiency Foundations of Market Efficiency • Forms of Market Efficiency Forms of Market Efficiency • Why would be a Market be Why would be a Market be Efficient? Efficient? • Some Implications of Market Some Implications of Market Efficiency Efficiency • Informed Traders and Inside Informed Traders and Inside Trading Trading • How Efficient are Markets? How Efficient are Markets? • Market Efficiency and the Market Efficiency and the Performance of Professional Money Performance of Professional Money Managers Managers
-
Upload
austin-gordon -
Category
Documents
-
view
229 -
download
1
Transcript of 8-1 Chapter 8 Stock Price Behavior and Market Efficiency Introductions to Market Efficiency...
8-8-11
Chapter 8Chapter 8Stock Price Behavior Stock Price Behavior
and Market Efficiencyand Market Efficiency•Introductions to Market EfficiencyIntroductions to Market Efficiency•What does “Beat the Market” Mean?What does “Beat the Market” Mean?•Foundations of Market EfficiencyFoundations of Market Efficiency•Forms of Market EfficiencyForms of Market Efficiency•Why would be a Market be Efficient?Why would be a Market be Efficient?•Some Implications of Market EfficiencySome Implications of Market Efficiency•Informed Traders and Inside TradingInformed Traders and Inside Trading•How Efficient are Markets?How Efficient are Markets?•Market Efficiency and the Performance of Market Efficiency and the Performance of Professional Money ManagersProfessional Money Managers•AnomaliesAnomalies•Bubbles and CrashesBubbles and Crashes•Tests of Different Types of Market EfficiencyTests of Different Types of Market Efficiency
© 2009 McGraw-Hill Ryerson © 2009 McGraw-Hill Ryerson LimitedLimited 8-8-22
Market EfficiencyMarket Efficiency The The Efficient market hypothesis (EMH)Efficient market hypothesis (EMH) is a theory is a theory
that asserts: As a practical matter, the major financial that asserts: As a practical matter, the major financial markets reflect markets reflect all relevant informationall relevant information at a given at a given time.time.
Market efficiencyMarket efficiency researchresearch examines the relationship examines the relationship between stock prices and available information.between stock prices and available information. The important research The important research questionquestion:: is it possible for investors is it possible for investors
to “beat the market?” to “beat the market?” Prediction of the EMH theory: if a market is efficient, it is not Prediction of the EMH theory: if a market is efficient, it is not
possible to “beat the market” (except by luck).possible to “beat the market” (except by luck).
© 2009 McGraw-Hill Ryerson © 2009 McGraw-Hill Ryerson LimitedLimited 8-8-33
What Does “Beat the Market” What Does “Beat the Market” Mean?Mean?
The The excess returnexcess return on an investment is the on an investment is the return in excess of that earned by other return in excess of that earned by other investments that have the same risk. investments that have the same risk.
““Beating the market”Beating the market” means consistently means consistently earning a earning a positive excess returnpositive excess return..
© 2009 McGraw-Hill Ryerson © 2009 McGraw-Hill Ryerson LimitedLimited 8-8-44
Three Economic Forces that Can Three Economic Forces that Can Lead to Market EfficiencyLead to Market Efficiency
Investors use their information in a rational manner.Investors use their information in a rational manner. Rational investors do not systematically overvalue or undervalue financial Rational investors do not systematically overvalue or undervalue financial
assets.assets. If every investor always makes perfectly rational investment decisions, it If every investor always makes perfectly rational investment decisions, it
would be very difficult to earn an excess return. would be very difficult to earn an excess return. There are independent deviations from rationality.There are independent deviations from rationality.
Suppose that many investors are irrational.Suppose that many investors are irrational. The net effect might be that these investors cancel each other out.The net effect might be that these investors cancel each other out. So, irrationality is just noise that is diversified away.So, irrationality is just noise that is diversified away. What is important here is that irrational investors have different beliefs.What is important here is that irrational investors have different beliefs.
Arbitrageurs exist.Arbitrageurs exist. Suppose collective irrationality does not balance out.Suppose collective irrationality does not balance out. Suppose there are some well-capitalized, intelligent, and rational investors.Suppose there are some well-capitalized, intelligent, and rational investors. If rational traders dominate irrational traders, the market will still be efficient.If rational traders dominate irrational traders, the market will still be efficient.
© 2009 McGraw-Hill Ryerson © 2009 McGraw-Hill Ryerson LimitedLimited 8-8-55
Forms of Market Efficiency,Forms of Market Efficiency,
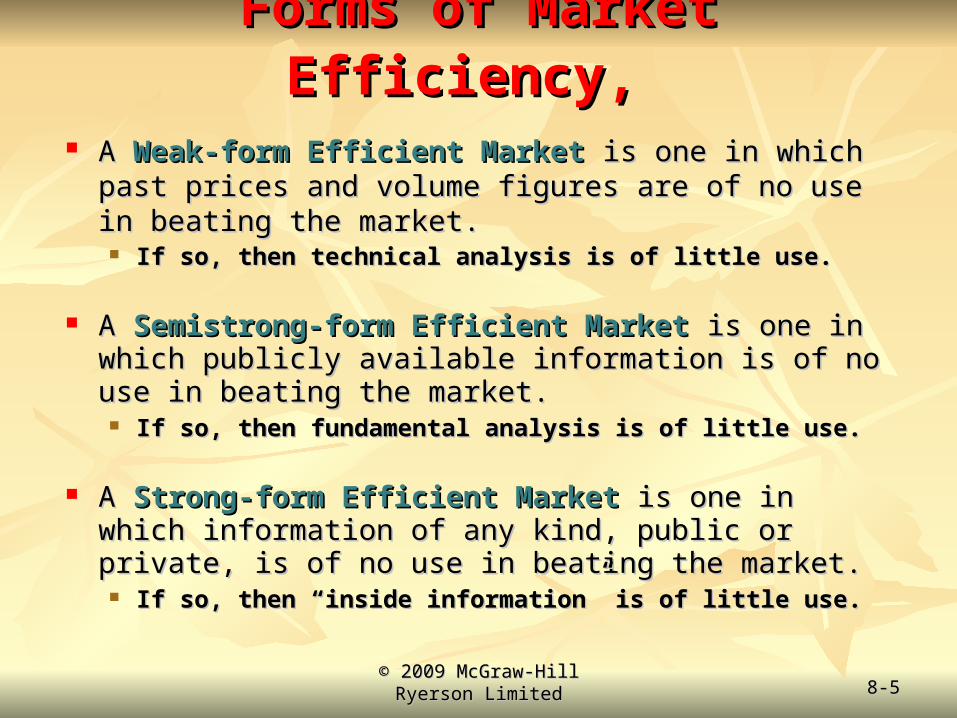
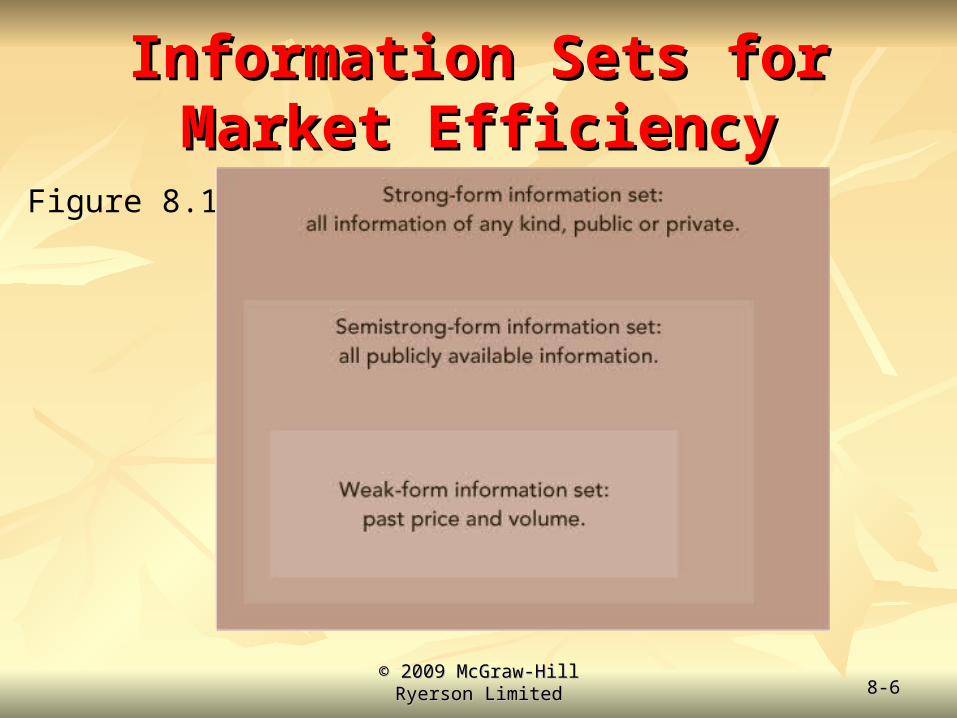
A A Weak-form Efficient MarketWeak-form Efficient Market is one in which past prices is one in which past prices and volume figures are of no use in beating the market. and volume figures are of no use in beating the market. If so, then technical analysis is of little use.If so, then technical analysis is of little use.
A A Semistrong-form Efficient MarketSemistrong-form Efficient Market is one in which is one in which publicly available information is of no use in beating the publicly available information is of no use in beating the market.market. If so, then fundamental analysis is of little use.If so, then fundamental analysis is of little use.
AA Strong-form Efficient MarketStrong-form Efficient Market is one in which is one in which information of any kind, public or private, is of no use in information of any kind, public or private, is of no use in beating the market.beating the market. If so, then “inside information” is of little use.If so, then “inside information” is of little use.
© 2009 McGraw-Hill Ryerson © 2009 McGraw-Hill Ryerson LimitedLimited 8-8-66
Information Sets for Market Information Sets for Market EfficiencyEfficiency
Figure 8.1
© 2009 McGraw-Hill Ryerson © 2009 McGraw-Hill Ryerson LimitedLimited 8-8-77
Why Would a Market be Efficient?Why Would a Market be Efficient? The driving force toward market efficiency is The driving force toward market efficiency is
simply competition and the profit motive.simply competition and the profit motive.
Even a relatively small performance Even a relatively small performance enhancement can be worth a tremendous enhancement can be worth a tremendous amount of money (when multiplied by the amount of money (when multiplied by the dollar amount involved).dollar amount involved).
This creates incentives to unearth relevant This creates incentives to unearth relevant information and use it.information and use it.
© 2009 McGraw-Hill Ryerson © 2009 McGraw-Hill Ryerson LimitedLimited 8-8-88
Does Old Information Help Predict Future Does Old Information Help Predict Future Stock Prices?Stock Prices?
This is a surprisingly difficult question to answer clearly.This is a surprisingly difficult question to answer clearly. Researchers have used sophisticated techniques to test whether Researchers have used sophisticated techniques to test whether
past stock price movements help predict future stock price past stock price movements help predict future stock price movements. movements. Some researchers have been able to show that future returns are partly Some researchers have been able to show that future returns are partly
predictable by past returns. BUT: there is not enough predictability to predictable by past returns. BUT: there is not enough predictability to earn an excess return. earn an excess return.
Also, trading costs swamp attempts to build a profitable trading system Also, trading costs swamp attempts to build a profitable trading system built on past returns. built on past returns.
Result: buy-and-hold strategies involving broad market indexes are Result: buy-and-hold strategies involving broad market indexes are extremely difficult to outperform.extremely difficult to outperform.
Technical Analysis implication: No matter how often a particular stock price path has related to subsequent stock price changes in the past, there is no assurance that this relationship will occur again in the future.
© 2009 McGraw-Hill Ryerson © 2009 McGraw-Hill Ryerson LimitedLimited 8-8-99
Random Walks and Stock PricesRandom Walks and Stock Prices If you were to ask people you know whether stock market prices If you were to ask people you know whether stock market prices
are predictable, many of them would say yes. are predictable, many of them would say yes.
To their surprise, and perhaps yours, it is very difficult to To their surprise, and perhaps yours, it is very difficult to predict stock market prices. predict stock market prices.
In fact, considerable research has shown that stock prices In fact, considerable research has shown that stock prices change through time as if they are random. change through time as if they are random.
That is, stock price increases are about as likely as stock price That is, stock price increases are about as likely as stock price decreases. decreases.
When there is no discernable pattern to the path that a stock When there is no discernable pattern to the path that a stock price follows, then the stock’s price behavior is largely price follows, then the stock’s price behavior is largely consistent with the notion of a consistent with the notion of a random walk. random walk.
© 2009 McGraw-Hill Ryerson © 2009 McGraw-Hill Ryerson LimitedLimited 8-8-1010
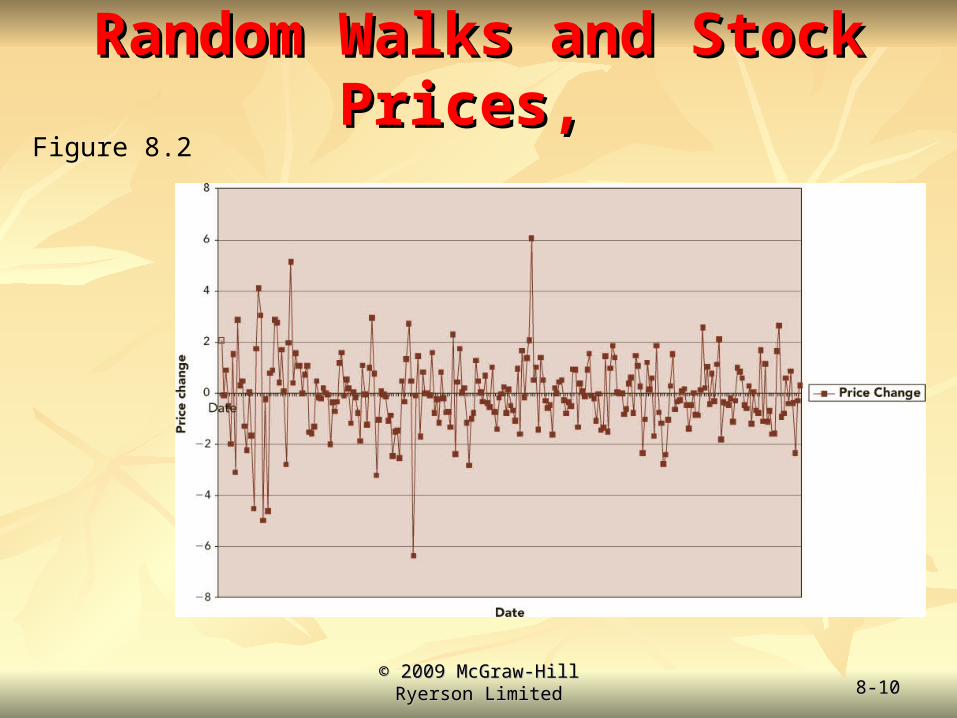
Random Walks and Stock Prices, Random Walks and Stock Prices, Figure 8.2
© 2009 McGraw-Hill Ryerson © 2009 McGraw-Hill Ryerson LimitedLimited 8-8-1111
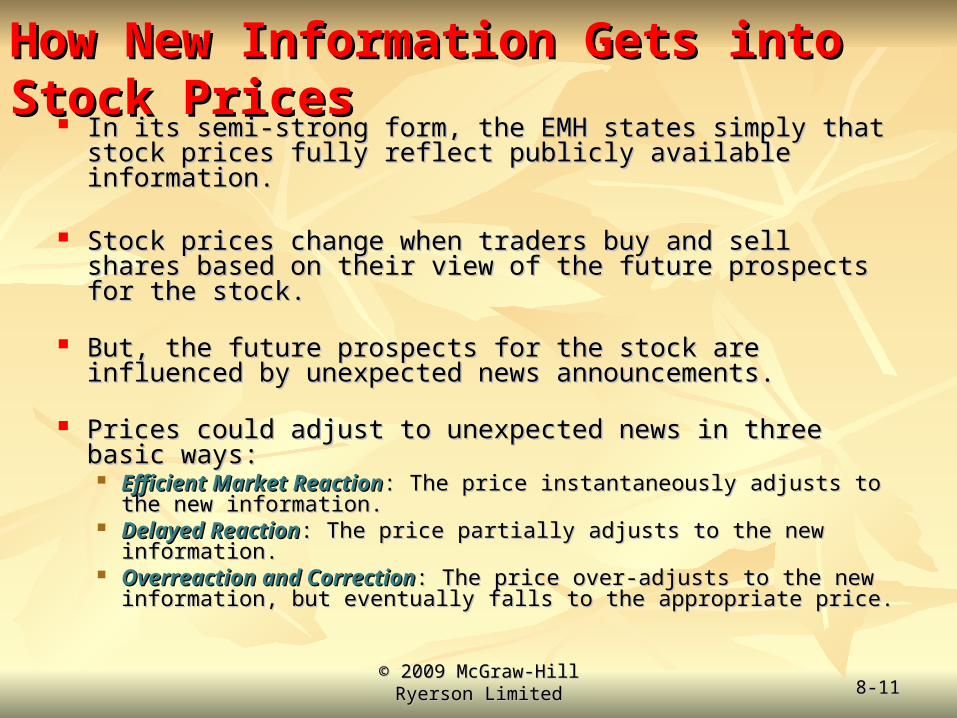
How New Information Gets into Stock PricesHow New Information Gets into Stock Prices In its semi-strong form, the EMH states simply that stock In its semi-strong form, the EMH states simply that stock
prices fully reflect publicly available information. prices fully reflect publicly available information.
Stock prices change when traders buy and sell shares based on Stock prices change when traders buy and sell shares based on their view of the future prospects for the stock.their view of the future prospects for the stock.
But, the future prospects for the stock are influenced by But, the future prospects for the stock are influenced by unexpected news announcements.unexpected news announcements.
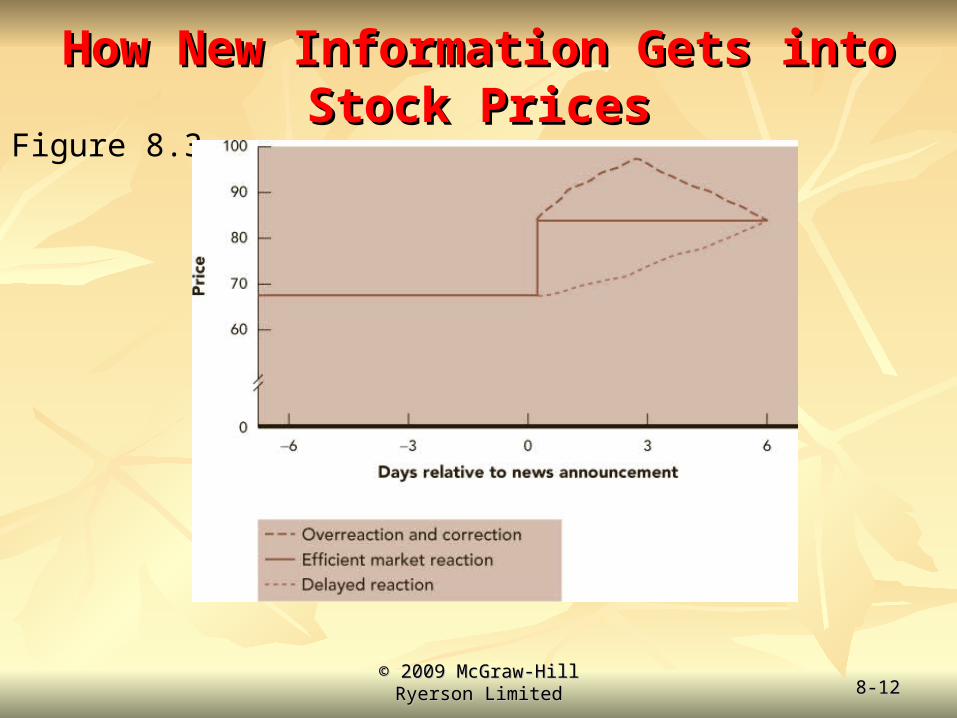
Prices could adjust to unexpected news in three basic ways: Prices could adjust to unexpected news in three basic ways: Efficient Market ReactionEfficient Market Reaction: The price instantaneously adjusts to the : The price instantaneously adjusts to the
new information.new information. Delayed ReactionDelayed Reaction: The price partially adjusts to the new information. : The price partially adjusts to the new information. Overreaction and CorrectionOverreaction and Correction: The price over-adjusts to the new : The price over-adjusts to the new
information, but eventually falls to the appropriate price.information, but eventually falls to the appropriate price.
© 2009 McGraw-Hill Ryerson © 2009 McGraw-Hill Ryerson LimitedLimited 8-8-1212
How New Information Gets into Stock PricesHow New Information Gets into Stock PricesFigure 8.3
© 2009 McGraw-Hill Ryerson © 2009 McGraw-Hill Ryerson LimitedLimited 8-8-1313
Event StudiesEvent Studies Researchers have examined the effects of many types Researchers have examined the effects of many types
of news announcements on stock prices.of news announcements on stock prices.
Such researchers are interested in:Such researchers are interested in: The adjustment process itselfThe adjustment process itself The size of the stock price reaction to a news announcement. The size of the stock price reaction to a news announcement.
To test for the effects of new information on stock To test for the effects of new information on stock prices, researchers use an approach called an prices, researchers use an approach called an event event studystudy..
Let us look at how researchers use this method. We Let us look at how researchers use this method. We will use a dramatic example.will use a dramatic example.
© 2009 McGraw-Hill Ryerson © 2009 McGraw-Hill Ryerson LimitedLimited 8-8-1414
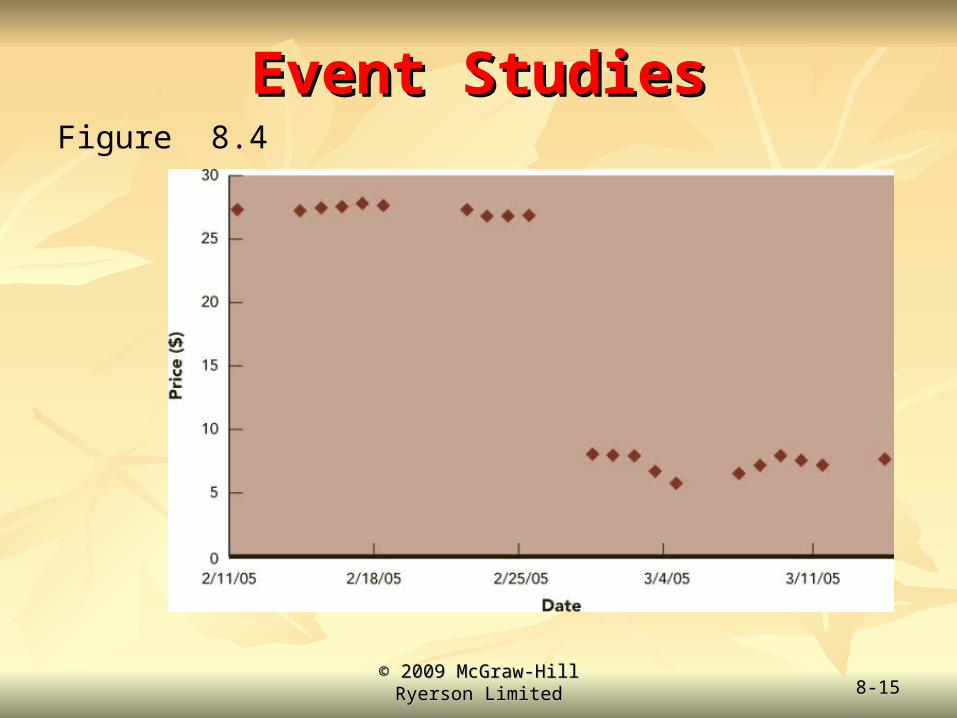
Event StudiesEvent Studies On Friday, February 25, 2005, executives of Elan Corporation On Friday, February 25, 2005, executives of Elan Corporation
announced that the company was voluntarily halting the announced that the company was voluntarily halting the supply and marketing of a drug used to treat multiple sclerosis.supply and marketing of a drug used to treat multiple sclerosis.
In addition, the company advised doctors to stop prescribing In addition, the company advised doctors to stop prescribing the drug. the drug.
Even though the drug had approval from the U.S. Food and Even though the drug had approval from the U.S. Food and Drug Administration, executives of Elan Corporation felt that Drug Administration, executives of Elan Corporation felt that potentially serious side effects of the drug meant that sales of potentially serious side effects of the drug meant that sales of the drug should be suspended. the drug should be suspended.
On Monday, February 28, 2005, Elan shares plummeted On Monday, February 28, 2005, Elan shares plummeted $18.10, or more than 69 percent, to $8.00. $18.10, or more than 69 percent, to $8.00.
© 2009 McGraw-Hill Ryerson © 2009 McGraw-Hill Ryerson LimitedLimited 8-8-1515
Event StudiesEvent StudiesFigure 8.4
© 2009 McGraw-Hill Ryerson © 2009 McGraw-Hill Ryerson LimitedLimited 8-8-1616
Event StudiesEvent Studies When researchers look for effects of news on stock prices, they must make When researchers look for effects of news on stock prices, they must make
sure that overall market news is accounted for in their analysis. sure that overall market news is accounted for in their analysis.
To separate the overall market from the isolated news concerning Elan To separate the overall market from the isolated news concerning Elan Corporation, researchers would calculate abnormal returns:Corporation, researchers would calculate abnormal returns:
Abnormal return = Observed return – Expected return Abnormal return = Observed return – Expected return
The expected return can be calculated using a market index (like the Nasdaq The expected return can be calculated using a market index (like the Nasdaq 100 Index or the S&P 500 Index) or by using a long-term average return on 100 Index or the S&P 500 Index) or by using a long-term average return on the stock. the stock.
Researchers then align the abnormal return on a stock to the days relative to Researchers then align the abnormal return on a stock to the days relative to the news announcement. the news announcement.
Researchers usually assign the value of zero to the day a news announcement is Researchers usually assign the value of zero to the day a news announcement is made. made.
One day after the news announcement is assigned a value of +1. One day after the news announcement is assigned a value of +1. Two days after the news announcement is assigned a value of +2, and so on. Two days after the news announcement is assigned a value of +2, and so on. Similarly, one day before the news announcement is assigned the value of -1.Similarly, one day before the news announcement is assigned the value of -1.
© 2009 McGraw-Hill Ryerson © 2009 McGraw-Hill Ryerson LimitedLimited 8-8-1717
Event StudiesEvent Studies According to the EMH, the abnormal return today should only According to the EMH, the abnormal return today should only
relate to information released on that day. relate to information released on that day.
To evaluate abnormal returns, researchers usually accumulate To evaluate abnormal returns, researchers usually accumulate them over a 60 or 80-day period. them over a 60 or 80-day period.
Figure 7.5 contains a plot of cumulative abnormal returns for Figure 7.5 contains a plot of cumulative abnormal returns for Elan beginning 40 days before the announcement. Elan beginning 40 days before the announcement. The first cumulative abnormal return, or CAR, is just equal to the The first cumulative abnormal return, or CAR, is just equal to the
abnormal return on day -40. abnormal return on day -40. The CAR on day -39 is the sum of the first two abnormal returns. The CAR on day -39 is the sum of the first two abnormal returns. The CAR on day -38 is the sum of the first three, and so on. The CAR on day -38 is the sum of the first three, and so on. By examining CARs, we can see if there was over- or under-reaction to an By examining CARs, we can see if there was over- or under-reaction to an
announcement.announcement.
© 2009 McGraw-Hill Ryerson © 2009 McGraw-Hill Ryerson LimitedLimited 8-8-1818
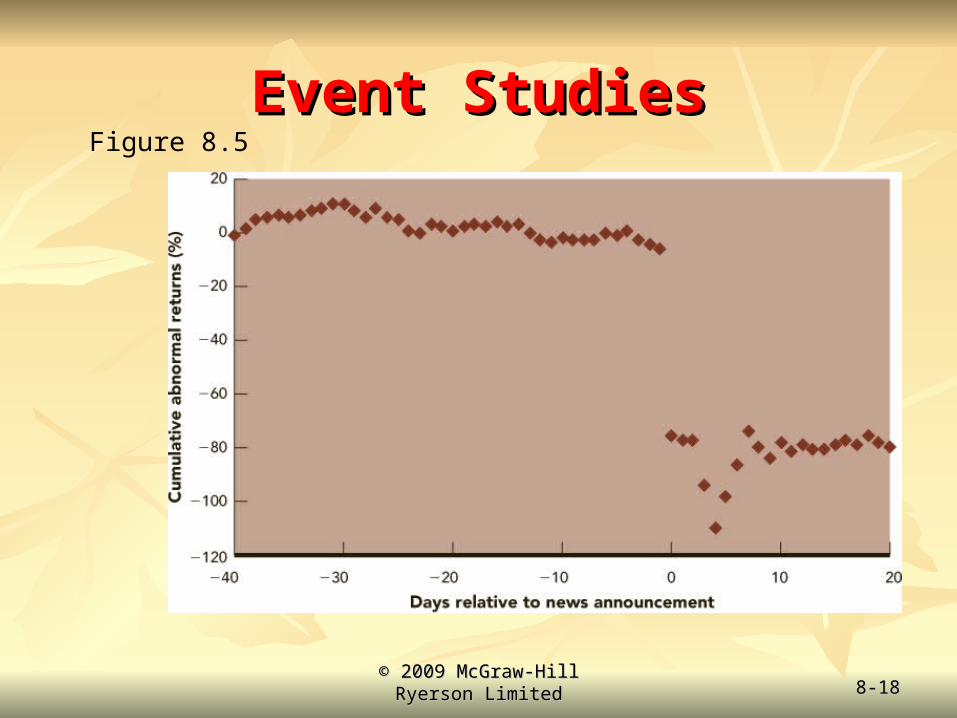
Event StudiesEvent StudiesFigure 8.5
© 2009 McGraw-Hill Ryerson © 2009 McGraw-Hill Ryerson LimitedLimited 8-8-1919
Event StudiesEvent Studies As you can see in Figure 7.5, Elan’s cumulative abnormal As you can see in Figure 7.5, Elan’s cumulative abnormal
return hovered around zero before the announcement. return hovered around zero before the announcement.
After the news was released, there was a large, sharp After the news was released, there was a large, sharp downward movement in the CAR. downward movement in the CAR.
The overall pattern of cumulative abnormal returns is The overall pattern of cumulative abnormal returns is essentially what the EMH would predict. essentially what the EMH would predict.
That is:That is: There is a flat area of cumulative abnormal returnsThere is a flat area of cumulative abnormal returns A sharp break in cumulative abnormal returns, and A sharp break in cumulative abnormal returns, and Another flat area of cumulative abnormal returns.Another flat area of cumulative abnormal returns.
© 2009 McGraw-Hill Ryerson © 2009 McGraw-Hill Ryerson LimitedLimited 8-8-2020
Informed Traders and Insider Informed Traders and Insider TradingTrading
If a market is strong-form efficient, no information If a market is strong-form efficient, no information of any kind, public or private, is useful in beating the of any kind, public or private, is useful in beating the market. market.
But, it is clear that significant inside information But, it is clear that significant inside information would enable you to earn substantial excess returns. would enable you to earn substantial excess returns.
This fact generates an interesting question: This fact generates an interesting question: Should Should any of us be able to earn returns based on any of us be able to earn returns based on information that is not known to the public? information that is not known to the public?
© 2009 McGraw-Hill Ryerson © 2009 McGraw-Hill Ryerson LimitedLimited 8-8-2121
Informed Traders and Insider TradingInformed Traders and Insider Trading
It is illegal to make profits on non-public information. It is illegal to make profits on non-public information. It is argued that this ban is necessary if investors are to It is argued that this ban is necessary if investors are to
have trust in stock markets. have trust in stock markets. Securities exchange commissions enforce laws concerning Securities exchange commissions enforce laws concerning
illegal trading activities. illegal trading activities.
It is important to be able to distinguish between:It is important to be able to distinguish between: Informed tradingInformed trading Legal insider tradingLegal insider trading Illegal insider tradingIllegal insider trading
© 2009 McGraw-Hill Ryerson © 2009 McGraw-Hill Ryerson LimitedLimited 8-8-2222
Informed TradingInformed Trading When an investor makes a decision to buy or sell a When an investor makes a decision to buy or sell a
stock based on stock based on publicly available informationpublicly available information and and analysis, this investor is said to be an analysis, this investor is said to be an informed informed tradertrader..
The information that an informed trader possesses The information that an informed trader possesses might come from:might come from: Reading journalsReading journals Reading quarterly reports issued by a companyReading quarterly reports issued by a company Gathering financial information from the InternetGathering financial information from the Internet Talking to other investorsTalking to other investors
© 2009 McGraw-Hill Ryerson © 2009 McGraw-Hill Ryerson LimitedLimited 8-8-2323
Legal Insider TradingLegal Insider Trading Some informed traders are also Some informed traders are also insider tradersinsider traders..
When you hear the termWhen you hear the term insiderinsider tradingtrading,, you most you most
likely think that such activity is illegal.likely think that such activity is illegal.
But, not all insider trading is illegal.But, not all insider trading is illegal. CCompany insiders can make perfectly legal trades in the stock of their ompany insiders can make perfectly legal trades in the stock of their
company. company. They must comply with the reporting rules made by the SEC. They must comply with the reporting rules made by the SEC. When company insiders make a trade and report it to the SEC, these trades are When company insiders make a trade and report it to the SEC, these trades are
reported to the public by the SEC. reported to the public by the SEC. In addition, corporate insiders must declare that trades that they made were In addition, corporate insiders must declare that trades that they made were
based on public information about the company, rather than “inside” based on public information about the company, rather than “inside” information.information.
© 2009 McGraw-Hill Ryerson © 2009 McGraw-Hill Ryerson LimitedLimited 8-8-2424
Who is an “Insider”?Who is an “Insider”? For the purposes of defining For the purposes of defining illegal insider tradingillegal insider trading, an , an
insider is someone who has insider is someone who has materialmaterial non-public non-public informationinformation. .
Such information is both not known to the public and, Such information is both not known to the public and, if it were known, would impact the stock price. if it were known, would impact the stock price.
A person can be charged with insider trading when he A person can be charged with insider trading when he or she acts on such information in an attempt to make or she acts on such information in an attempt to make a profit. a profit.
© 2009 McGraw-Hill Ryerson © 2009 McGraw-Hill Ryerson LimitedLimited 8-8-2525
Illegal Insider TradingIllegal Insider Trading
When an illegal insider trade occurs, there is a When an illegal insider trade occurs, there is a tippertipper and a and a tippeetippee.. The tipper is the person who has purposely divulged material non-public information. The tipper is the person who has purposely divulged material non-public information. The tippee is the person who has knowingly used such information in an attempt to profit.The tippee is the person who has knowingly used such information in an attempt to profit.
It is difficult to prove that a trader is truly a tippee.It is difficult to prove that a trader is truly a tippee.
It is difficult to keep track of insider information flows and subsequent It is difficult to keep track of insider information flows and subsequent trades. trades.
Suppose a person makes a trade based on the advice of a stockbroker. Suppose a person makes a trade based on the advice of a stockbroker. Even if the broker based this advice on material non-public information, the trader might Even if the broker based this advice on material non-public information, the trader might
not have been aware of the broker’s knowledge. not have been aware of the broker’s knowledge. It must be proved that the trader was, in fact, aware that the broker’s information was It must be proved that the trader was, in fact, aware that the broker’s information was
based on material non-public information. based on material non-public information.
Sometimes, people accused of insider trading claim that they just Sometimes, people accused of insider trading claim that they just “overheard” someone talking.“overheard” someone talking.
Be aware: When you take possession of material non-public information, Be aware: When you take possession of material non-public information, you become an insider, and are bound to obey insider trading laws.you become an insider, and are bound to obey insider trading laws.
© 2009 McGraw-Hill Ryerson © 2009 McGraw-Hill Ryerson LimitedLimited 8-8-2626
It’s Not a Good Thing: What did Martha do?It’s Not a Good Thing: What did Martha do?
The SEC believed that Ms. Stewart was told by her friend, Sam Waksal, The SEC believed that Ms. Stewart was told by her friend, Sam Waksal, who founded a company called ImClone, that a cancer drug being who founded a company called ImClone, that a cancer drug being developed by ImClone had been rejected by the Food and Drug developed by ImClone had been rejected by the Food and Drug Administration. Administration.
This development would be bad news for ImClone shares.This development would be bad news for ImClone shares.
Martha Stewart sold her 3,928 shares in ImClone on Martha Stewart sold her 3,928 shares in ImClone on December 27, 2001December 27, 2001. . On that day, ImClone traded below $60 per share, a level that Ms. Stewart On that day, ImClone traded below $60 per share, a level that Ms. Stewart
claimed triggered an existing stop-loss order. claimed triggered an existing stop-loss order. However, the SEC believed that Ms. Stewart illegally sold her shares because However, the SEC believed that Ms. Stewart illegally sold her shares because
she had information concerning FDA rejection before it became public.she had information concerning FDA rejection before it became public.
The FDA rejection was announced after the market closed on Friday, The FDA rejection was announced after the market closed on Friday, December 28, 2001December 28, 2001. .
This news was a huge blow to ImClone shares, which closed at about $46 This news was a huge blow to ImClone shares, which closed at about $46 per share on the following Monday (the first trading day after the per share on the following Monday (the first trading day after the information became public).information became public).
© 2009 McGraw-Hill Ryerson © 2009 McGraw-Hill Ryerson LimitedLimited 8-8-2727
It’s Not a Good Thing: What did Martha do? It’s Not a Good Thing: What did Martha do? In June 2003, Ms. Stewart and her stock broker, Peter Bacanovic, were indicted In June 2003, Ms. Stewart and her stock broker, Peter Bacanovic, were indicted
on nine federal counts. They both plead not guilty. on nine federal counts. They both plead not guilty.
Ms. Stewart’s trial began in January 2004. Ms. Stewart’s trial began in January 2004.
Just days before the jury began to deliberate, however, Judge Miriam Cedarbaum Just days before the jury began to deliberate, however, Judge Miriam Cedarbaum dismissed the most serious charge of securities fraud. dismissed the most serious charge of securities fraud.
Ms. Stewart, however, was convicted on all four counts of obstructing justice.Ms. Stewart, however, was convicted on all four counts of obstructing justice. Judge Cedarbaum fined Ms. Stewart $30,000 and sentenced her to five months in Judge Cedarbaum fined Ms. Stewart $30,000 and sentenced her to five months in
prison, two years of probation, and five months of home confinement. prison, two years of probation, and five months of home confinement. The fine was the maximum allowed under federal rules while the sentence was the The fine was the maximum allowed under federal rules while the sentence was the
minimum the judge could impose. minimum the judge could impose. Peter Bacanovic, Ms. Stewart's broker, was fined $4,000 and was sentenced to five Peter Bacanovic, Ms. Stewart's broker, was fined $4,000 and was sentenced to five
months in prison and two years of probation.months in prison and two years of probation.
So, to summarize:
Martha Stewart was accused, but not convicted, of insider trading. Martha Stewart was accused, and convicted, of obstructing justice.
© 2009 McGraw-Hill Ryerson © 2009 McGraw-Hill Ryerson LimitedLimited 8-8-2828
Are Financial Markets Efficient?Are Financial Markets Efficient? Financial markets are the most extensively documented of all Financial markets are the most extensively documented of all
human endeavors. human endeavors.
Colossal amounts of financial market data are collected and Colossal amounts of financial market data are collected and reported every day. reported every day.
These data, particularly stock market data, have been These data, particularly stock market data, have been exhaustively analyzed to test market efficiency.exhaustively analyzed to test market efficiency.
But, market efficiency is difficult to test for these four basic But, market efficiency is difficult to test for these four basic reasons:reasons: The risk-adjustment problemThe risk-adjustment problem The relevant information problemThe relevant information problem The dumb luck problemThe dumb luck problem The data snooping problemThe data snooping problem
© 2009 McGraw-Hill Ryerson © 2009 McGraw-Hill Ryerson LimitedLimited 8-8-2929
Are Financial Markets Efficient?Are Financial Markets Efficient? Nevertheless, three generalities about market Nevertheless, three generalities about market
efficiency can be made:efficiency can be made:
Short-term stock price and market movements appear to be Short-term stock price and market movements appear to be difficult to predict with any accuracy.difficult to predict with any accuracy.
The market reacts quickly and sharply to new information, The market reacts quickly and sharply to new information, and various studies find little or no evidence that such and various studies find little or no evidence that such reactions can be profitably exploited.reactions can be profitably exploited.
If the stock market can be beaten, the way to do so is not If the stock market can be beaten, the way to do so is not obvious.obvious.
© 2009 McGraw-Hill Ryerson © 2009 McGraw-Hill Ryerson LimitedLimited 8-8-3030
Some Implications if Markets are Some Implications if Markets are EfficientEfficient
Security selection becomes less important, Security selection becomes less important, because securities will be fairly priced.because securities will be fairly priced.
There will be a small role for professional There will be a small role for professional money managers.money managers.
It makes little sense to time the market.It makes little sense to time the market.
© 2009 McGraw-Hill Ryerson © 2009 McGraw-Hill Ryerson LimitedLimited 8-8-3131
The Performance of Professional Money ManagersThe Performance of Professional Money Managers Let’s have a stock market investment contest in which you are Let’s have a stock market investment contest in which you are
going to take on professional money managers.going to take on professional money managers.
The professional money managers have at their disposal their The professional money managers have at their disposal their skill, banks of computers, and scores of analysts to help pick skill, banks of computers, and scores of analysts to help pick their stocks. their stocks.
Does this sound like an unfair match? Does this sound like an unfair match?
You have a terrific advantage if you follow this investment You have a terrific advantage if you follow this investment strategy: Hold a broad-based market index. strategy: Hold a broad-based market index. One such index that you can easily buy is a mutual fund called the One such index that you can easily buy is a mutual fund called the
Vanguard 500 Index Fund (there are other market index mutual funds)Vanguard 500 Index Fund (there are other market index mutual funds) The fund tracks the performance of the S&P 500 Index by investing its The fund tracks the performance of the S&P 500 Index by investing its
assets in the stocks that make up the S&P 500 Index. assets in the stocks that make up the S&P 500 Index.
© 2009 McGraw-Hill Ryerson © 2009 McGraw-Hill Ryerson LimitedLimited 8-8-3232
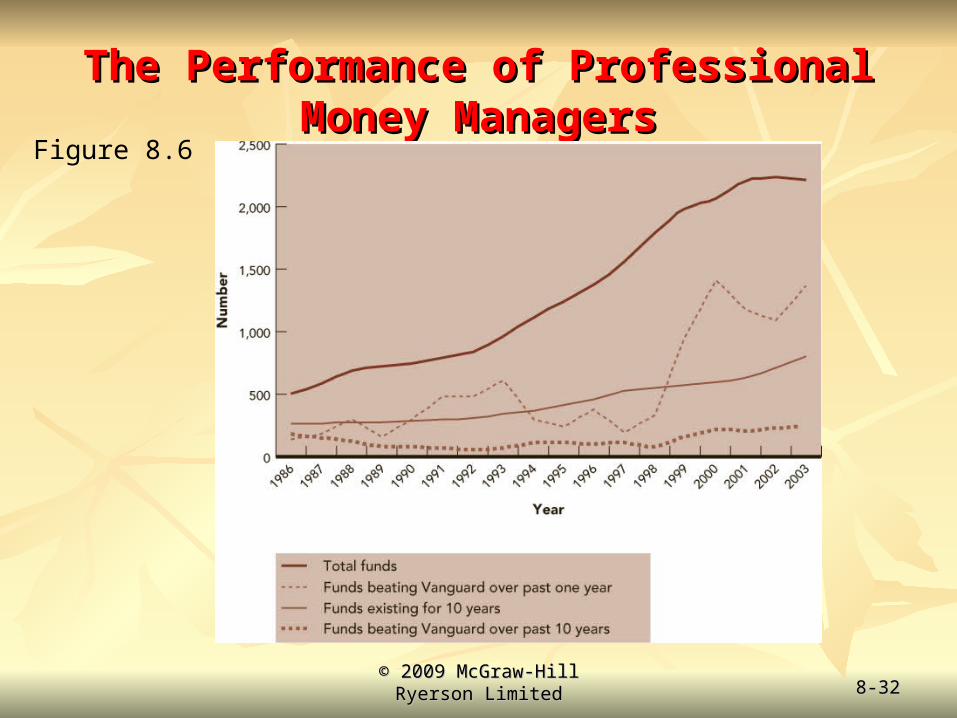
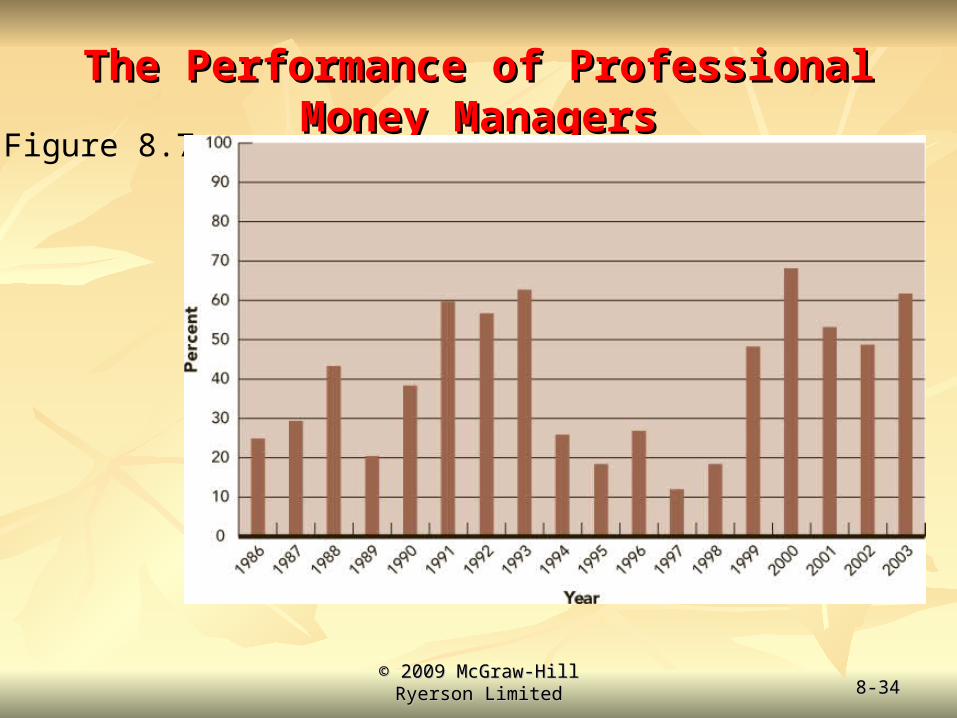
The Performance of Professional Money ManagersThe Performance of Professional Money ManagersFigure 8.6
© 2009 McGraw-Hill Ryerson © 2009 McGraw-Hill Ryerson LimitedLimited 8-8-3333
The Performance of Professional Money ManagersThe Performance of Professional Money Managers
The previous slide shows the number of these funds that beat the The previous slide shows the number of these funds that beat the performance of the Vanguard 500 Index Fund.performance of the Vanguard 500 Index Fund.
You can see that there is much more variation in the dashed blue You can see that there is much more variation in the dashed blue line than in the dashed red line. line than in the dashed red line.
What this means is that in any given year, it is hard to predict What this means is that in any given year, it is hard to predict how many professional money managers will beat the Vanguard how many professional money managers will beat the Vanguard 500 Index Fund. 500 Index Fund.
But, the low level and variation of the dashed red line means that But, the low level and variation of the dashed red line means that the percentage of professional money managers who can beat the the percentage of professional money managers who can beat the Vanguard 500 Index Fund over a 10-year investment period is Vanguard 500 Index Fund over a 10-year investment period is low and stable.low and stable.
© 2009 McGraw-Hill Ryerson © 2009 McGraw-Hill Ryerson LimitedLimited 8-8-3434
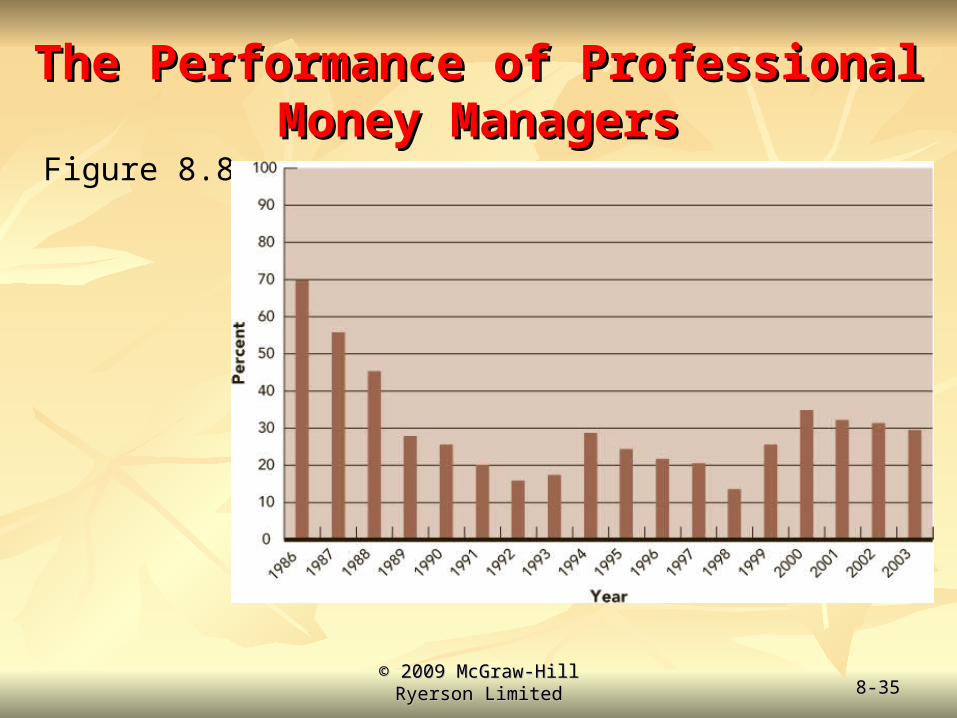
The Performance of Professional Money ManagersThe Performance of Professional Money ManagersFigure 8.7
© 2009 McGraw-Hill Ryerson © 2009 McGraw-Hill Ryerson LimitedLimited 8-8-3535
The Performance of Professional Money The Performance of Professional Money ManagersManagers
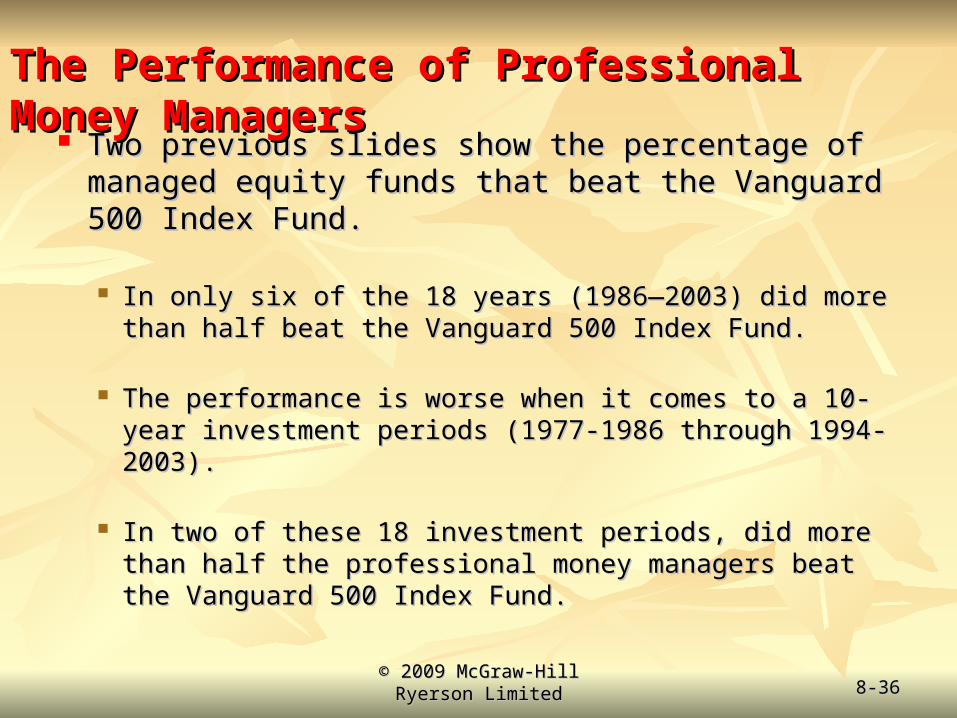
Figure 8.8
© 2009 McGraw-Hill Ryerson © 2009 McGraw-Hill Ryerson LimitedLimited 8-8-3636
Two previous slides show the percentage of managed Two previous slides show the percentage of managed equity funds that beat the Vanguard 500 Index Fund. equity funds that beat the Vanguard 500 Index Fund.
In only six of the 18 years (1986—2003) did more than In only six of the 18 years (1986—2003) did more than half beat the Vanguard 500 Index Fund. half beat the Vanguard 500 Index Fund.
The performance is worse when it comes to a 10-year The performance is worse when it comes to a 10-year investment periods (1977-1986 through 1994-2003).investment periods (1977-1986 through 1994-2003).
In two of these 18 investment periods, did more than half In two of these 18 investment periods, did more than half the professional money managers beat the Vanguard 500 the professional money managers beat the Vanguard 500 Index Fund.Index Fund.
The Performance of Professional Money ManagersThe Performance of Professional Money Managers
© 2009 McGraw-Hill Ryerson © 2009 McGraw-Hill Ryerson LimitedLimited 8-8-3737
The Performance of Professional Money ManagersThe Performance of Professional Money Managers
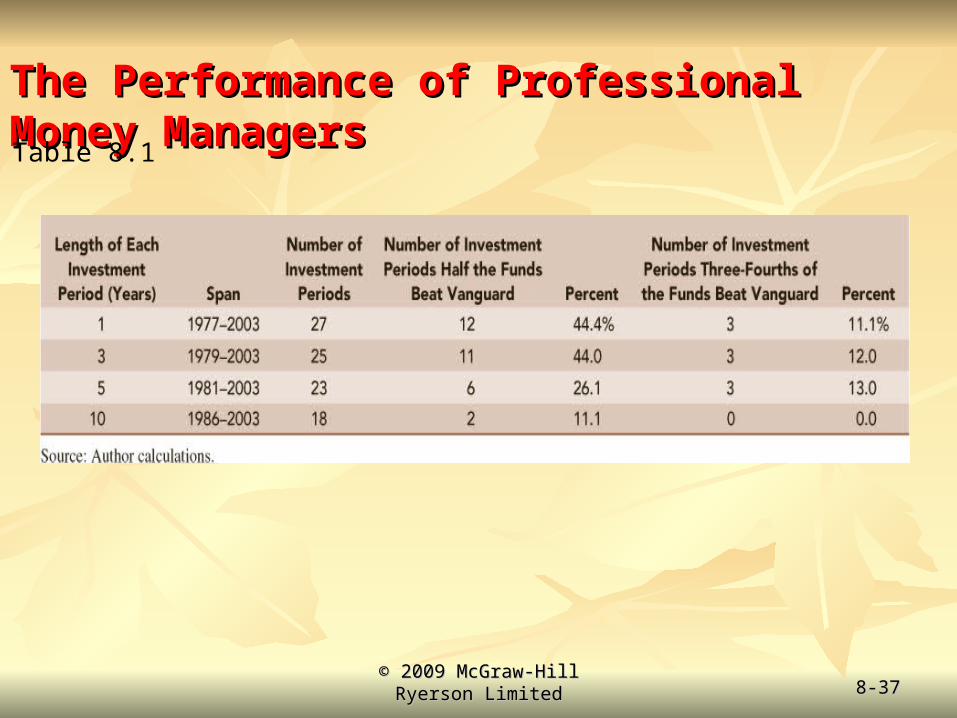
Table 8.1
8-8-3838
The Performance of Professional Money The Performance of Professional Money ManagersManagers
The previous slide presents more evidence concerning the performance of The previous slide presents more evidence concerning the performance of professional money managers. professional money managers.
Using data from 1977 through 2003, we divide this time period into:Using data from 1977 through 2003, we divide this time period into: 1-year investment periods1-year investment periods Rolling 3-year investment periods Rolling 3-year investment periods Rolling 5-year investment periodsRolling 5-year investment periods Rolling 10-year investment periodsRolling 10-year investment periods
Then, after we calculate the number of investment periods, we ask two questions: Then, after we calculate the number of investment periods, we ask two questions: what percent of the time did half the professionally managed funds beat the Vanguard 500 what percent of the time did half the professionally managed funds beat the Vanguard 500
Index Fund?Index Fund? what percent of the time did three-fourths of them beat the Vanguard 500 Index Fund? what percent of the time did three-fourths of them beat the Vanguard 500 Index Fund?
The previous slides raise some potentially difficult and uncomfortable questions The previous slides raise some potentially difficult and uncomfortable questions for security analysts and other investment professionals. for security analysts and other investment professionals.
© 2009 McGraw-Hill Ryerson © 2009 McGraw-Hill Ryerson LimitedLimited 8-8-3939
The Performance of Professional Money The Performance of Professional Money ManagersManagers
If markets are inefficient, and tools like fundamental analysis If markets are inefficient, and tools like fundamental analysis are valuable, why can’t mutual fund managers beat a broad are valuable, why can’t mutual fund managers beat a broad market index?market index?
The performance of professional money managers is The performance of professional money managers is especially troublesome when we consider the enormous especially troublesome when we consider the enormous resources at their disposal and the substantial survivorship bias resources at their disposal and the substantial survivorship bias that exists. that exists.
Managers and funds that do especially poorly disappear. Managers and funds that do especially poorly disappear. If it were possible to beat the market, then the process of elimination If it were possible to beat the market, then the process of elimination
should lead to a situation in which the survivors can beat the market. should lead to a situation in which the survivors can beat the market. The fact that professional money managers seem to lack the ability to The fact that professional money managers seem to lack the ability to
outperform a broad market index is consistent with the notion that the outperform a broad market index is consistent with the notion that the equity market is efficient.equity market is efficient.
© 2009 McGraw-Hill Ryerson © 2009 McGraw-Hill Ryerson LimitedLimited 8-8-4040
What is the Role for Portfolio What is the Role for Portfolio Managers in an Efficient Market?Managers in an Efficient Market?
The role of a portfolio manager in an efficient market is to build a The role of a portfolio manager in an efficient market is to build a portfolio to the specific needs of individual investors. portfolio to the specific needs of individual investors.
A basic principle of investing is to hold a well-diversified portfolio.A basic principle of investing is to hold a well-diversified portfolio. However, exactly which diversified portfolio is optimal varies by However, exactly which diversified portfolio is optimal varies by
investor. investor. Some factors that influence portfolio choice include the investor’s Some factors that influence portfolio choice include the investor’s
age, tax bracket, risk aversion, and even employer. Employer? age, tax bracket, risk aversion, and even employer. Employer? Suppose you work for Starbucks and part of your compensation is stock Suppose you work for Starbucks and part of your compensation is stock
options. options. Like many companies, Starbucks offers its employees the opportunity to Like many companies, Starbucks offers its employees the opportunity to
purchase company stock at less than market value. purchase company stock at less than market value. You can imagine that you could wind up with a lot of Starbucks stock in your You can imagine that you could wind up with a lot of Starbucks stock in your
portfolio, which means you are not holding a diversified portfolio.portfolio, which means you are not holding a diversified portfolio. The role of your portfolio manager would be to help you add other assets to The role of your portfolio manager would be to help you add other assets to
your portfolio so that it is once again diversified.your portfolio so that it is once again diversified.
© 2009 McGraw-Hill Ryerson © 2009 McGraw-Hill Ryerson LimitedLimited 8-8-4141
AnomaliesAnomalies We will now present some aspects of stock price behavior that We will now present some aspects of stock price behavior that
are both baffling and potentially hard to reconcile with market are both baffling and potentially hard to reconcile with market efficiency.efficiency.
Researchers call these Researchers call these market anomalies.market anomalies.
Three facts to keep in mind about market anomalies. Three facts to keep in mind about market anomalies. First, anomalies generally do not involve many dollars relative to the First, anomalies generally do not involve many dollars relative to the
overall size of the stock market.overall size of the stock market. Second, many anomalies are fleeting and tend to disappear when Second, many anomalies are fleeting and tend to disappear when
discovered. discovered. Finally, anomalies are not easily used as the basis for a trading Finally, anomalies are not easily used as the basis for a trading
strategy, because transaction costs render many of them unprofitable.strategy, because transaction costs render many of them unprofitable.
© 2009 McGraw-Hill Ryerson © 2009 McGraw-Hill Ryerson LimitedLimited 8-8-4242
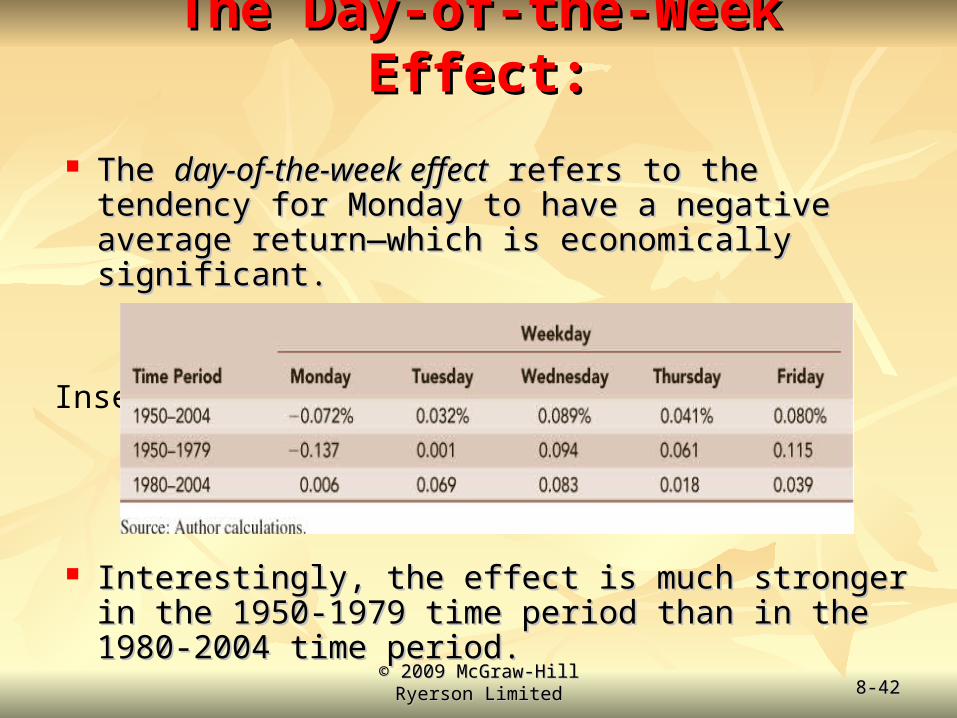
The Day-of-the-Week Effect:The Day-of-the-Week Effect:
The The day-of-the-week effectday-of-the-week effect refers to the tendency for refers to the tendency for Monday to have a negative average return—which is Monday to have a negative average return—which is economically significant.economically significant.
Interestingly, the effect is much stronger in the 1950-Interestingly, the effect is much stronger in the 1950-1979 time period than in the 1980-2004 time period.1979 time period than in the 1980-2004 time period.
Insert Table 8.2 Here
© 2009 McGraw-Hill Ryerson © 2009 McGraw-Hill Ryerson LimitedLimited 8-8-4343
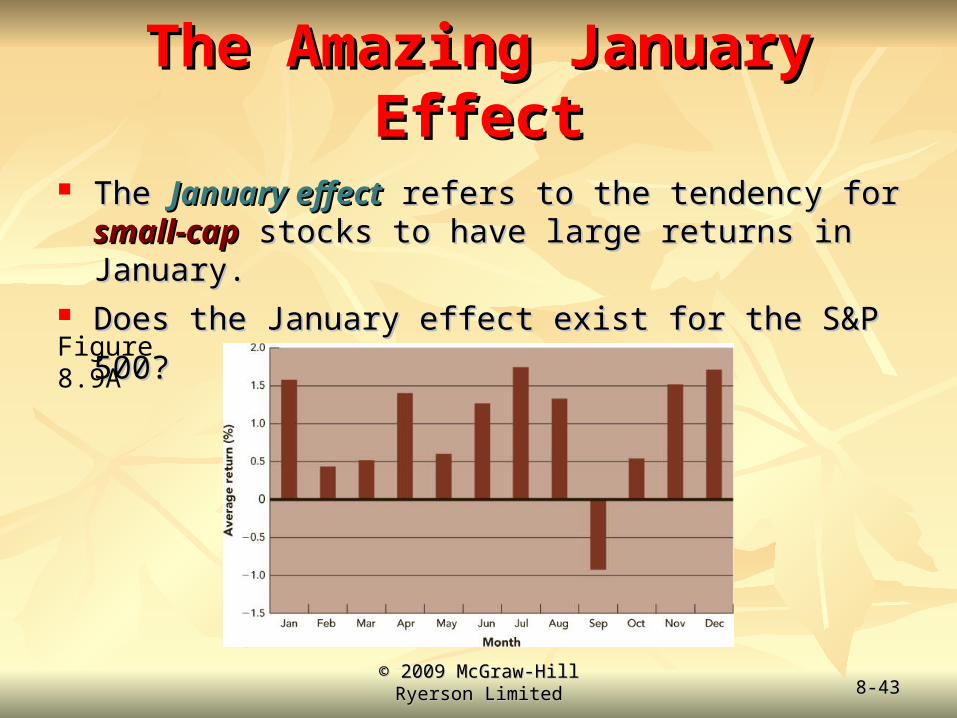
The Amazing January EffectThe Amazing January Effect
The The January effectJanuary effect refers to the tendency for refers to the tendency for small-capsmall-cap stocks stocks to have large returns in January. to have large returns in January.
Does the January effect exist for the S&P 500?Does the January effect exist for the S&P 500? Figure 8.9A
© 2009 McGraw-Hill Ryerson © 2009 McGraw-Hill Ryerson LimitedLimited 8-8-4444
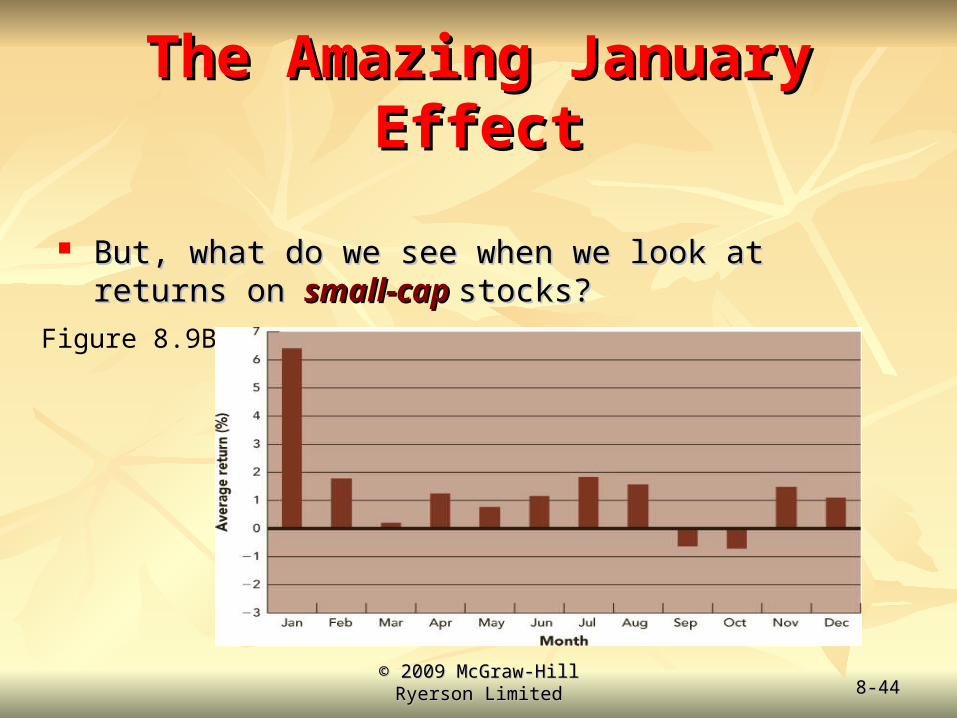
The Amazing January EffectThe Amazing January Effect
But, what do we see when we look at returns on But, what do we see when we look at returns on small-cap small-cap stocks?stocks?
Figure 8.9B
© 2009 McGraw-Hill Ryerson © 2009 McGraw-Hill Ryerson LimitedLimited 8-8-4545
The Turn-of-the-Year EffectThe Turn-of-the-Year Effect Researchers have deeply explored the January effect to see Researchers have deeply explored the January effect to see
whether:whether: the effect is due to returns during the whole month of January, orthe effect is due to returns during the whole month of January, or due to returns bracketing the end of the year. due to returns bracketing the end of the year.
Researchers look at returns over a specific three-week period Researchers look at returns over a specific three-week period and compare these returns to the returns for the rest of the year. and compare these returns to the returns for the rest of the year.
As shown on the next slide, we have calculated daily market As shown on the next slide, we have calculated daily market returns from 1962 through 2004. returns from 1962 through 2004. ““Turn of the Year Days:” the last week of daily returns in a calendar Turn of the Year Days:” the last week of daily returns in a calendar
year and the first two weeks of daily returns in the next calendar year. year and the first two weeks of daily returns in the next calendar year. ““Rest of the Days:” Any daily return that does not fall into this three-Rest of the Days:” Any daily return that does not fall into this three-
week period.week period.

© 2009 McGraw-Hill Ryerson © 2009 McGraw-Hill Ryerson LimitedLimited 8-8-4646
The Turn-of-the-Year Effect, II.The Turn-of-the-Year Effect, II.
Table 8.4Table 8.4
As you can see, the “Turn of the Year” returns are higher than As you can see, the “Turn of the Year” returns are higher than the “Rest of the Days” returns. the “Rest of the Days” returns.
The difference is biggest in the 1962-1983 period.The difference is biggest in the 1962-1983 period.
© 2009 McGraw-Hill Ryerson © 2009 McGraw-Hill Ryerson LimitedLimited 8-8-4747
The Turn-of-the-Month EffectThe Turn-of-the-Month Effect
Researchers have also investigated whether a “Turn-of-the-Researchers have also investigated whether a “Turn-of-the-Month” effect exists. Month” effect exists.
On the next slide, we have separated daily stock market On the next slide, we have separated daily stock market returns into two categories. returns into two categories. ““Turn of the Month Days:”Turn of the Month Days:” Daily returns from the last day of any Daily returns from the last day of any
month or the following three days of the following monthmonth or the following three days of the following month ““Rest of the Days:” Any other daily returns Rest of the Days:” Any other daily returns
© 2009 McGraw-Hill Ryerson © 2009 McGraw-Hill Ryerson LimitedLimited 8-8-4848
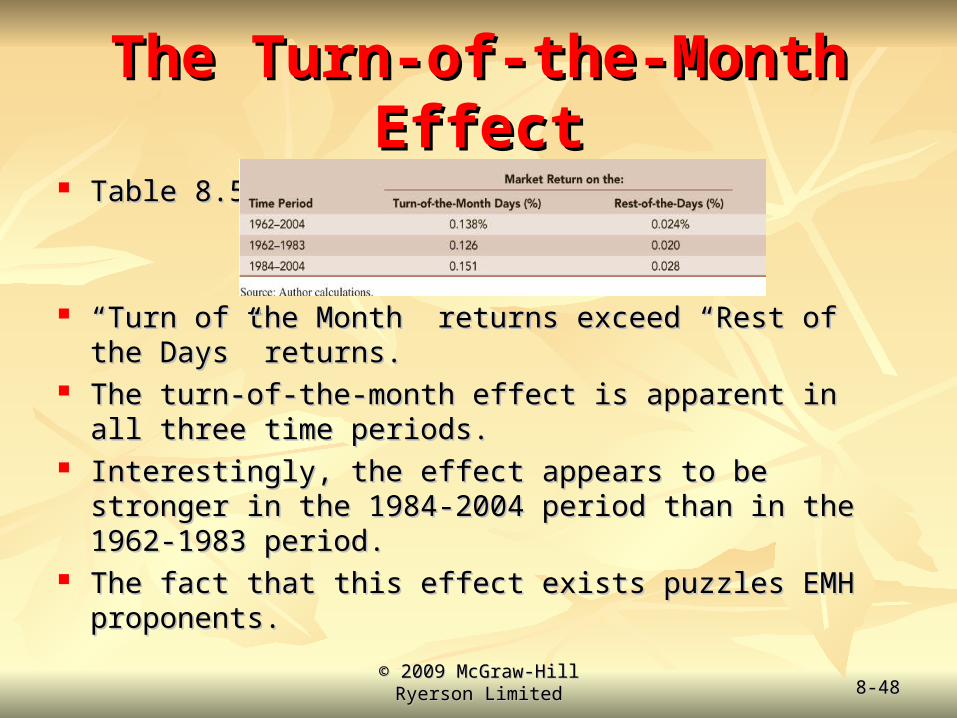
The Turn-of-the-Month EffectThe Turn-of-the-Month Effect
Table 8.5Table 8.5
““Turn of the Month” returns exceed “Rest of the Days” Turn of the Month” returns exceed “Rest of the Days” returns.returns.
The turn-of-the-month effect is apparent in all three time The turn-of-the-month effect is apparent in all three time periods.periods.
Interestingly, the effect appears to be stronger in the 1984-Interestingly, the effect appears to be stronger in the 1984-2004 period than in the 1962-1983 period. 2004 period than in the 1962-1983 period.
The fact that this effect exists puzzles EMH proponents.The fact that this effect exists puzzles EMH proponents.
© 2009 McGraw-Hill Ryerson © 2009 McGraw-Hill Ryerson LimitedLimited 8-8-4949
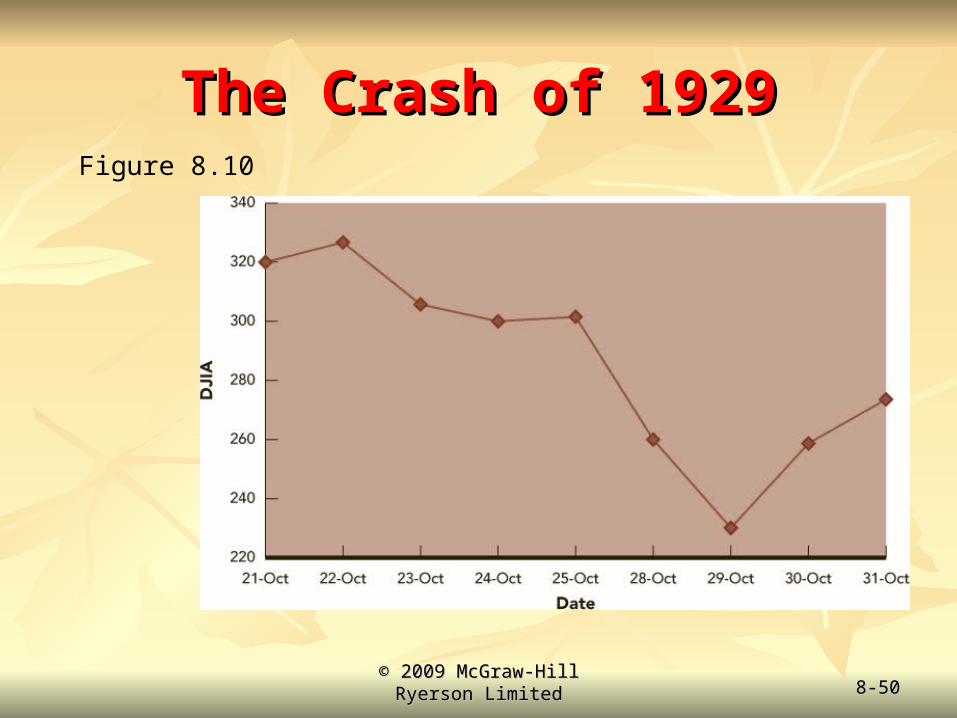
Bubbles and CrashesBubbles and Crashes BubbleBubble: occurs when market prices soar far in excess : occurs when market prices soar far in excess
of what normal and rational analysis would suggest. of what normal and rational analysis would suggest. Investment bubbles eventually pop. Investment bubbles eventually pop. When a bubble does pop, investors find themselves holding When a bubble does pop, investors find themselves holding
assets with plummeting values.assets with plummeting values. A bubble can form over weeks, months, or even years.A bubble can form over weeks, months, or even years.
CrashCrash:: significant and sudden drop in market values. significant and sudden drop in market values. Crashes are generally associated with a bubble.Crashes are generally associated with a bubble. Crashes are sudden, generally lasting less than a week. Crashes are sudden, generally lasting less than a week. However, the financial aftermath of a crash can last for However, the financial aftermath of a crash can last for
years.years.
© 2009 McGraw-Hill Ryerson © 2009 McGraw-Hill Ryerson LimitedLimited 8-8-5050
The Crash of 1929The Crash of 1929Figure 8.10
© 2009 McGraw-Hill Ryerson © 2009 McGraw-Hill Ryerson LimitedLimited 8-8-5151
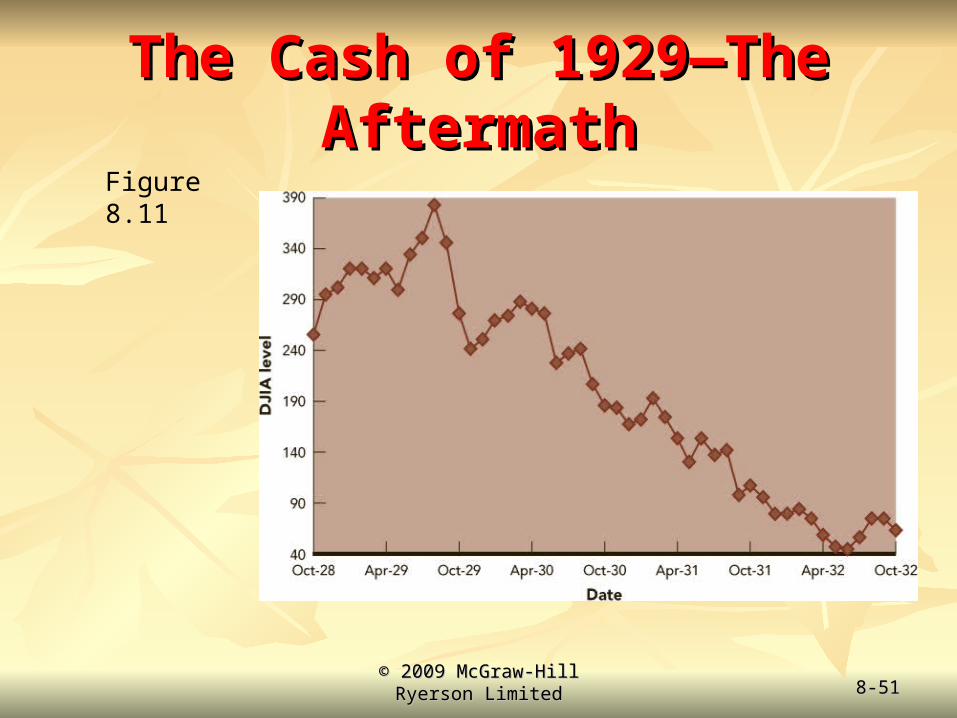
The Cash of 1929—The The Cash of 1929—The AftermathAftermath
Figure 8.11
© 2009 McGraw-Hill Ryerson © 2009 McGraw-Hill Ryerson LimitedLimited 8-8-5252
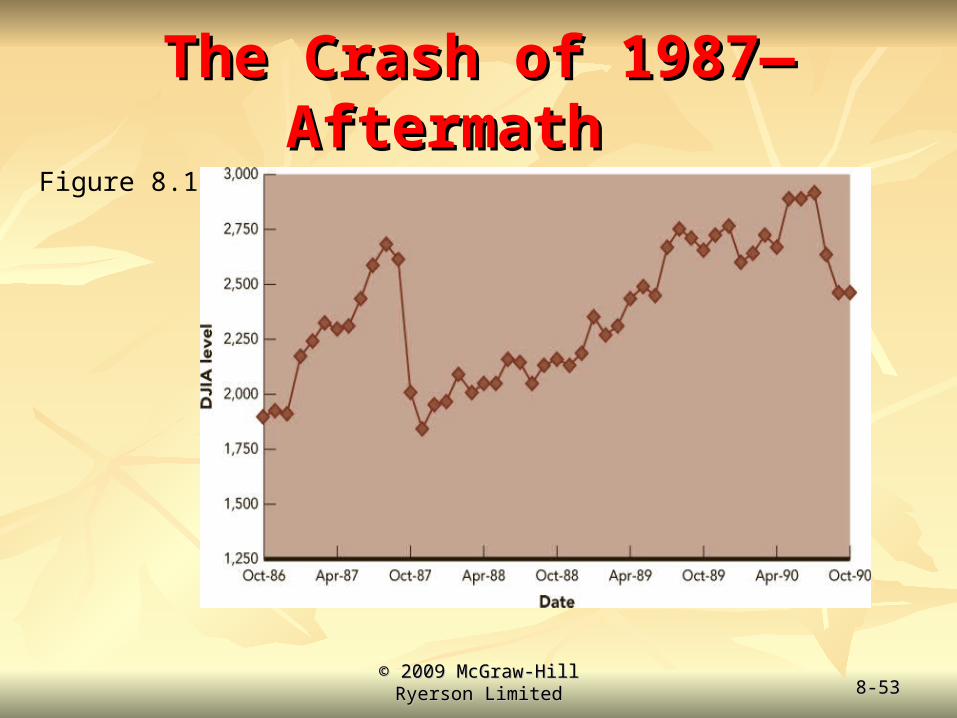
The Crash of 1987The Crash of 1987 Once, when we spoke of Once, when we spoke of thethe Crash Crash, , we meant October 29, we meant October 29,
1929. That was until October 1987.1929. That was until October 1987.
The Crash of 1987 began on Friday, October 16th. The Crash of 1987 began on Friday, October 16th. The DJIA fell 108 points to close at 2,246.73. The DJIA fell 108 points to close at 2,246.73. First time in history that the DJIA fell by more than 100 points in one First time in history that the DJIA fell by more than 100 points in one
day.day.
On October 19, 1987, the DJIA lost about 22.6% of its value On October 19, 1987, the DJIA lost about 22.6% of its value on a new record volume (about 600 million shares) on a new record volume (about 600 million shares)
The DJIA plummeted 508.32 points to close at 1,738.74. The DJIA plummeted 508.32 points to close at 1,738.74. During the day on Tuesday, October 20th, the DJIA continued to During the day on Tuesday, October 20th, the DJIA continued to
plunge in value, reaching an intraday low of 1,616.21. plunge in value, reaching an intraday low of 1,616.21. But, the market rallied and closed at 1,841.01, up 102 points. But, the market rallied and closed at 1,841.01, up 102 points.
© 2009 McGraw-Hill Ryerson © 2009 McGraw-Hill Ryerson LimitedLimited 8-8-5353
The Crash of 1987—Aftermath The Crash of 1987—Aftermath Figure 8.12
© 2009 McGraw-Hill Ryerson © 2009 McGraw-Hill Ryerson LimitedLimited 8-8-5454
Circuit BreakersCircuit Breakers As a result of the Crash of 1987, there have been As a result of the Crash of 1987, there have been
some significant market changes.some significant market changes.
One of the most interesting changes was the One of the most interesting changes was the introduction of the introduction of the NYSE circuit breakersNYSE circuit breakers..
Different circuit breakers are triggered if the DJIA Different circuit breakers are triggered if the DJIA drops by 10, 20, or 30 percent. drops by 10, 20, or 30 percent. A 10 percent drop will halt trading for at most one hourA 10 percent drop will halt trading for at most one hour A 20 percent drop will halt trading for at most two hoursA 20 percent drop will halt trading for at most two hours A 30 percent drop will halt trading for the remainder of the A 30 percent drop will halt trading for the remainder of the
dayday
© 2009 McGraw-Hill Ryerson © 2009 McGraw-Hill Ryerson LimitedLimited 8-8-5555
The Asian CrashThe Asian Crash The crash of the Nikkei Index, which began in 1990, The crash of the Nikkei Index, which began in 1990,
lengthened into a particularly long bear market. lengthened into a particularly long bear market.
It is quite like the Crash of 1929 in that respect. It is quite like the Crash of 1929 in that respect.
The Asian Crash started with a booming bull market in the The Asian Crash started with a booming bull market in the 1980s. 1980s.
Japan and emerging Asian economies seemed to be forming a Japan and emerging Asian economies seemed to be forming a powerful economic force. The “Asian economy” became an powerful economic force. The “Asian economy” became an investor outlet for those wary of the U.S. market after the investor outlet for those wary of the U.S. market after the Crash of 1987.Crash of 1987.
© 2009 McGraw-Hill Ryerson © 2009 McGraw-Hill Ryerson LimitedLimited 8-8-5656
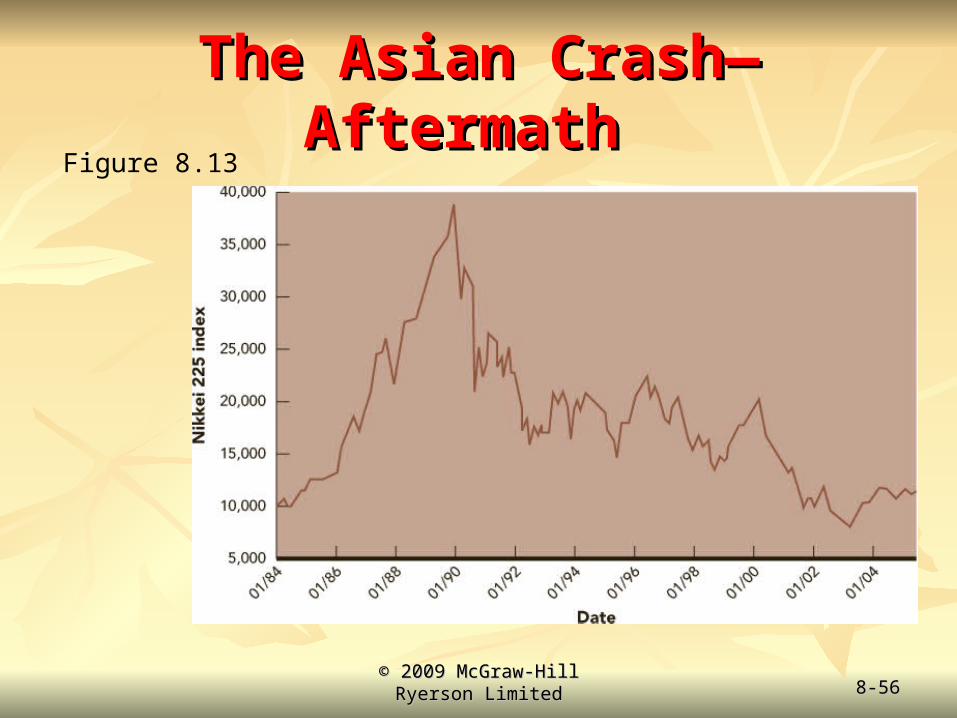
The Asian Crash—Aftermath The Asian Crash—Aftermath Figure 8.13
© 2009 McGraw-Hill Ryerson © 2009 McGraw-Hill Ryerson LimitedLimited 8-8-5757
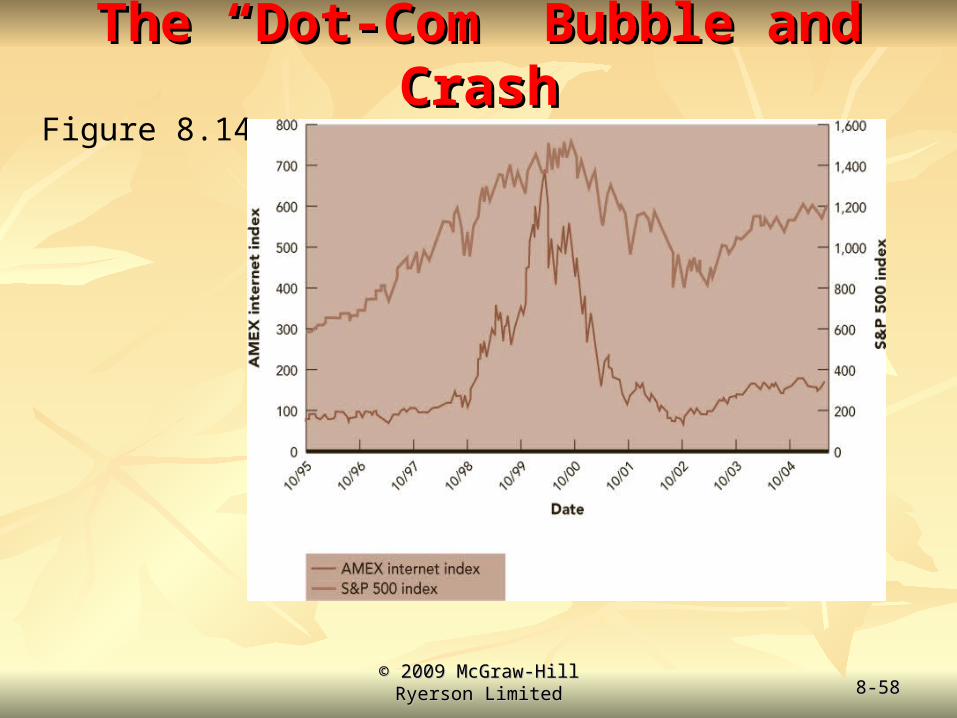
The “Dot-Com” Bubble and CrashThe “Dot-Com” Bubble and Crash By the mid-1990s, the rise in Internet usage and its global By the mid-1990s, the rise in Internet usage and its global
growth potential fueled widespread excitement over the “new growth potential fueled widespread excitement over the “new economy.” economy.”
Investors seemed to care only about big ideas. Investors seemed to care only about big ideas.
Investor euphoria led to a surge in Internet IPOs, which were Investor euphoria led to a surge in Internet IPOs, which were commonly referred to as “DotComs” because so many of their commonly referred to as “DotComs” because so many of their names ended in “.com.”names ended in “.com.”
The lack of solid business models doomed many DotComs. The lack of solid business models doomed many DotComs.
Many of them suffered huge losses.Many of them suffered huge losses.
© 2009 McGraw-Hill Ryerson © 2009 McGraw-Hill Ryerson LimitedLimited 8-8-5858
The “Dot-Com” Bubble and CrashThe “Dot-Com” Bubble and CrashFigure 8.14