7KH LPSDFW RI TXDOLILFDWLRQ UHIRUP RQ …U -DPLH %HGGRZ ± &RYHQWU\ 8QLYHUVLW\ (OOHQ %HOO 8QLYHUVLW\...
80
1 RESEARCH AND ANALYSIS The impact of qualification reform on the practical skills of A level science students Paper 5: Final report on the pre- and post-reform evaluation of science practical skills
Transcript of 7KH LPSDFW RI TXDOLILFDWLRQ UHIRUP RQ …U -DPLH %HGGRZ ± &RYHQWU\ 8QLYHUVLW\ (OOHQ %HOO 8QLYHUVLW\...
1
RESEARCH AND ANALYSIS
The impact of qualification reform on the practical skills of A level science students
Paper 5: Final report on the pre- and post-reform evaluation of science practical skills
The impact of qualification reform on the practical skills of A level science students
2
Authorship This report was written by Stuart Cadwallader of the Strategy, Risk and Research Directorate.
Acknowledgements The author gratefully acknowledges the support and expertise of the working group that assisted in the inception of the research design and the development of assessment materials for this study. This group comprised the following individuals:
Dr Ian Abrahams – University of Lincoln
Dr Sarah Askey
Dr Matthew Baker – Bath Spa University
Neil Dixon
Dr Nicolas Fotou – Maynooth University
Dr Tasnim Munshi – University of Lincoln
Dr Zoe Prytherch - Cardiff University
Dr Andrew Shore – Cardiff University
Steve Tilling – Field Studies Council
The author would also like to thank the Royal Society of Biology, the Royal Society of Chemistry, the Institute of Physics, CLEAPPS, the Gatsby Foundation, the Wellcome Trust, and the Field Studies Council for their advice and expertise.
The author is very grateful for the hard work, dedication and expertise of the staff from the university departments who participated in this study. In particular, the author would like to thank the following individuals for leading the delivery of the assessment in their departments:
Dr Helena Batalha - University of East Anglia
Dr Jamie Beddow – Coventry University
Ellen Bell - University of East Anglia
Dr Matthew Booth – University of Lincoln
Professor Neil Bricklebank – Sheffield Hallam University
Dr Susan Burrows – University of Warwick
The impact of qualification reform on the practical skills of A level science students
3
Professor Penny Gowland – University of Nottingham
Dr Elaine Green – Coventry University
Professor Nicholas Green – University of Oxford
Dr Tom Hase – University of Warwick
Dr Harriet Jones – University of East Anglia
Dr Mossy Kelly – University of Hull
Daniel Kinsman – Sheffield Hallam University
Dr Jason Kirk – University of Central Lancashire
Dr Mark Leyland – University of Leicester
Dr Darren Mernagh – University of Portsmouth
Dr Tasnim Munshi – University of Lincoln
Dr Laura Patel – Imperial College London
Dr Zoë Prytherch - Cardiff University
Dr Andrew Shore – Cardiff University
Dr Howard Snelling – University of Hull
Dr Malcolm Stewart – University of Oxford
Dr Helen Woodfield - Cardiff University
Finally, the author is grateful for feedback received from members of Ofqual’s Research Advisory and Standards Advisory groups.
The impact of qualification reform on the practical skills of A level science students
4
Contents Authorship ........................................................................................................................... 2
Acknowledgements ............................................................................................................ 2
Executive Summary ............................................................................................................ 5
1 Introduction ...................................................................................................................... 7
1.1 The assessment of practical skills at A level ................................................................ 7
1.2 Research rationale and preliminary findings ................................................................ 9
1.3 Terminology .............................................................................................................. 10
2 Method summary ........................................................................................................... 11
3 Results ............................................................................................................................ 14
3.1 Biology ...................................................................................................................... 15
3.2 Chemistry .................................................................................................................. 21
3.3 Physics ...................................................................................................................... 25
4 Discussion ...................................................................................................................... 31
4.1 Limitations of the research ........................................................................................ 33
4.2 Conclusions............................................................................................................... 35
5 References ..................................................................................................................... 36
6 Annex A: Ofqual’s A level science research programme ............................................ 39
7 Annex B: Biology PSM................................................................................................... 40
8 Annex C: Chemistry PSM .............................................................................................. 52
9 Annex D: Physics PSM .................................................................................................. 62
10 Annex E: Mean percentage of criteria achieved across tasks by subject ................ 78
The impact of qualification reform on the practical skills of A level science students
5
Executive Summary Schools and colleges have taught reformed A level science qualifications since September 2015. One significant feature of these science qualifications is that practical skills are now assessed through 2 distinct approaches (Ofqual, 2015a). First, each student’s practical work is directly assessed (through observation) by their teacher. This assessment must take place throughout the student’s studies and must include a minimum of 12 ‘hands-on’ practical assignments. Students are assessed against criteria which reflect the broad competencies that A level science students are expected to develop and receive a separate grade for their performance (either ‘Pass’ or ‘Not Classified’). This assessment is called the practical endorsement, the result of which is reported alongside the A level primary grade of A* to E. Second, it is expected that at least 15% of the marks for the assessments by examination will be made available in respect of questions that indirectly assess practical skills. The term ‘indirectly’ is used because conventional written examinations cannot assess practical work as it is undertaken, but they can be used to assess a broad range of skills and knowledge that relate to, and are fostered by, practical work.
The intention behind these new arrangements is to facilitate more frequent practical work that is better integrated with course content and is assessed in a valid and manageable way. However, when the plans for the new science A levels were first shared for public consultation (Ofqual, 2013), some stakeholders raised concerns that schools may deprioritise practical work as a result of the new assessment arrangements. The fear was that separating the direct assessment of practical skills (via the endorsement) from the primary A level grade may send a potentially damaging message to schools, teachers and students about the importance of practical work (eg Gatsby, 2014; Wellcome Trust, 2014).
To investigate these concerns, Ofqual undertook a programme of research to evaluate the impact of the reform on the practical skills acquired by A level science students. This report describes findings from one strand of this programme: a quasi-experimental study that compares the practical skills of those who studied pre-reform A levels to those who studied the post-reform equivalent (see Annex A for details of the other research strands). This report follows on from a previous Ofqual publication (Paper 2: pre- and post-reform evaluation of science practical skills1), and we recommend that you read this if you require further detail of the methodology or research literature relating to the definition and assessment of practical skill in science (please see Ofqual, 2018a).
In brief, Ofqual worked with subject experts to develop 3 bespoke assessments of ‘hands-on’ practical science skills, one for each of biology, chemistry and physics. These Practical Skills Measures (PSMs) were administered to new first year undergraduates (prior to any formal teaching) in 15 university departments over 3 separate academic years (2016, 2017, and 2018). The 2016 cohort included only students who had taken pre-reform A levels, while the 2017 and 2018 cohorts included only students who had taken post-reform A levels.
1 Paper 2 can be found at the link below: https://assets.publishing.service.gov.uk/government/uploads/system/uploads/attachment_data/file/706839/A_level_science_Study_2_-_2018.05.03.pdf
The impact of qualification reform on the practical skills of A level science students
6
The results suggest that, overall, the post-reform students outperformed the pre-reform students for biology (with the 2017 cohort outperforming the 2016 cohort and then itself being outperformed by the 2018 cohort), but there was no statistically significant difference between the cohorts for either chemistry or physics. Self-report questionnaire data from the participating students suggests that post-reform students had undertaken practical work more frequently in biology and physics while studying for their A levels than pre-reform students. There was no difference between the cohorts in the case of chemistry
The findings therefore provide cause for optimism as they suggest that there has not been a decline in the practical skills of A level science students since the reform. In fact, there is some evidence that practical skills in biology may be somewhat better in post-reform cohorts. However, despite these positive findings, it is important to interpret the data within the limitations of the research methodology. For example, the sample does not perfectly represent the full population of students who take science A levels because it excludes anyone who decided not to pursue science into higher education.
It is also important to be aware of the fluidity of the situation in schools and colleges. The reformed qualifications are still relatively new and the way in which examination boards and teachers implement them may change over time. It therefore remains important to continue to monitor the impact of the new qualifications and the accompanying assessment arrangements in schools and colleges.
The impact of qualification reform on the practical skills of A level science students
7
1 Introduction Schools and colleges have taught reformed A level science qualifications since September 2015. The reform has introduced a significant change to the arrangements for assessing students’ practical skills and Ofqual has been undertaking a range of activities to evaluate the impact of this new approach, including a programme of research (see Annex A). This programme includes a 3-year cross-sectional quasi-experimental study conducted in collaboration with 15 university science departments from across the UK. The study essentially compares the practical skills of undergraduates that completed the pre-reform science A level qualifications with those of undergraduates who completed the new (post-reform) A levels, prior to them having any further training from their university.
This is a direct follow up to a previously published report that describes findings from the first 2 of 3 phases of data collection for this study; Paper 2: pre- and post-reform evaluation of science practical skills (Ofqual, 2018a). The current report will provide a brief recap on the rationale and the methodology before focusing on the substantive findings arising from the third and final phase of data collection, and from the research study as a whole. For a literature review on the assessment of practical skills, a thorough explanation of the rationale, and a more detailed description of the research methodology, we recommend that you refer to the aforementioned Paper 2.
1.1 The assessment of practical skills at A level The Department for Education (DfE, 2014) specifies the practical skills which are to be developed through teaching and learning in the new (post-reform) A level qualifications. A distinction is made between those skills which are to be assessed directly and those which are to be assessed indirectly, terminology which was developed by Reiss, Abrahams & Sharpe (2012). Direct assessment of practical skills (DAPS) relies on the observation of students as they physically undertake practical work. Their competency is directly determined as they perform a particular skill. For indirect assessment of practical skills (IAPS), competency is inferred from a secondary source of information. This source may be a written report of the practical work, the data generated from an experiment, or a response to a relevant examination question.
Reiss, Abrahams & Sharpe (2012) suggest that there are various advantages and disadvantages to each of DAPS and IAPS. They consider DAPS to be a more valid assessment of ‘hands on’ practical skills because it involves the observation of the relevant skills in practice - it requires the student to physically manipulate objects and apparatus as part of the assessment. However, DAPS has logistical disadvantages in that it generally requires the use of a sufficiently well-resourced laboratory environment, meaning that high quality provision can often be costly and impractical (Sund, 2016). On the other hand, IAPS perhaps lacks the inherent validity of DAPS but it is relatively controllable, manageable and affordable for the purposes of large-scale assessment, while it is still able to elicit and assess a broad range of skills and knowledge that relate to practical work.
The pre-reform assessment arrangements involved little or no DAPS, focusing instead on the planning of practical work and the analysis of data (Abrahams, Reiss, & Sharpe, 2013). These pre-reform arrangements were not well-regarded by
The impact of qualification reform on the practical skills of A level science students
8
teachers and exam boards, who, along with Ofqual, identified a number of issues which were threatening their validity and potentially undermining teaching and learning (Ofqual, 2013, 2017a; Wilson, Wade, & Evans, 2016). In an effort to rectify some of the issues with the previous assessment arrangements, and to balance the strengths and weaknesses of DAPS and IAPS, the assessment of practical skills in the post-reform A level science qualifications is achieved in 2 ways:
Written examinations. It is expected that at least 15% of the marks for the assessments by examination will be made available in respect of questions that indirectly assess practical skills. The DfE (2014) specify the types of skills that should be assessed by examination questions, which can cover a broad range of skills and knowledge in relation to practical work. For example, a practical skills question might assess a student’s ability to design an experiment, to interpret data, to draw a graph, or to demonstrate understanding of the functioning of a scientific instrument.
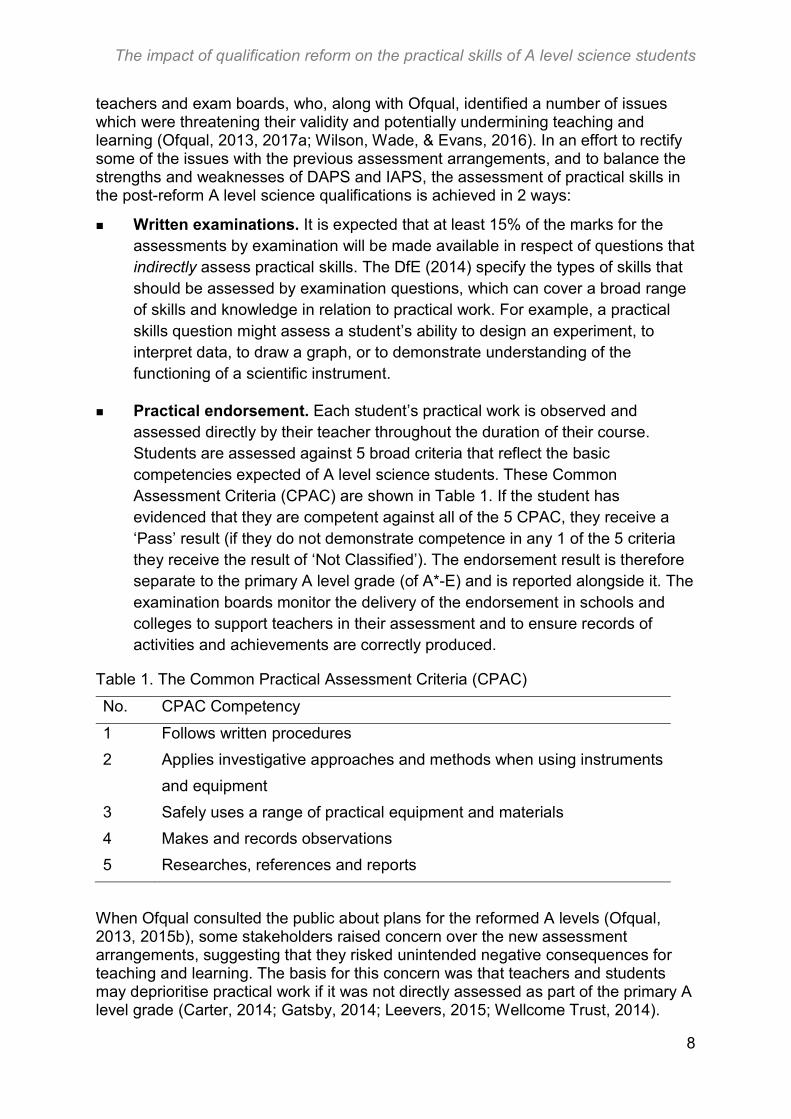
Practical endorsement. Each student’s practical work is observed and assessed directly by their teacher throughout the duration of their course. Students are assessed against 5 broad criteria that reflect the basic competencies expected of A level science students. These Common Assessment Criteria (CPAC) are shown in Table 1. If the student has evidenced that they are competent against all of the 5 CPAC, they receive a ‘Pass’ result (if they do not demonstrate competence in any 1 of the 5 criteria they receive the result of ‘Not Classified’). The endorsement result is therefore separate to the primary A level grade (of A*-E) and is reported alongside it. The examination boards monitor the delivery of the endorsement in schools and colleges to support teachers in their assessment and to ensure records of activities and achievements are correctly produced.
Table 1. The Common Practical Assessment Criteria (CPAC)
No. CPAC Competency
1 Follows written procedures
2 Applies investigative approaches and methods when using instruments
and equipment
3 Safely uses a range of practical equipment and materials
4 Makes and records observations
5 Researches, references and reports
When Ofqual consulted the public about plans for the reformed A levels (Ofqual, 2013, 2015b), some stakeholders raised concern over the new assessment arrangements, suggesting that they risked unintended negative consequences for teaching and learning. The basis for this concern was that teachers and students may deprioritise practical work if it was not directly assessed as part of the primary A level grade (Carter, 2014; Gatsby, 2014; Leevers, 2015; Wellcome Trust, 2014).
The impact of qualification reform on the practical skills of A level science students
9
Such a consequence would have completely undermined the intention behind the new assessment arrangements, which was to promote practical work and allow teachers to better integrate it with their lessons (Cambridge Assessment, 2016; Evans & Wade, 2015; Ofqual, 2013; Stacey, 2015). For a more detailed discussion of the rationale behind the new assessment arrangements, and the challenges and potential issues associated with the change, please refer to Ofqual’s earlier report on this study (Paper 2, Ofqual, 2018a).
1.2 Research rationale and preliminary findings Overall, the aim of this report is to investigate the following question:
What impact has the reform of A level science qualifications had on the practical skills that are acquired by students?
This report seeks to build on the previously reported findings to provide evidence that improves our understanding of the reform and informs future decisions around the assessment of practical skills. The intention is to evaluate the impact of the new assessment arrangements at an overall policy level.
The preliminary research findings from this study were encouraging. When comparing the pre-reform (2016) cohort with the first post-reform (2017) cohort, there was no evidence to suggest that practical skills had declined in either chemistry or physics, and some tentative evidence that practical skills in biology may have improved (see Ofqual, 2018a). In addition, for biology and physics (but not chemistry), participants from the post-reform (2017) cohort reported that they had undertaken practical work more frequently than participants from the pre-reform (2016) cohort.
With regard to this second finding, Ofqual’s research reflects student’s perceptions of how frequently practical work featured in lessons and does not necessarily equate to an increase in lesson time spent doing practical work. Research from Durham University (Cramman et al., 2019) has considered the number of hours of practical work that is conducted in schools using a survey of over 4,000 science teachers and technicians. This nuanced research found differences between subjects and school types but concluded that, overall, the amount of practical work being undertaken by 16-18 year old students has, so far, been stable since qualification reform.
Although Durham’s research found the amount of practical work being undertaken in schools and colleges to be relatively stable, it is worth noting that science teachers (and technicians) in their focus groups perceived the introduction of the recommended practical work activities in the reformed qualifications to be leading to a greater a focus on practical work (Cramman et al., 2019, p. 35). It may be that the nature and relevance of the practical work that is being undertaken has changed, even if the number of hours being spent on it has not. This would mirror findings from qualitative work that was conducted by Ofqual (2017a).
The impact of qualification reform on the practical skills of A level science students
10
1.3 Terminology Before continuing, a note on the definition of the term ‘practical skills’. As observed by Abrahams, Reiss & Sharpe (2013), the term is widely used but rarely defined with much precision. The term is often used in a broad and inclusive manner, encompassing both physical ‘doing’ skills and intellectual ‘thinking’ skills without explicitly distinguishing them. For example, the term ‘practical skills’ can sometimes be used to describe all of the skills and knowledge one might draw upon to conduct a scientific investigation. This would include the diverse skills required to plan and design a study, to undertake the necessary experimental work, to analyse the resulting data, and to report the findings with reference to the research literature.
Alternatively, some definitions focus purely on the ‘hands on’ manual skills that are associated with handling apparatus. Where this is the case, separate terminology is used for describing the thinking and planning skills that may be involved in scientific investigation. In the context of this study, this report uses terminology summarised by Abrahams & Reiss (2015, p. 40), which is in part based on the work of Gott & Duggan (2002):
Conceptual understanding – knowledge of substantive scientific concepts (eg photosynthesis, thermodynamics) which is underpinned by facts.
Process skills – generic skills that are generalisable and transferable between contexts (eg observation, measurement, planning, communication).
Practical skills – specific performance skills for undertaking non-written manual tasks (eg performing a titration, reading an oscilloscope).
Understandably, this definitional complexity presents a significant challenge when discussing education, assessment and the relevant research literature. The reality is that, in practice, most practical activities will involve both process and practical skills. Many tasks will also rely on some degree of conceptual understanding if the student is to truly comprehend what they are doing. Harlen (1999) has argued that the various elements that underpin practical work are likely to be inseparable when it comes to effective teaching, learning and assessment. This study does not attempt to artificially separate specific practical skills (as defined above) from process skills and conceptual understanding, but employs the above terminology in an effort to provide clarity when discussing the methodology and findings.
The impact of qualification reform on the practical skills of A level science students
11
2 Method summary This section provides an overview of the methodology – for further detail please refer to Ofqual’s earlier report on this study (Paper 2, Ofqual, 2018a). In summary, this study employed a quasi-experimental design to compare the practical skills of 3 cohorts of students:
1. Students who completed pre-reform science A levels in 2016
2. Students who completed post-reform science A levels in 2017 (the 1st post-reform cohort)
3. Students who completed post-reform science A levels in 2018 (the 2nd post-reform cohort)
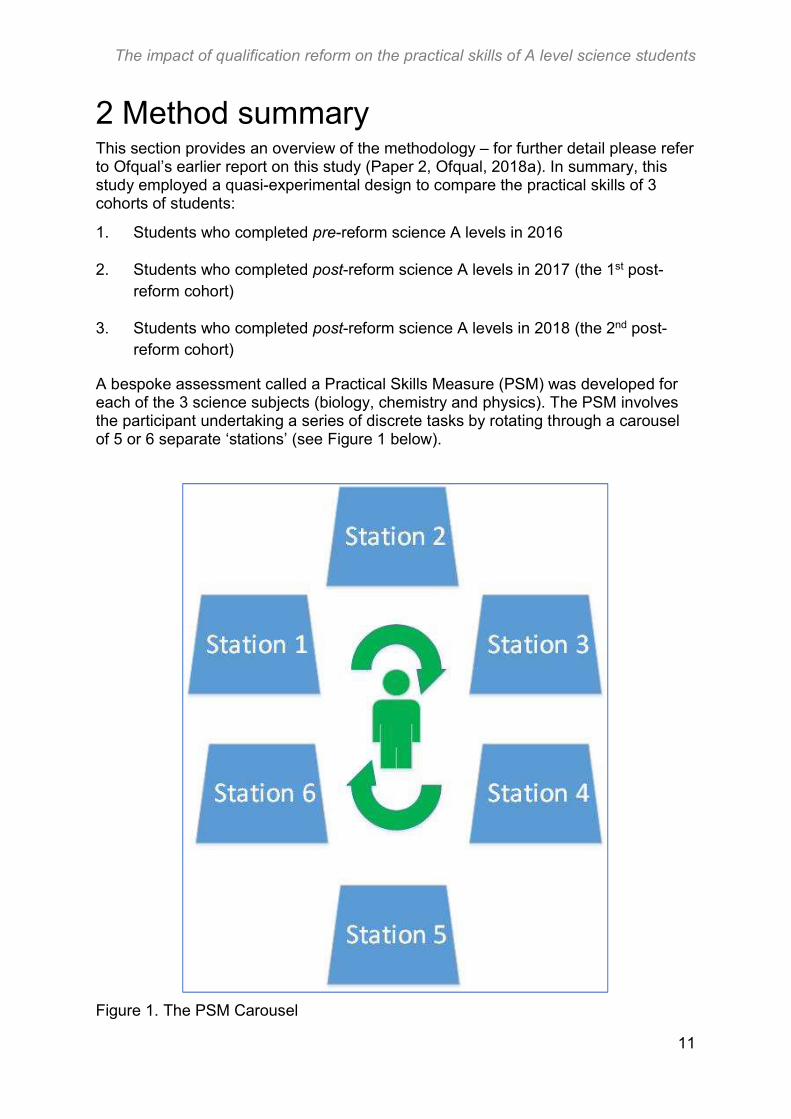
A bespoke assessment called a Practical Skills Measure (PSM) was developed for each of the 3 science subjects (biology, chemistry and physics). The PSM involves the participant undertaking a series of discrete tasks by rotating through a carousel of 5 or 6 separate ‘stations’ (see Figure 1 below).
Figure 1. The PSM Carousel
The impact of qualification reform on the practical skills of A level science students
12
The tasks themselves were developed to assess skills equally prevalent in both pre-reform and post-reform A levels. Though performance on these individual skills are of interest, our primary concern is with how overall performance across these skills varies between cohorts. Performance on individual tasks is likely to be quite variable given that factors such as when specifically the skill is taught during the two years of the A level course are likely to be important. The focus was on practical and process skills that are most validly assessed directly by observing the participant as they perform a hands-on practical task. In this way, the intention is to test skills that would have been assessed by the practical endorsement to a greater degree than those that could be assessed through a written examination.
Participants have 15 minutes to undertake the task at each station. Participants are provided with instructions and apparatus but must undertake the activity without assistance. They are directly observed by an assessor, who records whether or not the participant meets a set of task specific assessment criteria. The assessment criteria were designed with the intention that they be unambiguous in nature (eg the assessor should be able to easily judge whether the candidate has or has not achieved each of the assessment criterion). In the case of the biology PSM, some of the criteria could be ‘exceeded’. In such cases, participants were assessed against an additional and distinct ‘exceed’ criterion that operated in much the same way as the other assessment criteria. The ‘exceed’ criteria required either an additional or an alternative action from the participant (one that more closely reflected ‘best practice’ than the standard criteria). Please see Annex B for examples.
Data collection took place in 15 university departments in 2016 (phase 1) and 2017 (phase 2). In 2018, 13 of these university departments took part (phase 3). Participants were first year undergraduates who had completed science A levels during the preceding summer but were yet to receive any training from their new institution. This was to avoid the risk of any bias from some students receiving training beyond that which they had received at A level. For more details of the materials, procedure and participating universities, please refer to the methodology section in the Paper 2 report (Ofqual, 2018a). The tasks and assessment criteria are provided in full for each subject specific PSM in Annex B (biology), Annex C (chemistry) and Annex D (physics).
Each university department took a slightly different approach to recruiting students to participate. In broad terms, there were 2 main approaches: either the university would timetable data collection as part of their induction for new students or they would schedule a separate session and invite students to attend. In all cases, participation was voluntary and students took part only if they had read and completed the informed consent paperwork. However, it is reasonable to suggest that recruitment to the study was more successful where it was presented to students as an integrated part of their first year course (albeit one from which they could opt-out).
HEIs were paid a fee for their participation in the study. This fee was generally sufficient to cover their costs for materials and for staff time but was not large enough to act as a financial incentive to participation. It constituted a basic fee and a variable fee (per assessor, per day), which was dependent on the manner in which the HEI ran the PSM and how many participants were involved. The universities who participated therefore did so mainly out of a spirit of collaboration rather than for
The impact of qualification reform on the practical skills of A level science students
13
financial reward. They were keen to support educational research and the objectives of the study.
University science departments have a diverse intake of undergraduates and not all of their students had completed A level science qualifications. Some of the participants were international students and had taken qualifications aimed at school-leavers in their home country. Other students had come through the English school system but had studied alternative qualifications (eg. BTEC) or had taken a gap year (and therefore had not taken A levels in the year which they had started their degree course). Though some departments invited only students who had completed A levels earlier in the year, most were keen to allow all of their new students to participate in the study, should they wish to do so. Only those students who had completed the relevant A level in the summer prior to data collection are included in the analysis that follows.
The impact of qualification reform on the practical skills of A level science students
14
3 Results This section provides a summary of how each of 3 cohorts of new science undergraduate students performed on each subject specific PSM (biology, chemistry and physics). The analysis seeks to explore and explain any differences between the performances of the pre- and post-reform cohorts for each subject. The following information is presented:
A breakdown of the participants by series (2016, 2017 and 2018), university and mean A level performance
A breakdown of participants responses to the following questions:
o “To what extent do you agree with the following statement: I feel confident about carrying out practical work”
o “Please estimate how often you did practical work in your school or college during your science A levels”
A breakdown of mean PSM performance by task (each PSM comprises 5 to 6 tasks) and series
Results from a multiple linear regression model for which the outcome variable was the ‘mean percentage of criteria met across tasks’2 and the following explanatory variables were included:
o Cohort: 2016 (pre-reform), 2017 (post-reform), or 2018 (post-reform)
o The participant’s A level grade in the relevant subject
o The participant’s overall performance at A level (a tariff score calculated by converting all of the candidate’s A level grades onto a numbered scale and summing them)
o The university at which the participant completed the PSM
Before discussing the analysis for each subject specific PSM, it is important to note how missing data has been handled. For various reasons, participants sometimes only partially completed the PSM carousel, missing one or more of the tasks. Where participants have missed only one of the tasks in the PSM carousel, they have been included in the analysis. Those participants who missed two or more tasks have been excluded from the analysis3.
2 A histogram of the outcome variable for each subject can be found in Annex E. 3 For the purposes of comparison, statistical models in which there was no tolerance for missing data (eg participants were only included in the analysis if they fully completed all of the tasks) were also computed. There were no substantive differences in the findings.
The impact of qualification reform on the practical skills of A level science students
15
Alongside the statistical models presented in this report, a number of other models were also created and tested. The models in this report provide the most parsimonious approach to the data. However, alternative models were also created to account for the possibility of interactions between explanatory variables or for the hierarchical structure of the data (ie we used a hierarchical model which nested the performance on individual tasks within individual participants). In almost all cases, the substantive findings that these more complex models produced were no different to those of the main models. However, where such models did produce results that were notably different, they are discussed under the relevant subject heading.
It is also important to note that, due to unforeseen circumstances, two of the university physics departments who took part in previous series were unable to participate in 2018. There was a similar issue in 2016, where one of the chemistry departments took part but was unable to provide valid data. In these cases, all available data has been used for the analysis. However, for the purposes of comparability, alternative models that exclude universities with missing data (from any one year) were also created. Again, such alternative models are discussed only where they produce results that are notably different to the primary models.
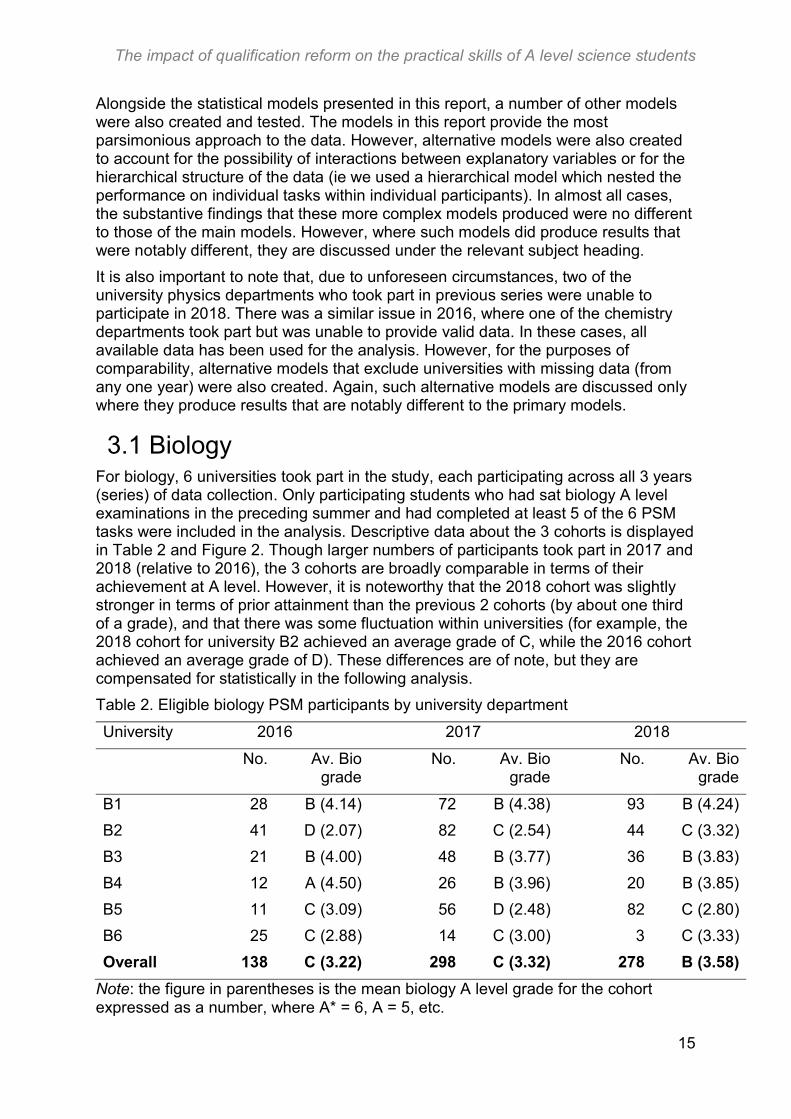
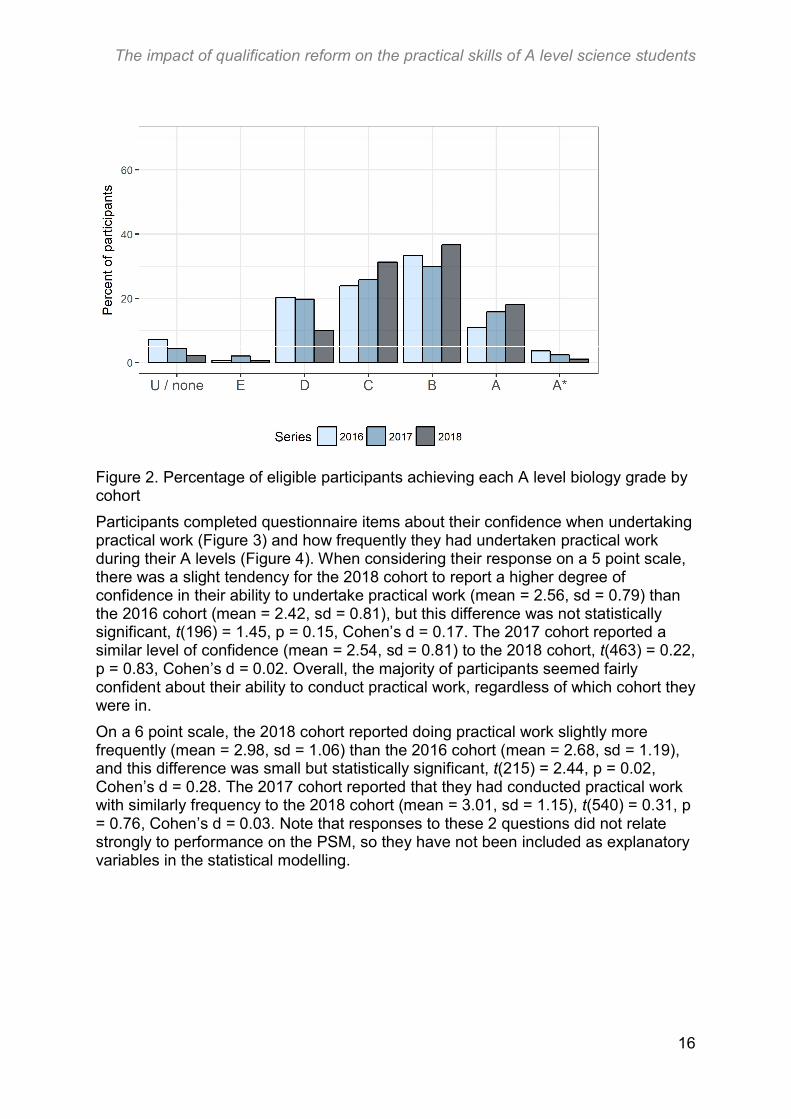
3.1 Biology For biology, 6 universities took part in the study, each participating across all 3 years (series) of data collection. Only participating students who had sat biology A level examinations in the preceding summer and had completed at least 5 of the 6 PSM tasks were included in the analysis. Descriptive data about the 3 cohorts is displayed in Table 2 and Figure 2. Though larger numbers of participants took part in 2017 and 2018 (relative to 2016), the 3 cohorts are broadly comparable in terms of their achievement at A level. However, it is noteworthy that the 2018 cohort was slightly stronger in terms of prior attainment than the previous 2 cohorts (by about one third of a grade), and that there was some fluctuation within universities (for example, the 2018 cohort for university B2 achieved an average grade of C, while the 2016 cohort achieved an average grade of D). These differences are of note, but they are compensated for statistically in the following analysis.
Table 2. Eligible biology PSM participants by university department
University 2016 2017 2018
No. Av. Bio grade
No. Av. Bio grade
No. Av. Bio grade
B1 28 B (4.14) 72 B (4.38) 93 B (4.24)
B2 41 D (2.07) 82 C (2.54) 44 C (3.32)
B3 21 B (4.00) 48 B (3.77) 36 B (3.83)
B4 12 A (4.50) 26 B (3.96) 20 B (3.85)
B5 11 C (3.09) 56 D (2.48) 82 C (2.80)
B6 25 C (2.88) 14 C (3.00) 3 C (3.33)
Overall 138 C (3.22) 298 C (3.32) 278 B (3.58)
Note: the figure in parentheses is the mean biology A level grade for the cohort expressed as a number, where A* = 6, A = 5, etc.
The impact of qualification reform on the practical skills of A level science students
16
Figure 2. Percentage of eligible participants achieving each A level biology grade by cohort
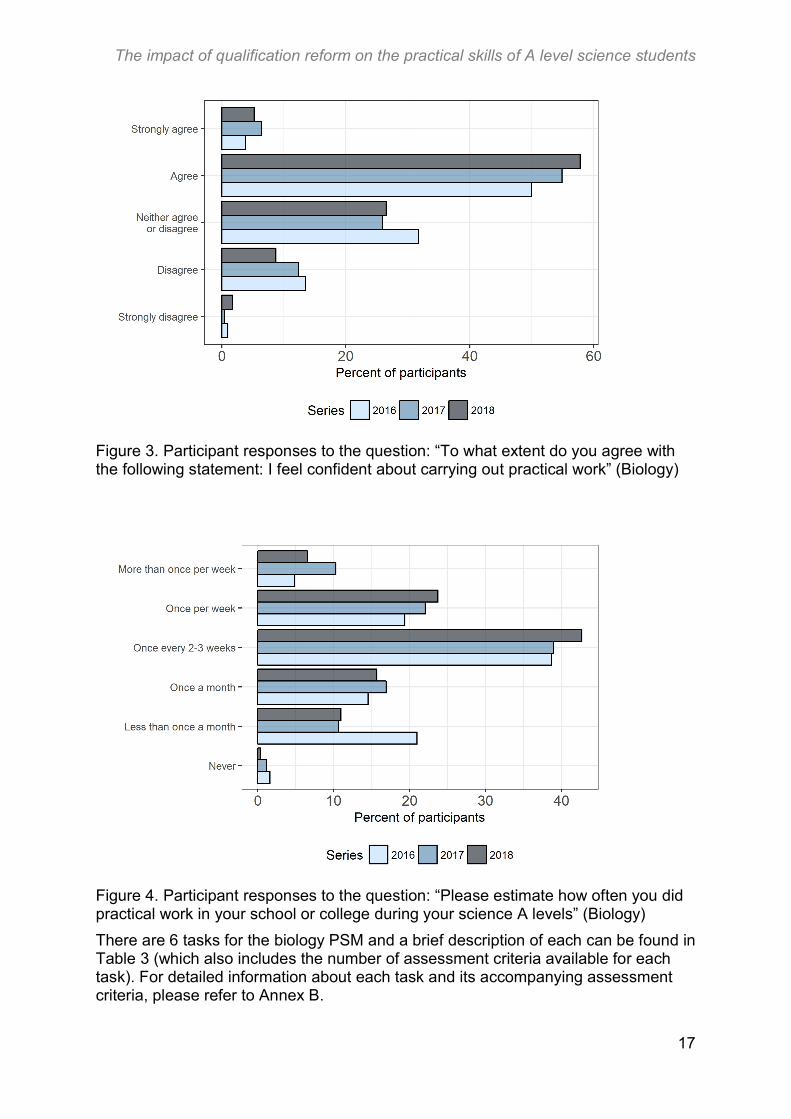
Participants completed questionnaire items about their confidence when undertaking practical work (Figure 3) and how frequently they had undertaken practical work during their A levels (Figure 4). When considering their response on a 5 point scale, there was a slight tendency for the 2018 cohort to report a higher degree of confidence in their ability to undertake practical work (mean = 2.56, sd = 0.79) than the 2016 cohort (mean = 2.42, sd = 0.81), but this difference was not statistically significant, t(196) = 1.45, p = 0.15, Cohen’s d = 0.17. The 2017 cohort reported a similar level of confidence (mean = 2.54, sd = 0.81) to the 2018 cohort, t(463) = 0.22, p = 0.83, Cohen’s d = 0.02. Overall, the majority of participants seemed fairly confident about their ability to conduct practical work, regardless of which cohort they were in.
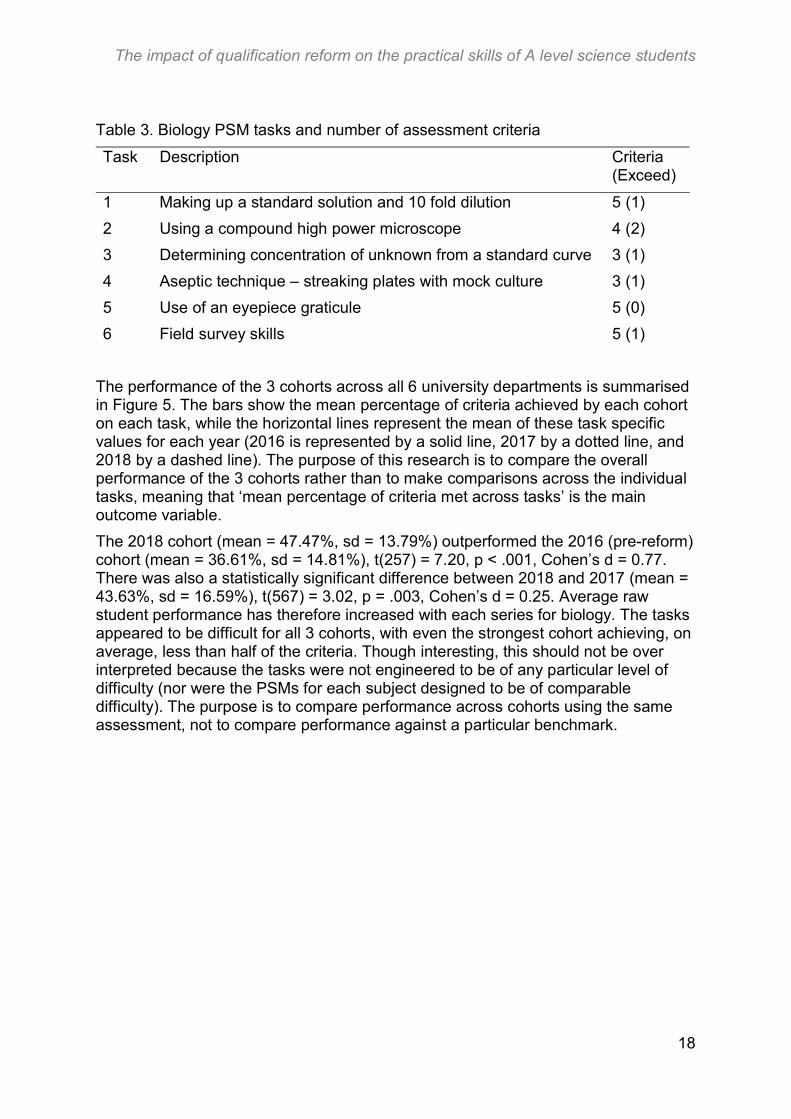
On a 6 point scale, the 2018 cohort reported doing practical work slightly more frequently (mean = 2.98, sd = 1.06) than the 2016 cohort (mean = 2.68, sd = 1.19), and this difference was small but statistically significant, t(215) = 2.44, p = 0.02, Cohen’s d = 0.28. The 2017 cohort reported that they had conducted practical work with similarly frequency to the 2018 cohort (mean = 3.01, sd = 1.15), t(540) = 0.31, p = 0.76, Cohen’s d = 0.03. Note that responses to these 2 questions did not relate strongly to performance on the PSM, so they have not been included as explanatory variables in the statistical modelling.
The impact of qualification reform on the practical skills of A level science students
17
Figure 3. Participant responses to the question: “To what extent do you agree with the following statement: I feel confident about carrying out practical work” (Biology)
Figure 4. Participant responses to the question: “Please estimate how often you did practical work in your school or college during your science A levels” (Biology)
There are 6 tasks for the biology PSM and a brief description of each can be found in Table 3 (which also includes the number of assessment criteria available for each task). For detailed information about each task and its accompanying assessment criteria, please refer to Annex B.
The impact of qualification reform on the practical skills of A level science students
18
Table 3. Biology PSM tasks and number of assessment criteria
Task Description Criteria (Exceed)
1 Making up a standard solution and 10 fold dilution 5 (1)
2 Using a compound high power microscope 4 (2)
3 Determining concentration of unknown from a standard curve 3 (1)
4 Aseptic technique – streaking plates with mock culture 3 (1)
5 Use of an eyepiece graticule 5 (0)
6 Field survey skills 5 (1)
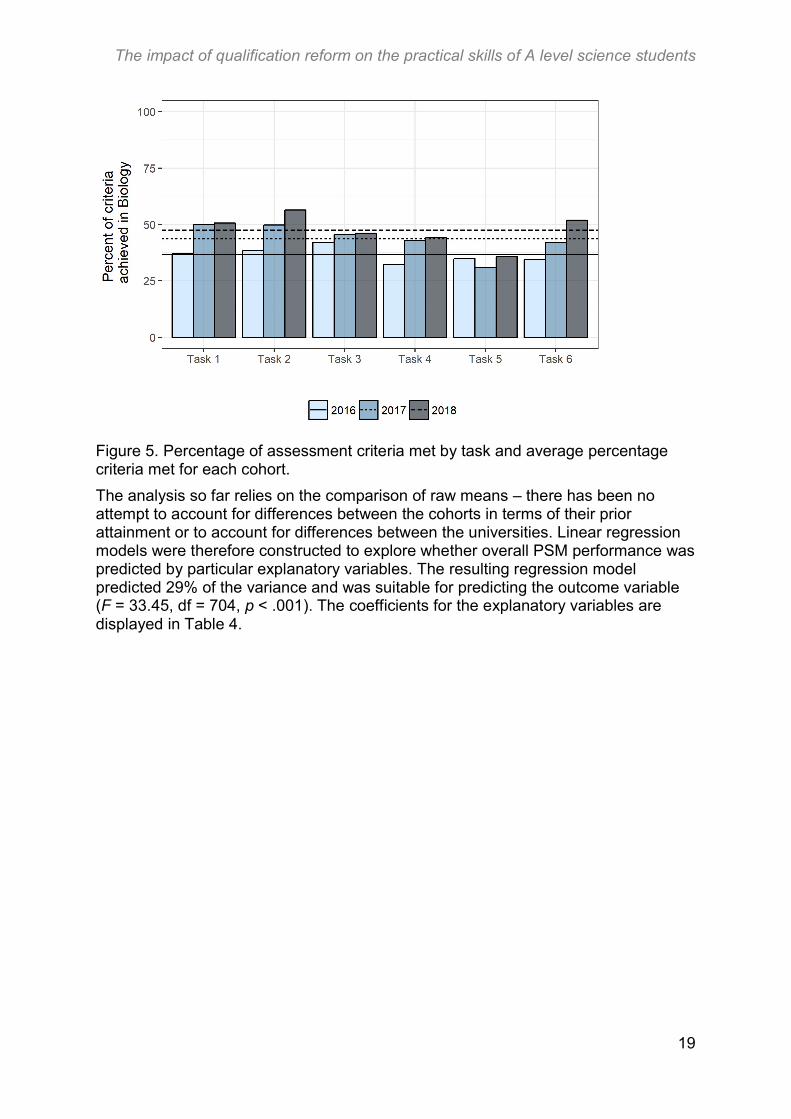
The performance of the 3 cohorts across all 6 university departments is summarised in Figure 5. The bars show the mean percentage of criteria achieved by each cohort on each task, while the horizontal lines represent the mean of these task specific values for each year (2016 is represented by a solid line, 2017 by a dotted line, and 2018 by a dashed line). The purpose of this research is to compare the overall performance of the 3 cohorts rather than to make comparisons across the individual tasks, meaning that ‘mean percentage of criteria met across tasks’ is the main outcome variable.
The 2018 cohort (mean = 47.47%, sd = 13.79%) outperformed the 2016 (pre-reform) cohort (mean = 36.61%, sd = 14.81%), t(257) = 7.20, p < .001, Cohen’s d = 0.77. There was also a statistically significant difference between 2018 and 2017 (mean = 43.63%, sd = 16.59%), t(567) = 3.02, p = .003, Cohen’s d = 0.25. Average raw student performance has therefore increased with each series for biology. The tasks appeared to be difficult for all 3 cohorts, with even the strongest cohort achieving, on average, less than half of the criteria. Though interesting, this should not be over interpreted because the tasks were not engineered to be of any particular level of difficulty (nor were the PSMs for each subject designed to be of comparable difficulty). The purpose is to compare performance across cohorts using the same assessment, not to compare performance against a particular benchmark.
The impact of qualification reform on the practical skills of A level science students
19
Figure 5. Percentage of assessment criteria met by task and average percentage criteria met for each cohort.
The analysis so far relies on the comparison of raw means – there has been no attempt to account for differences between the cohorts in terms of their prior attainment or to account for differences between the universities. Linear regression models were therefore constructed to explore whether overall PSM performance was predicted by particular explanatory variables. The resulting regression model predicted 29% of the variance and was suitable for predicting the outcome variable (F = 33.45, df = 704, p < .001). The coefficients for the explanatory variables are displayed in Table 4.
The impact of qualification reform on the practical skills of A level science students
20
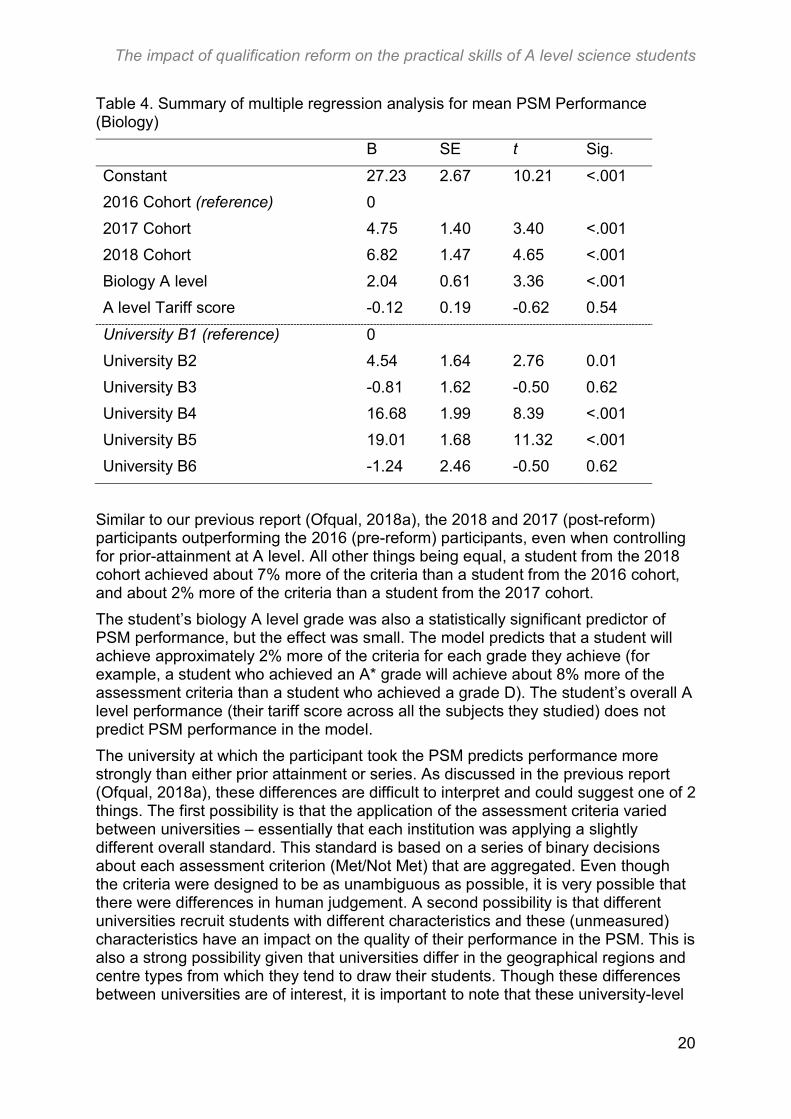
Table 4. Summary of multiple regression analysis for mean PSM Performance (Biology)
B SE t Sig.
Constant 27.23 2.67 10.21 <.001
2016 Cohort (reference) 0
2017 Cohort 4.75 1.40 3.40 <.001
2018 Cohort 6.82 1.47 4.65 <.001
Biology A level 2.04 0.61 3.36 <.001
A level Tariff score -0.12 0.19 -0.62 0.54
University B1 (reference) 0
University B2 4.54 1.64 2.76 0.01
University B3 -0.81 1.62 -0.50 0.62
University B4 16.68 1.99 8.39 <.001
University B5 19.01 1.68 11.32 <.001
University B6 -1.24 2.46 -0.50 0.62
Similar to our previous report (Ofqual, 2018a), the 2018 and 2017 (post-reform) participants outperforming the 2016 (pre-reform) participants, even when controlling for prior-attainment at A level. All other things being equal, a student from the 2018 cohort achieved about 7% more of the criteria than a student from the 2016 cohort, and about 2% more of the criteria than a student from the 2017 cohort.
The student’s biology A level grade was also a statistically significant predictor of PSM performance, but the effect was small. The model predicts that a student will achieve approximately 2% more of the criteria for each grade they achieve (for example, a student who achieved an A* grade will achieve about 8% more of the assessment criteria than a student who achieved a grade D). The student’s overall A level performance (their tariff score across all the subjects they studied) does not predict PSM performance in the model.
The university at which the participant took the PSM predicts performance more strongly than either prior attainment or series. As discussed in the previous report (Ofqual, 2018a), these differences are difficult to interpret and could suggest one of 2 things. The first possibility is that the application of the assessment criteria varied between universities – essentially that each institution was applying a slightly different overall standard. This standard is based on a series of binary decisions about each assessment criterion (Met/Not Met) that are aggregated. Even though the criteria were designed to be as unambiguous as possible, it is very possible that there were differences in human judgement. A second possibility is that different universities recruit students with different characteristics and these (unmeasured) characteristics have an impact on the quality of their performance in the PSM. This is also a strong possibility given that universities differ in the geographical regions and centre types from which they tend to draw their students. Though these differences between universities are of interest, it is important to note that these university-level
The impact of qualification reform on the practical skills of A level science students
21
differences are controlled for statistically in this model and there remains a statistically significant effect of series.
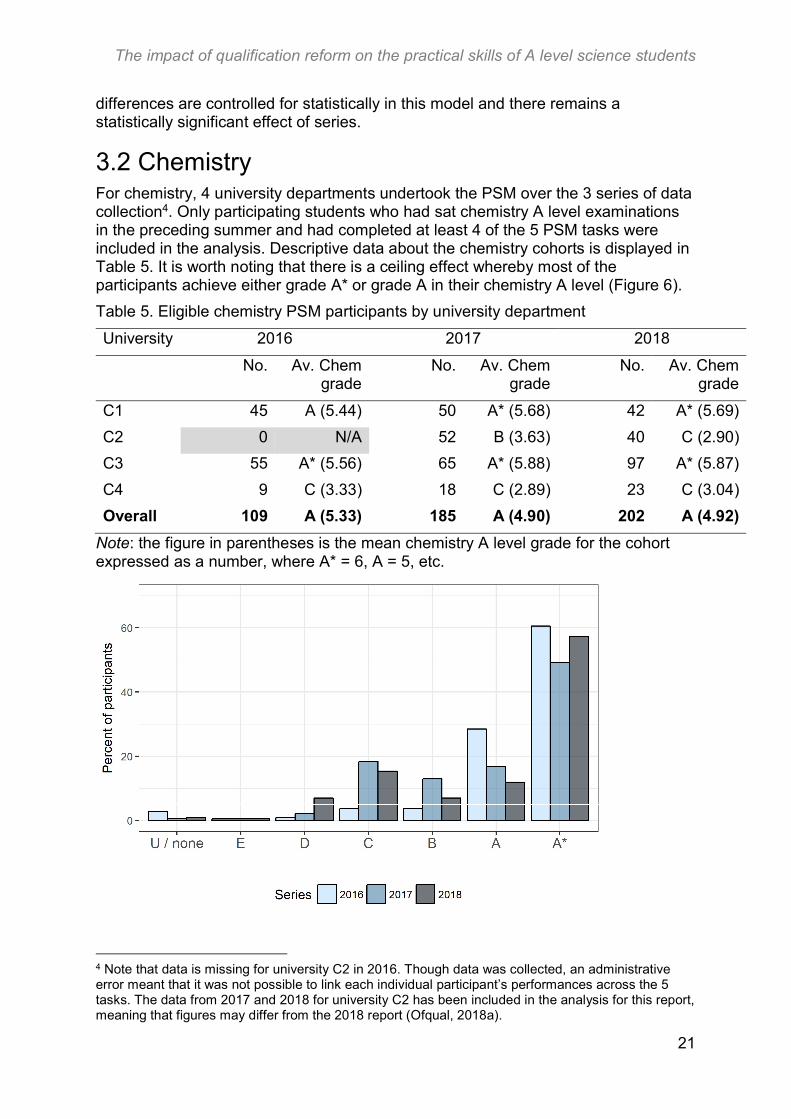
3.2 Chemistry For chemistry, 4 university departments undertook the PSM over the 3 series of data collection4. Only participating students who had sat chemistry A level examinations in the preceding summer and had completed at least 4 of the 5 PSM tasks were included in the analysis. Descriptive data about the chemistry cohorts is displayed in Table 5. It is worth noting that there is a ceiling effect whereby most of the participants achieve either grade A* or grade A in their chemistry A level (Figure 6).
Table 5. Eligible chemistry PSM participants by university department
University 2016 2017 2018
No. Av. Chem grade
No. Av. Chem grade
No. Av. Chem grade
C1 45 A (5.44) 50 A* (5.68) 42 A* (5.69)
C2 0 N/A 52 B (3.63) 40 C (2.90)
C3 55 A* (5.56) 65 A* (5.88) 97 A* (5.87)
C4 9 C (3.33) 18 C (2.89) 23 C (3.04)
Overall 109 A (5.33) 185 A (4.90) 202 A (4.92)
Note: the figure in parentheses is the mean chemistry A level grade for the cohort expressed as a number, where A* = 6, A = 5, etc.
4 Note that data is missing for university C2 in 2016. Though data was collected, an administrative error meant that it was not possible to link each individual participant’s performances across the 5 tasks. The data from 2017 and 2018 for university C2 has been included in the analysis for this report, meaning that figures may differ from the 2018 report (Ofqual, 2018a).
The impact of qualification reform on the practical skills of A level science students
22
Figure 6. Percentage of candidates achieving each A level Chemistry grade by cohort
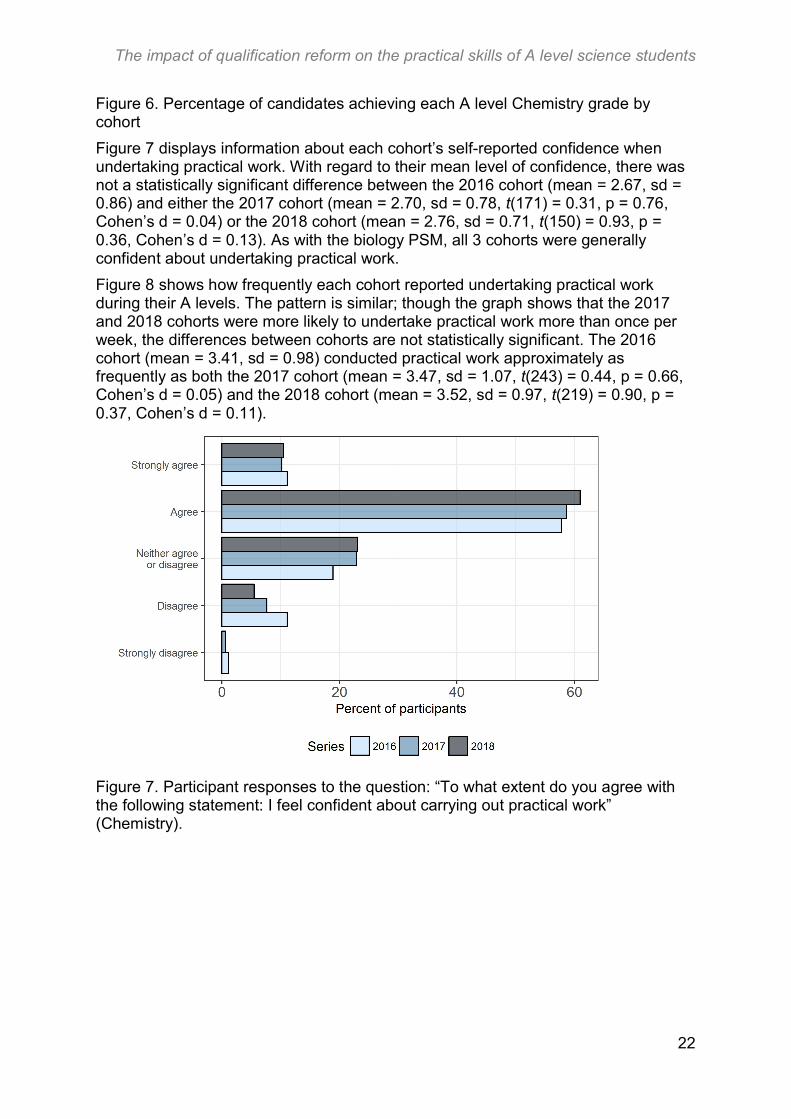
Figure 7 displays information about each cohort’s self-reported confidence when undertaking practical work. With regard to their mean level of confidence, there was not a statistically significant difference between the 2016 cohort (mean = 2.67, sd = 0.86) and either the 2017 cohort (mean = 2.70, sd = 0.78, t(171) = 0.31, p = 0.76, Cohen’s d = 0.04) or the 2018 cohort (mean = 2.76, sd = 0.71, t(150) = 0.93, p = 0.36, Cohen’s d = 0.13). As with the biology PSM, all 3 cohorts were generally confident about undertaking practical work.
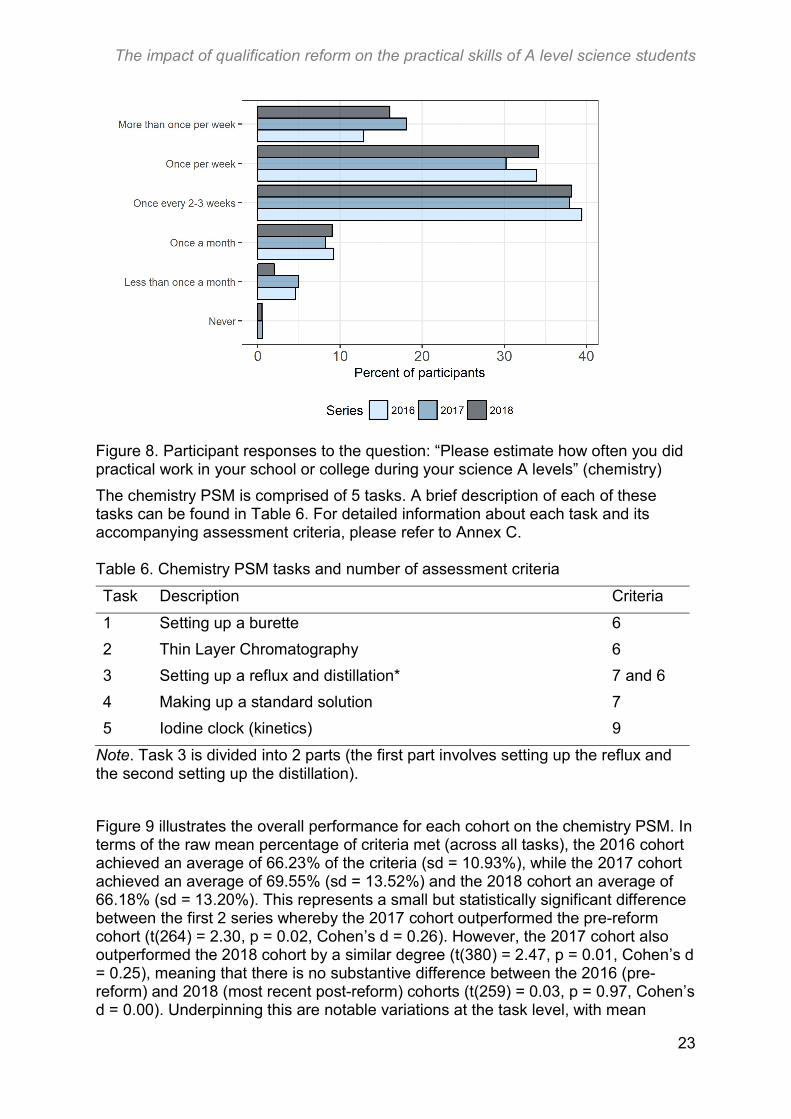
Figure 8 shows how frequently each cohort reported undertaking practical work during their A levels. The pattern is similar; though the graph shows that the 2017 and 2018 cohorts were more likely to undertake practical work more than once per week, the differences between cohorts are not statistically significant. The 2016 cohort (mean = 3.41, sd = 0.98) conducted practical work approximately as frequently as both the 2017 cohort (mean = 3.47, sd = 1.07, t(243) = 0.44, p = 0.66, Cohen’s d = 0.05) and the 2018 cohort (mean = 3.52, sd = 0.97, t(219) = 0.90, p = 0.37, Cohen’s d = 0.11).
Figure 7. Participant responses to the question: “To what extent do you agree with the following statement: I feel confident about carrying out practical work” (Chemistry).
The impact of qualification reform on the practical skills of A level science students
23
Figure 8. Participant responses to the question: “Please estimate how often you did practical work in your school or college during your science A levels” (chemistry)
The chemistry PSM is comprised of 5 tasks. A brief description of each of these tasks can be found in Table 6. For detailed information about each task and its accompanying assessment criteria, please refer to Annex C. Table 6. Chemistry PSM tasks and number of assessment criteria
Task Description Criteria
1 Setting up a burette 6
2 Thin Layer Chromatography 6
3 Setting up a reflux and distillation* 7 and 6
4 Making up a standard solution 7
5 Iodine clock (kinetics) 9
Note. Task 3 is divided into 2 parts (the first part involves setting up the reflux and the second setting up the distillation).
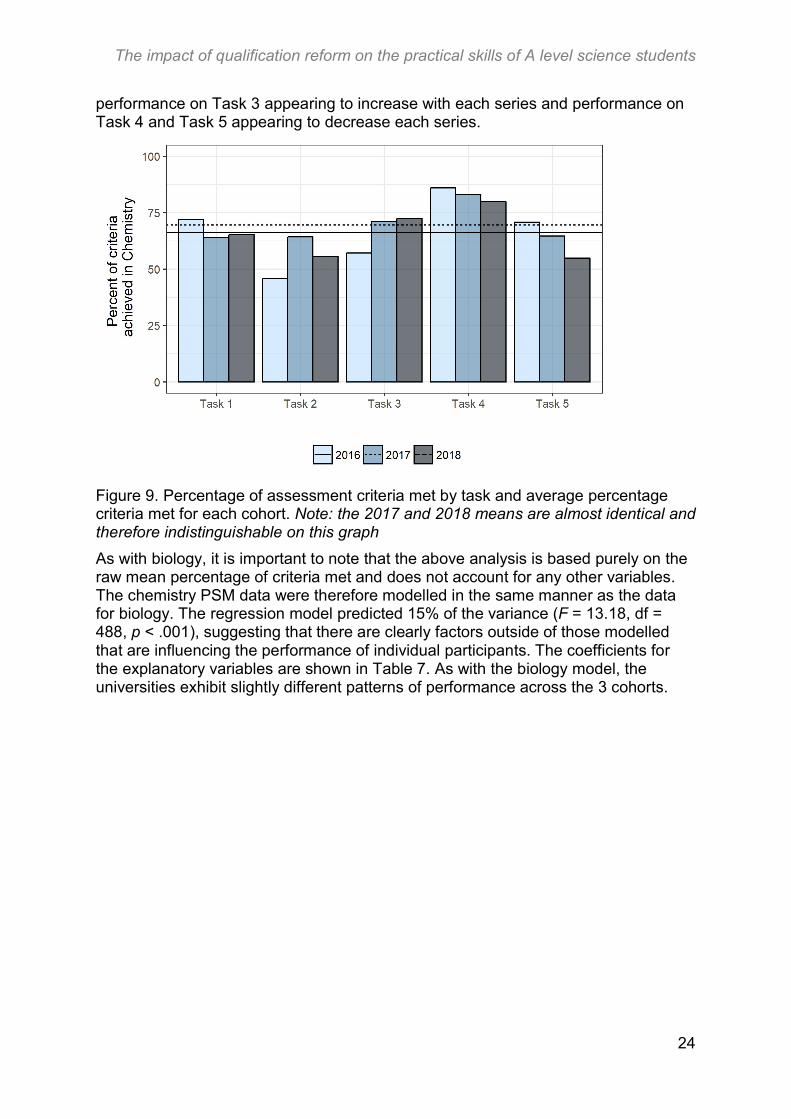
Figure 9 illustrates the overall performance for each cohort on the chemistry PSM. In terms of the raw mean percentage of criteria met (across all tasks), the 2016 cohort achieved an average of 66.23% of the criteria (sd = 10.93%), while the 2017 cohort achieved an average of 69.55% (sd = 13.52%) and the 2018 cohort an average of 66.18% (sd = 13.20%). This represents a small but statistically significant difference between the first 2 series whereby the 2017 cohort outperformed the pre-reform cohort (t(264) = 2.30, p = 0.02, Cohen’s d = 0.26). However, the 2017 cohort also outperformed the 2018 cohort by a similar degree (t(380) = 2.47, p = 0.01, Cohen’s d = 0.25), meaning that there is no substantive difference between the 2016 (pre-reform) and 2018 (most recent post-reform) cohorts (t(259) = 0.03, p = 0.97, Cohen’s d = 0.00). Underpinning this are notable variations at the task level, with mean
The impact of qualification reform on the practical skills of A level science students
24
performance on Task 3 appearing to increase with each series and performance on Task 4 and Task 5 appearing to decrease each series.
Figure 9. Percentage of assessment criteria met by task and average percentage criteria met for each cohort. Note: the 2017 and 2018 means are almost identical and therefore indistinguishable on this graph
As with biology, it is important to note that the above analysis is based purely on the raw mean percentage of criteria met and does not account for any other variables. The chemistry PSM data were therefore modelled in the same manner as the data for biology. The regression model predicted 15% of the variance (F = 13.18, df = 488, p < .001), suggesting that there are clearly factors outside of those modelled that are influencing the performance of individual participants. The coefficients for the explanatory variables are shown in Table 7. As with the biology model, the universities exhibit slightly different patterns of performance across the 3 cohorts.
The impact of qualification reform on the practical skills of A level science students
25
Table 7. Summary of multiple regression analysis for mean PSM Performance (chemistry)
B SE T Sig.
Constant 53.64 4.18 12.83 <.001
2016 Cohort (reference) 0
2017 Cohort 2.96 1.53 1.94 .05
2018 Cohort -0.82 1.47 -0.56 .58
Chemistry A level 1.25 0.81 1.55 .12
A level Tariff score 0.10 0.15 0.66 .51
University C1 (reference) 0
University C2 8.11 2.46 3.30 .001
University C3 8.29 1.33 6.25 <.001
University C4 -0.91 2.83 -0.32 .75
Once the effects of university and prior attainment are accounted for, there is not a statistically significant difference between the performances of the 3 cohorts who took the chemistry PSM. Neither the participant’s A level grade in chemistry, nor their overall performance across their A levels (their tariff score) predicts their performance on the PSM. The only variable that appears to predict performance on the PSM is the university at which the PSM took place. Students from universities C2 and C3 are predicted to meet an average of about 8% more of the criteria than those from University C1 (the reference group). The model controls for these variations between universities yet there is still no difference between the performances of the 3 cohorts.
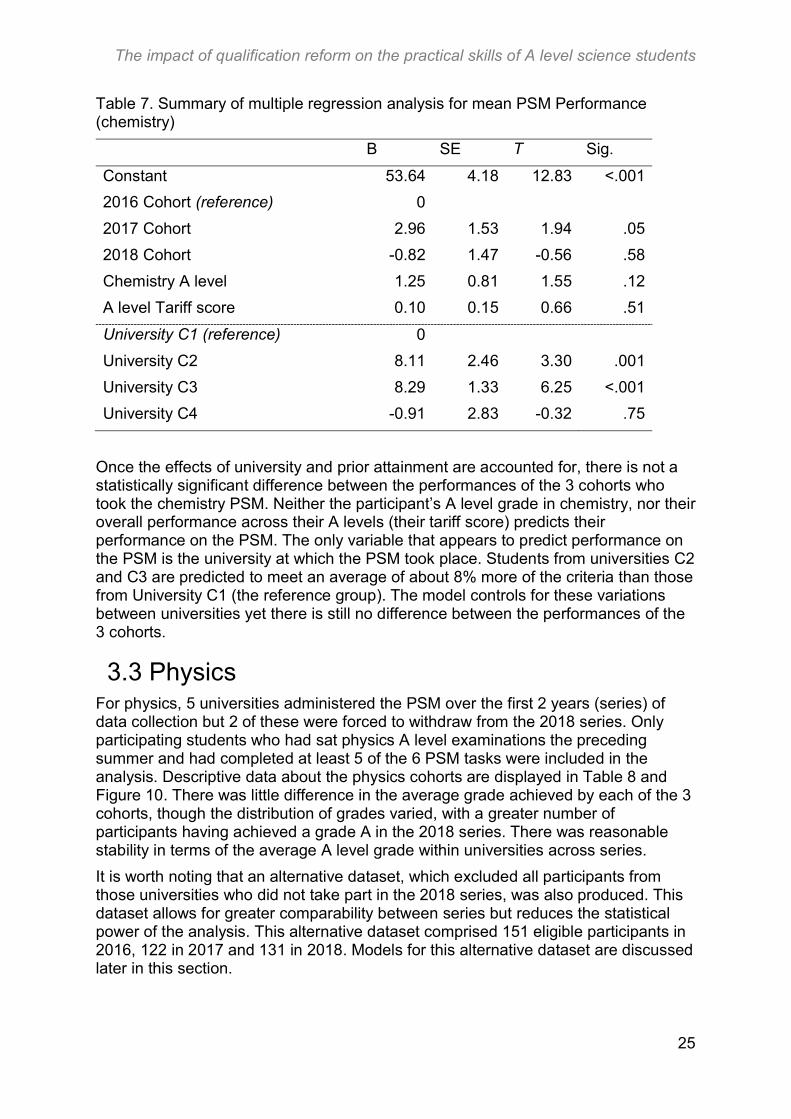
3.3 Physics For physics, 5 universities administered the PSM over the first 2 years (series) of data collection but 2 of these were forced to withdraw from the 2018 series. Only participating students who had sat physics A level examinations the preceding summer and had completed at least 5 of the 6 PSM tasks were included in the analysis. Descriptive data about the physics cohorts are displayed in Table 8 and Figure 10. There was little difference in the average grade achieved by each of the 3 cohorts, though the distribution of grades varied, with a greater number of participants having achieved a grade A in the 2018 series. There was reasonable stability in terms of the average A level grade within universities across series.
It is worth noting that an alternative dataset, which excluded all participants from those universities who did not take part in the 2018 series, was also produced. This dataset allows for greater comparability between series but reduces the statistical power of the analysis. This alternative dataset comprised 151 eligible participants in 2016, 122 in 2017 and 131 in 2018. Models for this alternative dataset are discussed later in this section.
The impact of qualification reform on the practical skills of A level science students
26
Table 8. Eligible physics PSM participants by university department
University 2016 2017 2018
No. Av. Phys grade
No. Av. Phys grade
No. Av. Phys grade
P1 6 D (1.83) 9 D (1.78) 7 D (1.86)
P2 36 C (3.00) 13 C (3.00) 24 C (3.00)
P3 8 C (2.63) 5 C (3.40) 0 N/A
P4 134 B (4.48) 98 A (4.62) 0 N/A
P5 109 A (5.16) 100 A (5.10) 100 A (5.10)
Overall 293 B (4.44) 225 A (4.60) 131 A (4.54)
Note: the figure in parentheses is the mean physics A level grade for the cohort expressed as a number, where A* = 6, A = 5, etc.
Figure 10. Percentage of candidates achieving each A level physics grade by cohort
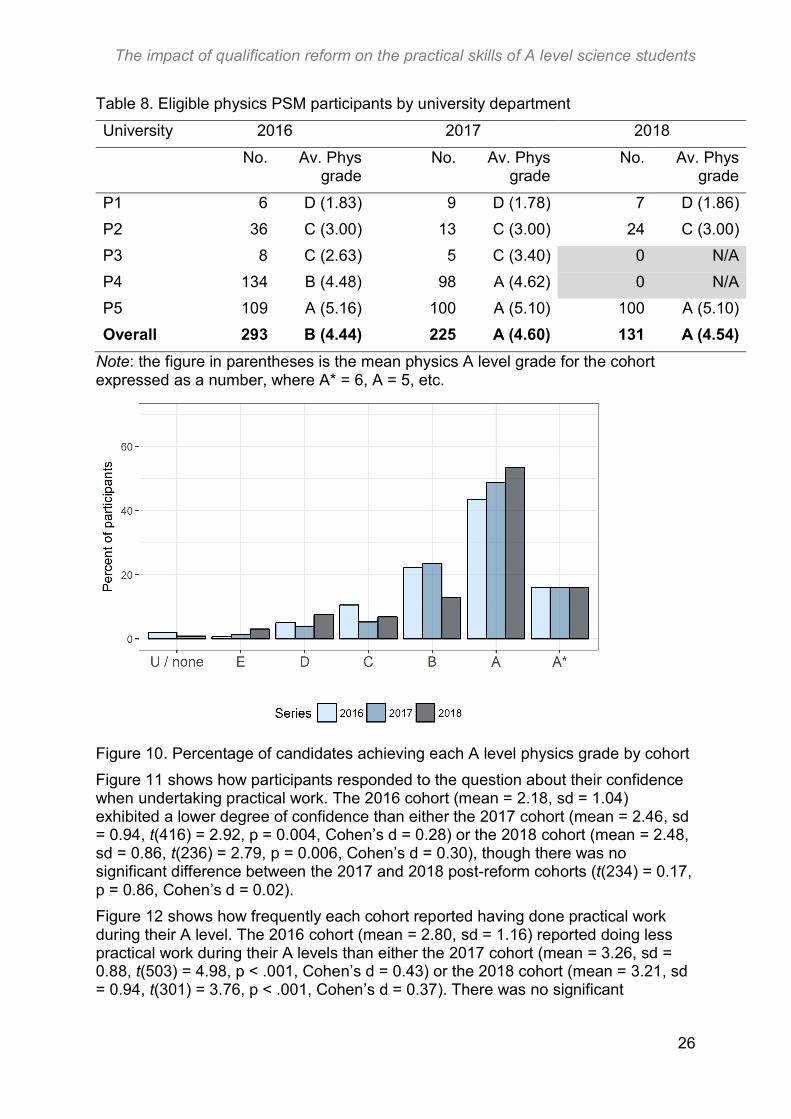
Figure 11 shows how participants responded to the question about their confidence when undertaking practical work. The 2016 cohort (mean = 2.18, sd = 1.04) exhibited a lower degree of confidence than either the 2017 cohort (mean = 2.46, sd = 0.94, t(416) = 2.92, p = 0.004, Cohen’s d = 0.28) or the 2018 cohort (mean = 2.48, sd = 0.86, t(236) = 2.79, p = 0.006, Cohen’s d = 0.30), though there was no significant difference between the 2017 and 2018 post-reform cohorts (t(234) = 0.17, p = 0.86, Cohen’s d = 0.02).
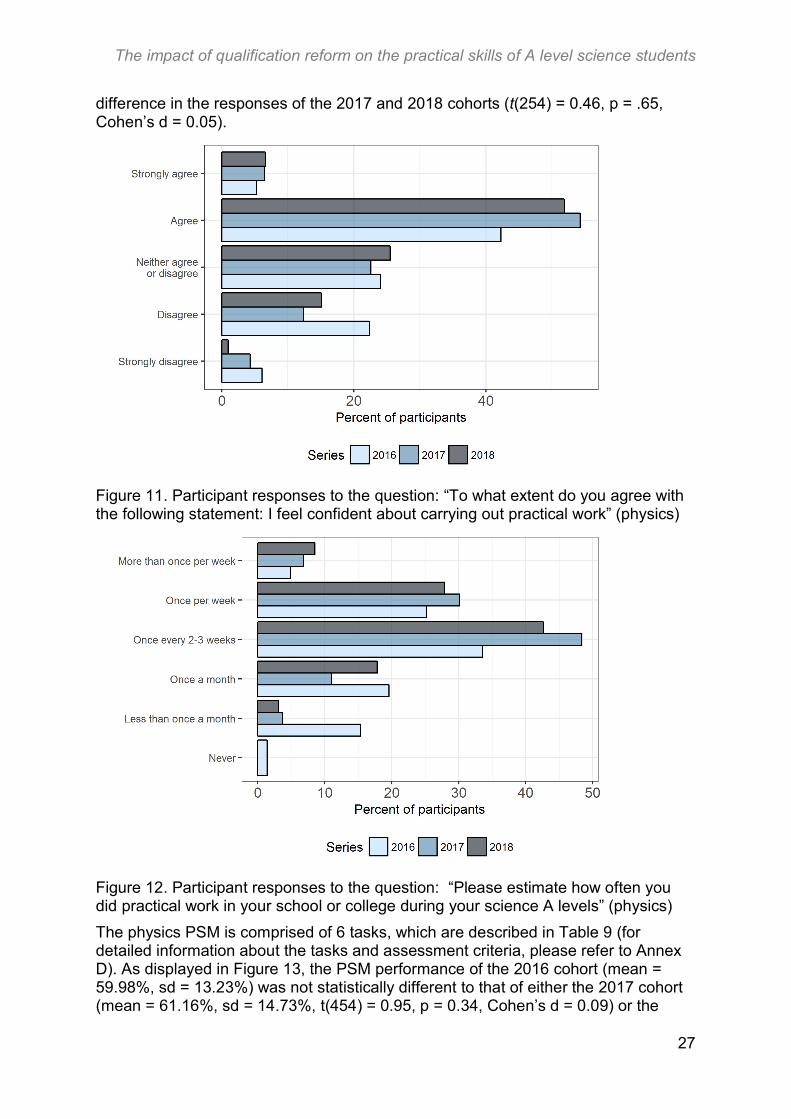
Figure 12 shows how frequently each cohort reported having done practical work during their A level. The 2016 cohort (mean = 2.80, sd = 1.16) reported doing less practical work during their A levels than either the 2017 cohort (mean = 3.26, sd = 0.88, t(503) = 4.98, p < .001, Cohen’s d = 0.43) or the 2018 cohort (mean = 3.21, sd = 0.94, t(301) = 3.76, p < .001, Cohen’s d = 0.37). There was no significant
The impact of qualification reform on the practical skills of A level science students
27
difference in the responses of the 2017 and 2018 cohorts (t(254) = 0.46, p = .65, Cohen’s d = 0.05).
Figure 11. Participant responses to the question: “To what extent do you agree with the following statement: I feel confident about carrying out practical work” (physics)
Figure 12. Participant responses to the question: “Please estimate how often you did practical work in your school or college during your science A levels” (physics)
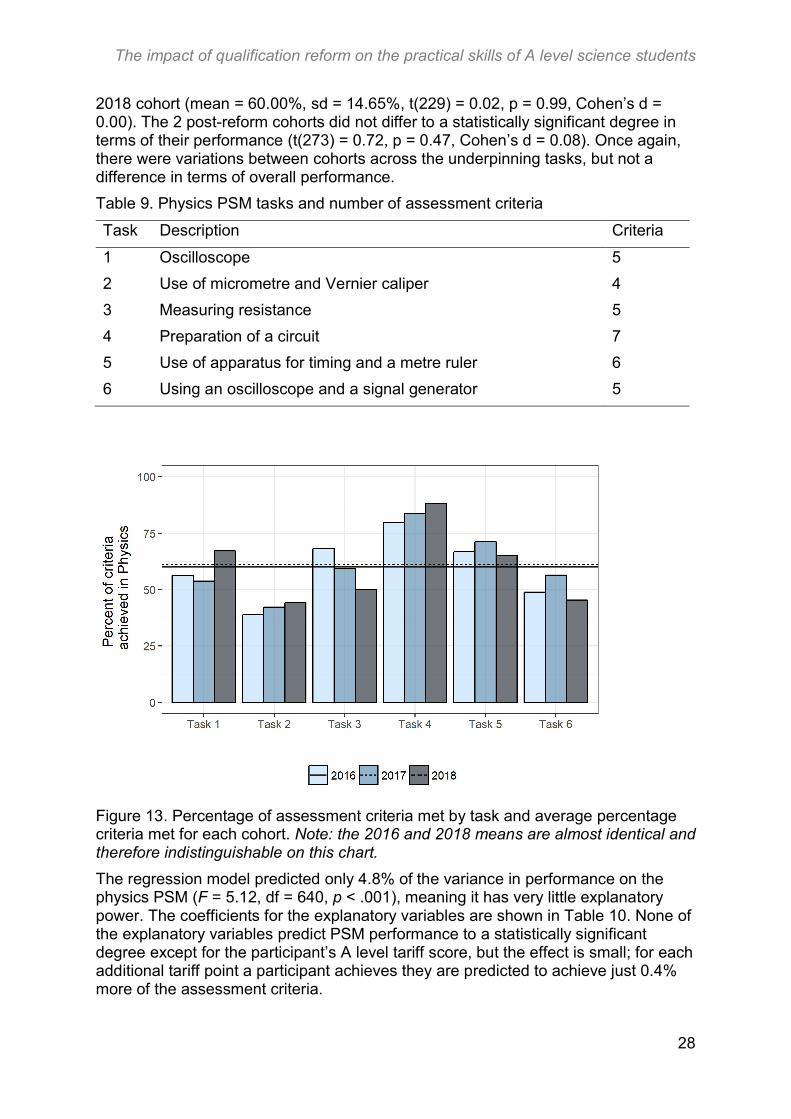
The physics PSM is comprised of 6 tasks, which are described in Table 9 (for detailed information about the tasks and assessment criteria, please refer to Annex D). As displayed in Figure 13, the PSM performance of the 2016 cohort (mean = 59.98%, sd = 13.23%) was not statistically different to that of either the 2017 cohort (mean = 61.16%, sd = 14.73%, t(454) = 0.95, p = 0.34, Cohen’s d = 0.09) or the
The impact of qualification reform on the practical skills of A level science students
28
2018 cohort (mean = 60.00%, sd = 14.65%, t(229) = 0.02, p = 0.99, Cohen’s d = 0.00). The 2 post-reform cohorts did not differ to a statistically significant degree in terms of their performance (t(273) = 0.72, p = 0.47, Cohen’s d = 0.08). Once again, there were variations between cohorts across the underpinning tasks, but not a difference in terms of overall performance.
Table 9. Physics PSM tasks and number of assessment criteria
Task Description Criteria
1 Oscilloscope 5
2 Use of micrometre and Vernier caliper 4
3 Measuring resistance 5
4 Preparation of a circuit 7
5 Use of apparatus for timing and a metre ruler 6
6 Using an oscilloscope and a signal generator 5
Figure 13. Percentage of assessment criteria met by task and average percentage criteria met for each cohort. Note: the 2016 and 2018 means are almost identical and therefore indistinguishable on this chart.
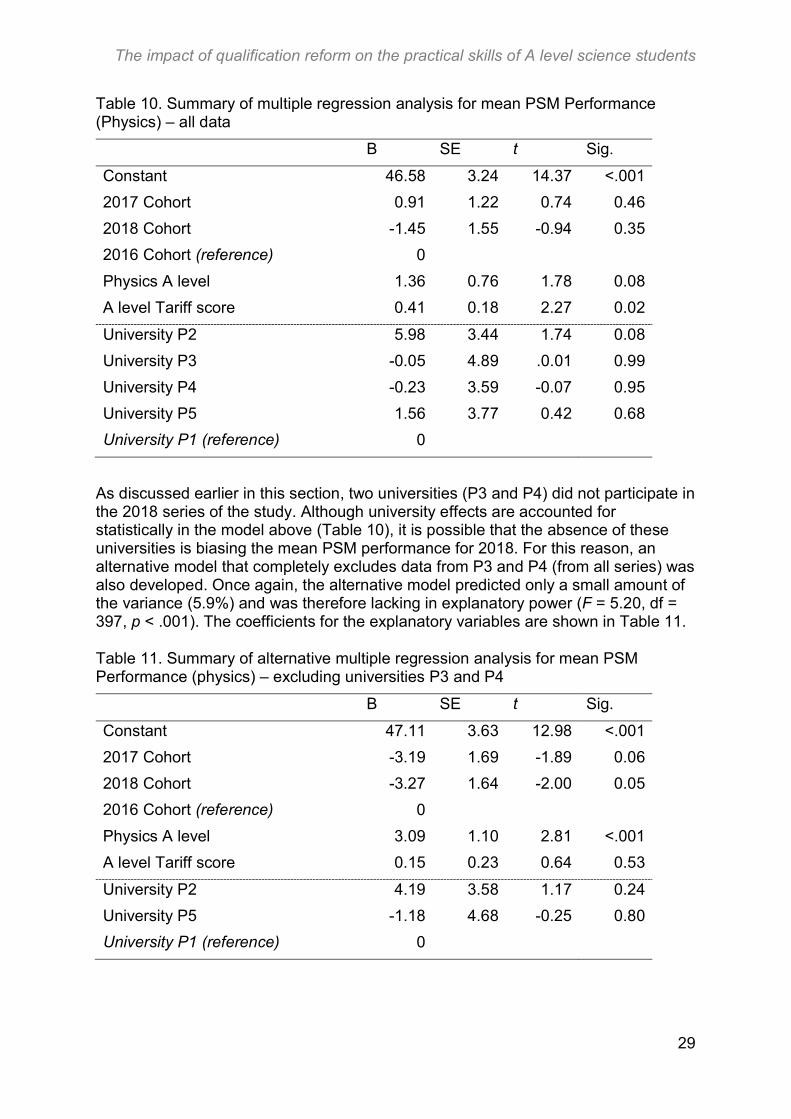
The regression model predicted only 4.8% of the variance in performance on the physics PSM (F = 5.12, df = 640, p < .001), meaning it has very little explanatory power. The coefficients for the explanatory variables are shown in Table 10. None of the explanatory variables predict PSM performance to a statistically significant degree except for the participant’s A level tariff score, but the effect is small; for each additional tariff point a participant achieves they are predicted to achieve just 0.4% more of the assessment criteria.
The impact of qualification reform on the practical skills of A level science students
29
Table 10. Summary of multiple regression analysis for mean PSM Performance (Physics) – all data
B SE t Sig.
Constant 46.58 3.24 14.37 <.001
2017 Cohort 0.91 1.22 0.74 0.46
2018 Cohort -1.45 1.55 -0.94 0.35
2016 Cohort (reference) 0
Physics A level 1.36 0.76 1.78 0.08
A level Tariff score 0.41 0.18 2.27 0.02
University P2 5.98 3.44 1.74 0.08
University P3 -0.05 4.89 .0.01 0.99
University P4 -0.23 3.59 -0.07 0.95
University P5 1.56 3.77 0.42 0.68
University P1 (reference) 0
As discussed earlier in this section, two universities (P3 and P4) did not participate in the 2018 series of the study. Although university effects are accounted for statistically in the model above (Table 10), it is possible that the absence of these universities is biasing the mean PSM performance for 2018. For this reason, an alternative model that completely excludes data from P3 and P4 (from all series) was also developed. Once again, the alternative model predicted only a small amount of the variance (5.9%) and was therefore lacking in explanatory power (F = 5.20, df = 397, p < .001). The coefficients for the explanatory variables are shown in Table 11. Table 11. Summary of alternative multiple regression analysis for mean PSM Performance (physics) – excluding universities P3 and P4
B SE t Sig.
Constant 47.11 3.63 12.98 <.001
2017 Cohort -3.19 1.69 -1.89 0.06
2018 Cohort -3.27 1.64 -2.00 0.05
2016 Cohort (reference) 0
Physics A level 3.09 1.10 2.81 <.001
A level Tariff score 0.15 0.23 0.64 0.53
University P2 4.19 3.58 1.17 0.24
University P5 -1.18 4.68 -0.25 0.80
University P1 (reference) 0
The impact of qualification reform on the practical skills of A level science students
30
In this alternative model, once prior attainment and the effect of the university is accounted for, both the 2017 and 2018 cohorts appear to have performed slightly worse on the PSM than the 2016 cohort (achieving about 3% less of the criteria). However, only the difference between the 2018 and 2016 cohorts is statistically significant (p<.05), and this is borderline. Overall, given the low explanatory power of both the original and alternative models (eg performance on the physics PSM cannot be accurately predicted using the variables in these models), the evidence for physics is inconclusive. There is no evidence for any substantive differences in the practical skills of the 3 cohorts, but such a conclusion must be drawn tentatively.
The impact of qualification reform on the practical skills of A level science students
31
4 Discussion The headline finding from this study is that the hands-on practical skills of students who took post-reform science A level qualifications seem to be very similar to the skills of those who took pre-reform science A levels. In the case of biology, there is evidence to suggest that the practical skills of students have been improving since the reform; the pre-reform cohort (2016) were outperformed by the first post-reform cohort (2017), who were in turn outperformed by the most recent post-reform cohort (2018). For chemistry and physics, there does not appear to be a difference between any of the cohorts, providing some reassurance that the reformed qualifications (and, more specifically, the new assessment arrangements for practical work) are not undermining the teaching and learning of these important skills.
Although these findings are encouraging, it is important to note that the reformed science A levels have only been taught in schools and colleges since September 2015. The manner in which teachers, students and examination boards navigate the reformed qualifications may change over time, and the extent and impact of such change is likely to vary across education centres. Indeed, Ofqual’s qualitative research (Ofqual, 2017a) suggests that, through numerous mechanisms, the impact of the reform is likely to vary depending on the precise context of the school or college. Factors such as centre type, the experience of teachers in the department, and the availability of facilities and funding are all likely to play a role in exactly how the new assessment arrangements are implemented and therefore on the impact that they have on teaching and learning.
With this in mind, it is helpful to return to the intention behind the new assessment arrangements and view them in the context of qualification regulation. The new approach is intended to promote practical work in post-16 science, to allow teachers to cover a greater breadth of skills, and to provide flexibility with regard to how practical work may be integrated with teaching and learning (Cambridge Assessment, 2016; Stacey, 2015). To achieve this, the assessment arrangements seek to mandate a standard for the provision of practical work, ensuring that all schools and colleges offer their students a broad experience that covers core knowledge and skills. However, the standard specified by the endorsement has to be, by its very nature, a minimum standard. It is therefore possible that teachers and students will aim to achieve, rather than exceed, this baseline standard.
A more optimistic perspective is that the flexibility inherent in the new assessment arrangements may be further embraced by all of those involved, leading to improvements in provision and innovative utilisation of practical work to enhance teaching and learning. Based on the results of this study, this may be occurring in biology. This is backed up by qualitative evidence, which suggests that teachers recognise the possibilities of the new arrangements and, at least in some cases, are attempting to embrace it (Ofqual, 2017a). One potentially fruitful way forward is to consider how the flexibility of the new assessment arrangements may be leveraged for a consistently positive impact on the teaching and learning of practical work. This requires thinking which extends well beyond the assessment of practical skills and the regulation of the assessment arrangements in isolation. Such thinking needs to include broader discussions about how best to deliver high quality practical science in schools and colleges.
The impact of qualification reform on the practical skills of A level science students
32
Thankfully, this type of work is going on. The Gatsby Foundation (2017) have recently conducted research into what constitutes good practical science in schools and identified 10 benchmarks to which the education system should aspire. An example of one of these benchmarks is provision for scientific investigations (or independent research projects). It is feasible to integrate such investigative projects with the new assessment arrangements, but they are not mandated because they require time and resource that is not necessarily available in all schools and colleges. Such investigations can take a wide variety of formats and can be developed to emphasise a number of learning or assessment outcomes (Dunlop, Knox, Reiss, & Torrance Jenkins, 2018). It may be that as teachers become more familiar with the endorsement, they seek creative ways to assess the CPAC within the bounds of bespoke independent research projects that engage individual students and dovetail with the other requirements of the course. To assist with this, examination boards could develop materials to support teachers in this endeavour. Programmes such as CREST, which there is some evidence to suggest has the potential to raise academic engagement and performance (British Science Association, 2016), could also be integrated within the framework of the reformed assessment arrangements. The general point is that the new assessment arrangements are sufficiently flexible to allow scope for significant refinement.
Returning to this study, we can only speculate as to why the findings for biology differ from those for chemistry and physics (without first conducting further research). It may be that the reform of the biology A level had a slightly different emphasis to the reform of either the chemistry or physics A levels, resulting in a more tangible shift towards practical work. Another possibility is that the pre-reform biology A level offered a relatively narrow range of tasks that were realistically viable for the controlled assessment element of the old assessment. This may have led to the focus of teaching and learning to be on a smaller number of practical activities, leading to a greater emphasis on tasks that were likely to be in the controlled assessment at the expense of a broader diet of practical work5. This unhelpful pre-reform focus on practical activities for controlled assessment was probably also a problem in chemistry and physics, but perhaps it was more prominent in biology.
The difference between subjects may also be a result of the sample. The average A level grade of participants who took the chemistry and physics PSMs was grade A and there was a clear ceiling effect. The A level grades that were achieved by biology PSM participants were more varied and the average was a grade B or C. It may be that the reform is having less of an impact for high ability students than it is for students who do not achieve the highest grades. This might reflect the earlier point about the endorsement mandating a minimum standard for the provision of practical work. Schools and colleges that were already conducting frequent and high quality practical work probably did not need to change their approach as much as those which were providing minimal practical work and focussing their efforts on the controlled assessment.
Alternatively, it may be that the students which biology, chemistry and physics qualifications attract have different characteristics. For example, it may be that those students who choose to study chemistry and physics have characteristics which make them more adept at practical work, or more enthusiastic to engage in it,
5 For example, anecdotal evidence suggests that micro-biological tasks were rarely used for pre-reform controlled assessments because they were considered difficult to manage and unreliable.
The impact of qualification reform on the practical skills of A level science students
33
making these subjects less affected by the change to assessment arrangements. The reform may also have influenced students’ choice of subject, perhaps deterring students who have less interest in practical work. Though this is rather speculative and seems somewhat unlikely, it illustrates how many factors are involved when trying to understand the impact of a change in policy.
Despite the encouraging preliminary evidence about the impact of the new assessment arrangements and a generally positive reception from teachers, it is important to remain open-minded about the future of assessing practical skills. The Wellcome Trust and the Gatsby Foundation, in a foreword for the Durham University research which they funded, state that:
…while we welcome reform to the assessment of practical skills which has a positive impact on classroom practice, we remain convinced that students’ ability to do hands-on practical science should be reflected in their final grades and that assessments must enable this (Cramman et al., 2019, p. 5).
This is an understandable position that reflects the challenges and complexities associated with delivering national high stakes assessments that are sufficiently valid and have a positive impact on teaching and learning. Ofqual remains open-minded about the possibility of incorporating the direct assessment of hands-on practical skills into the primary grade for A level science qualifications (and indeed for GCSE qualifications, though this is beyond the scope of the current report). However, there remain a great many pitfalls to such an approach, many of which are evident from analysis of the pre-reform assessment arrangements (Ofqual, 2013). Ofqual would need to be assured that any such assessment model was sufficiently valid, reliable, and robust. Such a model would also need to be manageable and affordable for delivery by schools, colleges and awarding organisations.
4.1 Limitations of the research The limitations of this study are discussed in detail in Paper 2 (Ofqual, 2018a), but, to summarise, there are 3 main points to consider: the representativeness of the sample, the challenges in delivering the PSM, and the causal attribution of the research findings.
First, although the sample is sufficiently large to detect differences between the performances of the pre- and post-reform cohorts (from a statistical perspective), it is limited in the extent to which it represents the entire population of interest, which is all students who take an A level qualification in biology, chemistry or physics. This is somewhat mitigated by the fact that the A level qualification is primarily for the purpose of assessing “achievement of the knowledge, skills and understanding which will be needed by students planning to progress to undergraduate study at a UK higher education establishment” (Ofqual, 2017b), and is therefore aimed explicitly at students who do wish to go to university.
Even so, universities differ substantially with regard to the characteristics of their student intake, not just in terms of prior attainment, but also in terms of their geographical catchment and other factors which may influence the characteristics of the students they attract. It is unlikely that a sample of 15 universities (4 to 6 for each subject) will capture the full diversity of those students that take science A levels, even if every effort has been made to work with universities that have differing entry requirements and are based in differing regions of the UK.
The impact of qualification reform on the practical skills of A level science students
34
In addition, the methodology samples only from those students who chose to pursue science at degree level – many students study A level science but do not go on to study it at university. Likewise, because participation in the study is entirely optional, those students who did not wish to be assessed (perhaps because they did not feel confident about conducting practical work) are not sampled. Taken together, this means that the conclusions drawn from this study should be limited to apply only to those students who choose to study science at degree level and should be interpreted with a degree of caution given the limited coverage of universities. This is particularly true with regard to the physics PSM, where 2 of the universities who had participated in 2016 and 2017 were unable to take part for the third and final series of data collection in 2018.
The second main point is that there are limitations to the PSM, the assessment used to measure students’ practical skills. The direct assessment of practical skills in the laboratory is, by its very nature, a challenging process that is difficult to robustly control (Sund, 2016). The laboratory environment shares few characteristics with the exam hall and it is difficult to prevent students from attempting to copy each other or from being otherwise distracted by the bustle of activity that takes place in a typical undergraduate science laboratory. This limitation illustrates some of the difficulties which would be faced by any high stakes direct assessment of practical skills.
Every effort was made to develop assessment tasks, materials and criteria that could be used consistently within and between universities, but the reality is that there were differences in the approaches taken by each university department. The number of students in a given year group can range between 10 and 150, which means that universities required differing approaches to how they set up the tasks at each station and coordinated their assessors. Similarly, the facilities varied between institutions, with some having larger or more recently modernised laboratories and therefore using different apparatus. For example, each biology department in the study was using a slightly different make and model of microscope. Though statistical modelling can account for differences between universities, it cannot account for variations within universities between series. To be clear, this is unlikely to be a significant issue. University staff took steps to be as consistent as possible in terms of how the tasks were set up and how assessors interpreted the assessment criteria. However, it is a potential limitation that is worth noting – research in the real world is often more ‘messy’ than would be ideal.
Finally, perhaps the most important point to make is that changes to the assessment arrangements for A level science have not occurred in isolation of other changes in science education. For this reason, it would not be reasonable to draw strong conclusions with regard to the impact of the qualification reform because we cannot fully account for other variables which may also affect the performance of each cohort on the PSM. For example, alongside changes to the assessment arrangements were significant changes to course content. As pointed out by Cramman et al. (2019, p. 175), schools and colleges in England are currently in a period of ‘flux’, which makes it very difficult to attribute the findings to any single thing.
The limitations of this study have been discussed in detail, but they should not be overstated. A large number of students from a diverse range of universities were assessed using the PSMs, which were generally considered to be robust assessments of practical skills by those that delivered them. Statistical modelling
The impact of qualification reform on the practical skills of A level science students
35
was used to control for the effects of prior attainment and the university at which the participant took the PSM. We can therefore be reasonably confident in the findings.
4.2 Conclusions This study has sought to evaluate the ‘hands on’ practical skills of students who studied pre- and post-reform science A levels to ascertain the impact of reform. We have outlined some important limitations to the research, but it is reasonable to conclude that since the reform there has been no discernible decline in the practical skills of new chemistry and physics undergraduates, and there is some evidence for an increase in the skills of new biology undergraduates. Given the extent of recent changes to the subject content of science qualifications, we cannot conclude with certainty that the improvement between biology cohorts is a direct result of changes to the assessment arrangements, but the findings are certainly encouraging.
Though this particular research study has now concluded, Ofqual will continue to monitor the delivery of the new assessment arrangements by examination boards. It is important for there to be an ongoing evaluation of whether the new assessment arrangements are having their intended effects on the teaching and learning of practical skills, particularly as the new arrangements continue to ‘bed in’ over the coming years.
For now, it is reassuring to see that the new assessment arrangements for A level science appear to be working broadly as intended. The new arrangements appear to have had a neutral impact on the practical skills of those students who take chemistry and physics and have had a positive impact on the skills of students who take biology.
The impact of qualification reform on the practical skills of A level science students
36
5 References Abrahams, I., & Reiss, M. J. (2015). The assessment of practical skills. School
Science Review, 96(June), 40–44. Abrahams, I., Reiss, M. J., & Sharpe, R. M. (2013). The assessment of practical
work in school science. Studies in Science Education, 49(2), 209–251. British Science Association. (2016). What impact does the Silver CREST Award
have on science scores and STEM subject selection? Retrieved from https://www.britishscienceassociation.org/Handlers/Download.ashx?IDMF=9aaf06e4-f24a-435c-9991-cbf6edd1293c
Cambridge Assessment. (2016). The Cambridge view on science. Retrieved July 19, 2016, from http://www.cambridgeassessment.org.uk/insights/the-cambridge-view-on-science/
Carter, I. (2014). Is this the end of the English tradition of practical A-level science? School Science Review, 96(September), 12–14.
Cramman, H., Kind, V., Lyth, A., Gray, H., Younger, K., Gemar, A., … Kind, P. (2019). Monitoring practical science in schools and colleges. Retrieved from http://dro.dur.ac.uk/27381/9/27381.pdf?DDD29+DDO128+dph3ha
Department for Education. (2014). GCE AS and A level subject content for biology, chemistry, physics and psychology. Retrieved from https://www.gov.uk/government/uploads/system/uploads/attachment_data/file/593849/Science_AS_and_level_formatted.pdf
Dunlop, L., Knox, K. J., Reiss, M. J., & Torrance Jenkins, R. (2018). Practical independent research projects in science: a synthesis and evaluation of the evidence of impact on high school students AU - Bennett, Judith. International Journal of Science Education, 40(14), 1755–1773. https://doi.org/10.1080/09500693.2018.1511936
Evans, S., & Wade, N. (2015). Endorsing the practical endorsement? OCR’s approach to practical assessment in science A-levels. School Science Review, 96(June), 59–68.
Gatsby. (2014). New A level regulatory requirements: Response to the Ofqual consultation. Retrieved from http://www.gatsby.org.uk/uploads/education/reports/pdf/ofqual-a-level-reform-gatsby-foundation-january-2014.pdf
Gatsby. (2017). Good Practical Science. Retrieved from http://www.gatsby.org.uk/education/programmes/support-for-practical-science-in-schools
Gott, R., & Duggan, S. (2002). Problems with the Assessment of Performance in Practical Science: Which way now? Cambridge Journal of Education, 32(2), 183–201.
Gove, M. (2013). Letter from the Secretary of State for Education to Glenys Stacey at Ofqual. Retrieved from https://www.gov.uk/government/publications/letter-from-the-secretary-of-state-for-education-to-glenys-stacey-at-ofqual
Harlen, W. (1999). Purposes and Procedures for Assessing Science Process Skills. Assessment in Education: Principles, Policy & Practice, 6(1), 129–144.
Leevers, H. (2015). If we can code a human genome, we can find a way to assess science practicals. Retrieved from https://www.theguardian.com/teacher-network/2015/feb/02/ofqual-assess-science-practicals
Ofqual. (2013). Consultation on New A Level Regulatory Requirements. Retrieved
The impact of qualification reform on the practical skills of A level science students
37
from http://webarchive.nationalarchives.gov.uk/20141110161323/http://comment.ofqual.gov.uk/a-level-regulatory-requirements-october-2013/
Ofqual. (2015a). GCE Subject Level Guidance for Science (Biology, Chemistry, Physics). Retrieved from https://www.gov.uk/government/uploads/system/uploads/attachment_data/file/447167/2015-07-20-gce-subject-level-guidance-for-science.pdf
Ofqual. (2015b). AS and A Level Science (Biology , Chemistry and Physics) Consultation on Conditions and Guidance. Retrieved from https://www.gov.uk/government/organisations/ofqual
Ofqual. (2016). GCE subject level conditions and requirements for science (Biology, Chemistry, Physics) and certificate requirements. Retrieved from https://www.gov.uk/government/uploads/system/uploads/attachment_data/file/526286/gce-subject-level-conditions-and-requirements-for-science.pdf
Ofqual. (2017a). The impact of qualification reform on A level science practical work. Paper 1: Teacher perspectives after one year’. Retrieved from https://www.gov.uk/government/news/the-impact-of-qualification-reform-on-a-level-science-practical-work
Ofqual. (2017b). GCE Qualification Level Conditions and Requirements. Retrieved from https://www.gov.uk/government/uploads/system/uploads/attachment_data/file/644330/gce-qualification-level-conditions-and-requirements.pdf
Ofqual. (2018a). The impact of qualification reform on the practical skills of A-level science students. Paper 2: Pre and Post reform evaluation of practical skills. Retrieved from https://www.gov.uk/government/publications/evaluation-of-qualifications-reform
Ofqual. (2018b). The impact of qualification reform on the practical skills of A level science students. Paper 3: Valid discrimination in the assessment of practical performance. Retrieved from https://assets.publishing.service.gov.uk/government/uploads/system/uploads/attachment_data/file/705980/A_level_science_Study_3_-_2018-05-03.pdf
Ofqual. (2018c). The impact of qualification reform on the practical skills of A level science students. Paper 4: An analysis of the functioning of examination items that indirectly assess A level science practical skills. Retrieved from https://assets.publishing.service.gov.uk/government/uploads/system/uploads/attachment_data/file/747471/6433_FINAL_-_A_level_science_study_4.pdf
Reiss, M., Abrahams, I., & Sharpe, R. (2012). Improving the assessment of practical work in school science. London. Retrieved from www.gatsby.org.uk/uploads/education/reports/pdf/ improving-the-assessment-of-practical-work-in-school- science.pdf.
Stacey, G. (2015). A radical experiment to end science practicals? That’s just not true. Retrieved from https://www.theguardian.com/teacher-network/2015/feb/04/experiment-science-practicals-ofqual
Sund, P. (2016). Science teachers’ mission impossible?: a qualitative study of obstacles in assessing students’ practical abilities. International Journal of Science Education, 38(14), 2220–2238.
Wellcome Trust. (2014). Wellcome Trust responds to announcement of science A-level reforms. Retrieved July 15, 2016, from https://wellcome.ac.uk/news/wellcome-trust-responds-announcement-science-level-reforms
The impact of qualification reform on the practical skills of A level science students
38
Wilson, F., Wade, N., & Evans, S. (2016). Impact of changes to practical assessment at GCSE and A-level: the start of a longitudinal study by OCR. School Science Review, 98(362), 119–128.
The impact of qualification reform on the practical skills of A level science students
39
6 Annex A: Ofqual’s A level science research programme
Reformed A level qualifications in most subjects were introduced for first teaching in September 2015 (Gove, 2013). With regard to science, the reform led to significant changes to the assessment arrangements for practical skills (Ofqual, 2016). Ofqual is conducting a programme of research to evaluate the impact of A level qualification reform on the teaching and learning of science practical skills. The programme is comprised of 4 main studies, of which this report is Paper 5 (a follow up to Paper 2).
Paper 1: Teacher interviews – Perspectives on A level reform after one year (published, Ofqual, 2017a)
Paper 2: Pre and Post reform evaluation of practical ability – A comparison of science practical skills in pre and post reform cohorts of undergraduate students (published, Ofqual, 2018a)
Paper 3: Valid discrimination in practical skills assessment – An exploration of classification reliability when assessing the performance of practical skills (published, Ofqual, 2018b)
Paper 4: Technical functioning of assessment – An analysis of A level examination items that assess science practical skills (published, Ofqual, 2018c)
Paper 5: Final report on the pre- and post-reform evaluation of science practical skills
The impact of qualification reform on the practical skills of A level science students
40
7 Annex B: Biology PSM
Overview
Ofqual is conducting research into the ‘The impact of A level qualification reform on practical skills in science’. The Standards, Risk and Research Directorate has been working with subject experts to develop Practical Skills Measures (PSMs) for biology, chemistry and physics. The intention is to work with a number of university science departments to use these PSMs to assess the practical skills of incoming undergraduates. Data will be over a period of 3 years, starting in September 2016.
This document contains the tasks which will underpin the PSM for biology. The points below describe the general arrangements for the assessment.
Each of the following practical skills tasks constitutes a single work station within a carousel of activities.
Each task will be directly observed and assessed by university staff or postgraduate students.
Assessment is mastery based; assessors judge whether or not each participant is successful against the pre-defined criteria for each task.
Please refer to the ‘Task Administration Guidance’ document for further details.
Task 1:
Making up a standard solution and 10 fold dilution
Outline:
We are assessing two main skills here: firstly the ability to use a balance accurately and secondly, the correct use of a volumetric flask. In addition, the second step of making up another solution at 1/10th the original concentration will assess the students’ practical and problem-solving skills. They may choose to weigh out an amount 1/10th of the original and follow the same procedure, or to make a 1/10 dilution of the original solution. It is preferable to use dry volumetric flasks for each repeat as the dry sodium carbonate will stick to the sides of damp glassware. If possible, have a large enough stock of flasks that will allow time for them to dry between rotations.
Task:
The student is required to make up two standard solutions of sodium carbonate at concentrations of 1 mol l -1 (1M) and 0.1 mol l -1 (0.1M). Requires the use of a balance to measure mass plus volumetric flask. Student can choose to weigh out masses for both or use a cylinder and separate volumetric flask to make a 10x
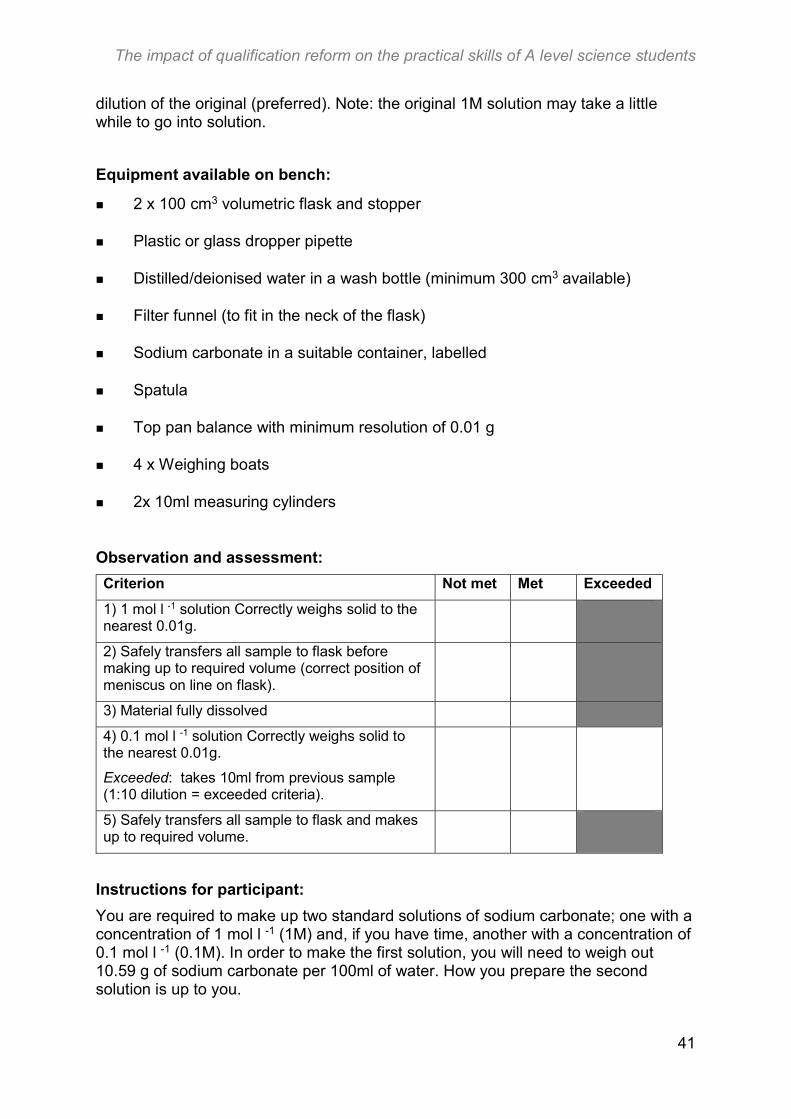
The impact of qualification reform on the practical skills of A level science students
41
dilution of the original (preferred). Note: the original 1M solution may take a little while to go into solution.
Equipment available on bench:
2 x 100 cm3 volumetric flask and stopper
Plastic or glass dropper pipette
Distilled/deionised water in a wash bottle (minimum 300 cm3 available)
Filter funnel (to fit in the neck of the flask)
Sodium carbonate in a suitable container, labelled
Spatula
Top pan balance with minimum resolution of 0.01 g
4 x Weighing boats
2x 10ml measuring cylinders
Observation and assessment:
Criterion Not met Met Exceeded
1) 1 mol l -1 solution Correctly weighs solid to the nearest 0.01g.
2) Safely transfers all sample to flask before making up to required volume (correct position of meniscus on line on flask).
3) Material fully dissolved
4) 0.1 mol l -1 solution Correctly weighs solid to the nearest 0.01g.
Exceeded: takes 10ml from previous sample (1:10 dilution = exceeded criteria).
5) Safely transfers all sample to flask and makes up to required volume.
Instructions for participant:
You are required to make up two standard solutions of sodium carbonate; one with a concentration of 1 mol l -1 (1M) and, if you have time, another with a concentration of 0.1 mol l -1 (0.1M). In order to make the first solution, you will need to weigh out 10.59 g of sodium carbonate per 100ml of water. How you prepare the second solution is up to you.
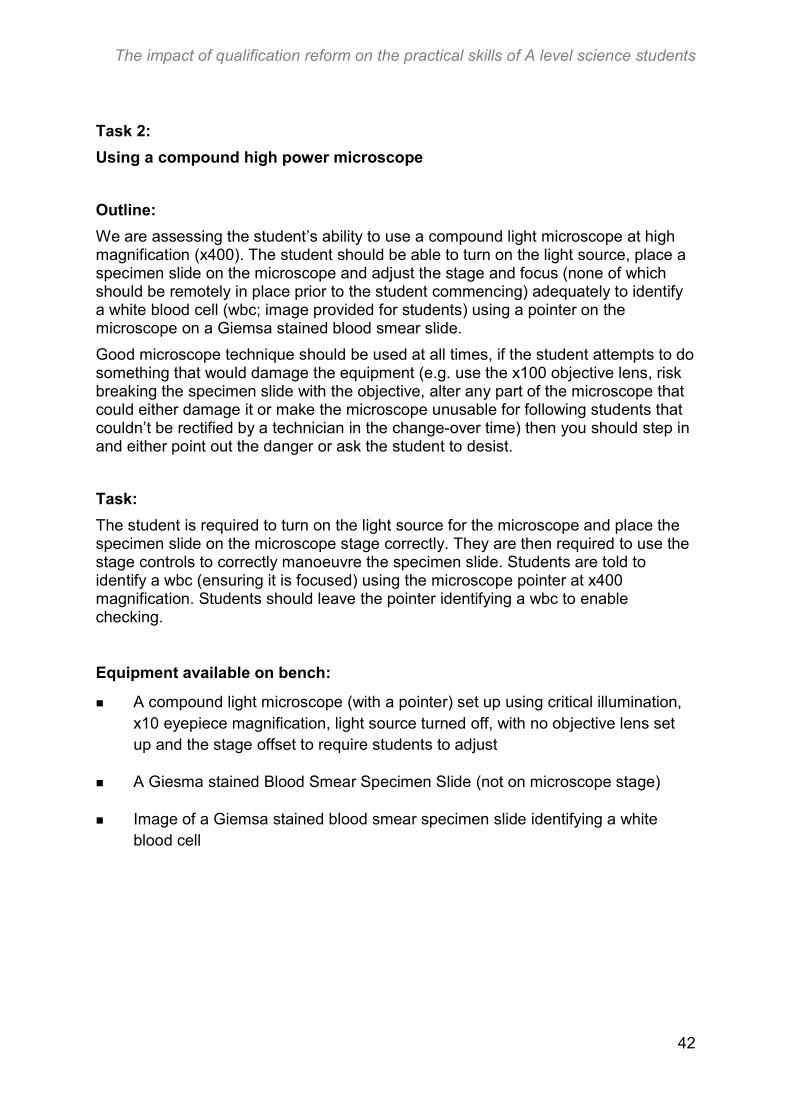
The impact of qualification reform on the practical skills of A level science students
42
Task 2:
Using a compound high power microscope
Outline:
We are assessing the student’s ability to use a compound light microscope at high magnification (x400). The student should be able to turn on the light source, place a specimen slide on the microscope and adjust the stage and focus (none of which should be remotely in place prior to the student commencing) adequately to identify a white blood cell (wbc; image provided for students) using a pointer on the microscope on a Giemsa stained blood smear slide.
Good microscope technique should be used at all times, if the student attempts to do something that would damage the equipment (e.g. use the x100 objective lens, risk breaking the specimen slide with the objective, alter any part of the microscope that could either damage it or make the microscope unusable for following students that couldn’t be rectified by a technician in the change-over time) then you should step in and either point out the danger or ask the student to desist.
Task:
The student is required to turn on the light source for the microscope and place the specimen slide on the microscope stage correctly. They are then required to use the stage controls to correctly manoeuvre the specimen slide. Students are told to identify a wbc (ensuring it is focused) using the microscope pointer at x400 magnification. Students should leave the pointer identifying a wbc to enable checking.
Equipment available on bench:
A compound light microscope (with a pointer) set up using critical illumination, x10 eyepiece magnification, light source turned off, with no objective lens set up and the stage offset to require students to adjust
A Giesma stained Blood Smear Specimen Slide (not on microscope stage)
Image of a Giemsa stained blood smear specimen slide identifying a white blood cell
The impact of qualification reform on the practical skills of A level science students
43
Observation and assessment:
Criterion Not met Met Exceeded
1) Correctly place the specimen slide on the microscope stage
2) Manoeuvre the microscope stage to bring the specimen slide into position for viewing
Exceeded: Bring the stage/slide all the way up to the objective lens before systematically lowering the stage to achieve focus
3) Focus the specimen slide using the x40 objective lens
Exceeded: Focus at lower magnification (x10 and/or x20 objective lens) prior to proceeding to x40 objective lens
4) Use the pointer to correctly identify a wbc on the specimen slide
Note: tip of pointer must be touching the wbc to meet the criteria
Instructions for participant:
You are required to demonstrate correct use of a high-power compound microscope to view the blood smear specimen slide. You should then use the pointer on the microscope to correctly identify a white blood cell (see image provided on the bench) at x400 magnification.
Task 3:
Determining the concentration of an unknown from a standard curve
Outline:
We are assessing the student’s ability to produce an accurate standard curve using the equipment provided. Students will be asked to measure the absorbance of an unknown sample using a spectrophotometer. They will then use a previously constructed standard curve to obtain the concentration of an unknown solution. The concentration of the unknown should be such that it is too high to be read directly from the standard curve, thus students should either choose to extrapolate the curve or dilute the original sample. The marking criteria is such that even if the student fails to measure the absorbance correctly (e.g. inserts the cuvette the wrong way around or uses insufficient amount of sample), they should still be able to determine a concentration.
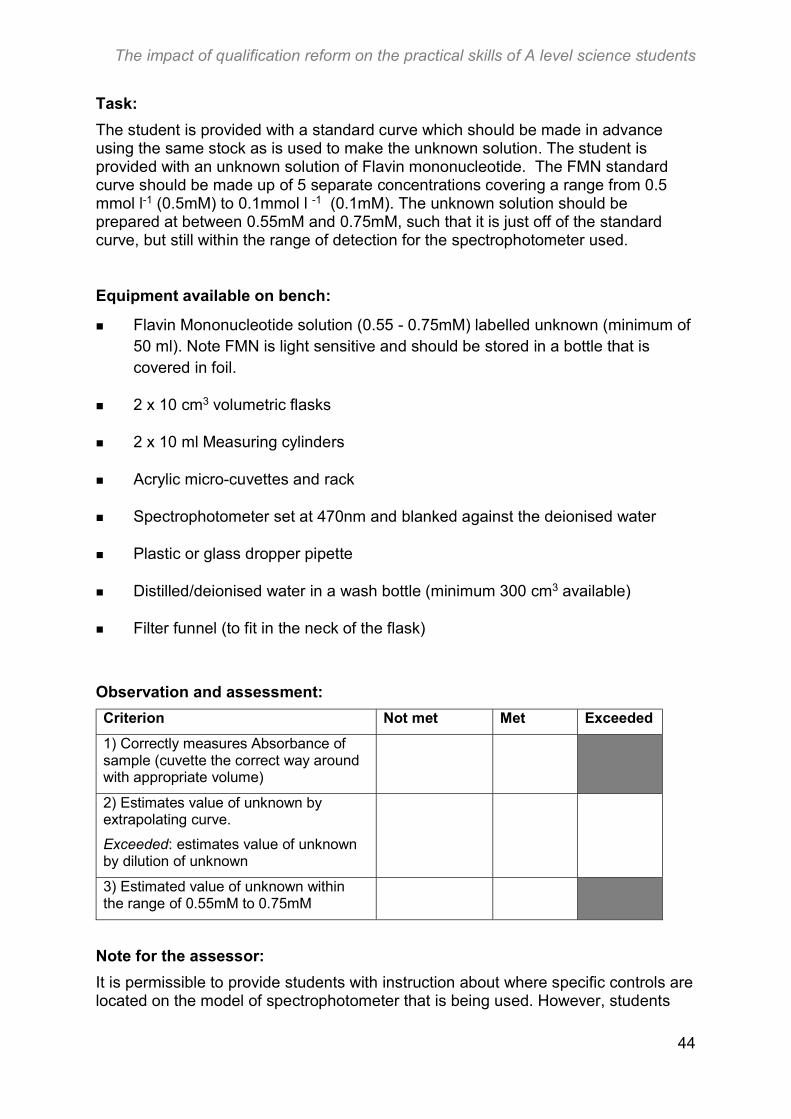
The impact of qualification reform on the practical skills of A level science students
44
Task:
The student is provided with a standard curve which should be made in advance using the same stock as is used to make the unknown solution. The student is provided with an unknown solution of Flavin mononucleotide. The FMN standard curve should be made up of 5 separate concentrations covering a range from 0.5 mmol l-1 (0.5mM) to 0.1mmol l -1 (0.1mM). The unknown solution should be prepared at between 0.55mM and 0.75mM, such that it is just off of the standard curve, but still within the range of detection for the spectrophotometer used.
Equipment available on bench:
Flavin Mononucleotide solution (0.55 - 0.75mM) labelled unknown (minimum of 50 ml). Note FMN is light sensitive and should be stored in a bottle that is covered in foil.
2 x 10 cm3 volumetric flasks
2 x 10 ml Measuring cylinders
Acrylic micro-cuvettes and rack
Spectrophotometer set at 470nm and blanked against the deionised water
Plastic or glass dropper pipette
Distilled/deionised water in a wash bottle (minimum 300 cm3 available)
Filter funnel (to fit in the neck of the flask)
Observation and assessment:
Criterion Not met Met Exceeded
1) Correctly measures Absorbance of sample (cuvette the correct way around with appropriate volume)
2) Estimates value of unknown by extrapolating curve.
Exceeded: estimates value of unknown by dilution of unknown
3) Estimated value of unknown within the range of 0.55mM to 0.75mM
Note for the assessor:
It is permissible to provide students with instruction about where specific controls are located on the model of spectrophotometer that is being used. However, students
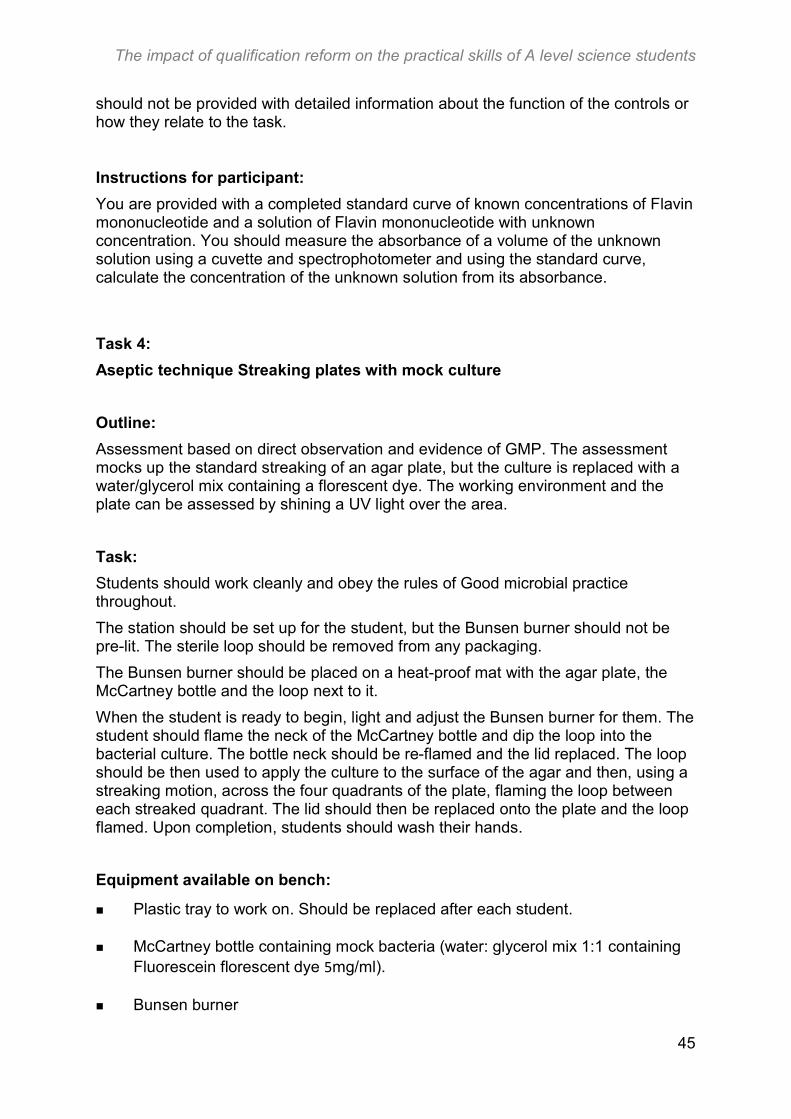
The impact of qualification reform on the practical skills of A level science students
45
should not be provided with detailed information about the function of the controls or how they relate to the task.
Instructions for participant:
You are provided with a completed standard curve of known concentrations of Flavin mononucleotide and a solution of Flavin mononucleotide with unknown concentration. You should measure the absorbance of a volume of the unknown solution using a cuvette and spectrophotometer and using the standard curve, calculate the concentration of the unknown solution from its absorbance.
Task 4:
Aseptic technique Streaking plates with mock culture
Outline:
Assessment based on direct observation and evidence of GMP. The assessment mocks up the standard streaking of an agar plate, but the culture is replaced with a water/glycerol mix containing a florescent dye. The working environment and the plate can be assessed by shining a UV light over the area.
Task:
Students should work cleanly and obey the rules of Good microbial practice throughout.
The station should be set up for the student, but the Bunsen burner should not be pre-lit. The sterile loop should be removed from any packaging.
The Bunsen burner should be placed on a heat-proof mat with the agar plate, the McCartney bottle and the loop next to it.
When the student is ready to begin, light and adjust the Bunsen burner for them. The student should flame the neck of the McCartney bottle and dip the loop into the bacterial culture. The bottle neck should be re-flamed and the lid replaced. The loop should be then used to apply the culture to the surface of the agar and then, using a streaking motion, across the four quadrants of the plate, flaming the loop between each streaked quadrant. The lid should then be replaced onto the plate and the loop flamed. Upon completion, students should wash their hands.
Equipment available on bench:
Plastic tray to work on. Should be replaced after each student.
McCartney bottle containing mock bacteria (water: glycerol mix 1:1 containing Fluorescein florescent dye 5mg/ml).
Bunsen burner
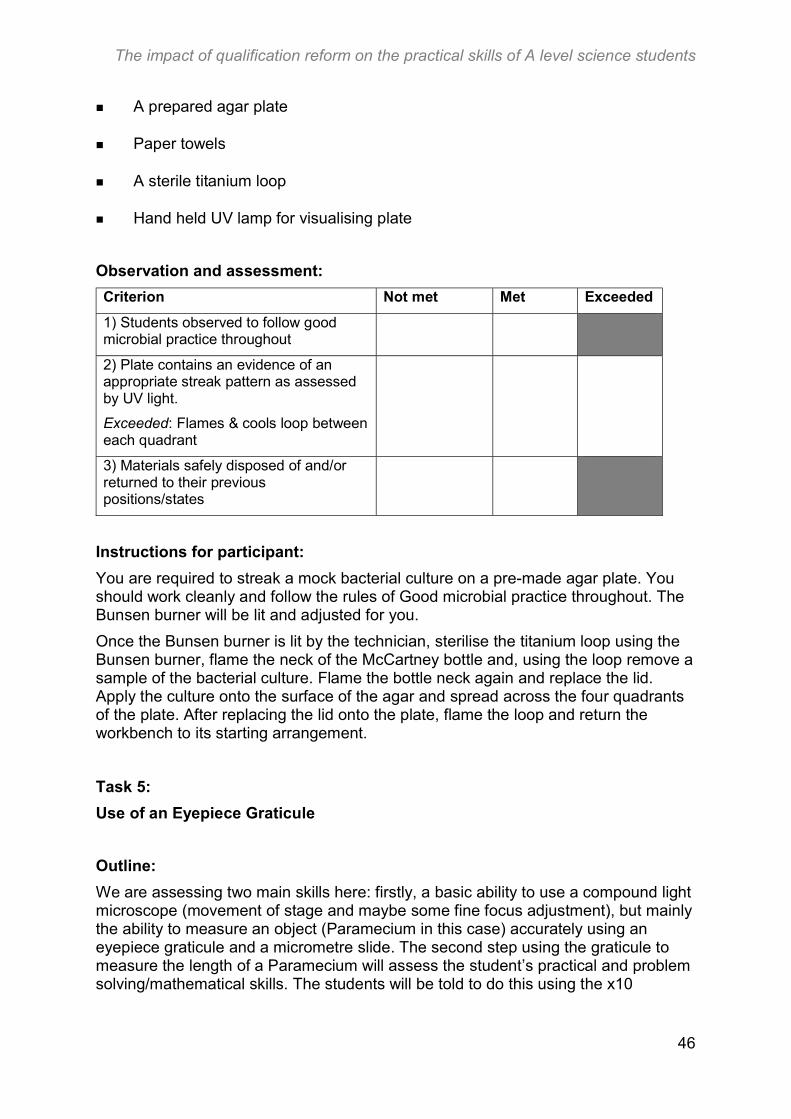
The impact of qualification reform on the practical skills of A level science students
46
A prepared agar plate
Paper towels
A sterile titanium loop
Hand held UV lamp for visualising plate
Observation and assessment:
Criterion Not met Met Exceeded
1) Students observed to follow good microbial practice throughout
2) Plate contains an evidence of an appropriate streak pattern as assessed by UV light.
Exceeded: Flames & cools loop between each quadrant
3) Materials safely disposed of and/or returned to their previous positions/states
Instructions for participant:
You are required to streak a mock bacterial culture on a pre-made agar plate. You should work cleanly and follow the rules of Good microbial practice throughout. The Bunsen burner will be lit and adjusted for you.
Once the Bunsen burner is lit by the technician, sterilise the titanium loop using the Bunsen burner, flame the neck of the McCartney bottle and, using the loop remove a sample of the bacterial culture. Flame the bottle neck again and replace the lid. Apply the culture onto the surface of the agar and spread across the four quadrants of the plate. After replacing the lid onto the plate, flame the loop and return the workbench to its starting arrangement.
Task 5:
Use of an Eyepiece Graticule
Outline:
We are assessing two main skills here: firstly, a basic ability to use a compound light microscope (movement of stage and maybe some fine focus adjustment), but mainly the ability to measure an object (Paramecium in this case) accurately using an eyepiece graticule and a micrometre slide. The second step using the graticule to measure the length of a Paramecium will assess the student’s practical and problem solving/mathematical skills. The students will be told to do this using the x10
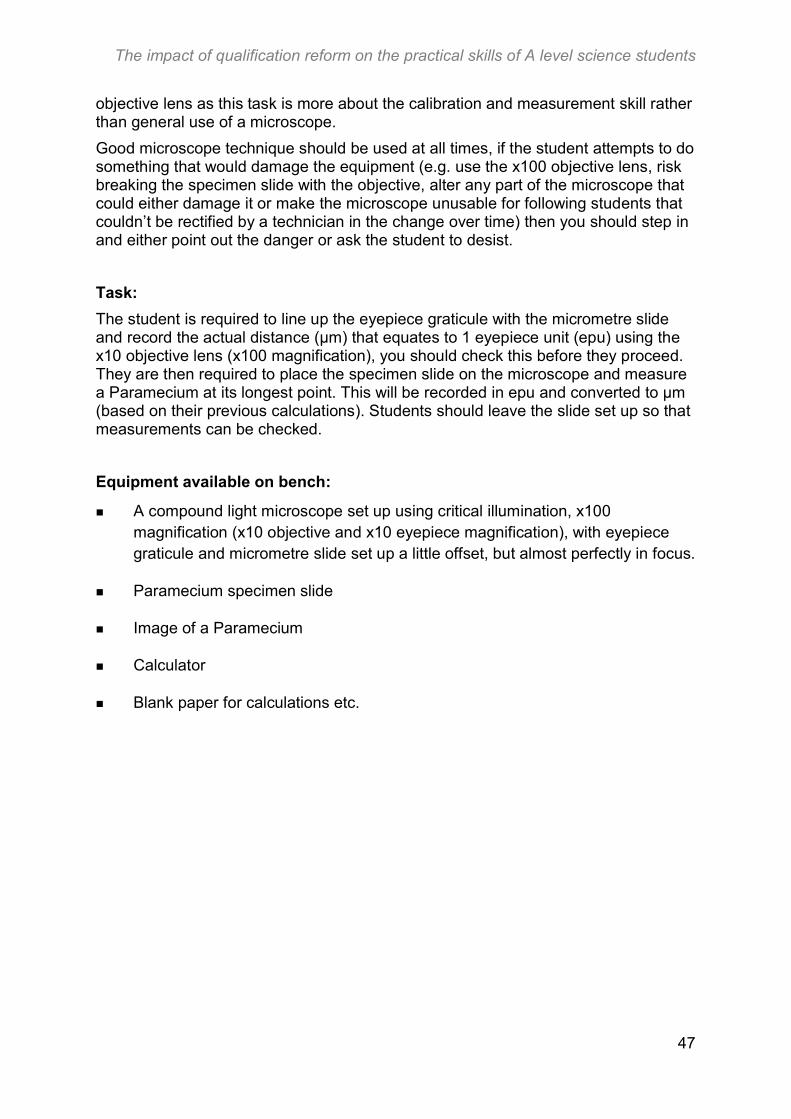
The impact of qualification reform on the practical skills of A level science students
47
objective lens as this task is more about the calibration and measurement skill rather than general use of a microscope.
Good microscope technique should be used at all times, if the student attempts to do something that would damage the equipment (e.g. use the x100 objective lens, risk breaking the specimen slide with the objective, alter any part of the microscope that could either damage it or make the microscope unusable for following students that couldn’t be rectified by a technician in the change over time) then you should step in and either point out the danger or ask the student to desist.
Task:
The student is required to line up the eyepiece graticule with the micrometre slide and record the actual distance (μm) that equates to 1 eyepiece unit (epu) using the x10 objective lens (x100 magnification), you should check this before they proceed. They are then required to place the specimen slide on the microscope and measure a Paramecium at its longest point. This will be recorded in epu and converted to μm (based on their previous calculations). Students should leave the slide set up so that measurements can be checked.
Equipment available on bench:
A compound light microscope set up using critical illumination, x100 magnification (x10 objective and x10 eyepiece magnification), with eyepiece graticule and micrometre slide set up a little offset, but almost perfectly in focus.
Paramecium specimen slide
Image of a Paramecium
Calculator
Blank paper for calculations etc.
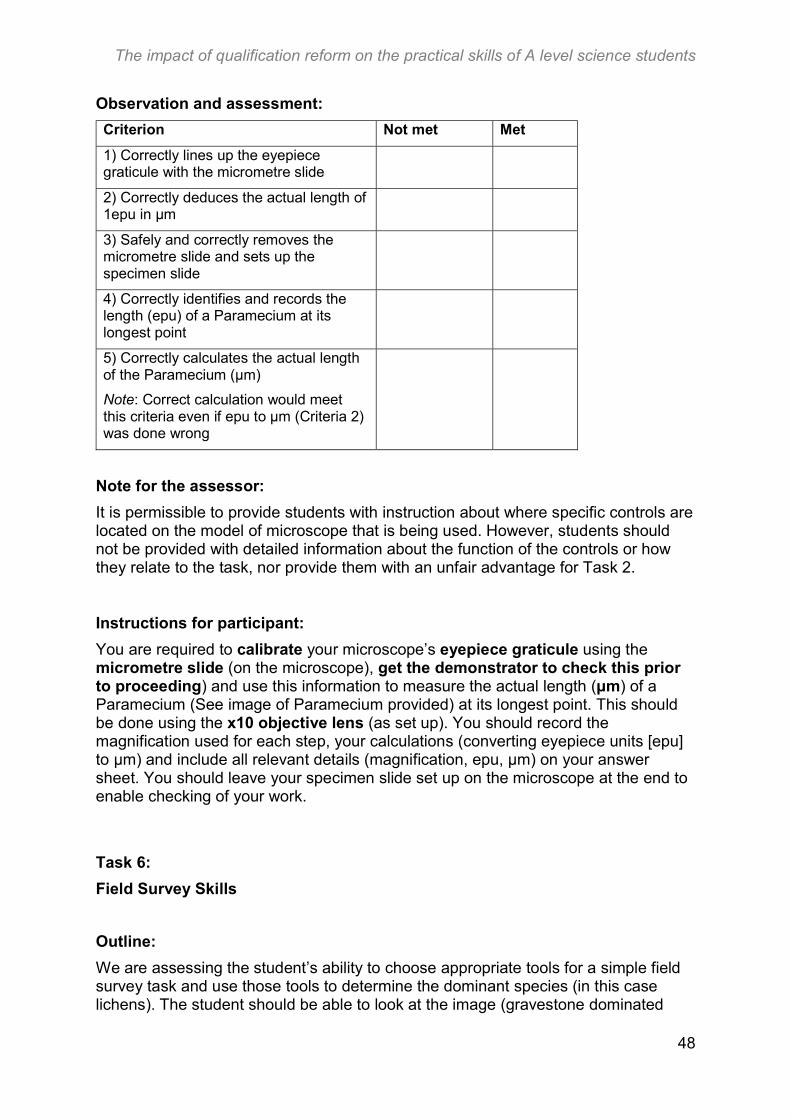
The impact of qualification reform on the practical skills of A level science students
48
Observation and assessment:
Criterion Not met Met
1) Correctly lines up the eyepiece graticule with the micrometre slide
2) Correctly deduces the actual length of 1epu in μm
3) Safely and correctly removes the micrometre slide and sets up the specimen slide
4) Correctly identifies and records the length (epu) of a Paramecium at its longest point
5) Correctly calculates the actual length of the Paramecium (μm)
Note: Correct calculation would meet this criteria even if epu to μm (Criteria 2) was done wrong
Note for the assessor:
It is permissible to provide students with instruction about where specific controls are located on the model of microscope that is being used. However, students should not be provided with detailed information about the function of the controls or how they relate to the task, nor provide them with an unfair advantage for Task 2.
Instructions for participant:
You are required to calibrate your microscope’s eyepiece graticule using the micrometre slide (on the microscope), get the demonstrator to check this prior to proceeding) and use this information to measure the actual length (μm) of a Paramecium (See image of Paramecium provided) at its longest point. This should be done using the x10 objective lens (as set up). You should record the magnification used for each step, your calculations (converting eyepiece units [epu] to μm) and include all relevant details (magnification, epu, μm) on your answer sheet. You should leave your specimen slide set up on the microscope at the end to enable checking of your work.
Task 6:
Field Survey Skills
Outline:
We are assessing the student’s ability to choose appropriate tools for a simple field survey task and use those tools to determine the dominant species (in this case lichens). The student should be able to look at the image (gravestone dominated
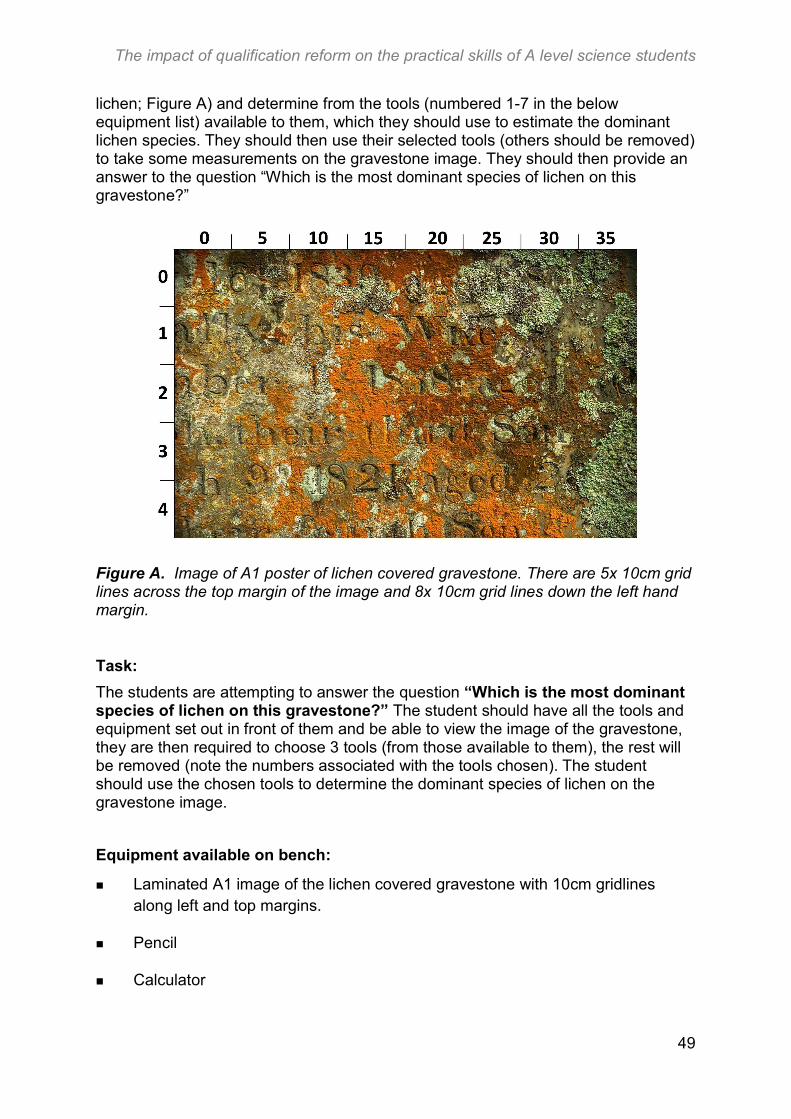
The impact of qualification reform on the practical skills of A level science students
49
lichen; Figure A) and determine from the tools (numbered 1-7 in the below equipment list) available to them, which they should use to estimate the dominant lichen species. They should then use their selected tools (others should be removed) to take some measurements on the gravestone image. They should then provide an answer to the question “Which is the most dominant species of lichen on this gravestone?”
Figure A. Image of A1 poster of lichen covered gravestone. There are 5x 10cm grid lines across the top margin of the image and 8x 10cm grid lines down the left hand margin.
Task:
The students are attempting to answer the question “Which is the most dominant species of lichen on this gravestone?” The student should have all the tools and equipment set out in front of them and be able to view the image of the gravestone, they are then required to choose 3 tools (from those available to them), the rest will be removed (note the numbers associated with the tools chosen). The student should use the chosen tools to determine the dominant species of lichen on the gravestone image.
Equipment available on bench:
Laminated A1 image of the lichen covered gravestone with 10cm gridlines along left and top margins.
Pencil
Calculator
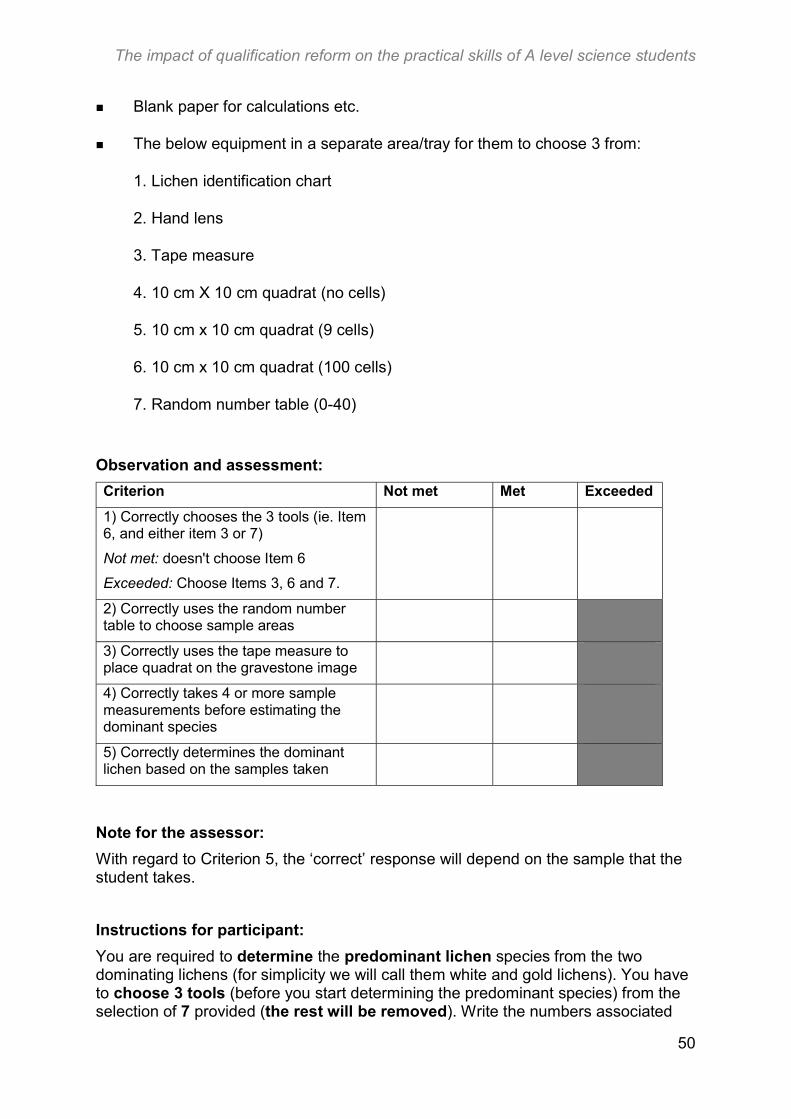
The impact of qualification reform on the practical skills of A level science students
50
Blank paper for calculations etc.
The below equipment in a separate area/tray for them to choose 3 from:
1. Lichen identification chart
2. Hand lens
3. Tape measure
4. 10 cm X 10 cm quadrat (no cells)
5. 10 cm x 10 cm quadrat (9 cells)
6. 10 cm x 10 cm quadrat (100 cells)
7. Random number table (0-40)
Observation and assessment:
Criterion Not met Met Exceeded
1) Correctly chooses the 3 tools (ie. Item 6, and either item 3 or 7)
Not met: doesn't choose Item 6
Exceeded: Choose Items 3, 6 and 7.
2) Correctly uses the random number table to choose sample areas
3) Correctly uses the tape measure to place quadrat on the gravestone image
4) Correctly takes 4 or more sample measurements before estimating the dominant species
5) Correctly determines the dominant lichen based on the samples taken
Note for the assessor:
With regard to Criterion 5, the ‘correct’ response will depend on the sample that the student takes.
Instructions for participant:
You are required to determine the predominant lichen species from the two dominating lichens (for simplicity we will call them white and gold lichens). You have to choose 3 tools (before you start determining the predominant species) from the selection of 7 provided (the rest will be removed). Write the numbers associated

The impact of qualification reform on the practical skills of A level science students
51
with the tools you have chosen on your worksheet. Record your sampling strategy/calculations as well as which lichen you have determined to be the predominant species.
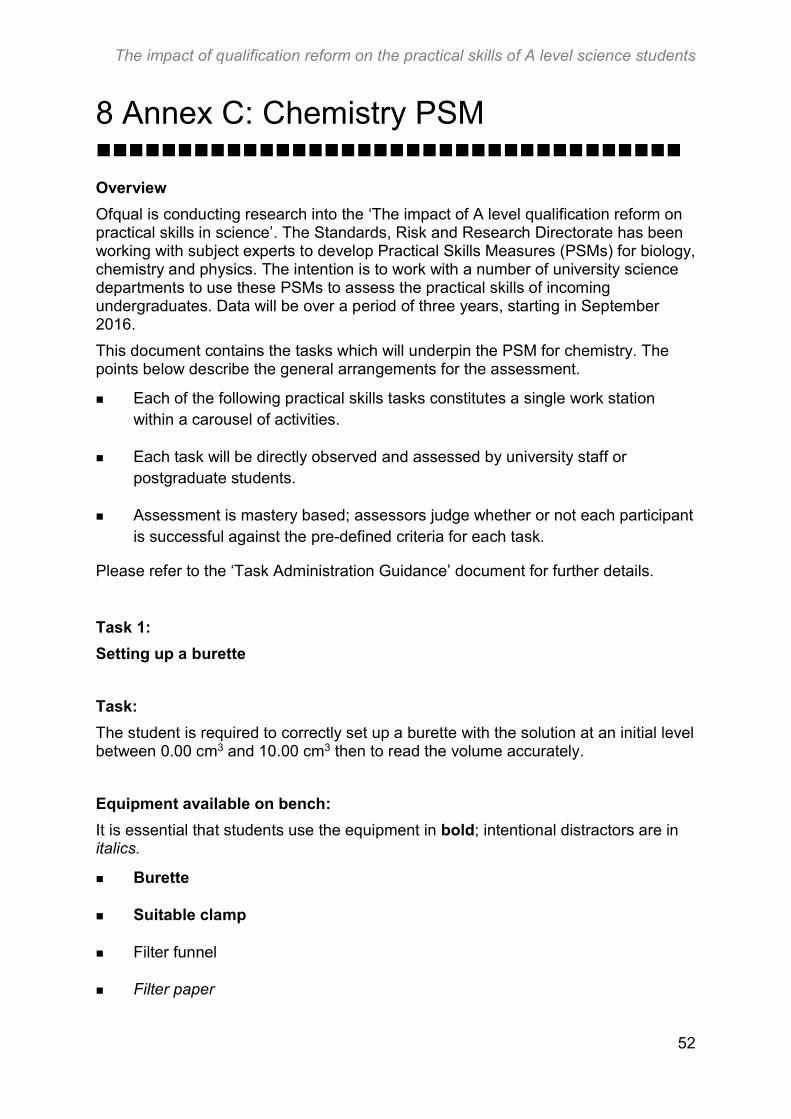
The impact of qualification reform on the practical skills of A level science students
52
8 Annex C: Chemistry PSM
Overview
Ofqual is conducting research into the ‘The impact of A level qualification reform on practical skills in science’. The Standards, Risk and Research Directorate has been working with subject experts to develop Practical Skills Measures (PSMs) for biology, chemistry and physics. The intention is to work with a number of university science departments to use these PSMs to assess the practical skills of incoming undergraduates. Data will be over a period of three years, starting in September 2016.
This document contains the tasks which will underpin the PSM for chemistry. The points below describe the general arrangements for the assessment.
Each of the following practical skills tasks constitutes a single work station within a carousel of activities.
Each task will be directly observed and assessed by university staff or postgraduate students.
Assessment is mastery based; assessors judge whether or not each participant is successful against the pre-defined criteria for each task.
Please refer to the ‘Task Administration Guidance’ document for further details.
Task 1:
Setting up a burette
Task:
The student is required to correctly set up a burette with the solution at an initial level between 0.00 cm3 and 10.00 cm3 then to read the volume accurately.
Equipment available on bench:
It is essential that students use the equipment in bold; intentional distractors are in italics.
Burette
Suitable clamp
Filter funnel
Filter paper
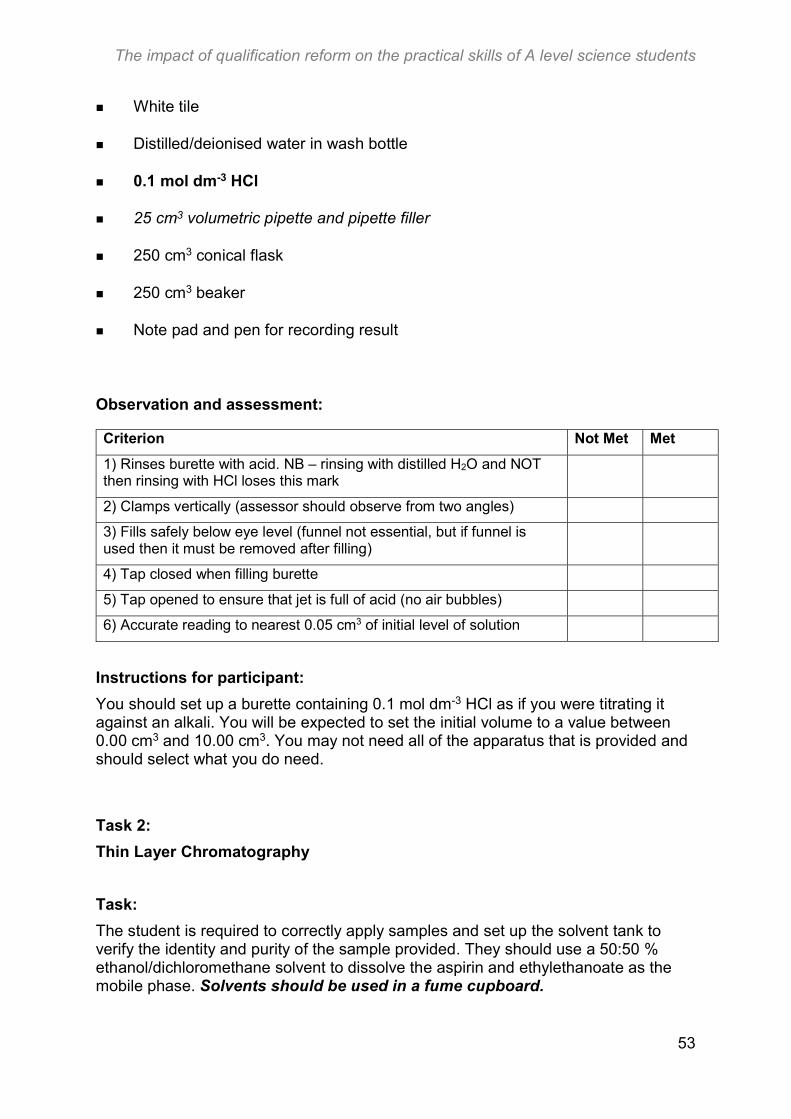
The impact of qualification reform on the practical skills of A level science students
53
White tile
Distilled/deionised water in wash bottle
0.1 mol dm-3 HCl
25 cm3 volumetric pipette and pipette filler
250 cm3 conical flask
250 cm3 beaker
Note pad and pen for recording result
Observation and assessment:
Criterion Not Met Met
1) Rinses burette with acid. NB – rinsing with distilled H2O and NOT then rinsing with HCl loses this mark
2) Clamps vertically (assessor should observe from two angles)
3) Fills safely below eye level (funnel not essential, but if funnel is used then it must be removed after filling)
4) Tap closed when filling burette
5) Tap opened to ensure that jet is full of acid (no air bubbles)
6) Accurate reading to nearest 0.05 cm3 of initial level of solution
Instructions for participant:
You should set up a burette containing 0.1 mol dm-3 HCl as if you were titrating it against an alkali. You will be expected to set the initial volume to a value between 0.00 cm3 and 10.00 cm3. You may not need all of the apparatus that is provided and should select what you do need.
Task 2:
Thin Layer Chromatography
Task:
The student is required to correctly apply samples and set up the solvent tank to verify the identity and purity of the sample provided. They should use a 50:50 % ethanol/dichloromethane solvent to dissolve the aspirin and ethylethanoate as the mobile phase. Solvents should be used in a fume cupboard.
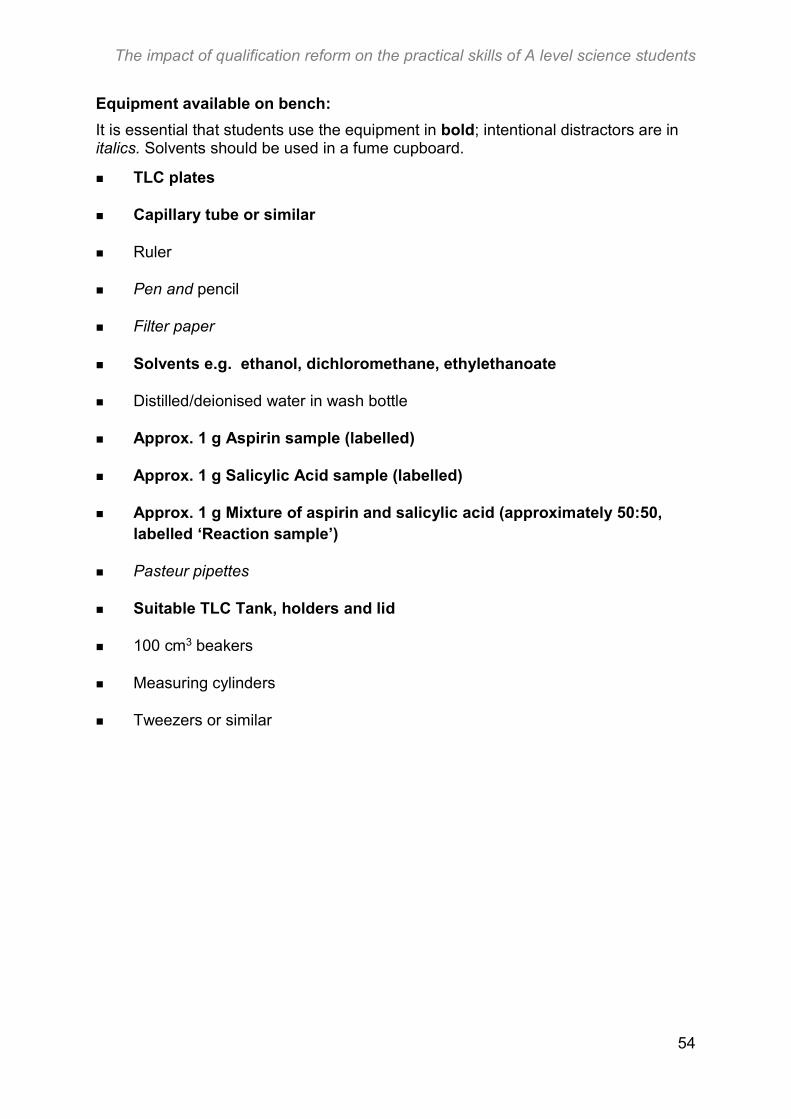
The impact of qualification reform on the practical skills of A level science students
54
Equipment available on bench:
It is essential that students use the equipment in bold; intentional distractors are in italics. Solvents should be used in a fume cupboard.
TLC plates
Capillary tube or similar
Ruler
Pen and pencil
Filter paper
Solvents e.g. ethanol, dichloromethane, ethylethanoate
Distilled/deionised water in wash bottle
Approx. 1 g Aspirin sample (labelled)
Approx. 1 g Salicylic Acid sample (labelled)
Approx. 1 g Mixture of aspirin and salicylic acid (approximately 50:50, labelled ‘Reaction sample’)
Pasteur pipettes
Suitable TLC Tank, holders and lid
100 cm3 beakers
Measuring cylinders
Tweezers or similar
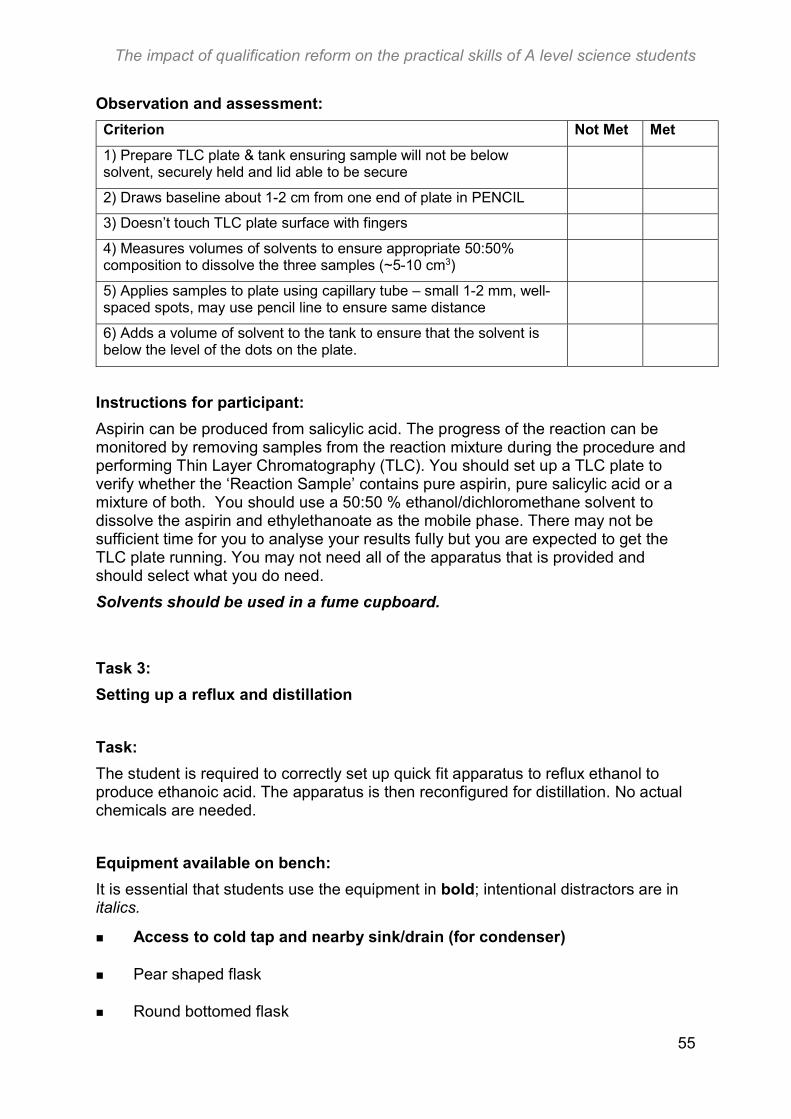
The impact of qualification reform on the practical skills of A level science students
55
Observation and assessment:
Criterion Not Met Met
1) Prepare TLC plate & tank ensuring sample will not be below solvent, securely held and lid able to be secure
2) Draws baseline about 1-2 cm from one end of plate in PENCIL
3) Doesn’t touch TLC plate surface with fingers
4) Measures volumes of solvents to ensure appropriate 50:50% composition to dissolve the three samples (~5-10 cm3)
5) Applies samples to plate using capillary tube – small 1-2 mm, well-spaced spots, may use pencil line to ensure same distance
6) Adds a volume of solvent to the tank to ensure that the solvent is below the level of the dots on the plate.
Instructions for participant:
Aspirin can be produced from salicylic acid. The progress of the reaction can be monitored by removing samples from the reaction mixture during the procedure and performing Thin Layer Chromatography (TLC). You should set up a TLC plate to verify whether the ‘Reaction Sample’ contains pure aspirin, pure salicylic acid or a mixture of both. You should use a 50:50 % ethanol/dichloromethane solvent to dissolve the aspirin and ethylethanoate as the mobile phase. There may not be sufficient time for you to analyse your results fully but you are expected to get the TLC plate running. You may not need all of the apparatus that is provided and should select what you do need.
Solvents should be used in a fume cupboard.
Task 3:
Setting up a reflux and distillation
Task:
The student is required to correctly set up quick fit apparatus to reflux ethanol to produce ethanoic acid. The apparatus is then reconfigured for distillation. No actual chemicals are needed.
Equipment available on bench:
It is essential that students use the equipment in bold; intentional distractors are in italics.
Access to cold tap and nearby sink/drain (for condenser)
Pear shaped flask
Round bottomed flask
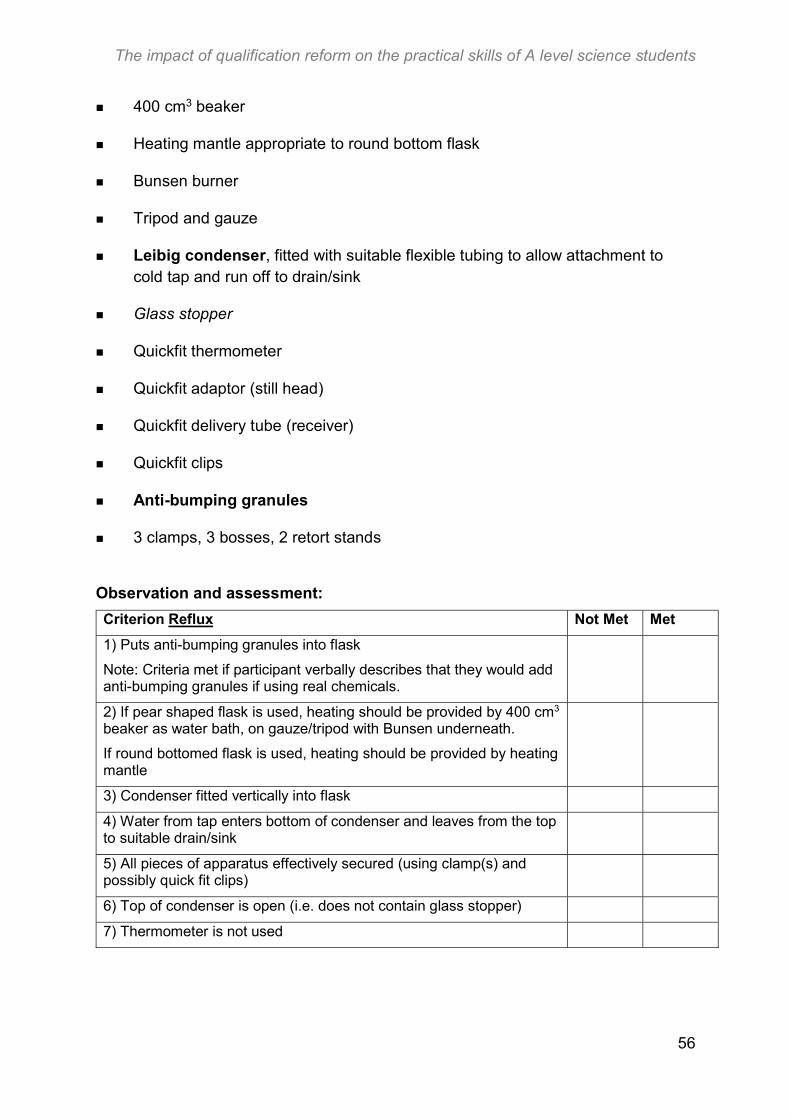
The impact of qualification reform on the practical skills of A level science students
56
400 cm3 beaker
Heating mantle appropriate to round bottom flask
Bunsen burner
Tripod and gauze
Leibig condenser, fitted with suitable flexible tubing to allow attachment to cold tap and run off to drain/sink
Glass stopper
Quickfit thermometer
Quickfit adaptor (still head)
Quickfit delivery tube (receiver)
Quickfit clips
Anti-bumping granules
3 clamps, 3 bosses, 2 retort stands
Observation and assessment:
Criterion Reflux Not Met Met
1) Puts anti-bumping granules into flask
Note: Criteria met if participant verbally describes that they would add anti-bumping granules if using real chemicals.
2) If pear shaped flask is used, heating should be provided by 400 cm3 beaker as water bath, on gauze/tripod with Bunsen underneath.
If round bottomed flask is used, heating should be provided by heating mantle
3) Condenser fitted vertically into flask
4) Water from tap enters bottom of condenser and leaves from the top to suitable drain/sink
5) All pieces of apparatus effectively secured (using clamp(s) and possibly quick fit clips)
6) Top of condenser is open (i.e. does not contain glass stopper)
7) Thermometer is not used
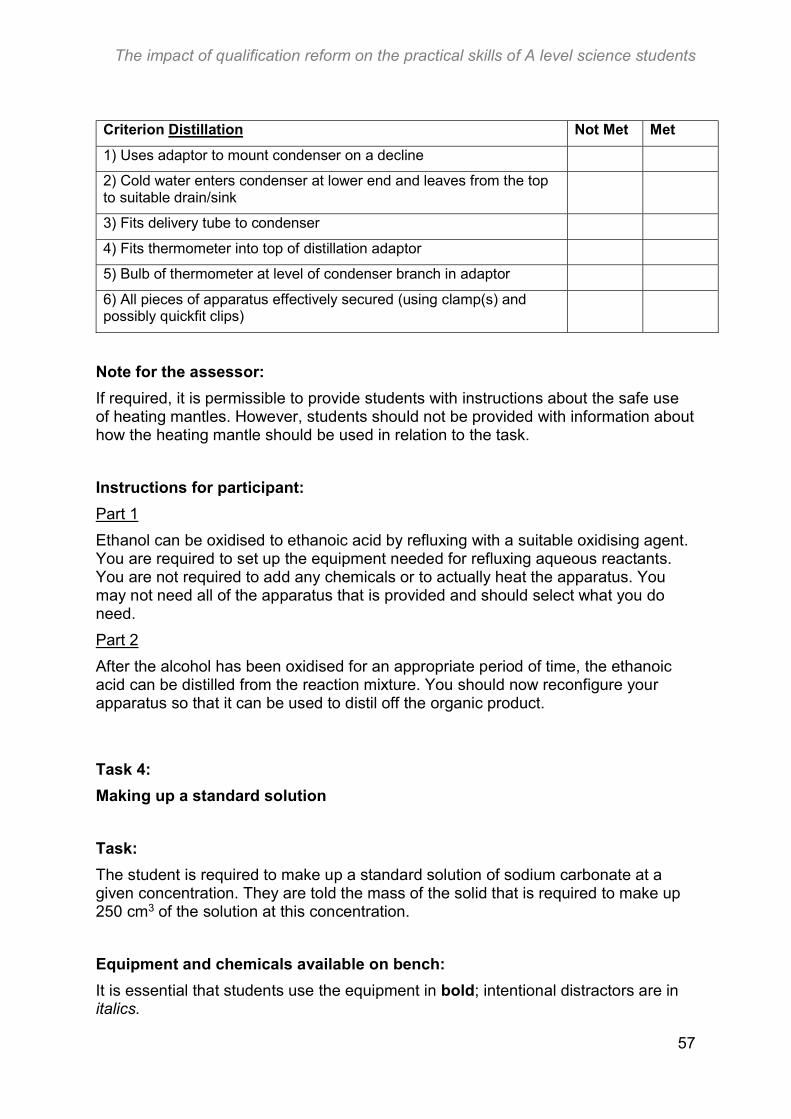
The impact of qualification reform on the practical skills of A level science students
57
Criterion Distillation Not Met Met
1) Uses adaptor to mount condenser on a decline
2) Cold water enters condenser at lower end and leaves from the top to suitable drain/sink
3) Fits delivery tube to condenser
4) Fits thermometer into top of distillation adaptor
5) Bulb of thermometer at level of condenser branch in adaptor
6) All pieces of apparatus effectively secured (using clamp(s) and possibly quickfit clips)
Note for the assessor:
If required, it is permissible to provide students with instructions about the safe use of heating mantles. However, students should not be provided with information about how the heating mantle should be used in relation to the task.
Instructions for participant:
Part 1
Ethanol can be oxidised to ethanoic acid by refluxing with a suitable oxidising agent. You are required to set up the equipment needed for refluxing aqueous reactants. You are not required to add any chemicals or to actually heat the apparatus. You may not need all of the apparatus that is provided and should select what you do need.
Part 2
After the alcohol has been oxidised for an appropriate period of time, the ethanoic acid can be distilled from the reaction mixture. You should now reconfigure your apparatus so that it can be used to distil off the organic product.
Task 4:
Making up a standard solution
Task:
The student is required to make up a standard solution of sodium carbonate at a given concentration. They are told the mass of the solid that is required to make up 250 cm3 of the solution at this concentration.
Equipment and chemicals available on bench:
It is essential that students use the equipment in bold; intentional distractors are in italics.
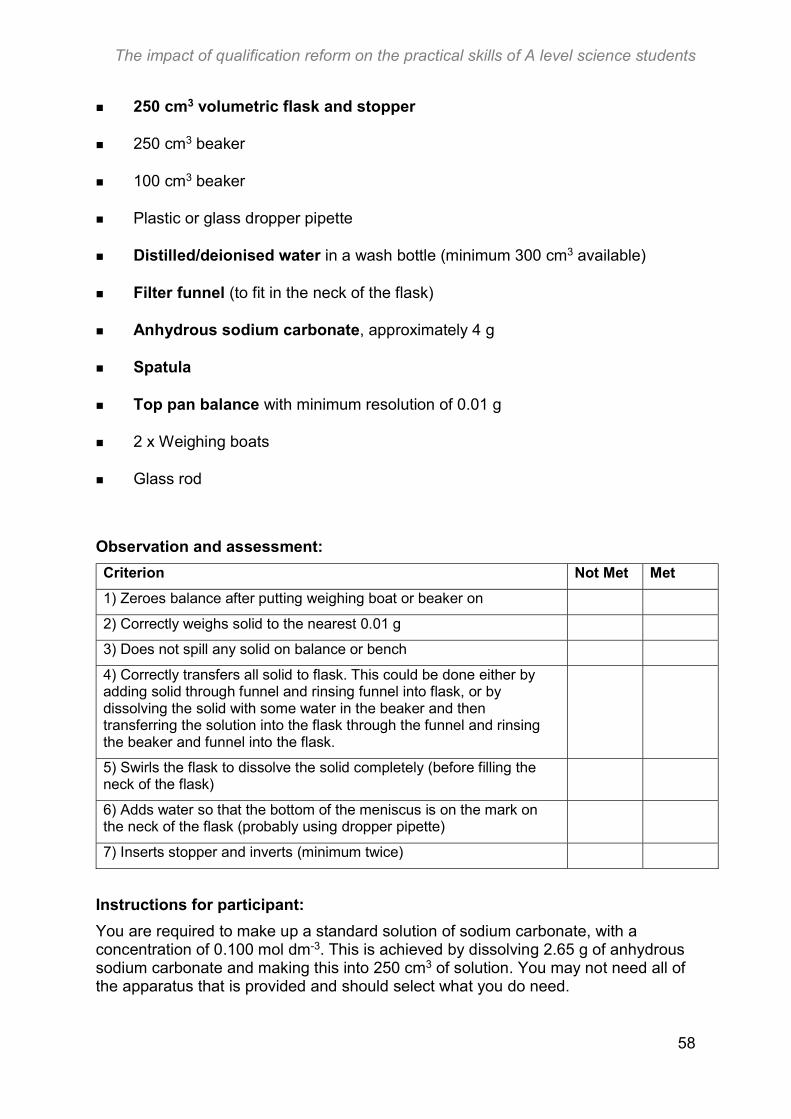
The impact of qualification reform on the practical skills of A level science students
58
250 cm3 volumetric flask and stopper
250 cm3 beaker
100 cm3 beaker
Plastic or glass dropper pipette
Distilled/deionised water in a wash bottle (minimum 300 cm3 available)
Filter funnel (to fit in the neck of the flask)
Anhydrous sodium carbonate, approximately 4 g
Spatula
Top pan balance with minimum resolution of 0.01 g
2 x Weighing boats
Glass rod
Observation and assessment:
Criterion Not Met Met
1) Zeroes balance after putting weighing boat or beaker on
2) Correctly weighs solid to the nearest 0.01 g
3) Does not spill any solid on balance or bench
4) Correctly transfers all solid to flask. This could be done either by adding solid through funnel and rinsing funnel into flask, or by dissolving the solid with some water in the beaker and then transferring the solution into the flask through the funnel and rinsing the beaker and funnel into the flask.
5) Swirls the flask to dissolve the solid completely (before filling the neck of the flask)
6) Adds water so that the bottom of the meniscus is on the mark on the neck of the flask (probably using dropper pipette)
7) Inserts stopper and inverts (minimum twice)
Instructions for participant:
You are required to make up a standard solution of sodium carbonate, with a concentration of 0.100 mol dm-3. This is achieved by dissolving 2.65 g of anhydrous sodium carbonate and making this into 250 cm3 of solution. You may not need all of the apparatus that is provided and should select what you do need.
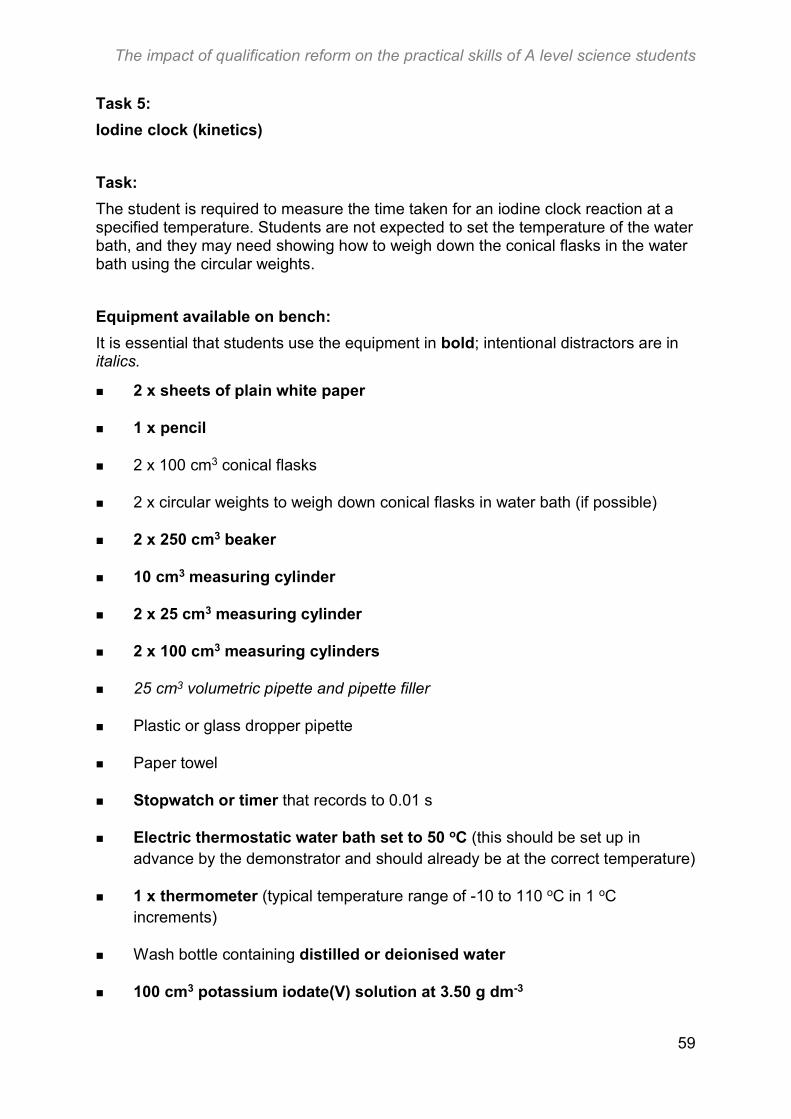
The impact of qualification reform on the practical skills of A level science students
59
Task 5:
Iodine clock (kinetics)
Task:
The student is required to measure the time taken for an iodine clock reaction at a specified temperature. Students are not expected to set the temperature of the water bath, and they may need showing how to weigh down the conical flasks in the water bath using the circular weights.
Equipment available on bench:
It is essential that students use the equipment in bold; intentional distractors are in italics.
2 x sheets of plain white paper
1 x pencil
2 x 100 cm3 conical flasks
2 x circular weights to weigh down conical flasks in water bath (if possible)
2 x 250 cm3 beaker
10 cm3 measuring cylinder
2 x 25 cm3 measuring cylinder
2 x 100 cm3 measuring cylinders
25 cm3 volumetric pipette and pipette filler
Plastic or glass dropper pipette
Paper towel
Stopwatch or timer that records to 0.01 s
Electric thermostatic water bath set to 50 oC (this should be set up in advance by the demonstrator and should already be at the correct temperature)
1 x thermometer (typical temperature range of -10 to 110 oC in 1 oC increments)
Wash bottle containing distilled or deionised water
100 cm3 potassium iodate(V) solution at 3.50 g dm-3
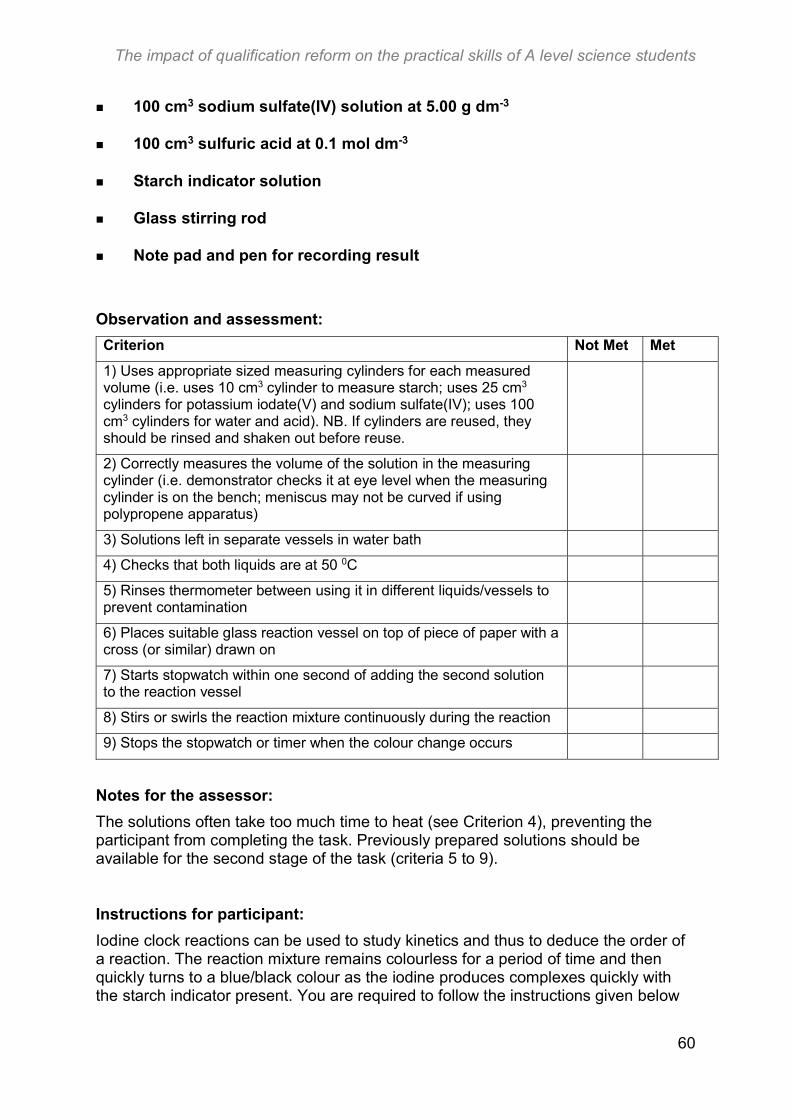
The impact of qualification reform on the practical skills of A level science students
60
100 cm3 sodium sulfate(IV) solution at 5.00 g dm-3
100 cm3 sulfuric acid at 0.1 mol dm-3
Starch indicator solution
Glass stirring rod
Note pad and pen for recording result
Observation and assessment:
Criterion Not Met Met
1) Uses appropriate sized measuring cylinders for each measured volume (i.e. uses 10 cm3 cylinder to measure starch; uses 25 cm3 cylinders for potassium iodate(V) and sodium sulfate(IV); uses 100 cm3 cylinders for water and acid). NB. If cylinders are reused, they should be rinsed and shaken out before reuse.
2) Correctly measures the volume of the solution in the measuring cylinder (i.e. demonstrator checks it at eye level when the measuring cylinder is on the bench; meniscus may not be curved if using polypropene apparatus)
3) Solutions left in separate vessels in water bath
4) Checks that both liquids are at 50 0C
5) Rinses thermometer between using it in different liquids/vessels to prevent contamination
6) Places suitable glass reaction vessel on top of piece of paper with a cross (or similar) drawn on
7) Starts stopwatch within one second of adding the second solution to the reaction vessel
8) Stirs or swirls the reaction mixture continuously during the reaction
9) Stops the stopwatch or timer when the colour change occurs
Notes for the assessor:
The solutions often take too much time to heat (see Criterion 4), preventing the participant from completing the task. Previously prepared solutions should be available for the second stage of the task (criteria 5 to 9).
Instructions for participant:
Iodine clock reactions can be used to study kinetics and thus to deduce the order of a reaction. The reaction mixture remains colourless for a period of time and then quickly turns to a blue/black colour as the iodine produces complexes quickly with the starch indicator present. You are required to follow the instructions given below
The impact of qualification reform on the practical skills of A level science students
61
and to accurately record the time taken for the reaction mixture to turn blue/black. The instructions are intentionally brief and you will need to use your experience and judgement to complete the experiment successfully. You may not need all of the apparatus that is provided and should select what you do need.
Method:
1. Mix 15 cm3 of potassium iodate(V) solution, 85 cm3 of distilled or deionised water and 5 cm3 of starch indicator. Ask your demonstrator to check one of these measured volumes while the liquid is still in the measuring cylinder. Warm this mixture to 50 0C.
2. Mix 15 cm3 of sodium sulfate(IV) solution and 85 cm3 of sulfuric acid solution. Warm this mixture to 50 0C.
3. Warm a suitable reaction vessel to 50 oC.
4. Remove the reaction vessel and liquids from the water bath.
5. Begin the reaction by combining the two mixtures of solutions and record the time taken for the blue/black colour to appear.
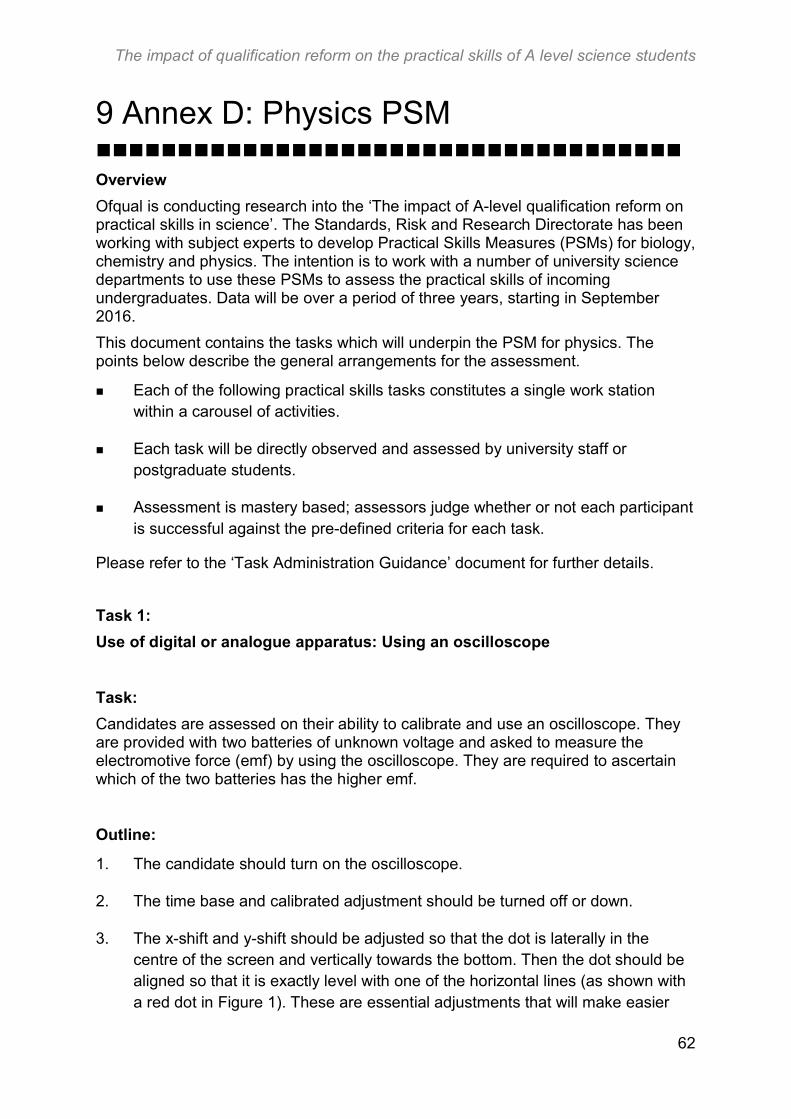
The impact of qualification reform on the practical skills of A level science students
62
9 Annex D: Physics PSM Overview
Ofqual is conducting research into the ‘The impact of A-level qualification reform on practical skills in science’. The Standards, Risk and Research Directorate has been working with subject experts to develop Practical Skills Measures (PSMs) for biology, chemistry and physics. The intention is to work with a number of university science departments to use these PSMs to assess the practical skills of incoming undergraduates. Data will be over a period of three years, starting in September 2016.
This document contains the tasks which will underpin the PSM for physics. The points below describe the general arrangements for the assessment.
Each of the following practical skills tasks constitutes a single work station within a carousel of activities.
Each task will be directly observed and assessed by university staff or postgraduate students.
Assessment is mastery based; assessors judge whether or not each participant is successful against the pre-defined criteria for each task.
Please refer to the ‘Task Administration Guidance’ document for further details.
Task 1:
Use of digital or analogue apparatus: Using an oscilloscope
Task:
Candidates are assessed on their ability to calibrate and use an oscilloscope. They are provided with two batteries of unknown voltage and asked to measure the electromotive force (emf) by using the oscilloscope. They are required to ascertain which of the two batteries has the higher emf.
Outline:
1. The candidate should turn on the oscilloscope.
2. The time base and calibrated adjustment should be turned off or down.
3. The x-shift and y-shift should be adjusted so that the dot is laterally in the centre of the screen and vertically towards the bottom. Then the dot should be aligned so that it is exactly level with one of the horizontal lines (as shown with a red dot in Figure 1). These are essential adjustments that will make easier
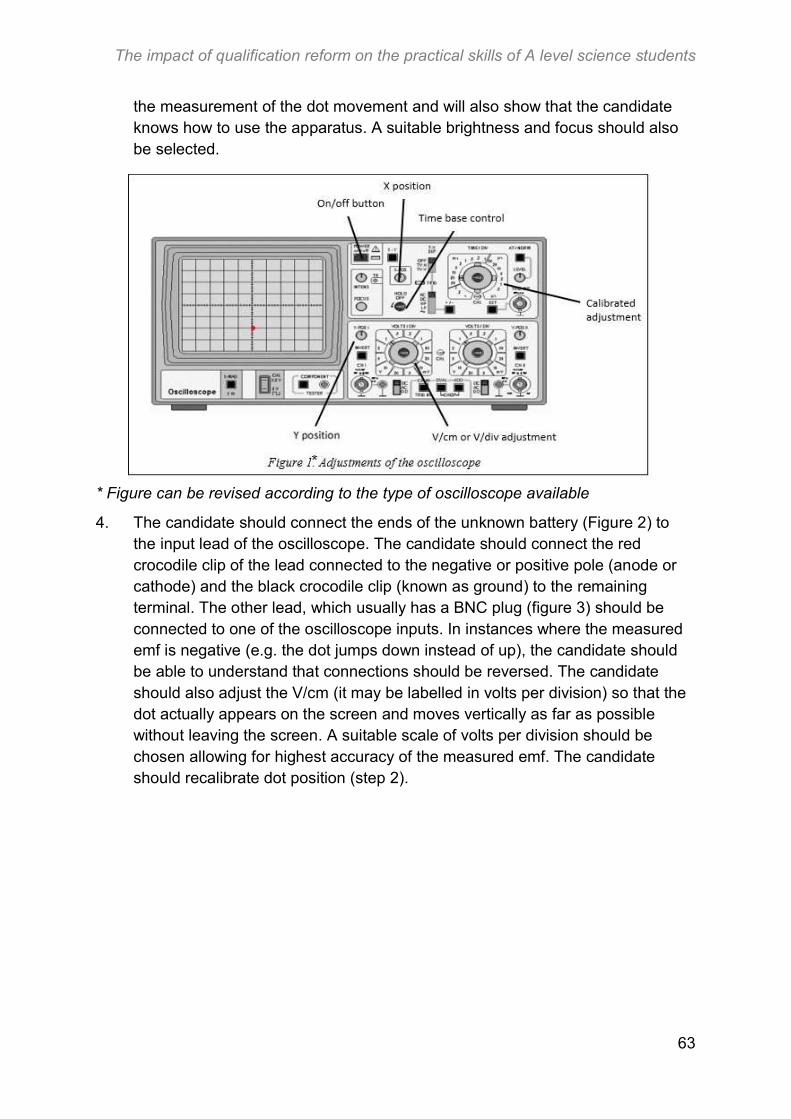
The impact of qualification reform on the practical skills of A level science students
63
the measurement of the dot movement and will also show that the candidate knows how to use the apparatus. A suitable brightness and focus should also be selected.
* Figure can be revised according to the type of oscilloscope available
4. The candidate should connect the ends of the unknown battery (Figure 2) to the input lead of the oscilloscope. The candidate should connect the red crocodile clip of the lead connected to the negative or positive pole (anode or cathode) and the black crocodile clip (known as ground) to the remaining terminal. The other lead, which usually has a BNC plug (figure 3) should be connected to one of the oscilloscope inputs. In instances where the measured emf is negative (e.g. the dot jumps down instead of up), the candidate should be able to understand that connections should be reversed. The candidate should also adjust the V/cm (it may be labelled in volts per division) so that the dot actually appears on the screen and moves vertically as far as possible without leaving the screen. A suitable scale of volts per division should be chosen allowing for highest accuracy of the measured emf. The candidate should recalibrate dot position (step 2).
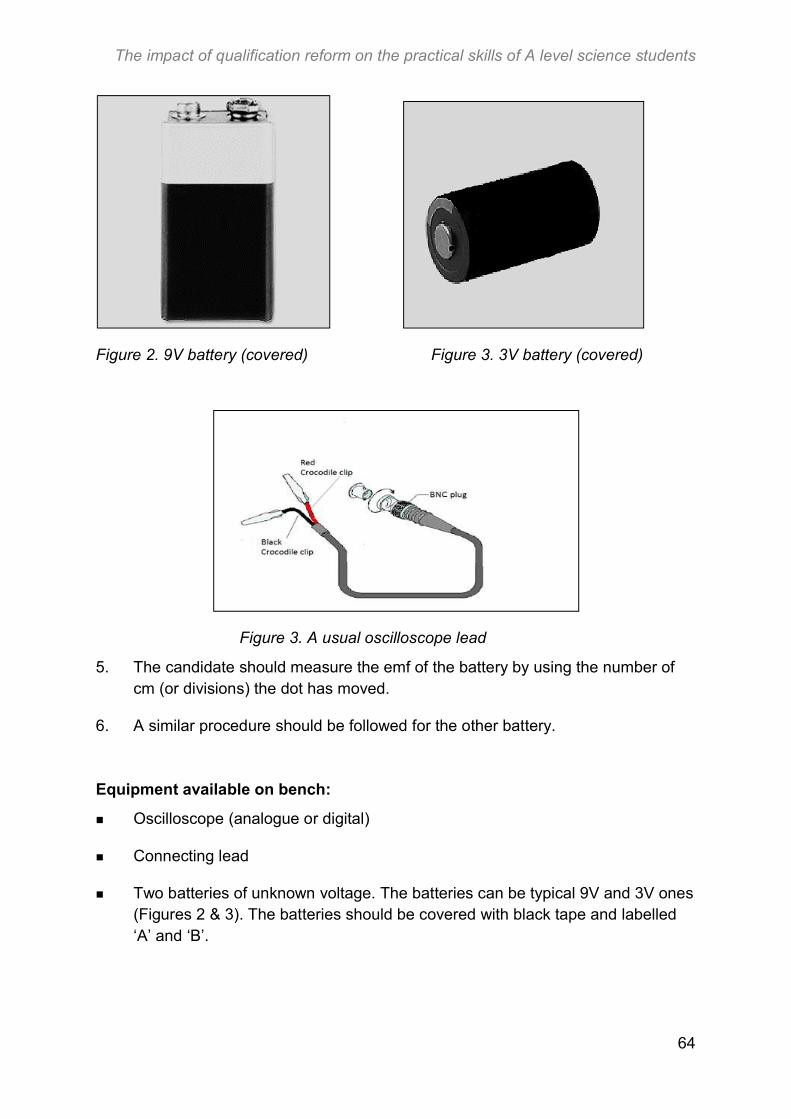
The impact of qualification reform on the practical skills of A level science students
64
Figure 2. 9V battery (covered) Figure 3. 3V battery (covered)
Figure 3. A usual oscilloscope lead
5. The candidate should measure the emf of the battery by using the number of cm (or divisions) the dot has moved.
6. A similar procedure should be followed for the other battery.
Equipment available on bench:
Oscilloscope (analogue or digital)
Connecting lead
Two batteries of unknown voltage. The batteries can be typical 9V and 3V ones (Figures 2 & 3). The batteries should be covered with black tape and labelled ‘A’ and ‘B’.
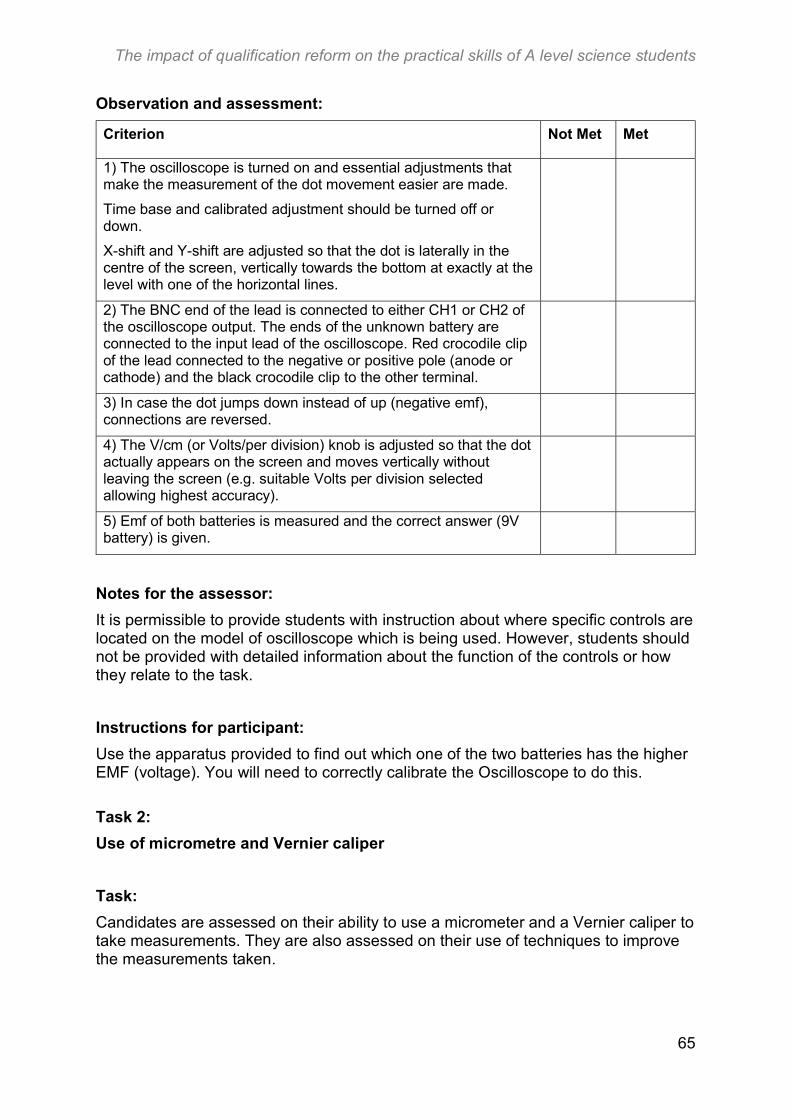
The impact of qualification reform on the practical skills of A level science students
65
Observation and assessment:
Criterion Not Met Met
1) The oscilloscope is turned on and essential adjustments that make the measurement of the dot movement easier are made.
Time base and calibrated adjustment should be turned off or down.
X-shift and Y-shift are adjusted so that the dot is laterally in the centre of the screen, vertically towards the bottom at exactly at the level with one of the horizontal lines.
2) The BNC end of the lead is connected to either CH1 or CH2 of the oscilloscope output. The ends of the unknown battery are connected to the input lead of the oscilloscope. Red crocodile clip of the lead connected to the negative or positive pole (anode or cathode) and the black crocodile clip to the other terminal.
3) In case the dot jumps down instead of up (negative emf), connections are reversed.
4) The V/cm (or Volts/per division) knob is adjusted so that the dot actually appears on the screen and moves vertically without leaving the screen (e.g. suitable Volts per division selected allowing highest accuracy).
5) Emf of both batteries is measured and the correct answer (9V battery) is given.
Notes for the assessor:
It is permissible to provide students with instruction about where specific controls are located on the model of oscilloscope which is being used. However, students should not be provided with detailed information about the function of the controls or how they relate to the task.
Instructions for participant:
Use the apparatus provided to find out which one of the two batteries has the higher EMF (voltage). You will need to correctly calibrate the Oscilloscope to do this.
Task 2:
Use of micrometre and Vernier caliper
Task:
Candidates are assessed on their ability to use a micrometer and a Vernier caliper to take measurements. They are also assessed on their use of techniques to improve the measurements taken.
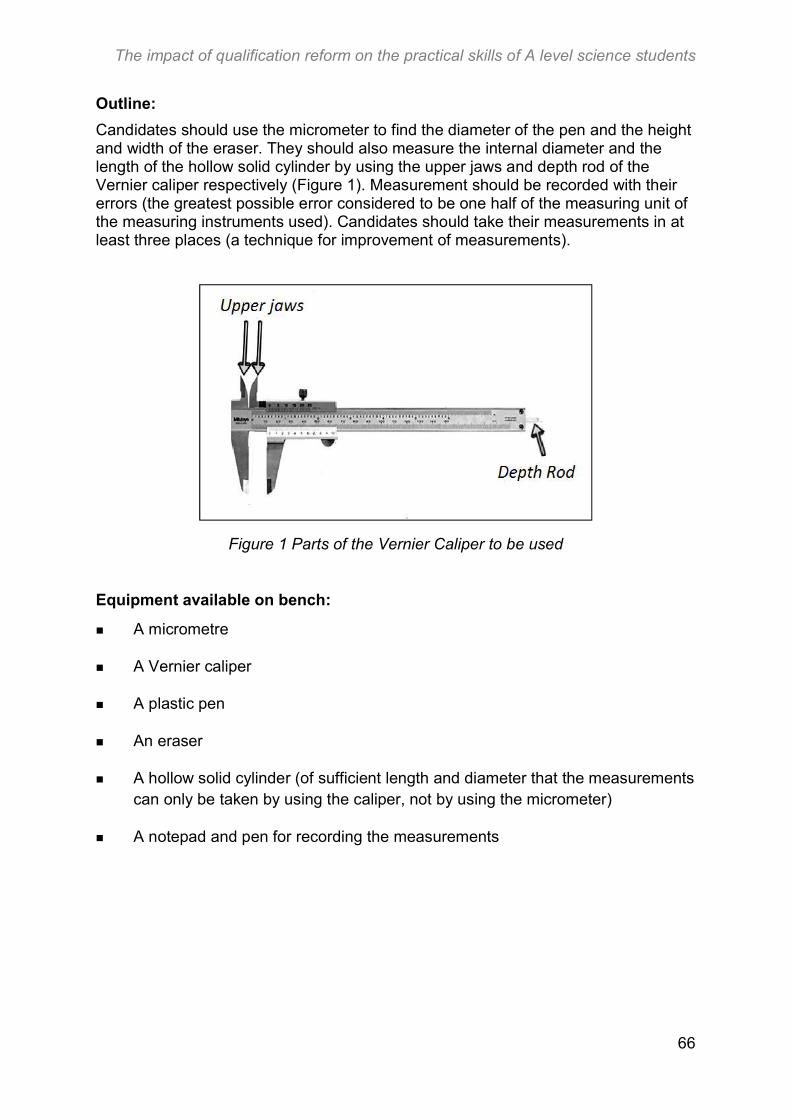
The impact of qualification reform on the practical skills of A level science students
66
Outline:
Candidates should use the micrometer to find the diameter of the pen and the height and width of the eraser. They should also measure the internal diameter and the length of the hollow solid cylinder by using the upper jaws and depth rod of the Vernier caliper respectively (Figure 1). Measurement should be recorded with their errors (the greatest possible error considered to be one half of the measuring unit of the measuring instruments used). Candidates should take their measurements in at least three places (a technique for improvement of measurements).
Figure 1 Parts of the Vernier Caliper to be used
Equipment available on bench:
A micrometre
A Vernier caliper
A plastic pen
An eraser
A hollow solid cylinder (of sufficient length and diameter that the measurements can only be taken by using the caliper, not by using the micrometer)
A notepad and pen for recording the measurements
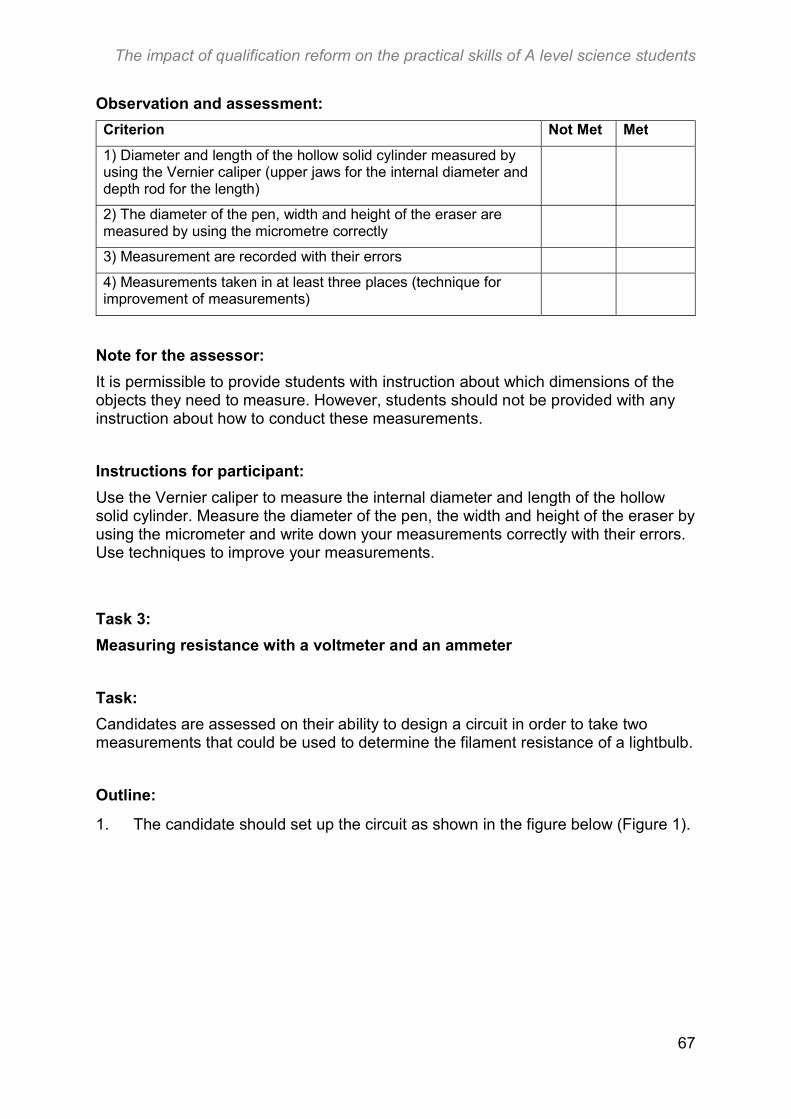
The impact of qualification reform on the practical skills of A level science students
67
Observation and assessment:
Criterion Not Met Met
1) Diameter and length of the hollow solid cylinder measured by using the Vernier caliper (upper jaws for the internal diameter and depth rod for the length)
2) The diameter of the pen, width and height of the eraser are measured by using the micrometre correctly
3) Measurement are recorded with their errors
4) Measurements taken in at least three places (technique for improvement of measurements)
Note for the assessor:
It is permissible to provide students with instruction about which dimensions of the objects they need to measure. However, students should not be provided with any instruction about how to conduct these measurements.
Instructions for participant:
Use the Vernier caliper to measure the internal diameter and length of the hollow solid cylinder. Measure the diameter of the pen, the width and height of the eraser by using the micrometer and write down your measurements correctly with their errors. Use techniques to improve your measurements.
Task 3:
Measuring resistance with a voltmeter and an ammeter
Task:
Candidates are assessed on their ability to design a circuit in order to take two measurements that could be used to determine the filament resistance of a lightbulb.
Outline:
1. The candidate should set up the circuit as shown in the figure below (Figure 1).
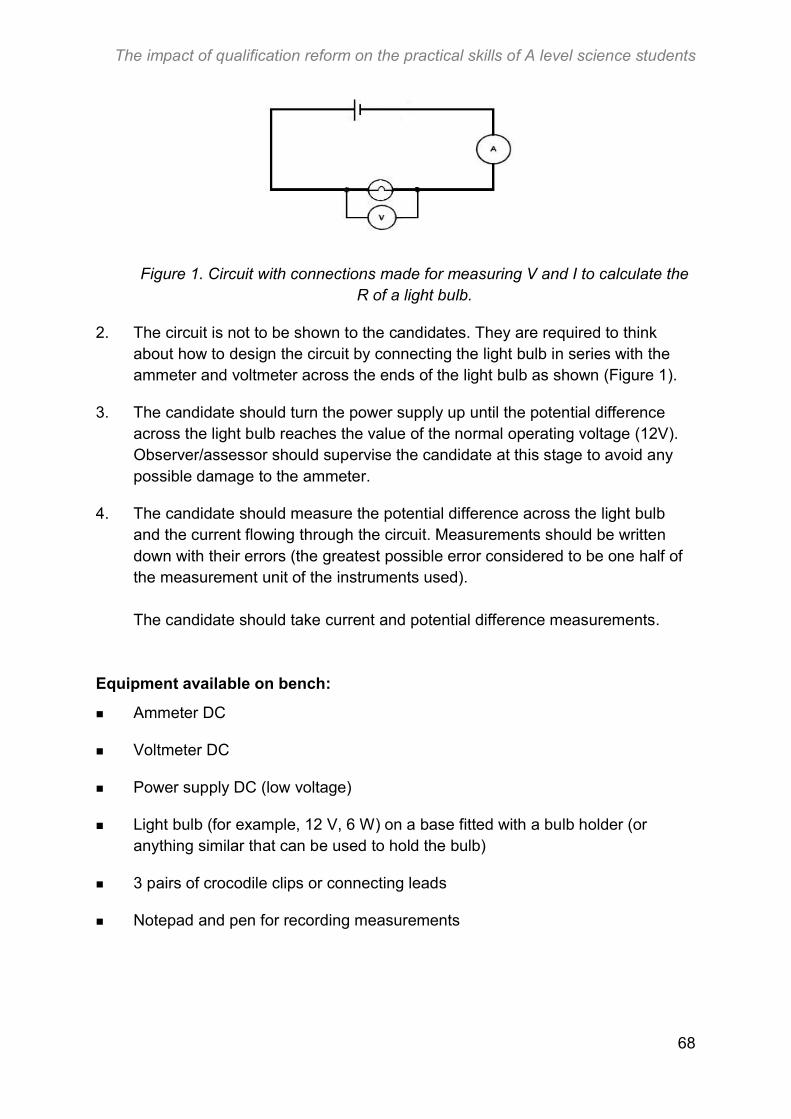
The impact of qualification reform on the practical skills of A level science students
68
Figure 1. Circuit with connections made for measuring V and I to calculate the R of a light bulb.
2. The circuit is not to be shown to the candidates. They are required to think about how to design the circuit by connecting the light bulb in series with the ammeter and voltmeter across the ends of the light bulb as shown (Figure 1).
3. The candidate should turn the power supply up until the potential difference across the light bulb reaches the value of the normal operating voltage (12V). Observer/assessor should supervise the candidate at this stage to avoid any possible damage to the ammeter.
4. The candidate should measure the potential difference across the light bulb and the current flowing through the circuit. Measurements should be written down with their errors (the greatest possible error considered to be one half of the measurement unit of the instruments used). The candidate should take current and potential difference measurements.
Equipment available on bench:
Ammeter DC
Voltmeter DC
Power supply DC (low voltage)
Light bulb (for example, 12 V, 6 W) on a base fitted with a bulb holder (or anything similar that can be used to hold the bulb)
3 pairs of crocodile clips or connecting leads
Notepad and pen for recording measurements
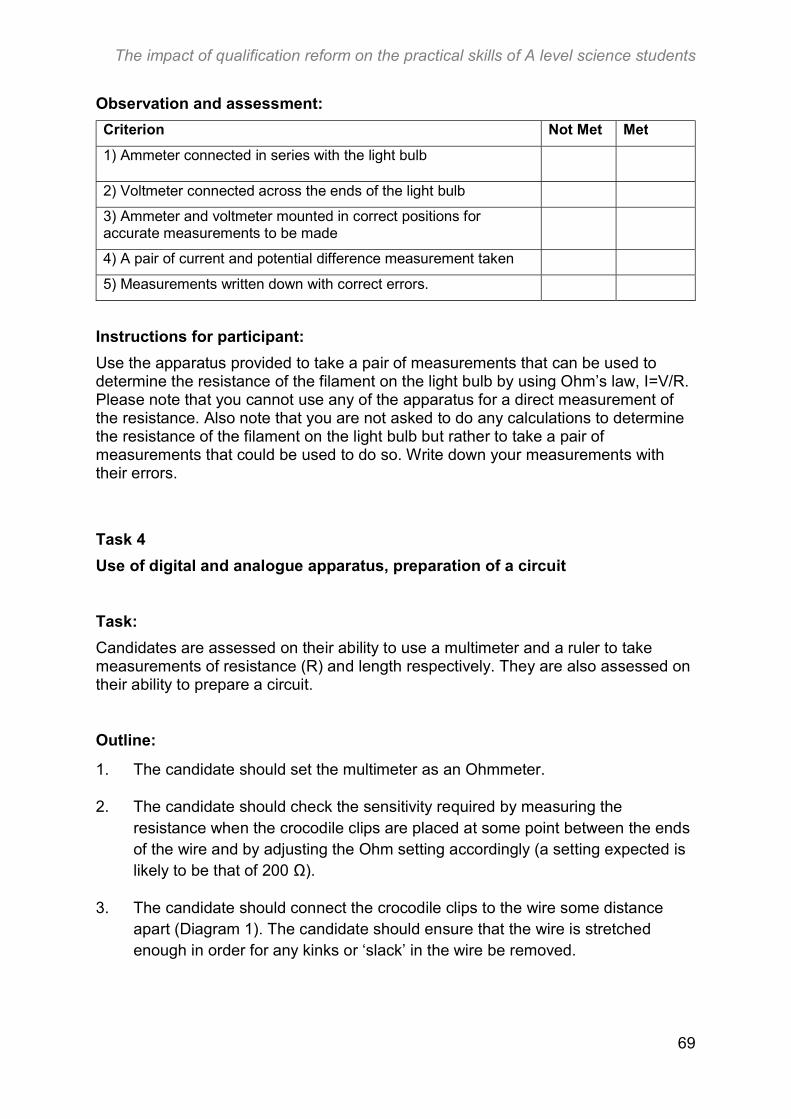
The impact of qualification reform on the practical skills of A level science students
69
Observation and assessment:
Criterion Not Met Met
1) Ammeter connected in series with the light bulb
2) Voltmeter connected across the ends of the light bulb
3) Ammeter and voltmeter mounted in correct positions for accurate measurements to be made
4) A pair of current and potential difference measurement taken
5) Measurements written down with correct errors.
Instructions for participant:
Use the apparatus provided to take a pair of measurements that can be used to determine the resistance of the filament on the light bulb by using Ohm’s law, I=V/R. Please note that you cannot use any of the apparatus for a direct measurement of the resistance. Also note that you are not asked to do any calculations to determine the resistance of the filament on the light bulb but rather to take a pair of measurements that could be used to do so. Write down your measurements with their errors.
Task 4
Use of digital and analogue apparatus, preparation of a circuit
Task:
Candidates are assessed on their ability to use a multimeter and a ruler to take measurements of resistance (R) and length respectively. They are also assessed on their ability to prepare a circuit.
Outline:
1. The candidate should set the multimeter as an Ohmmeter.
2. The candidate should check the sensitivity required by measuring the resistance when the crocodile clips are placed at some point between the ends of the wire and by adjusting the Ohm setting accordingly (a setting expected is likely to be that of 200 Ω).
3. The candidate should connect the crocodile clips to the wire some distance apart (Diagram 1). The candidate should ensure that the wire is stretched enough in order for any kinks or ‘slack’ in the wire be removed.
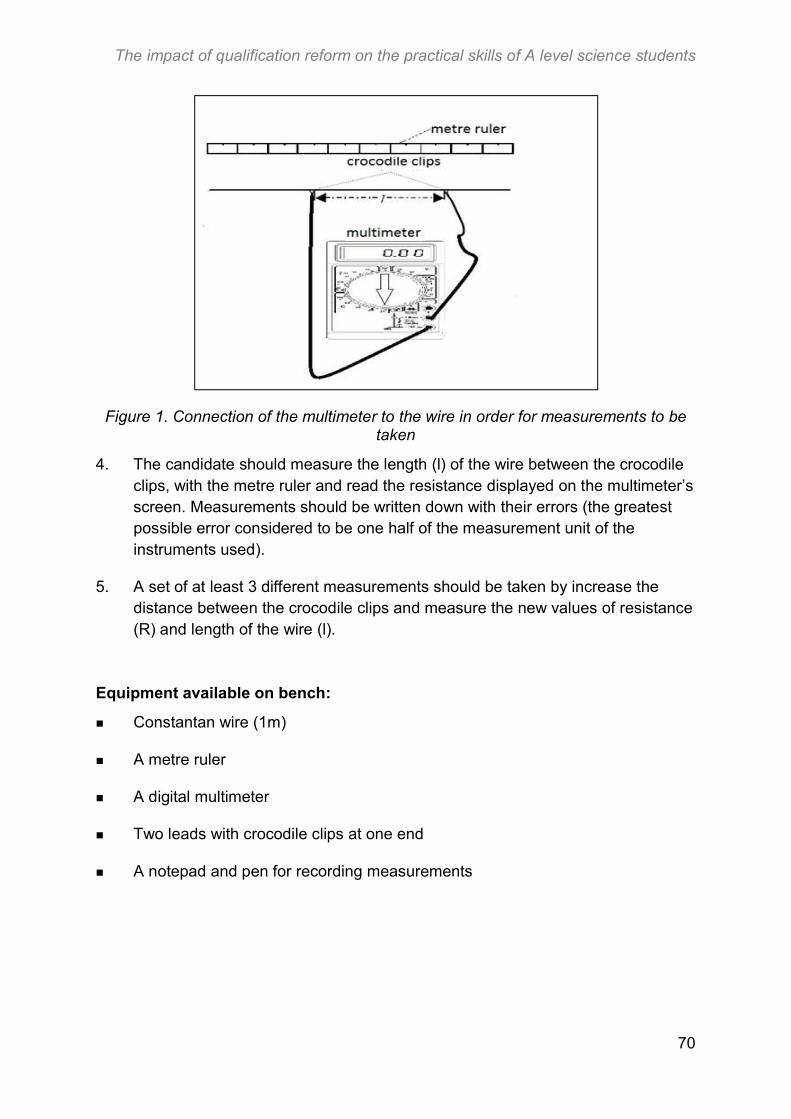
The impact of qualification reform on the practical skills of A level science students
70
Figure 1. Connection of the multimeter to the wire in order for measurements to be taken
4. The candidate should measure the length (l) of the wire between the crocodile clips, with the metre ruler and read the resistance displayed on the multimeter’s screen. Measurements should be written down with their errors (the greatest possible error considered to be one half of the measurement unit of the instruments used).
5. A set of at least 3 different measurements should be taken by increase the distance between the crocodile clips and measure the new values of resistance (R) and length of the wire (l).
Equipment available on bench:
Constantan wire (1m)
A metre ruler
A digital multimeter
Two leads with crocodile clips at one end
A notepad and pen for recording measurements
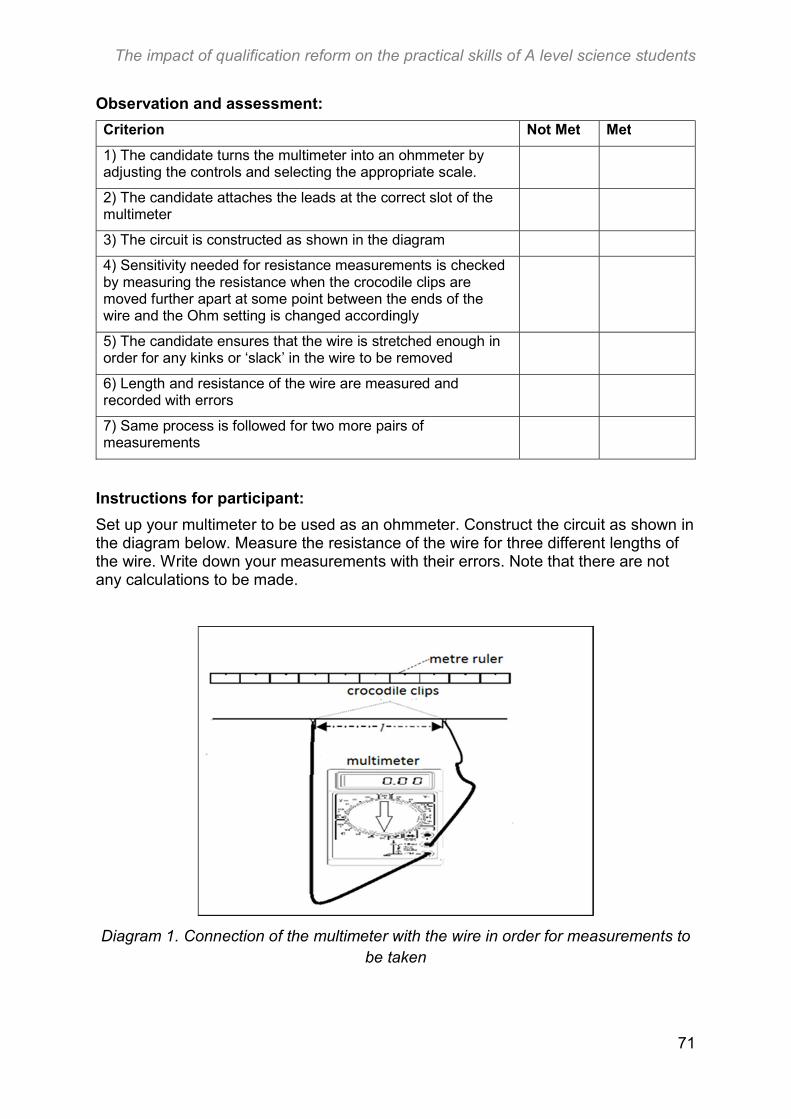
The impact of qualification reform on the practical skills of A level science students
71
Observation and assessment:
Criterion Not Met Met
1) The candidate turns the multimeter into an ohmmeter by adjusting the controls and selecting the appropriate scale.
2) The candidate attaches the leads at the correct slot of the multimeter
3) The circuit is constructed as shown in the diagram
4) Sensitivity needed for resistance measurements is checked by measuring the resistance when the crocodile clips are moved further apart at some point between the ends of the wire and the Ohm setting is changed accordingly
5) The candidate ensures that the wire is stretched enough in order for any kinks or ‘slack’ in the wire to be removed
6) Length and resistance of the wire are measured and recorded with errors
7) Same process is followed for two more pairs of measurements
Instructions for participant:
Set up your multimeter to be used as an ohmmeter. Construct the circuit as shown in the diagram below. Measure the resistance of the wire for three different lengths of the wire. Write down your measurements with their errors. Note that there are not any calculations to be made.
Diagram 1. Connection of the multimeter with the wire in order for measurements to be taken
The impact of qualification reform on the practical skills of A level science students
72
Task 5
Use of apparatus for timing and a metre ruler
Task:
Candidates are assessed on their ability to follow written procedures and use a stopwatch and a metre ruler to measure time and length respectively.
Outline:
1. The candidate is asked to follow the written procedures provided and set up the experiment.
2. After setting up the experiment the candidate is asked to pull the bob to one side by making an angle with the vertical line and to allow the bob to oscillate in one plane.
3. The candidate should measure the length of the string by using the metre ruler and the time taken to complete one oscillation by using the stopwatch. Measurements should be written down with their errors (the greatest possible error considered to be one half of the measurement unit of the instruments used). The candidate is asked to use techniques to improve the oscillation time measurement (at least 3 measurements of time should be taken for the same length).
4. The candidate is asked to repeat the experiment for three different lengths.
Equipment available on bench:
A length of string (80 cm)
Retort stand
Split cork
Ruler
Pendulum bob
A notepad and pen for recording measurements
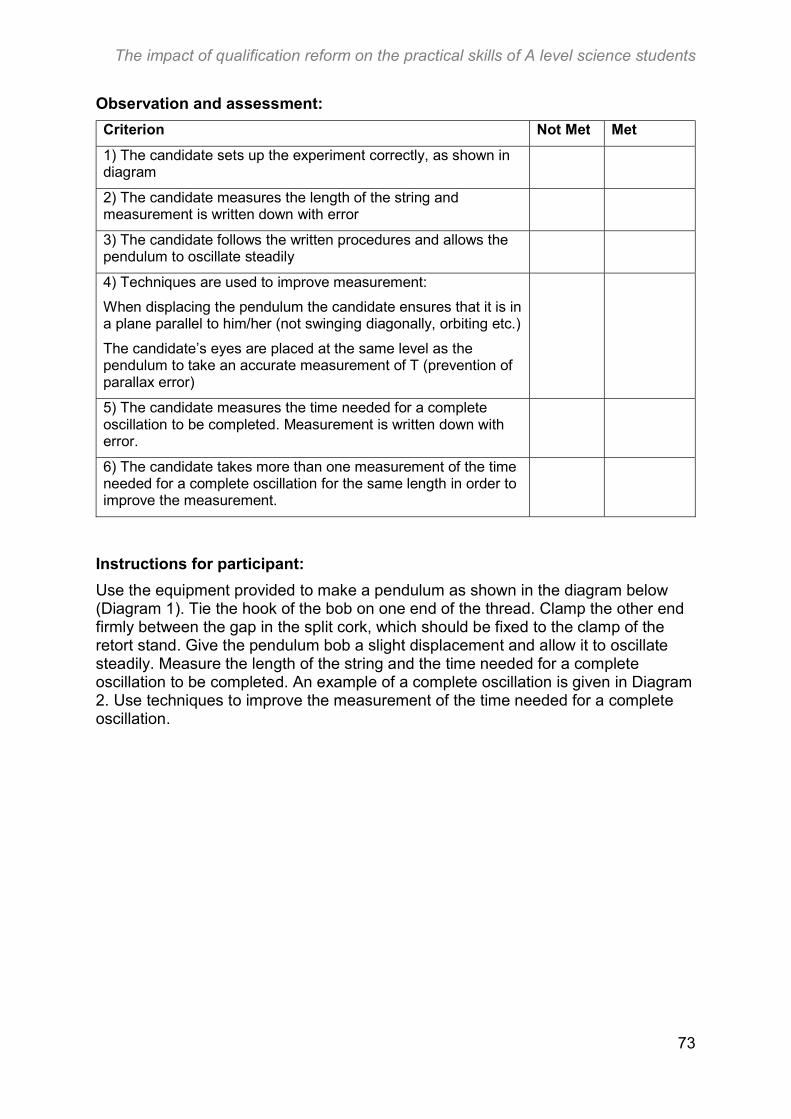
The impact of qualification reform on the practical skills of A level science students
73
Observation and assessment:
Criterion Not Met Met
1) The candidate sets up the experiment correctly, as shown in diagram
2) The candidate measures the length of the string and measurement is written down with error
3) The candidate follows the written procedures and allows the pendulum to oscillate steadily
4) Techniques are used to improve measurement:
When displacing the pendulum the candidate ensures that it is in a plane parallel to him/her (not swinging diagonally, orbiting etc.)
The candidate’s eyes are placed at the same level as the pendulum to take an accurate measurement of T (prevention of parallax error)
5) The candidate measures the time needed for a complete oscillation to be completed. Measurement is written down with error.
6) The candidate takes more than one measurement of the time needed for a complete oscillation for the same length in order to improve the measurement.
Instructions for participant:
Use the equipment provided to make a pendulum as shown in the diagram below (Diagram 1). Tie the hook of the bob on one end of the thread. Clamp the other end firmly between the gap in the split cork, which should be fixed to the clamp of the retort stand. Give the pendulum bob a slight displacement and allow it to oscillate steadily. Measure the length of the string and the time needed for a complete oscillation to be completed. An example of a complete oscillation is given in Diagram 2. Use techniques to improve the measurement of the time needed for a complete oscillation.
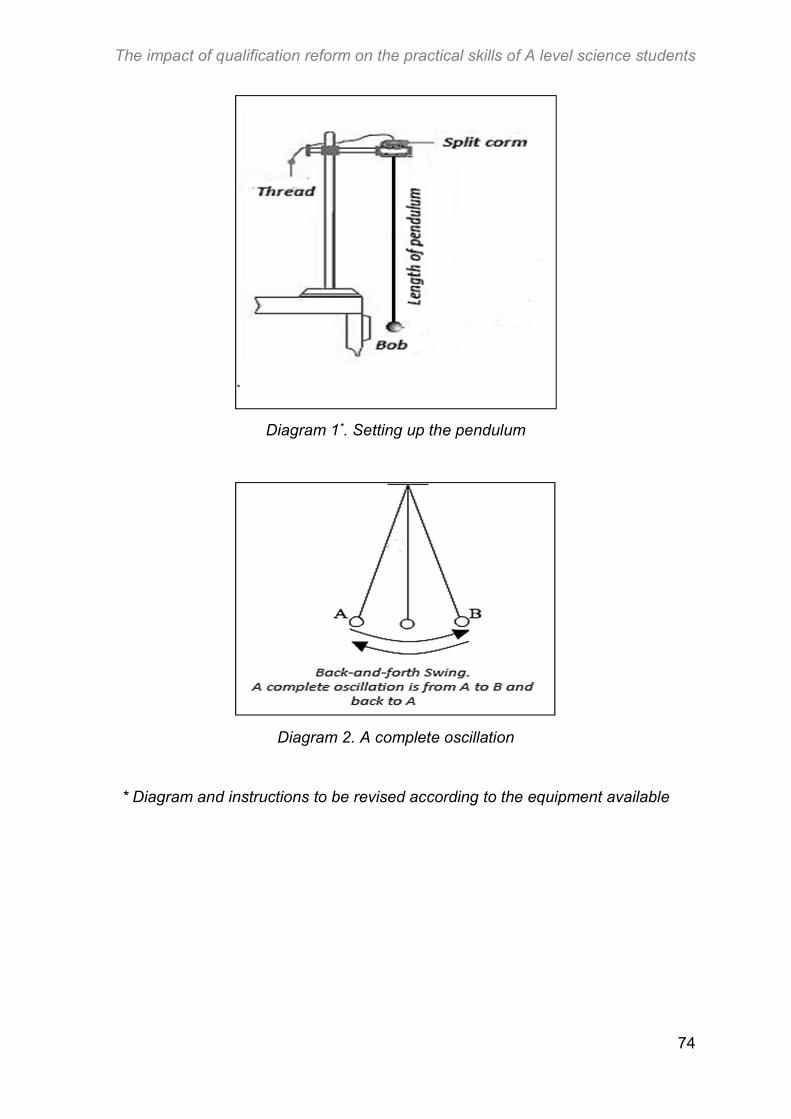
The impact of qualification reform on the practical skills of A level science students
74
Diagram 1*. Setting up the pendulum
Diagram 2. A complete oscillation
* Diagram and instructions to be revised according to the equipment available
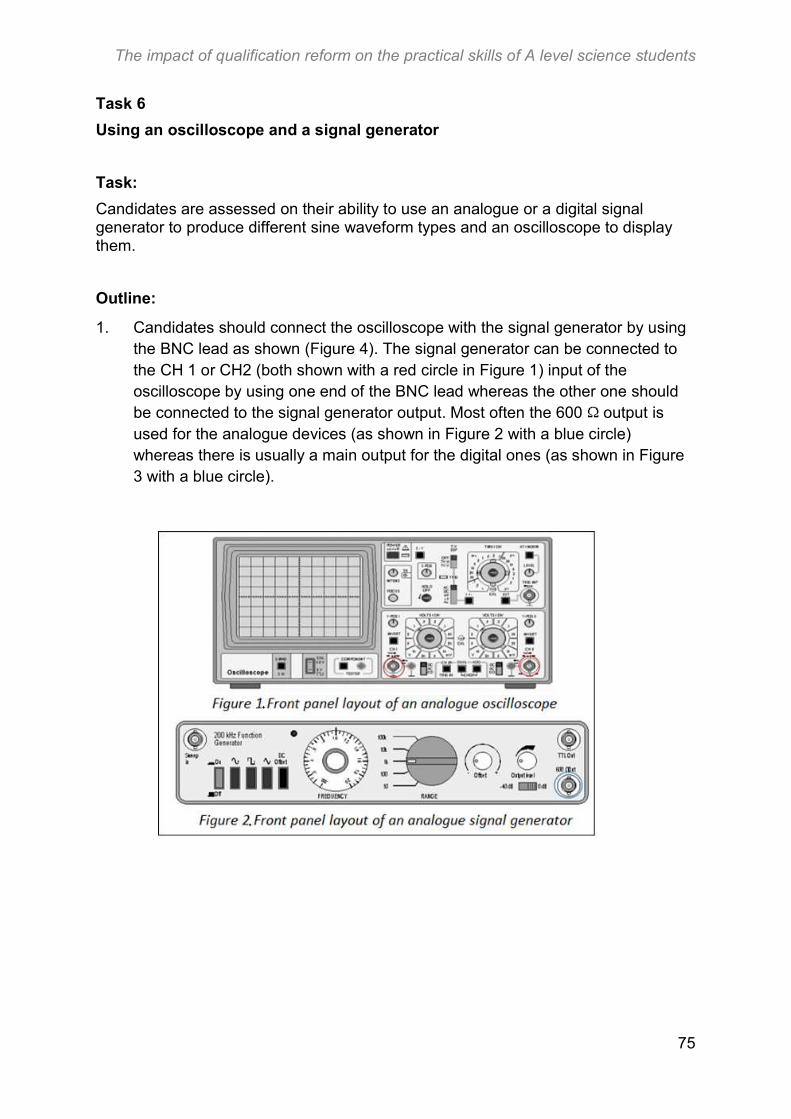
The impact of qualification reform on the practical skills of A level science students
75
Task 6
Using an oscilloscope and a signal generator
Task:
Candidates are assessed on their ability to use an analogue or a digital signal generator to produce different sine waveform types and an oscilloscope to display them.
Outline:
1. Candidates should connect the oscilloscope with the signal generator by using the BNC lead as shown (Figure 4). The signal generator can be connected to the CH 1 or CH2 (both shown with a red circle in Figure 1) input of the oscilloscope by using one end of the BNC lead whereas the other one should be connected to the signal generator output. Most often the 600 output is used for the analogue devices (as shown in Figure 2 with a blue circle) whereas there is usually a main output for the digital ones (as shown in Figure 3 with a blue circle).
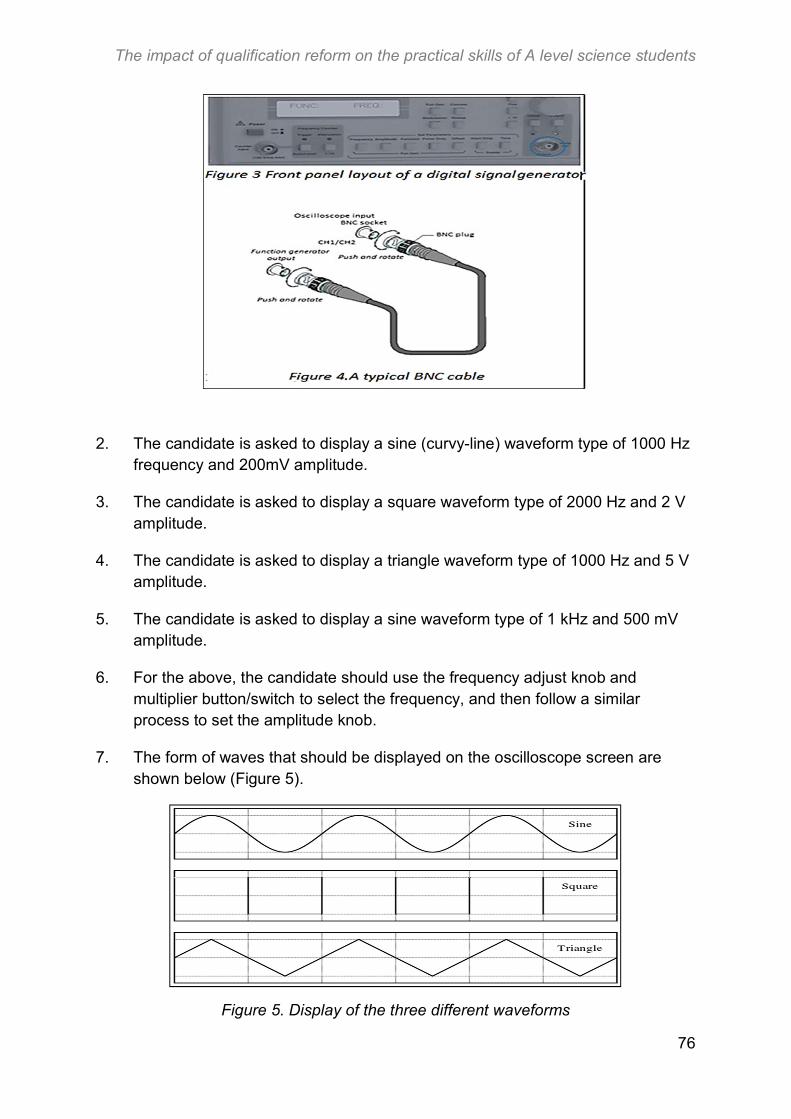
The impact of qualification reform on the practical skills of A level science students
76
2. The candidate is asked to display a sine (curvy-line) waveform type of 1000 Hz frequency and 200mV amplitude.
3. The candidate is asked to display a square waveform type of 2000 Hz and 2 V amplitude.
4. The candidate is asked to display a triangle waveform type of 1000 Hz and 5 V amplitude.
5. The candidate is asked to display a sine waveform type of 1 kHz and 500 mV amplitude.
6. For the above, the candidate should use the frequency adjust knob and multiplier button/switch to select the frequency, and then follow a similar process to set the amplitude knob.
7. The form of waves that should be displayed on the oscilloscope screen are shown below (Figure 5).
Figure 5. Display of the three different waveforms
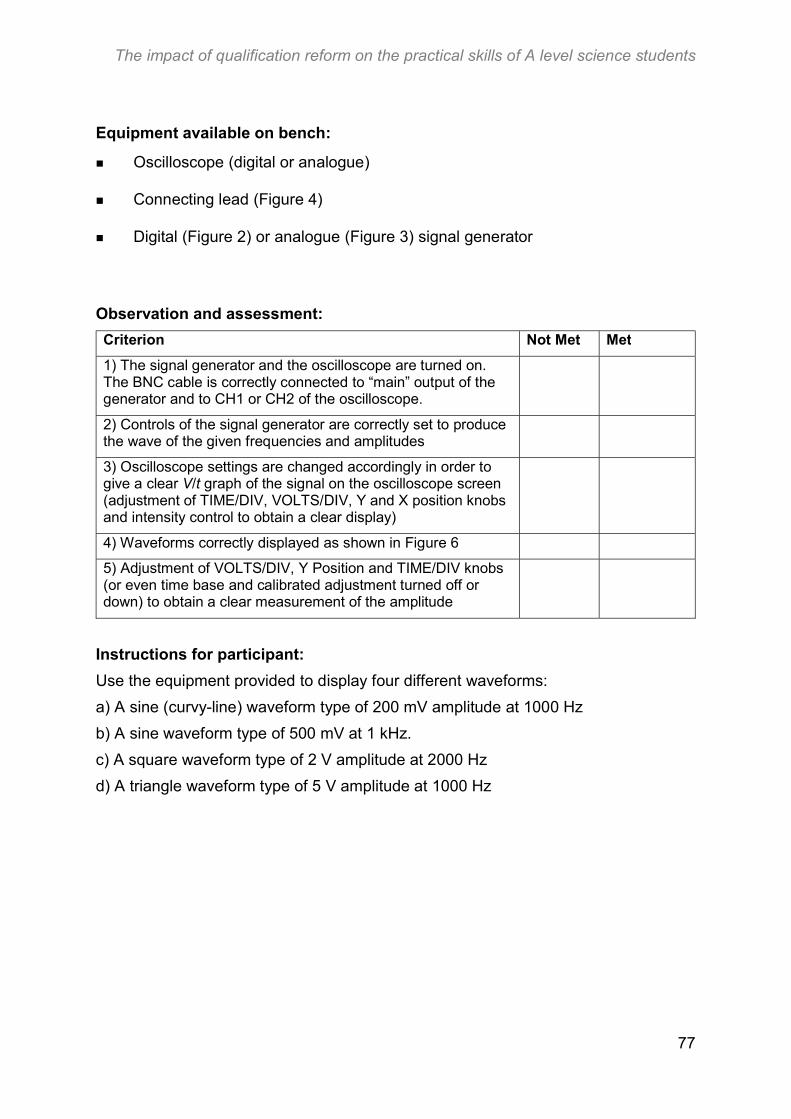
The impact of qualification reform on the practical skills of A level science students
77
Equipment available on bench:
Oscilloscope (digital or analogue)
Connecting lead (Figure 4)
Digital (Figure 2) or analogue (Figure 3) signal generator
Observation and assessment:
Criterion Not Met Met
1) The signal generator and the oscilloscope are turned on. The BNC cable is correctly connected to “main” output of the generator and to CH1 or CH2 of the oscilloscope.
2) Controls of the signal generator are correctly set to produce the wave of the given frequencies and amplitudes
3) Oscilloscope settings are changed accordingly in order to give a clear V/t graph of the signal on the oscilloscope screen (adjustment of TIME/DIV, VOLTS/DIV, Y and X position knobs and intensity control to obtain a clear display)
4) Waveforms correctly displayed as shown in Figure 6
5) Adjustment of VOLTS/DIV, Y Position and TIME/DIV knobs (or even time base and calibrated adjustment turned off or down) to obtain a clear measurement of the amplitude
Instructions for participant:
Use the equipment provided to display four different waveforms:
a) A sine (curvy-line) waveform type of 200 mV amplitude at 1000 Hz
b) A sine waveform type of 500 mV at 1 kHz.
c) A square waveform type of 2 V amplitude at 2000 Hz
d) A triangle waveform type of 5 V amplitude at 1000 Hz
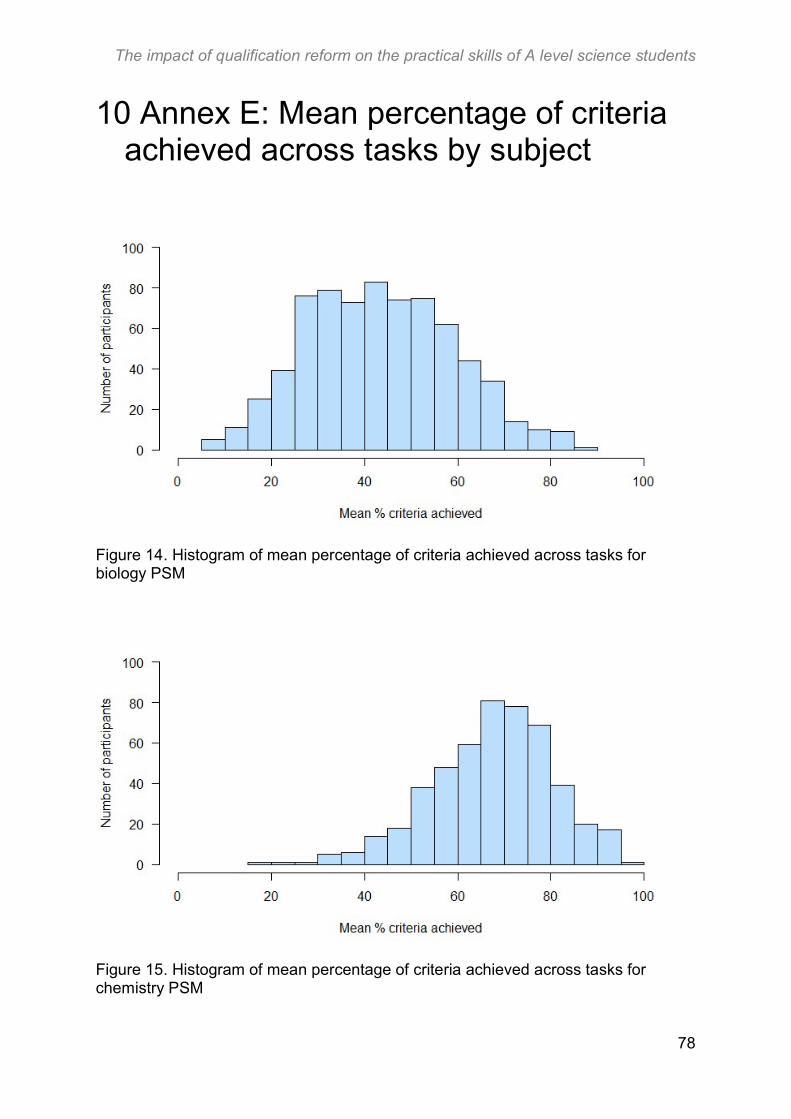
The impact of qualification reform on the practical skills of A level science students
78
10 Annex E: Mean percentage of criteria achieved across tasks by subject
Figure 14. Histogram of mean percentage of criteria achieved across tasks for biology PSM
Figure 15. Histogram of mean percentage of criteria achieved across tasks for chemistry PSM
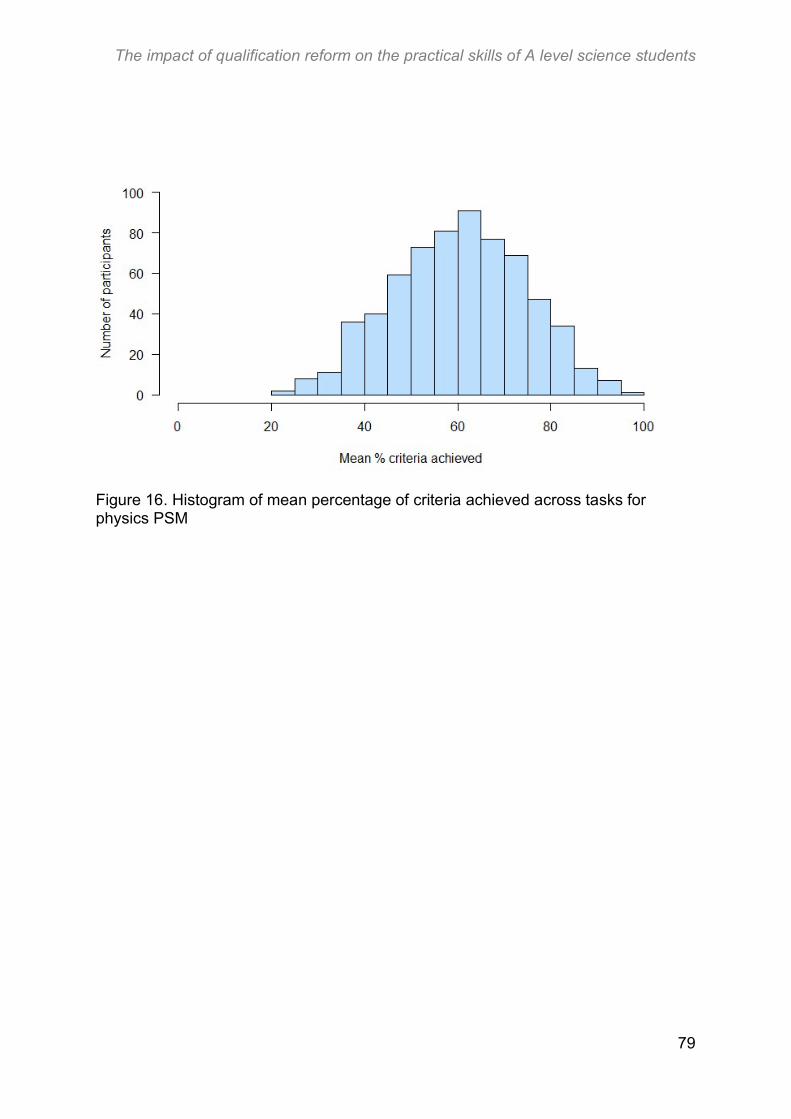
The impact of qualification reform on the practical skills of A level science students
79
Figure 16. Histogram of mean percentage of criteria achieved across tasks for physics PSM
80
© Crown Copyright 2019
This publication is licensed under the terms of the Open Government Licence v3.0 except where otherwise stated.
To view this licence, visit
or write to
Published by:
Earlsdon Park 53-55 Butts RoadCoventryCV1 3BH
0300 303 3344 [email protected] www.gov.uk/ofqual
www.nationalarchives.gov.uk/doc/open-government-licence/
Information Policy Team, The National Archives, Kew, London TW9 4DU
April 2019 Ofqual/19/6498

![4th sem CSE(29.07.2019)makautexam.net/aicte_details/Syllabus/CSE/sem4.pdf0DXODQD $EXO .DODP $]DG 8QLYHUVLW\ RI 7HFKQRORJ\ :HVW %HQJDO )RUPHUO\ :HVW %HQJDO 8QLYHUVLW\ RI 7HFKQRORJ\](https://static.fdocuments.us/doc/165x107/5e5423ff15b09c3aa8751e4a/4th-sem-cse29072019-0dxodqd-exo-dodp-dg-8qlyhuvlw-ri-7hfkqrorj-hvw-hqjdo.jpg)

![MAKAUT, W.B.makautexam.net/aicte_details/Syllabus/CSE/sem7.pdf · 0dxodqd $exo .dodp $]dg 8qlyhuvlw\ ri 7hfkqrorj\ :hvw %hqjdo )ruphuo\ :hvw %hqjdo 8qlyhuvlw\ ri 7hfkqrorj\ 6\oodexv](https://static.fdocuments.us/doc/165x107/603fa61f24227e525e47fcb7/makaut-wb-0dxodqd-exo-dodp-dg-8qlyhuvlw-ri-7hfkqrorj-hvw-hqjdo-ruphuo.jpg)


![MOOCS for NON-AICTE list of NON-AICTE... · 2019-09-13 · 0dxodqd $exo .dodp $]dg 8qlyhuvlw\ ri 7hfkqrorj\ :hvw %hqjdo )ruphuo\ nqrzq dv :hvw %hqjdo 8qlyhuvlw\ ri 7hfkqrorj\ /lvw](https://static.fdocuments.us/doc/165x107/5fae5f5240b3c243db220b19/moocs-for-non-aicte-list-of-non-aicte-2019-09-13-0dxodqd-exo-dodp-dg.jpg)


