
7c. Children in Tamilnadu - SW-TNswtn.org/publications/7.c.Children_in_Tamilnadu.pdf · Tamilnadu...
25
Tamilnadu Social Development Report 2000 152 “The State shall,in particular,direct its policy towards securing: that children are given opportunities and facilities to develop in a healthy manner and in conditions of freedom and diginity and that childhood and youth are protected against exploitation and against moral and material abandonment.” - The Constitution of India Directive Principles of State Policy, Article 39 “A child means every human being below the age of 18 years unless,under the law applicable to the child,majority is attained earlier. In all actions concerning children, whether undertaken by public or private social welfare institutions,courts of law, administrative authorities or legislative bodies, the best interests of the child shall be a primary consideration. State Parties shall undertake to ensure the child such protection and care as is necessary for his or her well-being, taking into account the rights and duties of his or her parents,legal guardians, or other individuals legally responsible for him or her, and, to this end, shall take all appropriate legislative and administrative measures.” - Convention on the Rights of the Child
Transcript of 7c. Children in Tamilnadu - SW-TNswtn.org/publications/7.c.Children_in_Tamilnadu.pdf · Tamilnadu...

Tamilnadu Social Development Report 2000 152
“The State shall,in particular,direct its policy towardssecuring:
that children are given opportunities and facilities todevelop in a healthy manner and in conditions offreedom and diginity and that childhood and youthare protected against exploitation and against moraland material abandonment.”
- The Constitution of IndiaDirective Principles of State Policy, Article 39
“A child means every human being below the age of18 years unless,under the law applicable to thechild,majority is attained earlier.
In all actions concerning children, whether undertakenby public or private social welfare institutions,courtsof law, administrative authorities or legislative bodies,the best interests of the child shall be a primaryconsideration.
State Parties shall undertake to ensure the child suchprotection and care as is necessary for his or herwell-being, taking into account the rights and dutiesof his or her parents,legal guardians, or otherindividuals legally responsible for him or her, and, tothis end, shall take all appropriate legislative andadministrative measures.”
- Convention on the Rights of the Child
Tamilnadu Social Development Report 2000 153
7c. CHILDREN IN TAMILNADU
The general principles ofCRC are:
Non-Discrimination; Bestinterests of the Child;
Right to life, survival anddevelopment; and
Respect for the views ofthe Child
“ Absence of reliable data on Children in EspeciallyDifficult Circumstances (CEDC,) – working and bondedchildren, street children, abused children, abandonedand neglected children, child victims of prostitution andchild trafficking, children in conflict with the law, disabledchildren, and children affected by HIV / AIDS - partlydue to ambiguity on definitions - is a serious concern”
- UNICEF, September 2000
The 1959 UN Declaration on the Rights of the Child assertedthat humankind owed the child ‘the best it has to give’. Afterdecades of negotiations and serious work, the UN GeneralAssembly adopted the International Convention on theRights of the Child (CRC) in 1989.
CRC has been one of the most comprehensive instrumentsto ensure the full spectrum of rights of children. The 4 generalprinciples of CRC are Non-discrimination (Art 2), the bestinterests of the Child (Art 3), Right to life, survival anddevelopment (Art 6) and Respect for the views of the child(Art 6). And CRC has been near universally accepted andratified by the Governments across the globe. India accededto the Convention in 1992.
In 1993, SAARC countries laid down 5 goals for childwelfare by the year 2000: universal child immunization,universal primary education, child nutrition, provision of puredrinking water and adequate shelter. The countries also setthe year 2000 as the deadline to end child labour inhazardous conditions or in bonded labour, and 2010 as thedeadline for total eradication of child labour.
The very definition of “child” has been a point of controversy.While CRC has held 18 as the norm, Indian Constitutionhas it as 14. In this report, we have kept 14 years as thenorm, except where otherwise mentioned.
As per the 1991 Census, there were 1,98,81,540 children(0-14 years) in Tamilnadu, constituting 35% of the State’stotal population. The National Health Family Survey1992-93, had placed it at 31%, with just Goa (27%) andKerala (30%) below Tamilnadu.
Tamilnadu Social Development Report 2000 154
And, as per the Sample Registration System Report1996, the Tamilnadu child population had come down to29.2% of its total population, compared to the Indian averageof 36.4%. And, Tamilnadu was the second lowest, in thecountry, in terms of children as proportion of general population.Only Kerala had a lower proportion (27.8%).
LIFE & SURVIVAL
Under-5 mortality Rate (U5MR)
The reduction of U5MR has, over time, emerged as the mostaccepted measure of progress for children and accepted asan important index of development. Almost all governmentshave accepted, as a goal for the year 2000, a reduction ofU5MR to 70 or less per 1000 live births.
In 1871, Tamilnadu had an U5MR of 189. But in 1992-93,as per the National Family Health Survey, the rate hadsubstantially come down to 87, compared to the Indianaverage of 109. Tamilnadu held the 5th rank in India. In 1995,the rate had come down to 66.
Infant Mortality Rate (IMR)
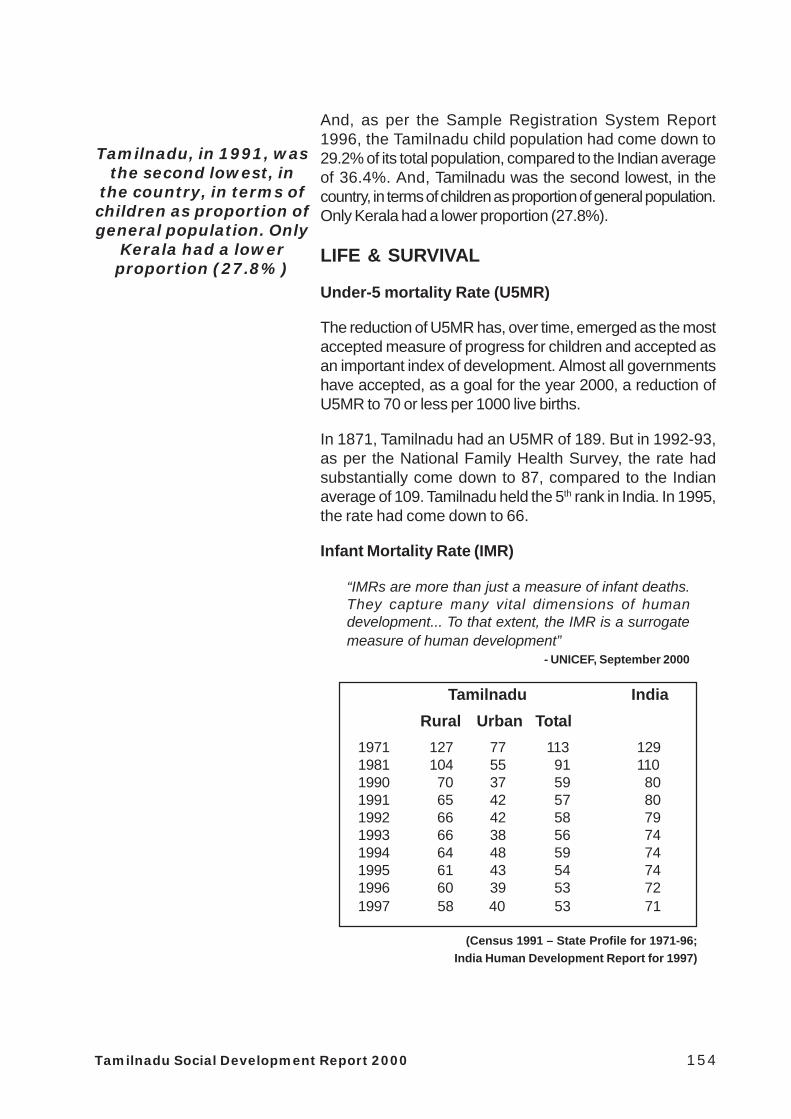
“IMRs are more than just a measure of infant deaths.They capture many vital dimensions of humandevelopment... To that extent, the IMR is a surrogatemeasure of human development”
- UNICEF, September 2000
Tamilnadu India Rural Urban Total
1971 127 77 113 1291981 104 55 91 1101990 70 37 59 801991 65 42 57 801992 66 42 58 791993 66 38 56 741994 64 48 59 741995 61 43 54 741996 60 39 53 721997 58 40 53 71
(Census 1991 – State Profile for 1971-96; India Human Development Report for 1997)
Tamilnadu, in 1991, wasthe second lowest, in
the country, in terms ofchildren as proportion ofgeneral population. Only
Kerala had a lowerproportion (27.8%)

Tamilnadu Social Development Report 2000 155
In 1995, as per the data of the office of Registrar General,Tamilnadu held the 4th rank in the country, behind Kerala(13), Maharastra (50) and Punjab (55), in success inreducing infant mortality. In 1998, IMR is supposed to be53, according to the SRS reports – the 3rd best in the country,behind Kerala and Maharastra.
As in various other indicators, district-wise as well as rural-urban differences in IMRs are indeed striking.
In 1995, as per DPH reports, with the State IMR at 54.8,Dharmapuri (98.1), Madurai (84.4), Salem (80.1),Ramanathapuram (78.1), Dindigul (65.8), Tiruchy (60.2),Perambalur (56.3) and Villupuram (55.5) districts had higherthan State average levels of IMR. Kanyakumari (18.4) hadthe lowest IMR in Tamilnadu.
The VES 1999 survey, again, found a wide range of IMRvariation from 14.3 in Chennai to 80.7 in Dharmapuri. Thedistricts of Dharmapuri, Salem, Theni and Perambalurcontributed maximally to the State’s pool of infant deaths.
As elsewhere, the rural rate keeps lagging behind the urbanrate, in terms of IMRs too.
“Though there is a decrease in infant mortality rate,there are vast disparities, between the urban and ruralsituation. It is 40 per 1,000 live births in the urban areasand 67 in the rural areas. Even in Madras, theincidence is 70% higher among the slum population.”
- Tamilnadu Peoples’ Manifesto, 1996
In 1996, as per DPH reports, State rural IMR stood at 54.8.The districts that showed more than average rural IMRs wereDharmapuri (98.10), Madurai (84.40), Salem (80.10),Ramanathapuram (78.10), Dindigul (65.80), Tiruvannamalai(60.20) and Villupuram (55.50).
There was a progressive stepping up in the efforts toimprove infant survival between 1971-91. Hence during the1970’s and 80’s, Tamilnadu witnessed striking decline inIMR. The annual rate of decline in IMR, which was 2.1%during 1971-81, went up to 4.2% during 1981-86 and evenfurther to 6.6% during 1986-91. But the decline has beenless significant during the 1990’s, and hardly any decline inthe mid and later 90s. The rate of decline in IMR was amere 1.4% during 1991-96.
During the 1970’s and80’s, Tamilnadu
witnessed strikingdecline in IMR. But thedecline has been lesssignificant during the1990’s, and hardly anydecline in the mid and
later 90s

Tamilnadu Social Development Report 2000 156
Actually during the period 1989-91 to 1994-96, the urban IMRin Tamilnadu showed a 2.9% increase from 40.7 to 41.9
The persistence, for almost a decade now, of levels of IMR(especially high female IMR levels), considerably higher thanwould be normally associated with the State’s low TFR andCBR levels, has raised serious concerns all over. It calls forserious policy changes.
“The National Family Health Survey (NFHS 1992)recorded only an annual rate of decline of one infantdeath per 1000 live births per year from 1977-81 to1987-91. Considering this trend, the goal of the Stateto reduce IMR to 30 by the year 2000 seems veryambitious… Without special efforts to tackle the variouscauses for infant mortality, the goals may remainunreached”
- UNICEF, “Profile of Districts in Tamilnadu”
The yet unsolved issues of very high neo-natal and earlyneo-natal mortality rates have been at the root of theproblem. In 1996, the proportions of neo-natal and earlyneo-natal mortality rates to IMR were as high as 73.9% and59.5% respectively.
And in terms of States with high percentages of neo-nataldeath rates, Tamilnadu was the 3rd worst in the country, withonly Karnataka (74.5%) and Kerala (75.1%) behind; in termsof early neo-natal death rates, it was the 2nd worst, with onlyKarnataka (62.4%) below it!
Data from VES 1999 too confirm the high share of earlyneonatal deaths in total infant deaths in Tamilnadu.
“Though there is a positive trend in reduction of IMR,neonatal care is not reaching the rural and urban childto reduce the neonatal component of IMR. Maternalcare during and before pregnancy is the need of thehour, if we have to reduce the IMR”
- “50 years”, 1998
Malnutrition & Morbidity
Malnutrition has been a major problem in India and inTamilnadu too. Persistence of malnutrition, in general,among all segments of the population (correlated with socio-economic status), and in particular, child-, adolescent girl-and maternal-malnutrition has been identified as a seriousconcern by the State Planning Commission.
In terms of ths Stateswith high
percentages of neo-natal death rates,
Tamilnadu is the thirdworst in the country

Tamilnadu Social Development Report 2000 157
As the UNICEF “Profile of Districts in Tamilnadu”mentions, the data available from different sources onthe nutritional status of Tamilnadu Children is confusing,in spite of the wide coverage through ICDS and TINP.
The National Family Health Survey for Tamilnadu(1992-93) reported 47% of all children below 4 years asof underweight and 13% as severely malnourished. TheNational Nutrition Monitoring Bureau Reports, again,indicate high levels of mild malnutrition in Tamilnadu.UNICEF in September 2000 said that 48% of childrenunder 4 are underweight. Independent studies haveplaced it as high as 50%. Hence the lower rates of severeand moderate malnutrition, given by ICDS and TINPprogrammes, surely underestimated the problem.
And there have been very sharp differences at thedistricts and blocks level.
“TINP Monitoring data shows that there is a large inter-district variations in the incidence of severe malnutritionranging from 0.1% to 4.0% and moderate malnutritionfrom 5.4% to 28.2%. TINP I Districts show 1.5% severemalnutrition and less than 15% moderate malnutrition,while TINP II Districts report higher percentage of bothsevere malnutrition and moderate malnutrition with theexception of Coimbatore and Kanniyakumari Districts.There is also variation among Blocks in the level ofmalnutrition, some blocks reporting less than 10% ofmoderate and severe malnutrition put together whilesome blocks as high as 75%”
- Ninth Five Year Plan Tamilnadu : 1997-2002
In terms of child immunization services, Tamilnadu hasshown great progress. The 1995 Multi Indicator Survey(MIS) has recorded over 90% coverage for BCG and TT2;above 80% for DPT and OPV; but only around 60% formeasles. The 1992 National Family Health Survey toorecorded high vaccination rates, even higher thanrevealed by the MIS. Overall Tamilnadu held, as per theIndia Human Development Report, a 82.8% record inimmunization services compared to the national averageof 48.5%.
The NationalFamily Health Survey
for Tamilnadu reported47% of all childrenbelow 4 years as of
underweight and 13% asseverely
malnourished.The National Nutrition
Monitoring BureauReports, again,
indicate high levelsof mild malnutrition
in Tamilnadu

Tamilnadu Social Development Report 2000 158
But there are areas of serious concern, as revealed by thefollowing observation:
“In spite of high coverage for immunization, theachievements in reduction of vaccine preventablediseases is short of the targets. While only 16 casesof NNT have been reported, only 13 districts remainfree of NNT. 130 cases of polio have been reportedduring 1995 and this is a decline from 420 casesreported in 1991, though the target was to achieve poliofree status by 1995. Trend in reduction of measlescases is far from satisfactory with 3080 cases havingbeen reported in 1995 as against 4873 in 1991”
- UNICEF, “Profile of Districts in Tamilnadu”
The India Human Development Report found during the yearof study, 62% of children in rural Tamilnadu had diarrhea,compared to the national average of 59.5%. As MISrevealed, ORT use rate is unsatisfactory in Tamilnadu – only32.8% and continued feeding rate during diarrhea isreported to be 23.1%.
Child Care (Nutrition) Services
Starting from the school midday meal scheme, way back in1956, Tamilnadu has had a long history of providingorganized child care services with an emphasis on nutritionto children outside the home under institutionalized care.Tamilnadu Government has an extensive network of nutritionprogrammes and they have been much acclaimed.
“In terms of impact on women and children, nutritionprogrammes which have both short- and long-termbenefits are very important. The Tamilnadu IntegratedNutrition project (TINP) is a successful example inIndia.””
- India Development Report 1999-2000
Over the years, the many nutrition programmes of the StateGovernment have been reorganized around the 3 majorprogrammes: The Integrated Child Development ServicesScheme (ICDS), The Tamilnadu Integrated Nutrition Project(TINP) and The Chief Minister’s Nutrition Meal Programme(NMP).
62% of childrenin rural Tamilnadu
had diarrhea,compared
to the nationalaverageof 59.5%

Tamilnadu Social Development Report 2000 159
The ICDS was originally introduced in Tamilnadu, in 1975-76,in 3 blocks, intended for children aged 0-6 years and for poorpregnant and lactating women. The programme was visualisedas a package of 6 services: supplementary nutrition,pre-school, immunisation, referral and health care for childrenand nutrition and health education for the community. Todaythe ICDS has become a State level child care grid.
The TINP was launched in 1981 in a few districts. TINP IIwas launched in 1991.
The NMP was launched in 1982. And today, the noon mealscheme has about 29,282 Child Welfare Centres, 37,480Rural School Centres and 1978 urban Centres.
And now, with the World Bank-assisted TINP-I and TINP-IIprojects, the entire rural area of Tamilnadu is being coveredby either the TINP or ICDS programmes.
As of 31.3.2000, there were 113 projects under generalICDS and a further 318 under the World Bank-ICDS IIIproject. 10482 anganwadis were functioning undergeneral ICDS and a further 19,500 anganwadis underthe World Bank ICDS III (erstwhile TINP projects).
There have been studies to show that the ICDS / TINPareas have a better record with regard to malnutrition,infant mortality rate, pre-school education etc.
Infrastructural problems have plagued the ICDS Centresconstantly. Out of the 10,459 centres in General ICDS,9,945 are said to be functioning in buildings and 537without buildings. Out of the 19500 centres in WB ICDSIII project, 15,139 are in public buildings and 4361 inprivate buildings.
A recent official study identified certain buildings as ‘unfitfor living’ and ‘threatening the life of children’. Of a totalof 1034 ICDS centres, official statistics have identifiedaround 135 buildings (77-corporation, 17-slum clearanceboard, 40-MUDP and 2 others) as requiring ‘immediaterepairs’.
Several nutrition centres function in roofless, doorless,windowless structures, without facilities for electricity,water or sanitation. Problems arose because 70% of theICDS centres functioned in Corporation, TN Slum Boardand the defunct Madras Urban Development Project
Studies have shown that theICDS/TINP areas have a
better record with regard tomalnutrition, IMR, pre-
school education etc. Butinfrastructural problemshave plagued the ICDS
centres constantly

Tamilnadu Social Development Report 2000 160
(MUDP) buildings. Rent has to be paid to the respectiveauthorities and repairs could therefore be carried out onlyby these agencies. The study also acknowledged regulartheft of moveable property and stores from the centresand the use of anganwadi premises for anti-socialactivities. (Hindu 28 March 2000).
More than even infrastructures, the limitations placed onthose responsible for the anganvadis have turned them intoroutine workers. One of the weakest points in the existingprogrammes is inadequate worker-child ratio. Forinspectors too, mundane office duties like keeping accountsetc take precedence over quality pre-school education,which remains very routine and bereft of any creativity. Thethemes around which the education takes place are oftenvery rigid and have not been revised for more than a decade.New Strategies in the form of “Joy of Learning – PreschoolEducation” and the UNICEF-assisted “ManagementDevelopment Programme” are claimed to answer some ofthe above long-standing lacunae.
The poor sustainability of these programmes is another majorconcern, given the fact that most of the schemes areimplemented through loan assistance from World bank andother international organizations, at a time when debt servicingis becoming a major burden and structural adjustment policyis proving to be detrimental to women and children…
Again, the community usually perceives the anganwadicentres merely as feeding centres for children. Hencecommunity participation has not taken deep roots in theactivities of ICDS. Constant monitoring by a consciousparent community is absent, resulting in a lack of effort inmoving towards community involvement in service delivery,such as in food preparation or distribution.
“An analysis of the strengths and weaknesses of thecurrent strategies and the challenges and opportunitiesfor the State indicate that effective interventions forchild development should address the critical area ofempowering the families and local communities to carefor their children….. They need access to and controlof resources that can prevent malnutrition. Thus theprocess of involving families and communitiesbecomes important for sustainable interventions”.
- Ninth Five Year Plan Tamilnadu : 1997-2002
Limitations placed onthose in charged of the
anganwadis haveturned them into into
routine workers, bereftof any creativity
The poor sustainabilityof these programmes is
another majorconcern

Tamilnadu Social Development Report 2000 161
CHILD LABOUR
“The incidence of child labour was found to be relativelyhigh in the rural areas of Andhra Pradesh, Karnataka,Maharastra, Tamilnadu and Punjab….”
- India Human Development Report, 1999
Estimates of child labour in Tamilnadu, as elsewhere, havebeen difficult to compile, given the highly unorganized,informal and unregulated nature of the economy and thelabour market.
The State government has consistently maintained that thereare about 10,000 child labourers in Tamilnadu. Based on theTamilnadu Survey on Child labour in hazardous and non-hazardous industries, Tamilnadu Government had submittedto the Supreme Court that there were 25,431 child workers inTamilnadu. These are obviously ridiculously low figures. Nowonder the Supreme Court demanded a resurvey!
Even the report of an official of the Tamilnadu Social WelfareBoard in September 1999, putting the number of childlaborers in Tamilnadu at 11.5 lakhs, is an understatementin our view.
Census figures too are not of much help. As shown clearlyby independent studies, Census data regarding child labourhas serious limitations, as there is a vast unorganised,informal and unregulated sector, often not accounted for ormuch underestimated in official labour statistics, includingthe Census.
The 1981 Census calculated that there were 9,75,055working children (871,313 main workers and 103,742marginal workers) below the age of 15 in Tamilnadu. Thisaccounts for 5.88% of all the children in Tamilnadu below15 years of age and for about 5% of the total work force inTamilnadu.
But even within the Census 1981, according to the Series20 (Tamilnadu, Social and Cultural tables), about 40 lakhschildren in Tamilnadu in the age group 5-14 (15,58,031 boysand 24,08,387 girls) were recorded as neither in schoolnor in the workforce. They form about 35% of the totalchildren in that age group (26% of boys and 42% of girls).

Tamilnadu Social Development Report 2000 162
It may be assumed that most of these children were alreadypart of the informal sector work force without being reportedin the official statistics.
National Sample Survey (1986) indicated that 1.6%children in the age group 5-9 and 20% children in the agegroup 10-14 in Tamilnadu were working. This is much higherthan the figures reported in the 1981 census data.
The 1991 Census categorized 5.78 lakhs children (age5-14) as child workers. NSS (round 43) calculated that therewere 11 lakhs child labourers in Tamilnadu.
But, based on the estimate of child population (ages 5-14)in Sample Registration System (Fertility and MortalityIndicators – 1991) and gross enrollment data (1991) forchildren provided by the Education department of Tamilnadu,it has been estimated that 31,83,903 children (ages 5-14)were out of school during 1991 and most of these childrenmust have already been in the workforce.
Calculations based on enrolment data of the Departmentof School education show that nearly 28 lakhs children inthe 5-14 age group were out of school in 1996-97.
Thus it becomes clear that anything between 20-30 lakhschildren (age 5-14) in Tamilnadu are being forcefully deniedtheir childhood and made to work for their own and theirfamilies’ livelihood.
And, among the children in the 12-14 years bracket, theproblem of child labour is even more acute in all the districts.
Variation Across Sectors
Child labour in Tamilnadu exists in almost all sectors,primary, secondary and tertiary. It is much more a ruralthan urban phenomenon and is found mostly in theinformal and unorganised, but also to some extent informal / organised industries.
It becomes clearthat anything
between20-30 lakhs children
(age 5-14) inTamilnadu
are being forcefullydenied their childhood
and made to workfor their own and
their families’livelihood

Tamilnadu Social Development Report 2000 163
“Approximately 90% of the working children are inrural areas and employed in agricultural labour,livestock, forestry and fisheries. In urban areas,manufacturing, servicing and repairs account for8.64% of child labour. Of this only 0.8% of childlabour is in factories. The unorganized and informalsectors both in urban and rural areas account foralmost all the child labour force”
- Arunodhaya Study (1999)
Agriculture
Agriculture accounts for the largest section of child labour.As per the 1981 census, 20% of the total child labour forcewas reported as cultivators and about 48% as agriculturallabourers. The remaining 32% was reported to be workingin the non-agricultural sector.
Number-wise, there were 4,16,390 children (2,06,238 boysand 2,10152 girls) reported to be working as agriculturallabourers and 45,691 children (31,188 boys and 14,503 girls)reported to be working in livestock tending and forest work.
Child labourers in agriculture are involved in weeding,harvesting, in tending cattle, gathering firewood and otherworks related to agriculture. Children of cultivatinghouseholds do this as unpaid, and mainly during peakagricultural seasons, resulting high rates of schooldrop-outs in the season and permanently.
Manufacture
Most of the child labour in the manufacturing sector arefound in the following industries: match and fireworks, gemcutting, textiles (powerloom, handloom, dyeing andbleaching), hosiery, metal, tanneries, mosquito net making,beedi making and starch making.
Agriculture accountsfor the largest section
of child labour inTamilnadu
Tamilnadu Social Development Report 2000 164
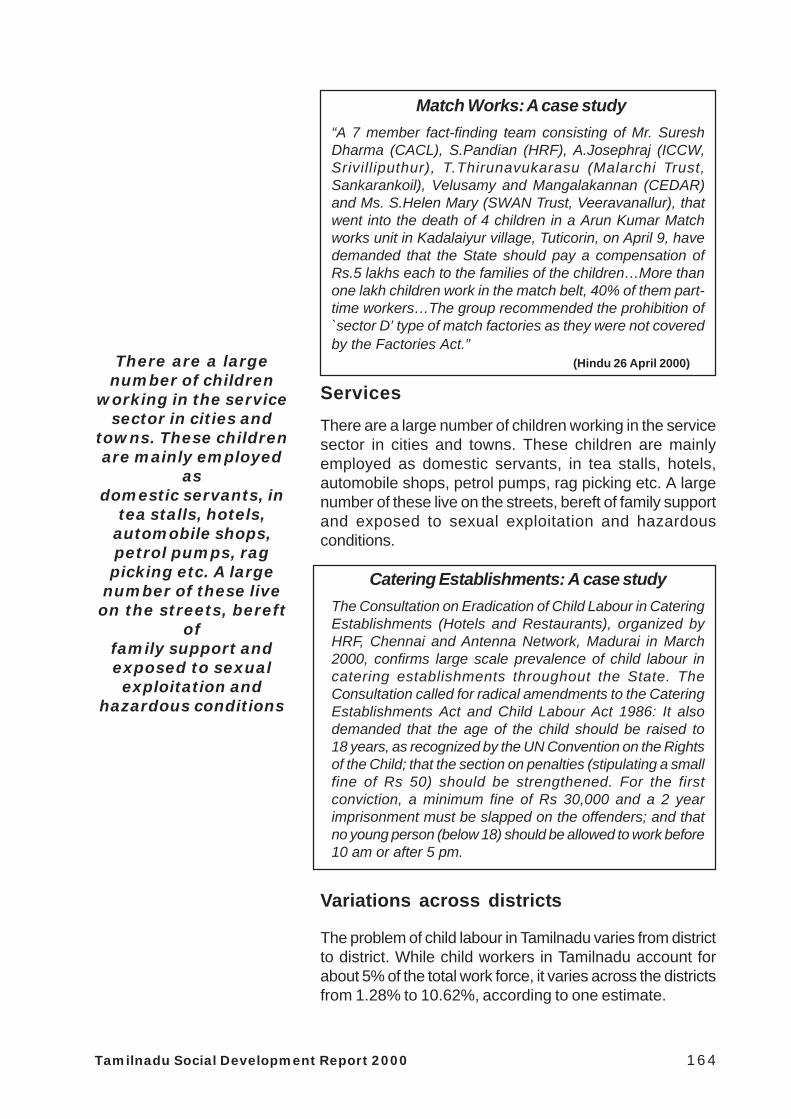
Match Works: A case study“A 7 member fact-finding team consisting of Mr. SureshDharma (CACL), S.Pandian (HRF), A.Josephraj (ICCW,Srivilliputhur), T.Thirunavukarasu (Malarchi Trust,Sankarankoil), Velusamy and Mangalakannan (CEDAR)and Ms. S.Helen Mary (SWAN Trust, Veeravanallur), thatwent into the death of 4 children in a Arun Kumar Matchworks unit in Kadalaiyur village, Tuticorin, on April 9, havedemanded that the State should pay a compensation ofRs.5 lakhs each to the families of the children…More thanone lakh children work in the match belt, 40% of them part-time workers…The group recommended the prohibition of`sector D’ type of match factories as they were not coveredby the Factories Act.”
(Hindu 26 April 2000)
ServicesThere are a large number of children working in the servicesector in cities and towns. These children are mainlyemployed as domestic servants, in tea stalls, hotels,automobile shops, petrol pumps, rag picking etc. A largenumber of these live on the streets, bereft of family supportand exposed to sexual exploitation and hazardousconditions.
Catering Establishments: A case studyThe Consultation on Eradication of Child Labour in CateringEstablishments (Hotels and Restaurants), organized byHRF, Chennai and Antenna Network, Madurai in March2000, confirms large scale prevalence of child labour incatering establishments throughout the State. TheConsultation called for radical amendments to the CateringEstablishments Act and Child Labour Act 1986: It alsodemanded that the age of the child should be raised to18 years, as recognized by the UN Convention on the Rightsof the Child; that the section on penalties (stipulating a smallfine of Rs 50) should be strengthened. For the firstconviction, a minimum fine of Rs 30,000 and a 2 yearimprisonment must be slapped on the offenders; and thatno young person (below 18) should be allowed to work before10 am or after 5 pm.
Variations across districts
The problem of child labour in Tamilnadu varies from districtto district. While child workers in Tamilnadu account forabout 5% of the total work force, it varies across the districtsfrom 1.28% to 10.62%, according to one estimate.
There are a largenumber of children
working in the servicesector in cities and
towns. These childrenare mainly employed
asdomestic servants, in
tea stalls, hotels,automobile shops,petrol pumps, ragpicking etc. A large
number of these liveon the streets, bereft
offamily support andexposed to sexualexploitation and
hazardous conditions

Tamilnadu Social Development Report 2000 165
Tamilnadu Social Development Report 2000 166
The districts that have an above-average concentration ofchild labour are Dharmapuri (10.62%), Salem (8.5%),Coimbatore (7.6%) and Vellore (7.37%).
A UNICEF Study in 1995 estimated that it varied from1.28% to 7.99% across the districts. North Arcot, Salemand Madurai districts accounted for a higher proportion ofchild workers in Tamilnadu.
Separate surveys done in high risk blocks in Kamarajar,VOC, Salem, Coimbatore and North Arcot Districts bringout clearly the specific concentrations of child labour.
A survey of 5 blocks and 1 municipality in VOC districtrevealed that 8.5% of boys and 12.3% of girls in the 6-11age group were full time workers and only 80.7% of boysand 77.3% of girls in this age group were in school.
In 7 blocks of 4 municipalities of Kamarajar district, 15.1%of boys and 19.1% of girls were full time workers and only75.5% of boys and 70.2% of girls in the 6-11 age groupwere in school.
In 7 blocks and 1 municipality in Coimbatore District, 2% wereworking and 1% was simultaneously studying and working,and 87% of the children in the 6-11 age group were in school.
In Salem District, 13% were reported working and only 83%were in school.
A total of 1743 children were identified as Bonded ChildLabourers in a survey in 1995 in North Arcot Ambedkar District.
The Coimbatore Child Labour Abolition Support Society(Kovai CLASS)) has claimed that the practice of employingchild labour is even today greatly prevalent in hosiery unitsat Tirupur. In one unit, 3 out of 21 employees and in another,5 out of 22 were found to be child labourers, and wererescued after medical test. (Hindu 2 November 1999)
According to a survey conducted by the Centre for SocialAction and Development, an NGO based in Avinashi, anestimated 62% children form the total workforce inindustries. Only a meager 15-20% are paid monthly wages,while the majority are paid peace-meal weekly rates. A largenumber of children also work in dyeing and bleaching units,handling poisonous substances.
The districts that havean above-average
concentration of childlabour seem to be
Dharmapuri, Salem,Coimbatore, Madurai
and Vellore
Tamilnadu Social Development Report 2000 167
A study done for UNICEF and OXFAM in 1994-95 estimatesthat there are 25000-30000 children working in all sectorsof the hosiery sector…. Most of these hazardous industriescontinue to employ child labour, as they are not listed in theschedules of the Child Labour (Prohibition and Regulation)Act of 1986. Being smallscale units, they are out of boundsof the Factory unit (TCFR, p.226-227)
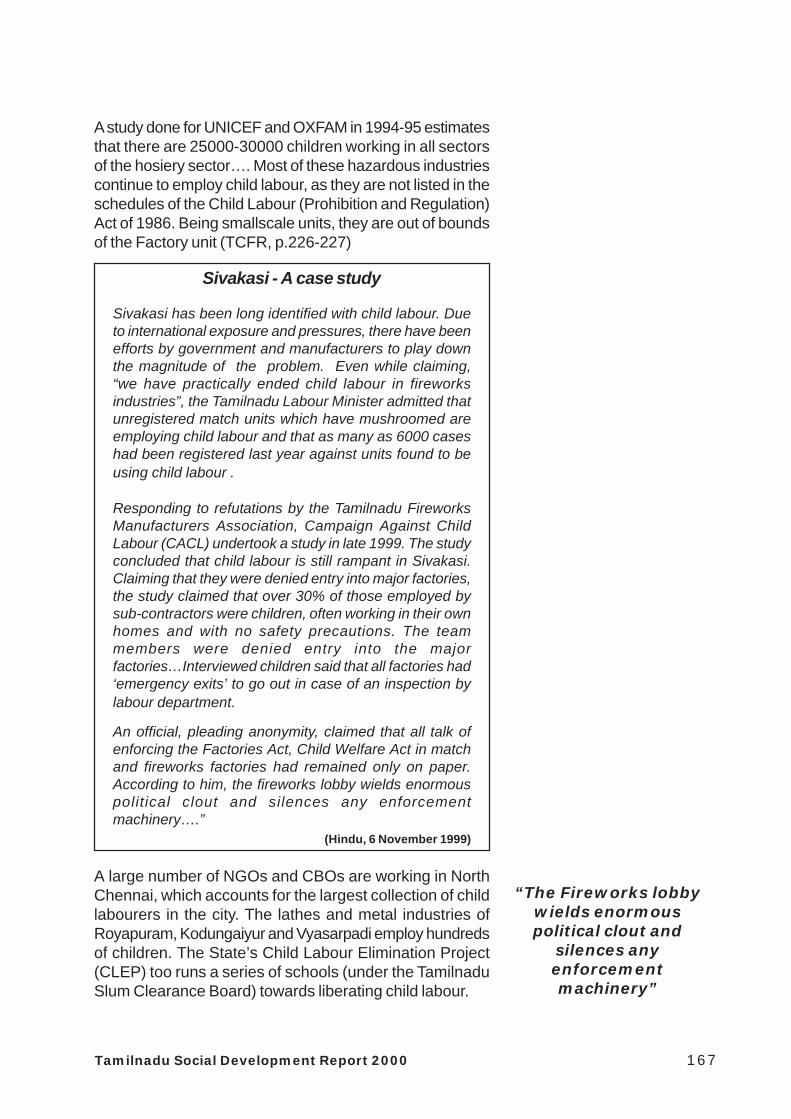
Sivakasi - A case study
Sivakasi has been long identified with child labour. Dueto international exposure and pressures, there have beenefforts by government and manufacturers to play downthe magnitude of the problem. Even while claiming,“we have practically ended child labour in fireworksindustries”, the Tamilnadu Labour Minister admitted thatunregistered match units which have mushroomed areemploying child labour and that as many as 6000 caseshad been registered last year against units found to beusing child labour .
Responding to refutations by the Tamilnadu FireworksManufacturers Association, Campaign Against ChildLabour (CACL) undertook a study in late 1999. The studyconcluded that child labour is still rampant in Sivakasi.Claiming that they were denied entry into major factories,the study claimed that over 30% of those employed bysub-contractors were children, often working in their ownhomes and with no safety precautions. The teammembers were denied entry into the majorfactories…Interviewed children said that all factories had‘emergency exits’ to go out in case of an inspection bylabour department.
An official, pleading anonymity, claimed that all talk ofenforcing the Factories Act, Child Welfare Act in matchand fireworks factories had remained only on paper.According to him, the fireworks lobby wields enormouspolitical clout and silences any enforcementmachinery….”
(Hindu, 6 November 1999)
A large number of NGOs and CBOs are working in NorthChennai, which accounts for the largest collection of childlabourers in the city. The lathes and metal industries ofRoyapuram, Kodungaiyur and Vyasarpadi employ hundredsof children. The State’s Child Labour Elimination Project(CLEP) too runs a series of schools (under the TamilnaduSlum Clearance Board) towards liberating child labour.
“The Fireworks lobbywields enormouspolitical clout and
silences anyenforcementmachinery”
Tamilnadu Social Development Report 2000 168
Working Girl Children
The incidence of working girls is much higher compared toworking boys in almost all the districts of Tamilnadu. In theState as a whole, as per the census data, working boysaccount for 3.61% of the total male work force (mainworkers) whereas working girls account for 7.06% of thetotal female work force (main workers).
• In terms of working girls, the proportion is quite highin Dharmapuri (10.62%), Salem (8.52%), Periyar(8.31%) and Ramanathapuram including Kamarajar(8.28%) districts.
• Except in Nilgiris (2.94%), Chennai(2.15%),Thanjavur (3.79%) and Kanyakumari (4.7%) districts,which have lower incidence of working girls, theproportion of working girls is about 6% and abovein all the other districts (Tirunelveli-7.85%;Coimbatore-7.66%; Madurai-7.43%; North Arcot-7.37%; Pudukottai-6.61%; Chengai–5.9%; Trichy –5.87%; South Arcot-5.84%).
It is worth noting, that the underestimation of the child workforce among girl children is much higher than for boy children.
Child Domestic Workers
There are no reliable data regarding child domestic workersin Tamilnadu, but is becoming quite prevalent in the townsand cities of Tamilnadu.
A study conducted by the Tamilnadu Slum Clearance Boardshowed that child domestic workers formed 12% of thepopulation of child labourers in Chennai. (Hindu, 19 April2000).
Two other studies, one by Arunodhaya, a chennai-basedNGO, on child domestic workers in Chennai and anotherby Peace Trust, with its network of NGOs in Tamilnadu, onchild domestic workers in the major towns of Tamilnadu giveus very valuable insights into the nature of the problem.
The incidence ofworking girls is muchhigher compared to
working boys in almostall the districts of
Tamilnadu

Tamilnadu Social Development Report 2000 169
The Peace Trust study came up with the following findings:
• Among the domestic workers employed by some44.8% of the houses above poverty line in the urbanareas of Tamilnadu, 8.8% were children (below age18). For the 18 towns surveyed the total figure cameto 39160. Below the age of 14, there were 11280child domestic workers in the 18 towns.
• Among the 11280 child domestic workers (belowage 14), 94% were girls.
• Of the 18 towns, Ooty had the highest percentage ofchild domestic workers, with 34.5% below 14 yearsand 31% between 31%, among all the domesticworkers. This was followed by Karur (15.2% below14 years), Villupuram (11.3%, Pudukottai (10.1%),Tirunelveli and Salem (8.1% each) and Madurai andNagapattinam (close to 5% each).
• Among the employers of these child domesticworkers, 26.4% were Government employees,48.5% were factory owners and business people,and 18.2% were professionals.
The Arunodhaya study found that children working asdomestic labour in the city were frequently subjected tophysical abuse and long hours of work. The most harassedgroup was the resident child workers. The more disturbingfinding was that around 26% of child domestic workers inthe city work in the homes of government employees, inspite of the government order in 1997 barring State govt.employees from employing child labourers in their houses.
Among the main recommendations made by the study were:
• A scientific estimation of the magnitude of theproblem of child domestic workers throughout theState should be undertaken.
• Child domestic work should be brought under thepurview of Article 24 of the Constitution, which, atpresent, prohibits child labour in hazardous industries.
• Child domestic work should be included in part B ofthe schedule of Child Labour Prohibition andRegulation Act of 1986 and the Shops andEstablishments Act.
26% of childdomesticworkers atChennai work in the
homes of governmentemployees, in spite ofthe Government orderin 1997 banning State
Governmentemployees fromemploying child
labourers in theirhouses

Tamilnadu Social Development Report 2000 170
Present Policies
“The entire thrust of India’s policy on child labour isamelioration and not abolition”
- Prof. Myron Weiner
“Even seven years after the Child Labour Protectionand Regulation Act was passed, the State Governmenthas not implemented it – rules have not been framed,nor enforcing committees set up”
- TN Govt – UNICEF Report, 1993
Even as late as 1999, while lakhs of children continued tobe engaged in hazardous industries and occupations, only13 industries and occupations and 51 processes had beennotified on the recommendation of the Technical AdvisoryCommittee.
The lethargy of the administration, coupled with the strengthof powerful lobbies have made mockery of any effortundertaken to eradicate child labour in the State. As late asApril 2000, only 8 children in Tamilnadu, rescued frombonded child labour had received the stipulatedcompensation, 3 years after the Child Labour Rehabilitation-cum-Welfare Fund was constituted. So far only Rs 1,60,000has been collected as compensation from the employersof children retrieved from hazardous industries, as per theSupreme Court Order of 1996. (Hindu 28 April 2000)
In early 2000, two agreements for an ‘integrated areaspecific approach’ against the hazardous and exploitativeforms of child labour in the hosiery town of Tiruppur and thefireworks center of Sivakasi under IPEC were signedbetween ILO and the ‘National Child Labour ProjectSocieties’ at Coimbatore and Virudhunagar respectively.The projects envisage prevention and rehabilitation of about15,000 children in the hazardous occupations in Sivakasi,Tiruppur, Palladam and Avinasi.
The lethargy of theadministration,
coulpled with thestrength of powerfullobbies have made
mockery of any effortundertaken to
eradicate child labourin the State

Tamilnadu Social Development Report 2000 171
Campaigns demandingfree, compulsory and
quality education for allchildren have gained
strength over the years.The Government needs to
look seriously into thisaspect of public policy
and act
Child Labour and Primary Education
“ What is needed is not a piecemeal approach dealingwith the economic, social or legal aspects of theproblem in isolation but a comprehensive approachcovering the various facets. And education is the keyto this. Given the strong link between schoolattendance and the elimination of child labour, avigorous movement for compulsory primary educationmust be launched.”
- Asha K., 1993
Article 45 of The Indian Constitution directs the States to providefree and compulsory education for all children until they completethe age of 14 years. And experience at both the policy andgrassroots levels in States like Kerala has clearly shown that theonly effective answer to the problem of child labour is to ensurethat all children of school going age are back in schools.
In this context, there is a need for a radical policy changesby the Tamilnadu Government, linking free, compulsory andquality education with the eradication of child labour.
“The 1995 TN Education Act defines elementaryeducation as upto standard V; this is inconsistent withthe lower age limit for entering labour force – 14 years”
- UNICEF, September 2000
Campaigns demanding free, compulsory and quality educationfor all children have gained strength over the years. TheGovernment needs to look seriously into this aspect of publicpolicy and act!
Tamilnadu State Plan of Action 1993
In 1993, the Govt. of Tamilnadu formulated and released theState Plan of Action for Children, on the lines of goals set inthe National Plan of Action made by the Govt. of India. ThePlan covered a whole range of concerns such as maternityand child health, nutrition, education, child labour, childhooddisabilities, drinking water, sanitation etc., and fixed goals onall the 15 points for the years 1995, 1998 and 2000.
The Plan specifically and categorically mentioned one of its goalsas “Elimination of bonded child labour and child labour in hazardousindustries (children under 15 years)…and Child labour under 12 yearsof age in all industries and categories”. But, like many other goodprogrammes, it remains more in paper than in actuality. Ithas become the casualty of party politics and, in spite ofefforts few and far in between, it still remains mostly a dream.
Tamilnadu State Plan ofAction 1993 has
become a casuality ofparty politics and
remains more in paperthan in reality
Tamilnadu Social Development Report 2000 172
12345678901234567890123456789012123456789012345678901234567890121234567890123456789012345123456789012345678901234567890121234567890123456789012345678901212345678901234567890123451234567890123456789012345678901212345678901234567890123456789012123456789012345678901234512345678901234567890123456789012123456789012345678901234567890121234567890123456789012345123456789012345678901234567890121234567890123456789012345678901212345678901234567890123451234567890123456789012345678901212345678901234567890123456789012123456789012345678901234512345678901234567890123456789012123456789012345678901234567890121234567890123456789012345
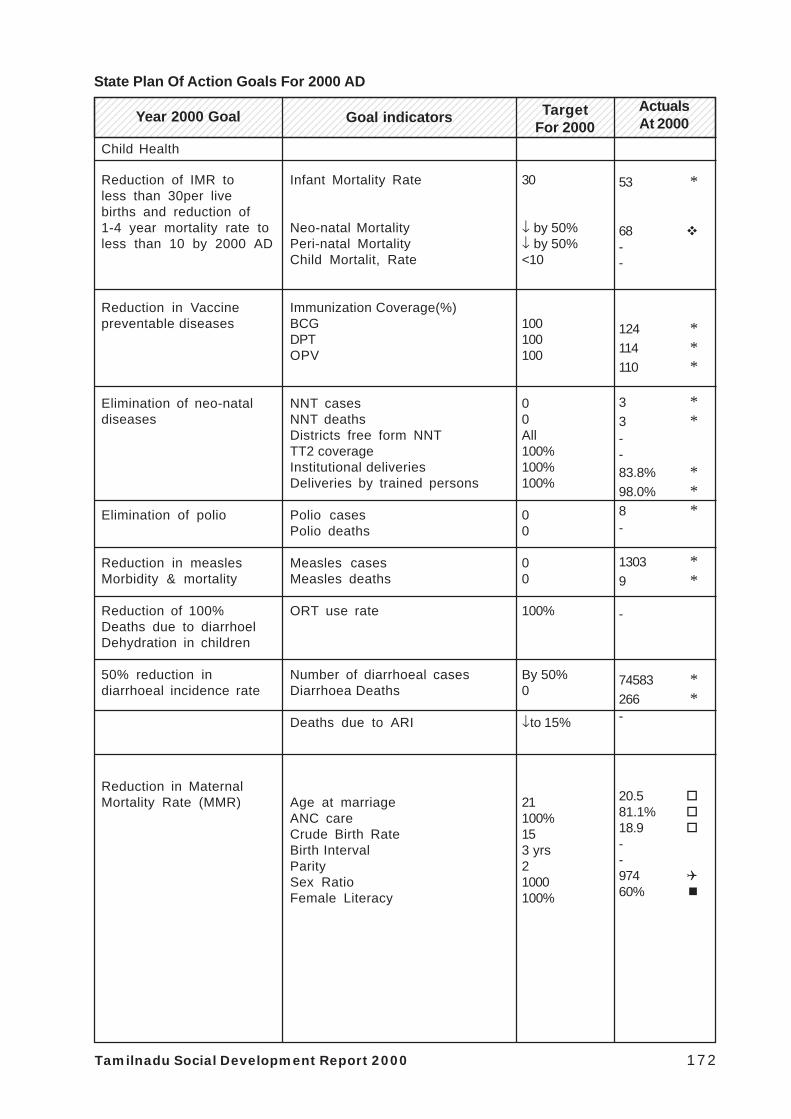
State Plan Of Action Goals For 2000 AD
Year 2000 Goal Goal indicators TargetFor 2000
ActualsAt 2000
Child Health
Reduction of IMR toless than 30per livebirths and reduction of1-4 year mortality rate toless than 10 by 2000 AD
Reduction in Vaccinepreventable diseases
Elimination of neo-nataldiseases
Elimination of polio
Reduction in measlesMorbidity & mortality
Reduction of 100%Deaths due to diarrhoelDehydration in children
50% reduction indiarrhoeal incidence rate
Reduction in MaternalMortality Rate (MMR)
Infant Mortality Rate
Neo-natal MortalityPeri-natal MortalityChild Mortalit, Rate
Immunization Coverage(%)BCGDPTOPV
NNT casesNNT deathsDistricts free form NNTTT2 coverageInstitutional deliveriesDeliveries by trained persons
Polio casesPolio deaths
Measles casesMeasles deaths
ORT use rate
Number of diarrhoeal casesDiarrhoea Deaths
Deaths due to ARI
Age at marriageANC careCrude Birth RateBirth IntervalParitySex RatioFemale Literacy
30
↓ by 50%↓ by 50%<10
100100100
00All100%100%100%
00
00
100%
By 50%0
↓to 15%
21100%153 yrs21000100%
53 *
68 --
124 *114 *110 *
3 *3 *--83.8% *98.0% *8 *-
1303 *9 *
-
74583 *266 *-
20.581.1%18.9--97460%
Tamilnadu Social Development Report 2000 173
12345678901234567890123456789012123456789012345678901234567890121234567890123456789012345123456789012345678901234567890121234567890123456789012345678901212345678901234567890123451234567890123456789012345678901212345678901234567890123456789012123456789012345678901234512345678901234567890123456789012123456789012345678901234567890121234567890123456789012345123456789012345678901234567890121234567890123456789012345678901212345678901234567890123451234567890123456789012345678901212345678901234567890123456789012123456789012345678901234512345678901234567890123456789012123456789012345678901234567890121234567890123456789012345
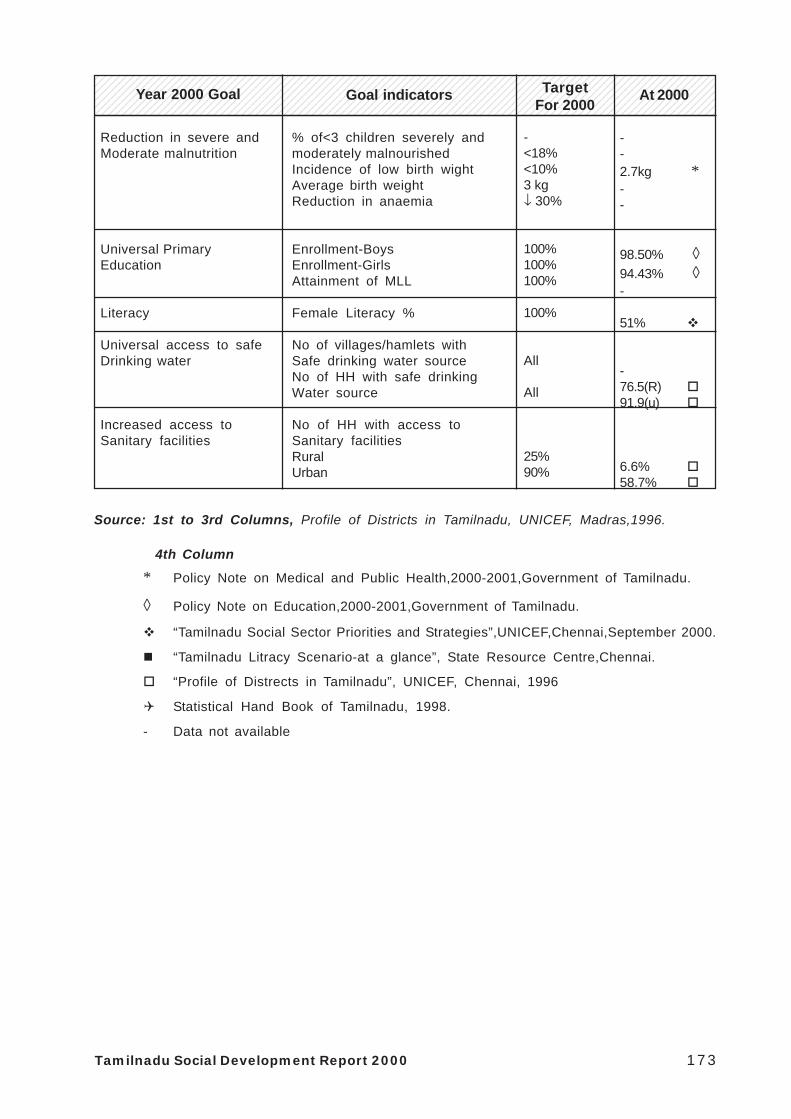
Year 2000 Goal Goal indicators TargetFor 2000
At 2000
Reduction in severe andModerate malnutrition
Universal PrimaryEducation
Literacy
Universal access to safeDrinking water
Increased access toSanitary facilities
% of<3 children severely andmoderately malnourishedIncidence of low birth wightAverage birth weightReduction in anaemia
Enrollment-BoysEnrollment-GirlsAttainment of MLL
Female Literacy %
No of villages/hamlets withSafe drinking water sourceNo of HH with safe drinkingWater source
No of HH with access toSanitary facilitiesRuralUrban
-<18%<10%3 kg↓ 30%
100%100%100%
100%
All
All
25%90%
--2.7kg *--
98.50% ◊94.43% ◊-
51%
-76.5(R)91.9(u)
6.6%58.7%
* Policy Note on Medical and Public Health,2000-2001,Government of Tamilnadu.
◊ Policy Note on Education,2000-2001,Government of Tamilnadu.
“Tamilnadu Social Sector Priorities and Strategies”,UNICEF,Chennai,September 2000.
“Tamilnadu Litracy Scenario-at a glance”, State Resource Centre,Chennai.
“Profile of Distrects in Tamilnadu”, UNICEF, Chennai, 1996
Statistical Hand Book of Tamilnadu, 1998.
- Data not available
Source: 1st to 3rd Columns, Profile of Districts in Tamilnadu, UNICEF, Madras,1996.
4th Column

Tamilnadu Social Development Report 2000 174
Changes Needed:
“It is important to compile a Status Report of childrenin Tamilnadu by an independent committee of experts.”
- Tamilnadu Peoples’ Manifesto, 1996
The “Manifesto for Child Rights” brought out by theCampaign Against Child Labour (CACL) brigs out someof the major challenges for public policy on children:
• Political aspirants need to give a commitmenttowards providing food, housing, health care andeducation for children
• There is a need for a uniform definition of the child inkeeping with the Child Rights Convention
• Adequate nutritious food at the balwadis andschools, Improvement of primary health centres andgovernment hospitals and Free, Compulsory andQuality education upto 10th standard are urgentlycalled for
• Child care services which are inadequate at presentneed an overall thorough re-evaluation
• A comprehensive policy for the rehabilitation of streetchildren
• Immediate steps to stop infanticide and feticide,regulate scan centres, make effective the ban on sexselective abortions and promote education of girlchildren
• A review of the Juvenile Justice Act, 1986
Many Child Labour Prevention Committees in Tamilnaduhave highlighted the loopholes in labour laws prohibitingchild labour and the reluctant implementation byenforcement authorities. The 1986 Child Labour Act needsto be radically amended, specifically the proviso thatexempts households to employ children.
In the Southern districts of Tamilnadu, where child Labouris rampant, the Kerala and the Tamilnadu governmentsshould take immediate measures to divert the western ghatwaters, so as to increase the agricultural production whichwill lead to the eradication of child labour in this region.
And above all, concerted efforts must be made to ensurethat every child in Tamilnadu is in school till the age 14 atleast!

Tamilnadu Social Development Report 2000 175
References:
• Weiner, M, “The Child and the State in India”,Princeton University Press, Princeton, 1991
• “National Family Health Survey: India 1992-93”,International Institute for Population Sciences, Bombay, October 1994
• India Country Report on “Convention on the Rights of the Child”, February 1997
• A.F.Ferguson & Co,“Children and Women in Tamilnadu: A Situation analysis 1990”, UNICEF
• “The Child and the Law”, UNICEF, New Delhi, 1994
• Vidyasagar.S, “Status Report on Child Labour in Tamilnadu”, UNICEF, 1995
• “Profile of Districts in Tamilnadu”, UNICEF, Chennai, 1996
• “50 years of Independence and Situation of Children in Tamilnadu”,Report of State-level Conference, UNICEF / ICCW, 1998
• “25 Years of ICDS: The TN Experience in Child Care and Development”,Department of Social welfare, GOTN, October 2000
• Ms. Fatima Vasant, “Prevailing Condition of Girl Child”,State-level Consultation on Child Rights Agenda
For The Third Millennium, Chennai,18-20 November 1999,
• Chaubey, Selina, “Catch Them Young: The Tamilnadu Integrated Nutrition Project,Taking Nutrition and Health Services to the Villages”,
World Bank, Washington D.C., 1998
• “Taking Stock: Developing Indicators for Analysing Costs and Benefits of EarlyChildhood care and Development Programmes”,
M.S.Swaminathan Research Foundation, 1999
• “Towards Eradication of Child labour:Draft proposals for Reforms in School Education in Tamilnadu”,
HRF Consultation document, March 2000

Tamilnadu Social Development Report 2000 176
• “Tamilnadu Child Domestic Servants Survey (January - March 2000)”, Peace Trust
• “Kuzhanthai Urimaigal”, in “Tamizhagathil Manitha Urimaigal 1998-2000”,Peoples’ Watch - Tamilnadu, Madurai, 2000
• “Commitment to the Child”, Convention on the Rights of the Child
• “Policy Note on Social Welfare 2000-2001”, GOTN, 2000
• “A Programme for Children and Women in India, Plan of Operations 1999-2002”,GOI-UNICEF
• “Implementation of the Convention on the Rights of the Child (India)”,UNCHR, June 1999
• “State Plan of Action For The Child in Tamilnadu” , November1993
• C.Nambi, “Child Labour in Hosiery Industry”, CSED, Avinashi, 1995
• “Out of Sight…Out of Mind…Out of Reach…A Study of Child Domestic Workers in Chennai – India”, Arunodhaya, 1999


