
75857_19.pdf
25
Dewatering Excavation in Sand Two-stage wellpoint system dewatering gravelly sand for construction of deep foundation for steel manufacturing plant, Hennepin, Illinois. Illinois River in background. Despite the relatively high perme- ability of the glacio-alluvial deposit, the excavation is completely dry. (Photo courtesy of Professor H. 0. Ireland.) PLATE 19. 306 Copyrighted Material Copyright © 1974 John Wiley & Sons Retrieved from: www.knovel.com
Transcript of 75857_19.pdf

Dewatering Excavation in Sand
Two-stage wellpoint system dewatering gravelly sand for construction of deep foundation for steel manufacturing plant, Hennepin, Illinois. Illinois River in background. Despite the relatively high perme- ability of the glacio-alluvial deposit, the excavation is completely dry.
(Photo courtesy of Professor H. 0. Ireland.)
PLATE 19.
306
Copy
right
ed M
ater
ial
Copyright © 1974 John Wiley & Sons Retrieved from: www.knovel.com

CHAPTER 19
Foundations on Sand and Nonplastic Silt
19.1. Significant Characteristics of
If the site is underlain by sand, the foun- dation may consist of footings, rafts, piers, or piles. The choice depends primarily on the relative density of the sand and on the position of the water table. The relative density determines the bearing capacity and settlement of footings, rafts, or piers, and it also establishes the resistance of piles. The position of the water table is important chiefly because excavation below water level requires drainage and increases the cost of the foundation. However, it also has an ap- preciable influence on the bearing capacity and settlement.
Nonplastic cohesionless silt exhibits most of the characteristics of fine sand. In this chapter, the two materials are usually con- sidered synonomous; exceptions, however, are noted.
Sand and Silt Deposits
19.2. Footings on Sand Basisfor Design. Typical load-settlement re- lationships for footings of different widths on the surface of a homogeneous sand de- posit are shown in Fig. 19.1~. The wider the footing, the greater the ultimate capacity per unit of area. However, for a given settlement SI, such as 1 in., the soil pressure is greater for a footing of intermediate width
Bb than for a large footing with a width B,, or for a narrow footing with width B,. The pressures corresponding to the three widths are indicated by points b, c, and a, respec- tively.
The same data may be used to plot Fig.
Soil pressure, q
footinq
sc f flcmcn t, S,
Narrow Wide footing
C
W/’dth of footing, 8
FIGURE 19.1. Relationships among soil pressure, width of footing, and settlements for footings of constant D,/B ratio on sand of uniform relative density. (a ) Load-settlement curves for footings of increasing widths B., Bb, and B,. (6) Variation of soil pressure with width of footing for given settlement SI.
307
Copy
right
ed M
ater
ial
Copyright © 1974 John Wiley & Sons Retrieved from: www.knovel.com

308 19/Foundations on Sand and Nonplastic Silt
19.lb, which shows the load q1 per unit of area corresponding to a given settlement SI as a function of the width of the footing. The soil pressure for settlement S1 increases with increasing width of footing if the foot- ings are relatively small, reaches a maxi- mum at an intermediate width, and then decreases gradually with increasing width.
Although the relation shown in Fig. 19.16 is generally valid for the behavior of footings on sand, it is influenced, nevertheless, by several factors including the relative den- sity of the sand, the depth at which the foundation is established, and the position of the watcr table. Furthermore, the shape of the curve suggests that, for narrow foot- ings, small variations in the.actua1 soil pres- sure may lead to large variations in settle- ment and in some instances to settlements so large that the movement would be con- sidered a bearing-capacity failure. The reason is apparent from the shape of the load-settlement curve for a narrow footing (Fig. 19.la). On the other hand, a small change in pressure on a wide footing has little influence on settlements as small as SI; moreover, the value of q1 corresponding to SI is far below that which would produce a bearing-capacity failure of the wide footing.
The simple procedure described in the remainder of this article for proportioning footings on sand is based on the approxima- tions illustrated in Fig. 19.2. The concave- upward portion of the curves similar to the right-hand portion of Fig. 19.1 b is replaced by a straight linefg (Fig. 19.2), according to which the soil pressure corresponding to a settlement S1 is independent of the width of the footing. The error for footings of usual dimensions is ordinarily less than f 10 per cent. The steeply ascending left-hand portion of the curves is replaced by a straight line ef, which lies to the right of the actual curve and thus provides a margin of safety against a bearing capacity failure.
The position of the broken line efg differs for different sands. The procedures for es- tablishing the lines for different sands and for using them in the design of footings are described under the following subheadings.
L ;m/'t imposed 6y seff/ement
Width of footinq, 6
FIGURE 19.2. Actual relation (solid line) between soil pressure and width of footing on sand for given settlement SI, and substitute relation (dashed lines) used as basis for design.
Considerations of Settlement. The soil pressure that produtes a given settlement $1 on a loose sand is obviously smaller than the soil pressure that produces the same settlement on a dense sand. Hence, in a rough way, there should be a relation between the soil pressure to produce the given settlement and the N-values from the standard pene- tration test (Art. 5.4). Such a relation was developed in 1948 (Terzaghi and Peck) on the basis of general knowledge of the loads, settlements, and N-values of various sand- supported footings; the value of $1 was taken as 1 in. on the premise that if the maximum settlement were restricted to this amount the differential settlements among the foot- ings of a given building would be within tolerable limits. The information then avail- able was interpreted conservatively, so that in most instances the actual settlement of a footing proportioned on the basis of the relation would be less than 1 in. Experience has indicated that the relation was indeed conservative and sometimes excessively so; hence, various modifications have been suggested from time to time. The one pro- posed for present use is represented by the horizontal lines on the right side of the three parts of Fig. 19.3. Each line corresponds to a particular N-value and indicates the soil pressure corresponding to a settlement of 1 in. The lines are drawn for the condition that the water table is at great depth. The necessary correction for other positions is considered later.
Copy
right
ed M
ater
ial
Copyright © 1974 John Wiley & Sons Retrieved from: www.knovel.com

309 Footings on Sand
(b) Df /B=0 .5
O I 2 3 f 0 1 2 3 4 Width o f footing, 8, f f
(c) D r / 8 = 0.25
0 1 2 3 4 5 6
FIGURE 19.3. Design chart for proportioning shallow footings on sand.
The horizontal lines in Fig. 19.3 form part of a chart for design of footings on sand. The use and limitations of the chart are discussed after an investigation of the limitations imposed by the bearing capa- city of the sand.
Considerations of Bearing Capacity. It has been pointed out that, for narrow footings, small increases in soil pressure may lead to such large increases in settlement that the move- ment would be considered a bearing-capa- city failure. Hence, any acceptable proce- dure for proportioning footings on sand must provide assurance that, even if the settlement under the anticipated conditions would appear not to exceed 1 in., the margin
against a bearing-capacity failure would be ample in spite of the inevitable differences between anticipated and real conditions. Moreover, under some circumstances even large settlements of wide footings or piers may be acceptable if the possibility of an outright failure of the supporting sand is excluded. Hence, a knowledge of the ulti- mate bearing capacity is essential for de- sign. Reasonable estimates can be based on theoretical considerations.
Figure 19.4 represents a cross section through a long footing with width B, resting at depth D, below the ground surface on a deep deposit of sand. If the footing fails by breaking into the ground, a zone uo'a',
e' I
Acfuol conditions Ideolized cona'l't,bns
5 = p fun 9
FIGURE 19.4. Cross section through long footing on sand showing (left side) pattern of displacements during bearing-capacity failure, and (right side) idealized conditions assumed for analysis.
Copy
right
ed M
ater
ial
Copyright © 1974 John Wiley & Sons Retrieved from: www.knovel.com
3 10 19/Foundations on S a d and Nonplastic Silt
within which the sand cannot slip with respect to the base of the footing because of the roughness of the base, moves downward as a unit. As i t moves it displaces the adja- cent material. Consequently, the sand in two symmetrical zones ao'bde, one of which is illustrated on the left side of Fig. 19.4, is subjected to severe shearing distortions and slides outward and upward along the boundaries O'bd. The movement is resisted by the shearing strength of the sand along O'bd and the weight of the sand in the sliding masses.
No completely adequate rigorous theory exists for calculating the ultimate capacity of a footing under such circumstances, but satisfactory approximate solutions have been obtained on the basis of various simplifying assumptions (Terzaghi, 1943; Meyerhof, 1955). It is assumed, as illustrated on the right half of Fig. 19.4, that the influence of the soil above the base level of the footing can be replaced by a uniform surcharge rD,. Theory and experiment then indicate that the surface of sliding consists of a curved portion O'c' and a straight section c'b' that rises at an angle of 45' - 412 with the horizontal. The load qd' on the footing, the surcharge yDf , and the weight W of the sliding mass all produce normal stresses across the surface of sliding O'c'b', which, in turn, develop frictional shearing resistance along the surface of sliding. When the mass is on the verge of sliding the resultant R of the normal and shearing stresses at any point such as f on the surface of sliding is inclined at the angle 4 to the normal to the surface of sliding. The wedge O'c'b'a' may be considered as a free body and its equilibrium investigated to evaluate q d ' .
Various trials must be made to find the surface of sliding corresponding to the least value of q d ' that can be developed. This least value is designated the gross ultimate bearing capacity.
The results of such studies indicate that the gross ultimate bearing capacity may be expressed as
q d ' = 3BrNy + rD,Nq 19.1
and the net ultimate bearing capacity as
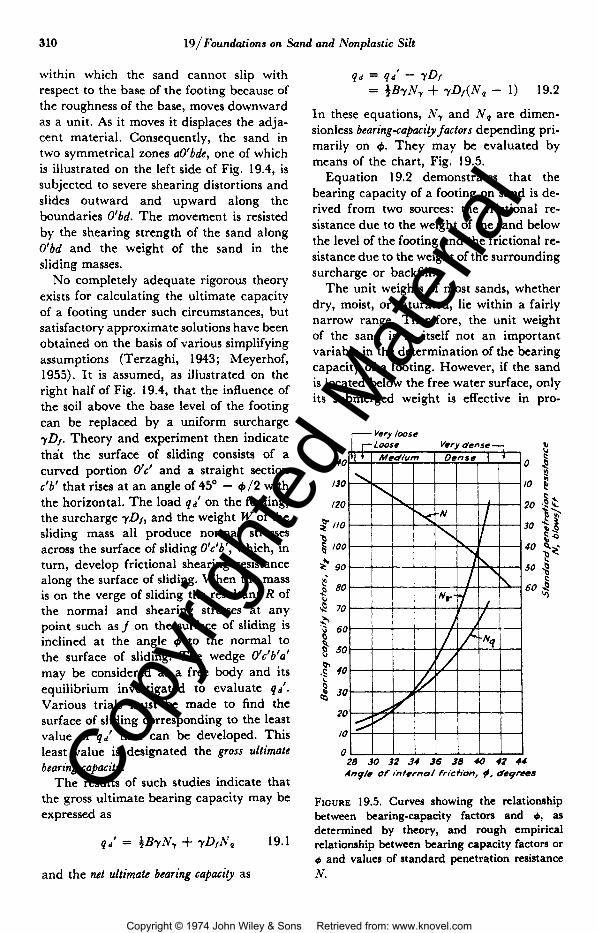
In these equations, N, and N, are dimen- sionless bearing-capacity factors depending pri- marily on 4. They may be evaluated by means of the chart, Fig. 19.5.
Equation 19.2 demonstrates that the bearing capacity of a footing on sand is de- rived from two sources: the frictional re- sistance due to the weight of the sand below the level of the footing and the frictional re- sistance due to the weight of the surrounding surcharge or backfill.
The unit weights of most sands, whether dry, moist, or saturated, lie within a fairly narrow range. Therefore, the unit weight of the sand is in itself not an important variable in the determination of the bearing capacity of a footing. However, if the sand is located below the free water surface, only its submerged weight is effective in pro- - Very loose
28 30 32 34 36 38 10 42 44 A n q h of tkfrrna/ frichon, #. deqrees
FIGURE 19.5. Curves showing the relationship between bearing-capacity factors and 0, as determined by theory, and rough empirical relationship between bearing capacity factors or 0 and values of standard penetration resistance N.
Copy
right
ed M
ater
ial
Copyright © 1974 John Wiley & Sons Retrieved from: www.knovel.com

Footings on Sand 311
ducing friction. The submerged weight is about one half of the moist, dry, or saturated weight. The value of + is not appreciably changed by submergence. Hence, it may be concluded that a rise of the water table from a depth greater than about B below the base of the footing to the top of the sur- charge would have the effect of reducing the bearing capacity to about one half of its value for moist, dry, or saturated sand. Thus, the position of the water table is of outstanding practical importance in estab- lishing the bearing capacity of a footing on sand.
The values of N , and N , increase rapidly as + increases (see Fig. 19.5). Since + de- pends to a considerable extent on the rela- tive density of the sand but is practically independent of the grain size, it may be concluded that the bearing capacity is greatly influenced by the relative density but hardly at all by the grain size.
According to eq. 19.2, the portion of the bearing capacity due to the weight of the soil beneath the footing increases directly with the width of the footing. The portion due to the surcharge, however, is inde- pendent of the width of the footing.
In summary, eq. 19.2 shows that the ultimate bearing capacity of a footing on sand depends mainly on four variables: the position of the water table, the relative density of the sand, the width of the footing, and the depth of the surcharge surrounding the footing.
The bearing-capacity factors N., and N , are functions of +. The N-values as deter- mined by means of the standard penetra- tion test (Art. 5.4) can be correlated at least roughly with the values of + and, therefore, with N , and N , . The results of such correlations are shown in Fig. 19.5. Hence, if the N-values are known, eq. 19.2 can be evaluated with the aid of Fig. 19.5.
I t should be understood that the relation- ship between N and + (Fig. 19.5) is only ap- proximate; the limitations of the standard penetration test have been pointed out in Art. 5.4. On the other hand, the relation- ship between + and N , or N , is based pri- marily on theory and is much more reliable. Hence, if + is determined by a procedure
more refined than use of the standard pene- tration test, Fig. 19.5 may still be utilized to evaluate N , or N,.
Equation 19.2 can be expressed in the form
and, for a given factor of safety F against a bearing-capacity failure,
F
For a particular value of D j / B and a given deposit of sand, the expression within the brackets is a constant. Thus, the relation between the width of footing and the net soil pressure qa for a given factor of safety can be expressed in a plot such as Fig. 19.3 as a family of straight lines radiating from the origii,. Each line corresponds to a sand having a different N-value. The initial branches of the curves in Fig. 19.3 have been drawn to provide a factor of safety of 2. If the soil pressures indicated by these lines are not exceeded, runaway settlement of a footing is precluded.
Design Chart for Footings on Sand. The con- siderations of settlement and bearing capa- city discussed under the preceding subhead- ings define the right- and left-hand branches of the curves shown in Fig. 19.3. The curves constitute a convenient means for propor- tioning footings on sand.
The width B in Fig. 19.3 may be taken as the side of a square footing, the smaller dimension of a rectangular footing, the width of a long continuous footing, or the diameter of a circular footing.
The chart applies to shallow footings (D, 7 B) resting on a uniform sand for which y = 100 Ib/cu ft, and in which the water table is a t too great a depth to influ- ence the behavior of the footings. In view of the other approximations in the proce- dure, variations of y from the assumed value of 100 lb/cu f t are inconsequential and may be neglected. On the other hand: (1) the N-values must sometimes be ad- justed for the influence of the overburden pressure during the performance of the
Copy
right
ed M
ater
ial
Copyright © 1974 John Wiley & Sons Retrieved from: www.knovel.com
312 19/Foundations on Sand and Nonplastic Silt
standard penetration test; (2) the varia- bility of the deposit, as reflected in varia- tion in the N-values from boring to boring, is usually appreciable and should be taken into account; and finally, (3) the influence of the water table, if shallow enough to affect the behavior of the footings, must be evaluated. Each of these considerations is discussed in detail in the following steps.
1. The chart (Fig. 19.3) is based on the behavior of shallow footings (0, 7 B) of normal dimensions and depths below the ground surface. Most of the structures con- sidered in developing the charts had base- ments 8 to 10 f t deep; consequently the bases of the footings were usually 10 to 15 ft below the original ground level a t the time the borings and standard penetration tests were made. The groundwater level was usually at or below base level of the footings. Thus, the N-values governing the behavior of the footings usually corresponded to depths a t the time of boring of 10 to 25 ft, or to effective overburden pressures be- tween about 0.6 and 1.2 tons/sq ft. Ac- cording to eq. 5.3, the correction factor CN, by which the N-values are adjusted to those corresponding to an overburden pres- sure of 1 ton /sq ft, varies for this range from 1.20 to 0.93. Hence, the data on which the chart is based correspond to conditions un- der which no correction of N-values for the effect of overburden pressure is needed. Under such circumstances, the chart can be used directly for the design of footings for a proposed structure.
Conversely, when the overburden pres- sure corresponding to the N-values expected to govern the design of proposed footings differs greatly from 1 ton/sq ft, the N- values should be corrected. If, for example, the borings are made from a ground level to be lowered, say 20 ft, by grading the site before the basement is excavated, the un- corrected N-values may be appreciably too large. On the other hand, if the structure is to have no basement and the footings will be at a high level, the pertinent N-values will correspond to shallow depths and, if uncorrected, may be much too small.
Nj-1 Correction factor CN = -
Nftrld
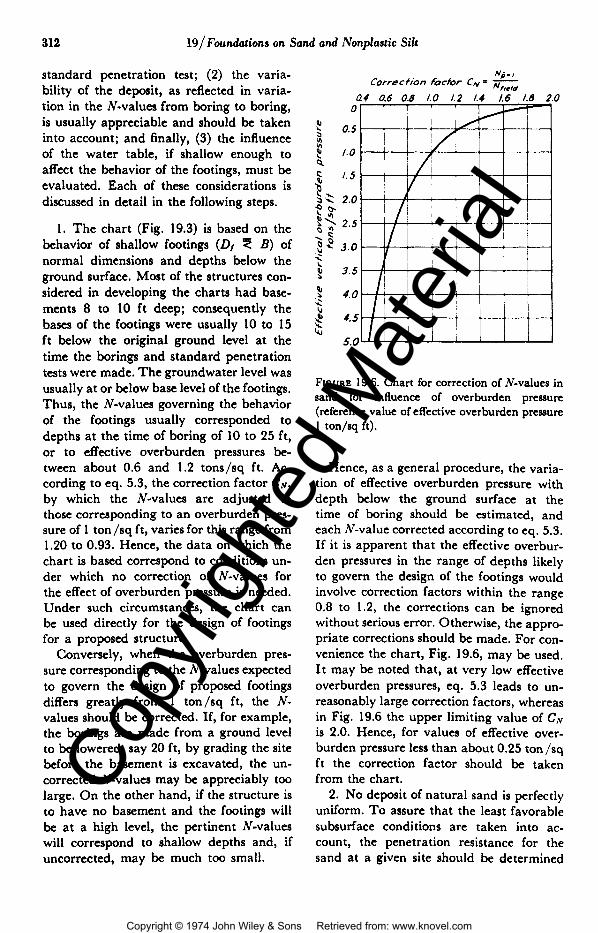
FIGURE 19.6. Chart for correction of N-values in sand for influence of overburden pressure (reference value of effective overburden pressure 1 ton/sq ft).
Hence, as a general procedure, the varia- tion of effective overburden pressure with depth below the ground surface at the time of boring should be estimated, and each N-value corrected according to eq. 5.3. If it is apparent that the effective overbur- den pressures in the range of depths likely to govern the design of the footings would involve correction factors within the range 0.8 to 1.2, the corrections can be ignored without serious error. Otherwise, the appro- priate corrections should be made. For con- venience the chart, Fig. 19.6, may be used. I t may be noted that, at very low effective overburden pressures, eq. 5.3 leads to un- reasonably large correction factors, whereas in Fig. 19.6 the upper limiting value of C N is 2.0. Hence, for values of effective over- burden pressure less than about 0.25 ton /sq ft the correction factor should be taken from the chart.
2. No deposit of natural sand is perfectly uniform. To assure that the least favorable subsurface conditions are taken into ac- count, the penetration resistance for the sand at a given site should be determined
Copy
right
ed M
ater
ial
Copyright © 1974 John Wiley & Sons Retrieved from: www.knovel.com

Footings on Sand 313
by making borings with standard penetra- tion tests at a number of points, preferably at least one boring for every 4 or 6 footings. Values of N should be determined at 24-ft vertical intervals between the 'level of the base of the footing and a depth B below this level. If the conditions described under Step 1 are applicable, the N-values should be corrected. The average of the N-values for each boring should be computed, and the smallest average value of N obtained in this manner should be used to determine the allowable soil pressure.
3. I t has been shown that a rise of the water table from a depth greater than about B below the base of the footing up to the top of the surcharge has the effect of re- ducing the bearing capacity to about one half its value for moist, dry, or saturated sand. Such a rise, which reduces the effec- tive pressures within the sand to roughly half their original values, also correspond- ingly reduces the stiffness of the sand (Fig. 4.5). Hence, the footing pressure required to produce a settlement of 1 in., if the water level is at the surface of the surrounding soil, is only about half that required to produce a I-in. settlement if the water level is at a depth of B or more beneath the footing.
Therefore, if the water level occurs and will remain at or below a depth D, + B beneath the ground surface surrounding the footing, the footing may be propor- tioned for the soil pressure taken directly from the chart. If the water table is located at or may rise to the ground surface, the values from the chart should be multiplied by a correction factor C, = 0.5. For a depth to groundwater level equal to D,, measured from the surface of the surcharge surrounding the footing, the correction factor may be obtained with sufficient ac- curacy by linear interpolation, or
19.4 Dw C, = 0.5 + 0.5- Dl + €3
Design Procedure Based on Chart for Footings on Sand. Since the permeability of sands is high enough to permit rapid adjustment to changes in load, the behavior of a founda-
tion on sand is likely to reflect the influence of the maximum rather than the long-term average loads. This characteristic should be given consideration in choosing the loads for which the footings are to be proportioned.
In practical foundation design it is cus- tomary to proportion all footings for the same net soil pressure except for a few that may have to be treated as special cases. If the soil pressure for design is influenced by the presence of the water table, the largest footing is likely to require the greatest cor- rection. Hence, the soil pressure should be determined for the footing to be subjected to the greatest design load. By selecting the soil pressure for this footing on the basis of the smallest average value of N, as described under Step 2 of the preceding section, the designer is assured that the largest footing, even if located above the loosest part of the deposit, will not settle more than 1 in. The differential settlement between this and any other footing then cannot exceed 1 in. and, in reality, will rarely exceed 2 in. A differential settlement of this amount be- tween adjacent columns in ordinary struc- tures is generally considered tolerable (Art. 17.3) and, in fact, is the principal criterion on which the design procedure has been established .
After the dimensions of each of the smaller footings have been determined on the basis of the soil pressure selected for the largest footing, Fig. 19.3 is entered with the width B and the appropriate value of D , / B of each of the smaller footings to check whether the allowable soil pressure for that footing may be governed by bearing capacity; i.e., whether the value of B corresponds to the left-hand rising branch of the design curve. If it does, the footing must be repropor- tioned for the smaller pressure. The water table correction appropriate to the new width of footing should be made. A footing having dimensions governed by bearing capacity may settle less than 1 in., but it is unlikely that the settlement will be smaller than f in. Hence, the differential settlement of the building will still be within the cus- tomary tolerable limits.
Copy
right
ed M
ater
ial
Copyright © 1974 John Wiley & Sons Retrieved from: www.knovel.com

314 19/Fmndations on Sand and Sonplastic Silt
The procedure just described inherently takes into account the normally erratic vari- ations in the relative density of natural sand deposits. If there are no significant trends in the average N-values from one part of a site to another, but only erratic variations, the procedure may be used without modification. On the other hand, if the site is underlain by several deposi- tional units of significantly different average relative density, it should first be subdivided into regions each of which may be regarded as having reasonably consistent properties, and the soil pressures for the footings in each region should be determined sepa- rately.
In all the foregoing discussion it has been assumed that the N-value from the stand- ard penetration test gives at least a rough indication of the behavior of the sand, al- though the limitations are numerous and have been emphasized. Yet the greatest source of error in the use of N-values is that they may not actually represent the results of the standard penetration test, con- ducted with the standard equipment in ac- cordance with the correct procedure. Be- cause nonstandard techniques and equip- ment and careless procedures are not un- common, the designer should not take for granted that reported boring logs represent the results of standard tests but should in- vestigate the procedures carefully. He should, moreover, evaluate the logs for indi- cations of doubtful or erroneous results such as those that might be caused by lowering the water level in the casing below the external water level when the drilling tools are removed from the hole (Art. 5.4).
Footings with Eccentric Loading. Beneath re- taining walls and some other types of struc- tures subjected to lateral loads, the calcu- lated distribution of pressure against the base may be triangular (Fig. 19.7). The soil pressure q c at the toe is then twice the average pressure. Therefore, the toe pres- sure is likely to govern the design. Theo- retical and experimental information is available (Meyerhof, 1953) for estimating
FIGURE 19.7. Diagram illustrating method for estimating allowable soil pressure beneath toe of eccentrically loaded footing.
the factor of safety against a bearing capa- city failure under these circumstances, but no fully rational procedure has been de- veloped for determining the allowable toe pressure to restrict the settlement. However, inasmuch as relatively high pressures act over only part of the base, the allowable soil pressure can be estimated on the as- sumption that the effective width B of the footing is less than the real width b .
It would appear conservative and reason- able to select the allowable soil pressure by means of the procedures given in this article for concentrically loaded footings, on the assumption that the footing has a width B = b/3. The toe pressure qt should not exceed the allowable pressure determined in this manner.
ILLUSTRATIVE DESIGNS. DP l e 1 AND 19-2. FOOTINGS ON SAND
Two sets of design computations (DP 19-1 and DP 19-2) illustrate the application of the foregoing discussion of footings on sand.
Because the borings for the warehouse considered in DP 19-1 were made from the ground surface while the site was not yet graded, the effective overburden pressure will be considerably reduced before the foundations are constructed; hence, the N- values require correction. This is done for all penetration tests below footing level. For convenience, since the width B of the larger footing is not initially known, a cumu- lative average of the corrected N-values is
Copy
right
ed M
ater
ial
Copyright © 1974 John Wiley & Sons Retrieved from: www.knovel.com

Footings on Sand
0/ 62 Depth & h/f ty CN Nfiefd NCOM No: Nfield Nc,w NO;
250 1.42 add 30 26 26 29 25 25 215 1-57 066 26 22 24 33 18 27 300 1.71 0 6 3 32 27 25 32 27 27 325 /.$5 old0 31 25 25 26 21 25 350 1.99 0 7 7 29 12 24 34 26 25 313 2./3 074 27 20 24 31 23 25 400 2.28 0172 33 24 24 29 21 24
315
83 h l d Ncom No:
35 3/ 31 27 23 27 29 24 26 31 25 26 37 28 26 27 10 25 35 25 25
Warehouse fmiinps
24:O' Ground surfuce of -
computed and tabulated as a function of depth for each boring. By inspection it is seen that the minimum average corrected N-value, irrespective of the width of the footing, is in the range 24 to 31; the corre- sponding soil pressures from the horizontal branches of the design curves (Fig. 19.3) are about 2.5 to 3.4 tons/sq f t . Hence, as a first trial, the column load of 251 tons is divided by about 2.5 tons/sq ft. The area
of roughly 100 sq ft leads to a trial value for B of 10 ft. For B equal to 10 ft, the appro- priate depths for calculating the minimum average corrected N-value are 25 to 35 ft inclusive, and N., is found to be 24, from boring B1,
In DP 19-1, the width of footing B is such that q. is determined by considerations of settlement alone. Use of the same soil pressure beneath the wall footing A would
Copy
right
ed M
ater
ial
Copyright © 1974 John Wiley & Sons Retrieved from: www.knovel.com

316 19/ Foundations on Sand and Nonplastic Silt
1 DP 19-/
f w f ~ n q A : Requtred Areo. -- Usi09 soi/ pressure found for Fmtinq 8, 36 vff /2!68 = L H ; Soy /:4: Assume thickness of ff9. /'OM; 0, = 1'65 Df/8 z&? Fmm E+. / R & , for ff- 24 und B=LM, qOaLS 5/ff '4 1.7 yft'
6 y trio/, suy 0 s i.0 ft
9 6 '/Ft/Z.O =/.80 Yff' Add Y /wd - surchur9e
LO (&/PO -O/ /4) /2
(therefore. bewin9 cupucify con ffO/S)
Check soi/ pressure :
182 ?ff*
Check min. uveru9e N-vdue for dep. _ _ 8= V be/ow ff9. (cons/&r vdues utdepths 2 5 O u n d 2Z5 f f on/y l From Borinq 0/ , Nay = 24
require a width of only 1.34 f t but, accord- ing to Fig. 19.3a, the design of a footing of this width is governed by bearing capacity and the soil pressure must be reduced. Sev- eral trials may be needed to determine the proper combination of width and allowable soil pressure to satisfy the conditions of Fig. 19.3a. I t is evident that the width will be on the order of 2 ft; therefore, only the N-values within about this depth below the footing should be included in the aver-
age. Those at depths 25.0 and 27.5 ft are appropriate; the minimum average cor- rected N-value for this range is 24 blows, from boring B 1.
DP 19-la illustrates the method of con- sidering the effect of the water table. Since the presence of the water table affects the vertical effective overburden pressure for all standard penetration tests below water level, the corrected N-values at these levels differ from those in DP 19-1. The
Copy
right
ed M
ater
ial
Copyright © 1974 John Wiley & Sons Retrieved from: www.knovel.com

Footings on Sand 317
correction factor C, (eq. 19.4) to be applied to values taken from Fig. 19.3 is found to be 0.66 and the value of qa is found to be 1.79 tons/sq ft.
The wall footing, if proportioned for the same soil pressure, would have a width of 2.0 ft. The base of the footing, located about 1.5 f t below the basement floor level, would then be about 3.5 f t above water level. As this distance exceeds the width B of the footing, no correction for water table is
needed for footing A; hence, it can be pro- portioned for the same pressure as the larger footing B.
DP 19-2 shows the influence of correcting the field N-values when the standard pene- tration tests are made at very shallow depths. The base for the structure was pre- pared by placing about 13 ft of sand fill above a natural sand deposit located be- neath the surface of a body of water. The dense original ground is at a depth too
Copy
right
ed M
ater
ial
Copyright © 1974 John Wiley & Sons Retrieved from: www.knovel.com

318
Fmti'o &sign Genera/ hfo.
19/Foundations on Sand and Nonplastic Silt
DP /9-2 Trunpfer S h d Ftgs. Sh. /of 2
27 30 25 25 41 27 Y
great to influence the behavior of the foot- ings. The wall footing is located at a depth of 3.5 ft to avoid frost action.
19.3. Rafts on Sand Soil Pressure. Because of the large size of rafts compared to that of footings, the factor of safety against a bearing-capacity failure of the underlying sand is always very great. This can be seen from eq. 19.2. If the width
of the raft i s only 20 ft, the depth of foun- dation only 10 ft, and the number of blows equal to 10 or more, the ultimate bearing capacity on submerged sand exceeds 7 tons/sq ft. With increasing width of the raft or increasing relative density of the sand, the ultimate bearing capacity in- creases rapidly. Hence, the danger that a large raft may break into a sand foundation is too remote to require consideration.
Copy
right
ed M
ater
ial
Copyright © 1974 John Wiley & Sons Retrieved from: www.knovel.com

Rafts on Sand 319
Chec& mi/ pressure : /.7 720 = 0.85 yft*
On account of the large size of rafts, the stresses in the underlying sand are likely to be relatively high to considerable depth. Therefore, the influence of local loose pock- ets distributed at random throughout the sand is likely to be about the same beneath all parts of the raft, and the differential settlement is likely to be smaller than that of a footing foundation designed for the same soil pressure. Although it is not im-
probable that a single footing may rest entirely above a pocket of loose sand and experience large settlement, a loose pocket beneath part of a raft has a much smaller influence.
Because the differential settlements of a raft foundation are less than those of a footing foundation designed for the same soil pressure, it is reasonable to permit larger allowable soil pressures on raft foun-
Copy
right
ed M
ater
ial
Copyright © 1974 John Wiley & Sons Retrieved from: www.knovel.com

320 19/ Foundations on Sand and Nonplastic Silt
dations. Experience has shown that a pres- sure approximately twice as great as that allowed for individual footings may be used because it does not lead to detrimental differential settlements. For a soil pressure that produces a differential settlement of i in., however, the maximum settlement of a raft may be about 2 in. instead of 1 in. as for a footing foundation.
The shape of the curve in Fig. 19.16 shows that the net soil pressure corresponding to a given settlement is practically independent of the width of the footing or raft when the width becomes large. The allowable net soil pressure for design may with sufficient accuracy be taken as twice the pressure indi- cated by the horizontal lines in Fig. 19.3. The corresponding relation between allow- able net soil pressure and N is
q. (tons/sq ft) = 0.22N (5 Z N ? 50) 19.5
The correction factor for the presence of the water table is given by eq. 19.4. For values of N > 50, the linear relation expressed by eq. 19.5 becomes somewhat unconservative. Moreover, N-values of this magnitude may be associated with the presence of gravel or boulders, or with cementation. Hence, they should be scrutinized carefully to permit judging whether the routine procedure de- scribed in this paragraph is applicable to the actual conditions.
The values of qa from eq. 19.5, with ap- propriate corrections, serve as a rational basis for the design of a raft foundation on sand under most conditions encountered in the field. They may be increased somewhat if bedrock is encountered at a depth less than about one half the width of the raft.
If the average value of N after correction for the influence of overburden pressure is less than about 5, the sand is generally considered to be too loose for the successful use of a raft foundation. Either the sand should be compacted or else the foundation should be established on piles or piers.
The loads that should be considered in computing the gross soil pressure on the raft are the dead load of the structure including
the raft, and the maximum live load that is really likely to be active. The surcharge due to the weight of the soil between the surrounding ground surface and the base level of the foundation is subtracted from the gross pressure to obtain the net soil pressure for comparison with the allowable soil pressure. That is, the net soil pressure at the base of the raft is
where Q = total weight of structure plus
A = base area of raft qb = gross soil pressure or contact
pressurc at base of raft
live load
A raft-supported building with a base- ment extending below water table is acted on by hydrostatic uplift or buoyancy equal to yw(D/ - D,) per unit of area. The beneficial effect of the buoyancy is auto- matically taken into account in calculating the net pressure, provided the total weight of the surcharge yDf is used in eq. 19.6. In many instances, however, the settlement is governed by conditions during construction rather than by those prevailing after completion.
During construction of the substructure the water table is usually drawn down below the base of the raft. If it then rises to a higher level, the gross soil pressure is reduced by the uplift of the full head of water on the base. Simultaneously, the effective weight of the surcharge is reduced by the same amount. Hence, the actual net pressure is not influenced by the buoyancy. The allow- able net pressure, however, is a function of the water-table correction.
If the soil pressure is chosen in accordance with the foregoing procedures and if the corrected value of N is not less than about 5, the differential settlements between adja- cent columns on a raft foundation on sand will not exceed about 3 in., provided the base of the raft is located at least 8 ft below
Copy
right
ed M
ater
ial
Copyright © 1974 John Wiley & Sons Retrieved from: www.knovel.com

Piers on Sand 321
the surrounding ground surface. Experience has shown that, if the surcharge is less than this amount, the edges of the raft settle ap- preciably more than the interior because of the lack of confinement of the sand.
ILLUSTRATIVE PROBLEM
A reinforced concrete structure 100 ft square is to be supported by a raft with its base 16 f t below the surrounding ground surface. The subsoil consists of sand to great depth. Five borings have been made at the site; the average N-values, corrected for the influence of the overburden pressure, are respectively 36, 30, 32, 35, and 33. The average unit weight of the sand is 114 lb/ cu ft. While test-boring was in progress, the water level was at a depth of 5 ft. During construction the water level will be lowered to 20 ft, but upon completion of the struc- ture the level will return to its original position. What total load, including the weight of raft, structure, and contents, may be supported at a settlement not to exceed 2 in.; that is, at a differential settlement not to exceed in.?
According to eq. 19.5, the al- lowable net soil pressure for a value of N = 30 would be
Solution.
q. = 0.22 x 30 = 6.6 tons/sq f t
if the water table were at great depth. The water table correction is
Dw C, = 0.5 + 0.5 - Df + B
5 16 + 100
= 0.5 + 0.5 X
= 0.5 + 0.02 = 0.52
Hence, the allowable net pressure is 6.6 X 0.52 = 3.4 tons/sq ft. The surcharge YDf = 114 x 16/2000 = 0.91 ton/sq f t . The corre- sponding gross pressure or contact pressure that would lead to a 2-in. settlement is, therefore, 3.4 + 0.9 = 4.3 tons/sq ft, and the total weight that can be supported is 4.3 X 1002 = 43,000 tons.
The total weight that will produce a settlement of 2 in. should, of course, be in- dependent of whether the calculations are based on total or effective stresses. In the preceding paragraph a total-stress calcula- tion is illustrated, in accordance with eq. 19.6. On the basis of effective stresses, the surcharge is only
+ (1 14 - 62.5)( 16 - = 0.57 ton/sq f t
This value is 0.91 - 0.57 = 0.34 ton/sq f t less than that calculated on the basis of the total weight of the surcharge, and the net capacity of the raft is decreased by the same amount. At the same time, however, the raft is buoyed up by the hydrostatic uplift on its base equal to
X 62.5(16 - 5) 1
r w ( D f - 0,) = - 2000 = 0.34 ton/sq f t
and the downward load of the structure can be increased by the amount of the buoyancy. Hence, the total weight that can be sup- ported remains 4.3 tons/sq ft.
19.4. Piers on Sand Conditions for Use of Piers. Piers may be es- tablished on a bed of dense sand at a con- siderable depth below the ground surface if the overlying materials are too soft or compressible for the support of the structure or if they may be removed by scour. In these respects, the conditions under which pier foundations are appropriate are similar to those for piles (Art. 19.5), and the choice between piers or piles depends primarily on economy and on certain details that influ- ence the construction procedure. For ex- ample, if the overlying material contains organic deposits that include trunks of trees, or if there are likely to be numerous large boulders above the bearing stratum, it may not be possible to drive piles to the
Copy
right
ed M
ater
ial
Copyright © 1974 John Wiley & Sons Retrieved from: www.knovel.com

322 19,fFoundations on Sand and Nonplastic Silt
necessary depth. Under these conditions, a pier foundation may be indicated. On the other hand, the excavation for a pier is likely to lead to some loosening of the sand deposit on which the structure is to rest, whereas driving piles into the sand tends to compact the bearing stratum. Because of these conditions, a pile foundation may be preferable.
I t is also sometimes necessary to excavate piers through sand to reach bearing on rock or other firm material. The conditions to be considered under these circumstances are discussed in Chaps. 13, 2 1, and 22.
Bearing Capacity and Settlement of Piers. The ultimate bearing capacity of piers exceeds that calculated on the basis of eq. 19.2 be- cause the shearing resistance along the sur- face bd through the surcharge (Fig. 19.4) is no longer negligible, as assumed in the derivation of eq. 19.2. However, if the ma- terial above the level of the base of the piers is weak or compressible, the increase in bearing capacity may be small. Moreover, if there is a possibility that the surrounding material may even occasionally be removed by scour, its beneficial influence must be neglected. Therefore, in general, it is con- servative and justifiable to determine the safe bearing capacity by means of eq. 19.2 with an appropriate factor of safety.
The settlement of a pier under a given net soil pressure is less than that of a shallow footing on sand of comparable relative den- sity because of the confining pressure due to the weight of the surrounding material. However, at the comparatively large depths associated with piers, the confining pressure also correspondingly increases the N-values in the standard penetration test, as indi- cated by eq. 5.3 or Fig. 19.6. Hence, unless the final level of the ground surface differs greatly from that a t the time the standard penetration tests were made, the allowable soil pressure may be obtained by entering the horizontal portions of the design curves, Fig. 19.3, with N-values uncorrected for the confining pressure. The steep left-hand por- tions of the design curves may be ignored because the requirements for bearing capa-
city will have been checked separately by application of eq. 19.2. The values of q. from Fig. 19.3 must, of course, be corrected for the position of the water table by means of eq. 19.4. The soil pressure determined in this manner should not be increased above that permissible for shallow footings if scour may remove most of the surcharge. Moreover, if the soil surrounding the upper portion of the piers is compressible, and if fresh fill is placed after construction of the piers, it may be necessary to take into ac- count the negative skin friction or drag forces described in Art. 12.8.
In many instances the weight of a con- crete pier itself is a large fraction of the total load transferred by the pier to the sand, but the settlement that occurs before the pier is completed may be of no significance. The bases of tall pier shafts supporting bridge spans, for example, may be allowed to settle appreciably, while the concrete of the shafts is being placed, with no detrimental effects. Under these circumstances the weight of the pier can be subtracted from the total net load before the base area is determined by the procedures described in the preceding paragraph. The requirements for an adequate factor of safety, however, must be satisfied for the total net load, in- cluding the weight of the pier.
19.5. Piles in Sand Use of Piles in Sand. (1) Piles may be driven through soft or compressible materials into a layer of dense sand to which they may transfer the weight of the structure. (2) They may be driven into loose sand to com- pact it and increase its bearing capacity. (3) They may be driven into a bed of sand to establish the foundation below the great- est depth to which the sand may be re- moved by scour.
Piles Driven to Bearing in Dense Sand. When the material directly beneath foundation level is too compressible or unstable to s u p port the foundation, the weight of the struc- ture should, if possible, be transferred to a more suitable stratum at a lower level. If this stratum consists of sand, piles are often
Copy
right
ed M
ater
ial
Copyright © 1974 John Wiley & Sons Retrieved from: www.knovel.com

Piles in Sand 323
driven through the soft materials and far enough into the sand to develop adequate carrying capacity. If the sand is moderately loose, the piles may have to be driven into it for a considerable distance. If it is fairly dense, it may not be possible to obtain more than a few feet of penetration. In either event, the support provided to the piles by the sand is derived partly from the resistance of the point to further penetration and partly from skin friction between the lower part of the piles and the sand.
I t is not usually possible on the basis of the results of laboratory soil tests to make an accurate estimate of the load that can be carried by a pile driven through soft materials into a deposit of sand. The most reliable information is obtained by means of load tests. In deposits of this type, the shape of the load-settlement curve for a single pile is similar to that shown in Fig. 12.86. Unless the pile fails structurally, which is unlikely, the load-settlement curve approaches an inclined tangent. Hence, the pile does not fail by plunging into the ground, but merely continues to settle or to penetrate into the sand as the load is in- creased. The limiting load for design must therefore be based on the value of settle- ment that may be considered tolerable. The procedures for conducting and interpreting the load tests are discussed in Art. 12.4.
Prediction of the depth to which piles must extend into the sand to develop the required eapacity is also fraught with un- certainties. The most satisfactory procedure, except for conducting a series of load tests on piles of different lengths, is to determine the necessary depth on the basis of the penetration record of the piks during driving. Since almost all the driving resist- ance is derived from the sand, and since the static and dynamic resistances are approxi- mately equal for all but the finest sands and silts, use of the wave equation provides a reliable means for determining the resist- ance to penetration required for the postu- lated capacity of a given pile driven by given equipment. Studies can also be carried out to ascertain the most efficient combina-
tions of pile and driving equipment to achieve the desired results.
Beneath several of the large cities of Holland, extremely soft materials such as organic silt or peat rest directly on sand. Under these circumstances, a satisfactory approximation to the ultimate point resist- ance per unit of cross-sectional area of the precast concrete piles widely used in that country has been found to be the static penetration resistance per unit of area of the Dutch cone (Art. 5.4). The cone values are averaged over a depth of about two pile diameters below the point of the pile (Van der Veen, 1953; Van der Veen and Bo- ersma, 1957).
If the soil above the sand is capable of de- veloping a significant amount of freeze, the influence of the freeze on group action, neg- ative skin friction, and load-test techniques is comparable to that previously discussed in Art. 18.5 in connection with point-bear- ing piles passing through similar materials to bearing in stiff clays. In particular, if part of the dynamic resistance of a single pile is developed in the overlying soft layers, this resistance should not mislead the engi- neer into believing that the bearing capa- city of the pile under static load in the foun- dation will be as great as the load-test value.
Compaction Piles. Driving piles into a bed of loose sand compacts the material, partly be- cause of the decrease in void ratio necessary to compensate for the volume of the piles and partly because of the compacting effect of the vibrations produced by pile driving. Once the piles are driven, the settlements of the structure are approximately the same as those estimated according to the proce- dures described for footings and rafts on relatively dense sand.
Inasmuch as the purpose of compaction piles is merely to increase the density of the sand, the structural strength of the piles themselves is of little consequence. Indeed, it may be sufficient to make a hole by driving and removing a spud having the shape of a pile, and to fill the hole with com- pacted sand. By this procedure the density
Copy
right
ed M
ater
ial
Copyright © 1974 John Wiley & Sons Retrieved from: www.knovel.com

324 19/Joundations on Sand and Nonplastic Silt
of the foundation material is increased but no piles remain in the ground. Bulbous un- cased piles of the Franki type are also widely used for compacting loose sands.
Ordinarily, piles with a heavy taper are most effective and economical. If the struc- ture is to rest on pile footings, the piles should be driven in groups and the inner- most piles in each group driven first to achieve the maximum and most uniform compaction beneath the location of each footing. If the structure is to rest on a pile- supported raft, the piles should be spaced uniformly over the entire area.
The design load to be assigned to com- paction piles is necessarily somewhat arbi- trary. If the piles are driven to equal pene- tration per blow of the hammer, they are likely to be of progressively shorter lengths because each pile is driven into sand com- pacted somewhat more by the preceding pile. Moreover, if driving of the first pile in the cluster is discontinued at a relatively low driving resistance, resumption of driving after the neighboring piles are installed is likely to indicate an increased resistance because of the increase in relative density and confining pressure associated with driving the neighboring piles.
On small jobs, loads of 20 tons are usually assigned to compaction piles of timber and 30 tons to those of cast-in-place or precast concrete. The piles are usually driven to the corresponding capacities as indicated by the Engineering News formula (eq. 12.1). Use of the formula does not imply a knowl- edge of the actual carrying capacity of the piles, but merely provides a convenient criterion to indicate when adequate com- paction has been achieved and to guard against overdriving. On larger jobs a test group of several piles should be driven. The center pile of the group should be driven first; it should be driven to a capacity, as indicated by the wave equation and the driving record for the pile, somewhat less than the capacity desired for the job. As the remaining piles in the test group are driven, their driving records should also be ob- tained. They should be driven to the same
penetration per blow as the center pile. When the entire group has been installed, the center pile should be driven further by the same hammer and its capacity judged on the basis of the redriving record. The information will permit selection of the ap- propriate driving criteria for the project. After the center pile is redriven, it should be subjected to a load test to verify the equiva- lence of the actual capacity and that deter- mined from the wave equation.
The length of compaction piles is also difficult to predict. I t decreases markedly with increasing taper. Piles of 20- to 30- ton capacity, having a taper of 1 in. in 2.5 ft, rarely penetrate more than 25 ft even in loose sand.
Piles in Very Fine Sand and Silt. In the fore- going discussions it has been assumed that the sand into or through which the piles are driven is pervious enough to permit dis- sipation of the pore pressures due to driving almost as rapidly as they develop. This con- dition is not satisfied in fine sands and silts. The consequences depend on whether the soil is loose or dense. As successive piles are driven into such soils in a loose state, the pore pressures accumulate, reduce the effec- tive stresses between the particles, and cor- respondingly reduce the shearing resistance of the soil. If the pore pressures become large enough, the soil is transformed into a viscous liquid in which previously driven piles are readily displaced laterally and upward. Timber or hollow-shell piles may in extreme cases actually float. Such be- havior is especially undesirable if the piles are intended to derive their support from an underlying bearing stratum. To avoid such difficulties, it is advantageous to use types of piles that displace the smallest pos- sible volume of soil. If the fine sand or silt is to be densified by compaction piles, it may be necessary to reduce the rate of progress of the job drastically to allow time for drainage; otherwise the pile driving merely converts the soil into a sea of mud. Nevertheless, if the piles can be driven, even with difficulty, dissipation of the pore
Copy
right
ed M
ater
ial
Copyright © 1974 John Wiley & Sons Retrieved from: www.knovel.com

Excavation in Sand 325
pressures may be accompanied by sub- stantial freeze and a satisfactory foundation may result.
If the fine sand or silt is dense, it may prove highly resistant to penetration of the piles because of the tendency for dilatancy and the development of negative pore pres- sures (Art. 4.7) during the shearing dis- placements associated with insertion of the piles. Analysis of the driving records by means of the wave equation may indicate high dynamic capacity, but instead of freeze, large relaxations may occur. An in- dication of the relaxation can be obtained from a wave analysis of redriving data ob- tained after the pore pressures have come to equilibrium, but i t is preferable to base the evaluation on load tests.
Piles for Prevention of Failure Due to Scour. The bases of bridge piers located near the chan- nels of rivers must be established below the level to which the river bottom is removed by scour during floods. In many streams, the depth of the river increases during floods at a rate greater than that at which the crest of the river rises. Moreover, since bridges are often located where the channel is narrow, the depth of scour is likely to be greater than average. Finally, the construc- tion of the piers and abutments usually causes additional constriction of the channel and itself incfeases the depth of scour.
No universal rule can be given for esti- mating the maximum depth of scour in a stream with a bottom of sand or silt. Several records indicate depths of as much as 4 f t for each foot of rise of the water, and in some streams the ratio is knowfi to be as great as 7. On the other hand, in the ma- jority of rivers the depth is much less. Ex- perience with a given strqam is the best guide in estimating the depth of scour.
In many instances, the sands in the bottom of a river channel are relatively dense, and it is difficult,or impossible to drive piles to adequatq depth without the use of a water jet.
Uplift Resistance of Piles in Sand. The resist- ance to uplift of a pile driven into sand de- pends on the relative density of the sand,
the length, diameter, and taper of the pile, the use or absence of jetting, and several other factors. For this reason reliable values of the uplift resistance can be obtained only by means of load tests.
As a rough guide, the resistance of a straight-shafted concrete pile driven without jetting is likely to be at least ftKyL2 tan 4 times the perimeter of the pile, where L is the embedded length of the pile and 4 the friction angle of the sand. The coefficient K varies from about 1.0 for a loose sand to over 3 for a dense sand. Somewhat smaller uplift resistances can be anticipated for steel piles, for piles with a taper, or for piles jetted before being finally driven (Ireland, 1957). The uplift resistance can be destroyed if the body of sand in which the piles are driven is saturated and is loose enough to lose its strength because of accumulated pore pressures during repeated applications of stress as in an earthquake (Art. 4.10). Under these conditions structures such as sewers may rise in spite of hold-down piles.
19.6. Excavation in Sand Sand Above Water Table. NO construction problems of consequence are encountered in making excavations for footing or raft foundations in sand above the water table. Slopes of 1 vertical to l i horizontal are stable under all circumstances unless the sand deposit is underlain at shallow depth by soft clay, and steeper slopes are com- monly used if the sand possesses a small amount of cohesion due to capillary mois- ture or cementing agents.
Large Excavations Below Water Table. If ex- cavations for a basement or for the estab- lishment of a foundation must extend below water table in sand, the water level must be lowered. This may be done either by pump- ing the water out of the excavation itself, or by predrainage of the site.
When the water is removed by pumping from an open excavation, ditches must be cut in the bottom to lead the water to a sump at a lower level than the rest of the excavation. The water level must be main- tained in the sump at a low enough eleva-
Copy
right
ed M
ater
ial
Copyright © 1974 John Wiley & Sons Retrieved from: www.knovel.com
326 19/Foundations on Sand and Nonplastic Silt
tion to keep the free water surface in the surrounding sand below the bottom of the excavation at every stage. If this cannot be accomplished, the bottom of the excavation becomes quick. Water appears in the form of springs, the sand begins to boil, the slopes may begin to slough, and the entire base of the excavation may rise. The ditches around the edge of the hole must be kept clear to prevent water from emerging near the toe of the slopes and causing the banks to collapse.
The preceding statements indicate that pumping from sumps may be a hazardous procedure. In loose or fine sands, it some- times cannot be accomplished at all. In coarse or dense sands, excavations can often be made with success, but, if conditions get out of control and the bottom becomes quick, the sand beneath the entire founda- tion may be loosened and its bearing capa- city permanently decreased. Therefore, on large jobs, the sand is usually drained before excavation, either by means of single-stage or multiple-stage well points or by deep-well pumps (Chap. 9).
The quantity of water that must be pumped is a matter of importance because sufficient equipment should be provided at the beginning of the job to guarantee effi- cient removal of the water without the nec- essity for making additions and alterations. Inadequate pumping capacity may lead to sand boils and instability of the bottom of the excavation.
The quantity of water that must be pumped depends on the coefficient of per- meability of the soil, the distance the water level must be lowered, and the dimensions of the area to be dewatered. If the excava- tion is fairly narrow and if the water table does not need to be lowered more than 15 ft, medium to fine sands can usually be drained by a series of well points spaced at about 3 f t with one 6-in. pump for every 500 f t of cut. Each pump requires a motor of about 20 hp, and drainage is likely to take from 2 to 6 days.
Estimates of the quantity of seepage under more severe conditions may require pump- ing tests to determine the coefficient of per-
meability and demand the exercise of con- siderable judgment based on experience.
The time required to accomplish drain- age depends on the coefficient of perme- ability of the sand deposit. Only 2 or 3 days are necessary for relatively permeable soils (k greater than lo-* cm/sec) whereas sev- eral weeks may be required for soils of moderate permeability (k = lo-' to low5 cm/sec). Silty sands and other materials having an effective size smaller than about 0.05 mm cannot be drained by ordinary well-point equipment, although somewhat finer soils can be drained if the pumps are capable of maintaining a vacuum in the system (Fig. 9.4).
Establishment of Piers Below Water Table. Piers may be carried below water level in open shafts or by means of caissons. The general techniques for making the excava- tions have been described in Chap. 13. Ex- cavation of an open shaft through sand below water table may often be accom- plished by pumping from sumps if the sand is of medium to high density. However, the sand is likely to be loosened and, conse- quently, its bearing capacity impaired. Use of well points or deep wells before ex- cavation is usually preferable.
When shafts are excavated by hand and kept dry by the use of sumps, the lining is commonly made of pervious material so that the small amount of water that seeps to the excavation from the sides can enter the shaft and be collected in the sump. This prevents the development of a head of water outside the shaft that may lead to the forma- tion of boils or springs at the bottom of the lining.
Large-diameter bore holes through sand may be stabilized by keeping them filled with a clay slurry similar to drilling mud. If the sand overlies an impervious soil, casing may be set in the holes and sealed int; the impervious material, whereupon the slurry may be pumped out and the hole continued in the dry (Art. 13.3).
Open caissons are commonly used to es- tablish bridge piers. The sand is removed from the caissons by dredging. T o prevent
Copy
right
ed M
ater
ial
Copyright © 1974 John Wiley & Sons Retrieved from: www.knovel.com

Effect of Vibrations 327
the rise of sand in the bottom of the caissons, the water level inside should be maintained at a considerable height above the free water surface outside. By this procedure, the flow is maintained downward through the sand at the bottom of the caisson, and the ma- terial is not loosened by excavation.
If the excavation cannot be made by means of an open caisson, it may be carried out under compressed air. Since the pres- sure of the air in the working chamber is always greater than that of the water at a given depth, the sand is not loosened during the procedure, and the bearing capacity of the sand is not impaired.
19.7. Effect of Vibrations
Importance. Vi bra tions cons ti tu te the most effective means for compacting deposits of loose sand. By the same token, they con- stitute one of the most serious causes of ex- cessive settlement of foundations located on loose sands.
Compaction. If the relative density of a deposit of sand is too low for the establishment of a raft or footing foundation, it may be in- creased by several means. One of these is the driving of compaction piles. Another is the use of a patented method known as the vibroJotation process. According to this method, a heavy steel capsule containing an internal vibrator is lowered into the deposit of sand. At the same time, powerful jets of water are forced into the sand beneath the capsule. Under the combined action of jetting and vibration the device sinks rapidly and creates a crater at the ground surface. As the crater develops, it is filled with sand. Compaction to the depth of penetration for a diameter of 6 to 8 ft is generally quite satisfactory. The procedure may, under some circumstances, be less ex- pensive than driving piles. I t is most effec- tive in clean medium to coarse sands, but is not effective in silty sands or silts.
Somewhat similar results have been ob- tained without jetting by repeatedly in- serting and removing a steel pipe attached to a low-frequency vibratory pile driver;
the spacing of the points of insertion may have to be as close as 3 ft.
Settlement. Many types of machines subject the subsoil to periodic vibrations; these in- clude air compressors, diesel engines for production of electric power, and turbo- generators. The amplitude of the vibrations and the accompanying settlement of the foundation for such a machine depend for a given installation on the frequency. Near a critical frequency the amplitudes may be greatly reinforced by a phenomenon related to resonance. Hence, especially if the sub- soil consists of loose sand, a resonant condi- tion must be avoided if possible. Unfortu- nately, the critical frequency is a function not only of the properties of the sand, but also of the weight, dimensions, and contact area of the exciting mass, including its foundation. The factors affecting the critical frequency and their relationships are com- plex and not yet fully investigated. Hence, the design of substructures to reduce settle- ment due to vibrations in sand calls for much judgment and experience. Reduction of the allowable soil pressure is relatively ineffective in decreasing the ultimate settle- ment. In some instances, machine bases are constructed with very large dimensions so that they are capable of absorbing much of the energy. In other instances, piles or piers may be preferable.
Repeated vibrations or impact at fre- quencies other than in the resonant range may also eventually produce large cumula- tive settlements, even on sands of moderately high relative density. Moreover, settle- ments are likely to be greater if the ground- water table is high. In one instance, im- pact loadings in a steel mill caused a cumu- lative settlement of 9 in. over a period of about 12 years. The water table was then lowered from a depth of 10 ft to 20 ft, where- upon the settlements were arrested. How- ever, nine years later the groundwater rose to about the original level and the same rate of settlement was again observed.
Settlements caused by vibrations due to construction are discussed in Art. 16.2.
Copy
right
ed M
ater
ial
Copyright © 1974 John Wiley & Sons Retrieved from: www.knovel.com

328 19/Foundations on Sand and Nonplastic Silt
PROBLEMS
1. Select the width of the square footing shown in part u of the figure, below, to suit the subsoil conditions represented by the boring log (part b of the figure), and to satisfy the following conditions: u . Tolerable settlement 1 in. under full
dead load and 50 per cent live load. b. Factor of safety equal to 2 for dead
load plus 50 per cent live load. Ignore the correction of N-values due to the effect of overburden pressure. The unit weight of the cinder fill is 80 lb/cu f t and of the sand is 120 lb/cu ft.
coarse
Ans. 6.5 ft. 2. Estimate the settlement of the footing
shown below. Compute the factor of safety against a bearing-capacity failure. The unit weight of the sand is 120 lb/cu ft. The N-values have been corrected for overburden pressure.
400"
5
A m . 1.3 in.; 4.4.
3. If the footing shown below is not to settle more than 1 in., what is the maximum load it can carry? The N-values have been corrected for overburden pressure.
a; f20 /b/CU f f ,
L 8'O"Sqvare~
Coarse sund-av: N= 20b/ows/ft
Ans. 139 tons. 4. A footing 5 ft square and 1.5 f t thick is
to be located on sand. The surface of the ground is at the top of the footing and the water table is 10 ft below the base. What should be the minimum average N-value of the sand if the footing must support a column load of 200 kips with- out u . experiencing a settlement of more
than 1 in. or b. possessing a factor of less than 2
against a bearing-capacity failure? Ans. 37 blows/ft corrected for effect of
overburden pressure; 25 blows/ft uncor- rected. 5. A footing 12 f t square and 2 f t thick is
supported by sand with an average N value of 30 blows/ft. The surface of the ground is 3 f t above the top of the footing, and the water table is 4 f t below the base. Compute the maximum load that the footing can support if the settlement must not exceed 0.5 in.
Ans. 181 tons. 6. A continuous wall footing is 2 f t wide
and 9 in. thick. The ground surface and water table are at the top of the foot- ing. The underlying sand has an N- value of 30 blows/ft, after correction for the influence of overburden pressure. What load will the footing support if the settlement is not to exceed 1 in. and the factor of safety against bearing capacity failure is not to be less than 2? Does
Copy
right
ed M
ater
ial
Copyright © 1974 John Wiley & Sons Retrieved from: www.knovel.com

Suggested Reading 329
settlement or bearing capacity govern the load?
Ans. 1.75 tons/lin f t ; bearing capacity. 7. A raft 30 ft wide and 50 ft long is to be
supported 10 f t below the surface of the surrounding ground. The soil has been explored by means of the standard pene- tration test in four borings, each of which encountered rock at 40 f t . The borings indicate that the subsoil is a fairly uniform very fine sand. The mini- mum average penetration resistance in any boring between depths of 10 and 40 f t , after correction for the influence of overburden pressure, is 19 blows/ft. The water table is located 10 to 12 ft below the ground surface; hence, it can be as- sumed that the sand below the base of the raft is completely submerged. If the structure is to have a basement, and if the soil to be excavated has a unit weight y of 100 lb/cu ft , what is the maximum soil pressure that should be allowed at the base of the raft?
Ans. 3.1 tons/sq f t . 8. A caisson for a bridge pier is 20 f t wide
and 56 f t long. I t extends 50 f t through soft clay and is supported on sand that has an N-value of 50 blows/ft. The water table is near the ground surface. If the settlement is limited to 0.5 in., what total load can be supported by the foundation? Neglect the difference between the weight of the caisson and the weight of the clay that is removed during con- struc tion.
Ans. 1540 tons.
SUGGESTED READING
An excellent article on the behavior of sand beneath loaded areas, fundamental to an understanding of the load-settlement relations, is A. VesiE ( 1 963),“Bearing Capac- ity of Deep Foundations in Sand,” Hwy. Res. Rec., 39, 112-153.
Further information is contained in: J. Feda (1961), “Research on the Bearing
Capacity of Loose Soil,” Proc. 5 Int. Conf. Soil Mech., Paris, I , 635-642.
A. Eggestad (1963), “Deformation Meas-
urements Below a Model Footing on the Surface of Dry Sand,” Proc. European Conf. Soil Mech., Wiesbaden, 1, 233-239. Re- printed in NGI Publ. 58, pp. 29-35.
The relation between size of loaded area and settlement is summarized in:
L. Bjerrum and A. Eggestad (1963), “In- terpretation of Loading Test on Sand,’’ PTOG. European Conf, Soil Mech., Wiesbaden, I , 199-203. Reprinted in NGI Publ. 58, pp. 23-27.
The evaluation of bearing-capacity fac- tors occupies a large place in the literature. The standard references include:
G. G. Meyerhof (1951), “The Ultimate Bearing Capacity of Foundations,” Cko- technique, 2, 4, 301-332. Revisions in some of the values in this paper are given in the following reference:
G. G. Meyerhof (1955), “Influence of Roughness of Base and Ground-Water Conditions on the Ultimate Bearing Capa- city of Foundations,” Gkofechnique, 5, 227- 242.
G. G. Meyerhof (1963), “Some Recent Research on the Bearing Capacity of Foun- dations,” Canadian Ceot. Jour., 1, 1, 16-26.
The validity of semiempirical procedures for design of footings on sand is considered in D. J. D’Appolonia, E. D’Appolonia, and R. F. Brissette (1968), “Settlement of Spread Footings on Sand,” ASCE J . Soil Mech., 94, SM3, 735-760. Discussions ap- pear in Vol. 95, No. SM3, pp. 900-916 and Vol. 96, No. SM2, pp. 754-762. The in- formation in these references has been in- corporated into the design rules given in this chapter.
A useful discussion of deep foundations, particularly piles, is included in the general report on that subject at the Montreal con- ference of the Int. SOC. of Soil Mech. and Found. Eng., by A. KCzdi (1965), “Deep Foundations,” Proc. 6 Int. Conf. Soil Mech., Montreal, 3, 256-264. Empirical data re- lating the settlement of pile groups to the size of the group appears in a short discus- sion by A. W. Skempton (1953), Proc. 3 Int. Conf. Soil Mech., Zurich, 3, 172. Further information on group behavior is found in A. Vesik (1969), “Experience with Instru-
Copy
right
ed M
ater
ial
Copyright © 1974 John Wiley & Sons Retrieved from: www.knovel.com

330 19/ Foundations on Sand and Nonplastic Silt
mented Pile Groups in Sand, ASTM Spec. Tech. Publ. No. 444, pp. 177-222.
Attempts. to calculate the capacity of piles in sand, taking into account the taper, roughness, and volume of the piles, are dis- cussed and evaluated in R. L. Nordlund (1963), “Bearing Capacity of Piles in Co- hesionless Soils,” ASCE J . Soil Mech., 89, SM3, 1-35. The references include many of the published load-test data on piles in sand. The relation between skin friction and point resistance for six piles in sand is described in A. H. Hunter and M. T. Davisson (1969), “Measurement of Pile Load Transfer,” ASTM Spec. Tech. Publ. No. 444, pp. 106-117.
Instructive foundation projects in sands are described in the following papers:
J. D. Parsons (1959), “Foundation In- stallation Requiring Recharging of Ground water,” ASCE J. Constr. Div., 85, C02, 1-21.
J. D. Parsons (1966), “Piling Difficulties in the New York Area,” ASCE J . Soil Mech., 92, SM 1 , 43-64. Includes experiences with inorganic silts.
C. I. Mansur and R. I. Kaufman (1960), “Dewatering the Port Allen Lock Excava- tion.” ASCE J. Soil Mcch., 86, SM6, 35-55.
T. J. Lynch (1960), “Pile Driving Ex- periences at Port Everglades.” ASCE J . Soil Mech., 86, SM2, 41-62. Settlements of
piles due to pile driving in calcareous sands. Improvement of the properties of sand is
discussed in: C. E. Basore and J. D. Boitano (1969),
“Sand Densification by Piles and Vibro- flotation,” ASCE J. Soil Mcch., 95, SM6, 1 303- 1 323.
E. D’Appolonia, C. E. Miller, Jr., and T. M. Ware (1953), “Sand Compaction by Vibroflotation,” Proc. ASCE, 79, Sepa- rate No. 200, 23 pp.
D. J. D’Appolonia, R. V. Whitman, and E. D’Appolonia (1969), “Sand Compaction with Vibratory Rollers,” ASCE J. Soil Mech., 95, SM 1 , 263-284. Extensive refer- ences.
D. C. Moorhouse and G. L. Baker (1969), “Sand Densification by Heavy Vibratory Compactor,” ASCE J. Soil Mcch., 95, SM4, 985-994.
Two papers regarding scour at bridge piers are assembled in a single publication:
P. G. Hubbard (1955), “Field Measure- ment of Bridge-Pier Scour,” Proc. Hwy. Res. Bd., 34, 184-188.
E. M. Laursen (1955), “Model-Proto- type Comparison of Bridge Pier Scour,” Proc. Hwy. Res. Bd., 34, 188-193.
References under appropriate chapters of Part B also contain information about foundations on sand and silt.
Copy
right
ed M
ater
ial
Copyright © 1974 John Wiley & Sons Retrieved from: www.knovel.com


