75 Best Practice SaaS Benchmarks for your Business...
27
1 75 Best Practice SaaS Benchmarks for your Business Case | © MoveToSaaS.com A MoveToSaas E-Book 75 Best Practice SaaS Benchmarks for your Business Case
Transcript of 75 Best Practice SaaS Benchmarks for your Business...

175 Best Practice SaaS Benchmarks for your Business Case | © MoveToSaaS.com
A MoveToSaas E-Book
75 Best Practice SaaS Benchmarks for your Business Case

2 375 Best Practice SaaS Benchmarks for your Business Case | © MoveToSaaS.com 75 Best Practice SaaS Benchmarks for your Business Case | © MoveToSaaS.com
1. Contents1. Preface SaaS Benchmarks . . . . . . . . . . . . . . . . . . . . . . . . . . . . . . . . . . . . . . . . . . . . . . . . . . . . . . . . . . . . . . . . . . . 4
2. 75 Best Practice Benchmarks for your SaaS Business . . . . . . . . . . . . . . . . . . . . . . . . . . . . . . . . . . . . . . . 5
2.1Whatarethebenefitsandlimitationsofbenchmarks . . . . . . . . . . . . . . . . . . . . . . . . . . . . . . . 5
2.2HowDoIUseBenchmarkinginmyBusinessPlan? . . . . . . . . . . . . . . . . . . . . . . . . . . . . . . . . . 6
2.3WheretofindbenchmarksforyourSaaSandSoftwareBusiness . . . . . . . . . . . . . . . . . . 6
3.BenchmarkSourcesCovered . . . . . . . . . . . . . . . . . . . . . . . . . . . . . . . . . . . . . . . . . . . . . . . . . . . . . . . . . . . . . . . . 9
4.SaaSBenchmarksforyourBusinessPlan . . . . . . . . . . . . . . . . . . . . . . . . . . . . . . . . . . . . . . . . . . . . . . . . . . 11
5.SaaSBenchmarking–SalesCostandSalesTarget . . . . . . . . . . . . . . . . . . . . . . . . . . . . . . . . . . . . . . . . . 14
5.1BenchmarkstocaptureOn-TargetEarnings(OTE)ofsalesstaff . . . . . . . . . . . . . . . . . . 14
6.BenchmarkstocaptureSalesCommissions . . . . . . . . . . . . . . . . . . . . . . . . . . . . . . . . . . . . . . . . . . . . . . . . 19
7.BenchmarkstocaptureAnnualSalesTargets(Quota) . . . . . . . . . . . . . . . . . . . . . . . . . . . . . . . . . . . . . 20
8.SaaSBenchmarking–AnnualContractValue(ACV) . . . . . . . . . . . . . . . . . . . . . . . . . . . . . . . . . . . . . . . 22
9.SaaSBenchmarking–LeadCostandPipelineConversion . . . . . . . . . . . . . . . . . . . . . . . . . . . . . . . . . 25
9.1Benchmarkstogetleads . . . . . . . . . . . . . . . . . . . . . . . . . . . . . . . . . . . . . . . . . . . . . . . . . . . . . . . . . . . 25
9.2Benchmarkstoconvertleadsintocustomers . . . . . . . . . . . . . . . . . . . . . . . . . . . . . . . . . . . . . 26
10.SaaSBenchmarking–ChurnandGrossMargin . . . . . . . . . . . . . . . . . . . . . . . . . . . . . . . . . . . . . . . . . . 30
10.1 Benchmarks to retain customers . . . . . . . . . . . . . . . . . . . . . . . . . . . . . . . . . . . . . . . . . . . . . . . . . . 30
10.2Benchmarkstodeliverprofitably . . . . . . . . . . . . . . . . . . . . . . . . . . . . . . . . . . . . . . . . . . . . . . . . . . 32
11.SaaSBenchmarking–KeyMetricsPaybackandLTV/CACRatio . . . . . . . . . . . . . . . . . . . . . . . . . 33
12.SaaSBenchmarking–GeneralCost,MobileProductandCloudServicePricing . . . . . . . . 34
12.1BenchmarksforGeneralCostStructure . . . . . . . . . . . . . . . . . . . . . . . . . . . . . . . . . . . . . . . . . . 34
12.2BenchmarksforMobileProductDevelopment . . . . . . . . . . . . . . . . . . . . . . . . . . . . . . . . . . . 34
12.3BenchmarksforCloudServicesPricing . . . . . . . . . . . . . . . . . . . . . . . . . . . . . . . . . . . . . . . . . . . 35
AppendixA-SaaSBenchmarking–TopBenchmarkPublicationsandSources . . . . . . . . . . . . . . 37
A.1Lean-Case–SaaSModelsandScenariosintheCloud,2015 . . . . . . . . . . . . . . . . . . . . . 37
A.2InsightPartners–PeriodicTablesofSaaSMetrics,2014 . . . . . . . . . . . . . . . . . . . . . . . . . 38
A.3TomaszTunguz–BenchmarkingPublicSaaSCompanies,2014 . . . . . . . . . . . . . . . . . . 39
A.4PacificCrest–SaaSSurvey,2014 . . . . . . . . . . . . . . . . . . . . . . . . . . . . . . . . . . . . . . . . . . . . . . . . . 40
A.5HubSpotBlogs–YourDailyDoseofInbound,2015 . . . . . . . . . . . . . . . . . . . . . . . . . . . . . . 42
A.6Implisit–B2BSalesConversionRates,2014 . . . . . . . . . . . . . . . . . . . . . . . . . . . . . . . . . . . . . 43
A.7Totango–AnnualSaaSMetricSurveyReport,2014 . . . . . . . . . . . . . . . . . . . . . . . . . . . . . . 44
A.8TheBridgeGroup–SalesDevelopmentandInsideSalesReportsonMetrics&
Compensation,2014 . . . . . . . . . . . . . . . . . . . . . . . . . . . . . . . . . . . . . . . . . . . . . . . . . . . . . . . . . . . . . . . . . . . . . . . . . . 45
A.9InsightSquared–NewBenchmarksforInsideSalesTeams,2014 . . . . . . . . . . . . . . . . 47
A.10Xactly–SaaSIncentiveCompensationBenchmarkReport,2014 . . . . . . . . . . . . . . . . 48
A.11Salary.com–AverageSalaryRangesforSalesJobs,2015 . . . . . . . . . . . . . . . . . . . . . . . . 49
A.12ZendeskBechmark–BehavioralCuesofCustomerSatisfaction,2014 . . . . . . . . . . 50
A.13Openview–StateofB2BMobileGrowthMetrics,2015 . . . . . . . . . . . . . . . . . . . . . . . . . 51
A.14Kaseya–MSPGlobalPricingSurvey,2014 . . . . . . . . . . . . . . . . . . . . . . . . . . . . . . . . . . . . . . . 52
About the Author . . . . . . . . . . . . . . . . . . . . . . . . . . . . . . . . . . . . . . . . . . . . . . . . . . . . . . . . . . . . . . . . . . . . . . . . . . . . . 53

4 575 Best Practice SaaS Benchmarks for your Business Case | © MoveToSaaS.com 75 Best Practice SaaS Benchmarks for your Business Case | © MoveToSaaS.com
1. Preface SaaS BenchmarksThis ebook is part of a series of posts on understanding SaaSMetrics, applying SaaS
Benchmarks,buildingarecurringrevenuebusinessmodel,scalingtherightsalesplanandwin
fundingforaSaaSbusinesswithaleancase.
IwouldliketothankDavidSkokandSteveBlankfortheirworkwhichhasinspiredmetre-
mendously.WhilepresentingmyownSaaSstartupaccellstoinvestorsandVCs,Icameacross
DavidSkok’sblogsonSaaS metricsandSaasModelsandSteveBlank’sUdacityOnlineCourse
onHowToBuildaStartupusingtheLeanStartupandBusinessModelCanvasapproach.After
wesoldaccellssuccessfullytoPingIdentity,Idevelopedastrongdesiretosharemyexperience
withotherentrepreneurs.Mygoalwassimple:toincreasetheirchancesforfinancingandsuc-
cess.
ThisiswhyIstartedworkingonLean-Case,asimulationtoolforrecurringrevenuemod-
els,twoyearsago.IwantyoutoavoidthepitfallsIhaveseen,byusingtherightformulas,ap-
plyingtherightassumptions,makingthebusinesscaselookappealing,andbuildingamodel
tosupportscenariosandcontinuousanalysisandtracking.Originally,benchmarkingwasan
integralconceptinLean-CasebutIlearnedthattherewasnosinglebenchmarkingdatasource
thatLean-Casecouldleverage,butthattherewasawealthofinformationregardingbench-
marksspreadacrosstheweb.Thisishowtheideaforaseparateservicedevelopedwhichwe
havecalledLean-Marks.
BasedonourLean-CaseandLean-Marksexperience,wemarketallourexperiencewith
businessmodeling,businesscasesimulationandbenchmarkingunderMoveToSaaS.
2. 75 Best Practice Benchmarks for your SaaS BusinessThisebookprovidesSaaSentrepreneurs,BusinessManagersandInvestorswithanover-
viewoftopresourcesforSaaSandSoftwarebenchmarks.
Acrossthoseresources,wehaveselected75bestpracticebenchmarkstomakereason-
ableassumptionsinnumeroussituations…whencreatingyourSaaSbusinesscase,whenfind-
ingtherightgrowthstrategy,whentryingtounderstandyourperformanceorreviewingan
investmentproposal.YoufindallthesebenchmarksplusmanymoreonlineatLean-Marks.com.
2.1 What are the benefits and limitations of benchmarksBenchmarkingisacommonpracticeandsensibleexercisetoestablishbaselines,define
bestpractices,identifyimprovementopportunities,andunderstandhowtocompete.Bench-
marking helps companies gain an independent perspective. They can understand howwell
theyperformagainstpeers,identifyandprioritizespecificareasofimprovement,validateas-
sumptionsaswellassetperformanceexpectations.
Benchmarkingworkswellwhentheprocessbeingbenchmarkedisastandardoneand
essentially is thesameforallunits (either internalorexternal)participating in theexercise.
Forexample,it’susefultocomparethecostofdevelopingthesamewidget,providingthesame
kindofonlinesupportorusingthesamekindofcloudservice.Butbenchmarkingisnotinform-
ativewhenitisusedtocomparefundamentallydifferentprocessesorproducts.Forexample,
DropboxwouldprobablynotbenefitfromstudyingSAP’ssellingprocess,astartupwouldnot
benefitfromcomparingitschurnratewiththechurnrateofpublicSaaScompaniessuchas
SalesforceorBox.BereasonableanddonotcompareApplesandOranges–simplisticbench-
markingusingaggregatestatisticsonlyhascertainvalidity.
At MoveToSaaS,wecombinebenchmarkingwiththestrategicprocessoffindingtheright
businessfocus.SaaScompaniesmustfocusontherightmetricsforeachstageoftheirproduct
growthlifecycle.
• Early stage startupsbuildingaminimumviableproductmustfocusonchurn,featureuse,andsurvivalfinancing.
• Later stage startupsrampingupmarketingandsalesmustfocusonkeymetricslikechurn,cost-of-customeracquisition,andgrowthfinancing.
• Growth companiesscalingtheirbusinessandincreasingtheirgeographicscopemustfocusonkeymetricssuchascustomeracquisitioncost(CAC),customerlifetimevalue
(CLTV),customersegmentation,andgeographicexpansion.

6 775 Best Practice SaaS Benchmarks for your Business Case | © MoveToSaaS.com 75 Best Practice SaaS Benchmarks for your Business Case | © MoveToSaaS.com
2.2 How Do I Use Benchmarking in my Business Plan?IfIwanttoconvincepotential investorsthatmybusinessideaisviable,towhatextent
andhowshouldIuseabenchmarkingcomparisonofsuccessfulcompaniesandconsequently
shapemyplan?
Benchmarkingbasedonavailableinformationaboutsimilarcompaniesinothermarkets
canbeausefulwaytoaddgranularityandcredibilitytoyourbusinessplan.Dependingonhow
muchinformationontheseotherexamplesyouhave,applyingthebenchmarkcompanygrowth
patterns,orramp-upnumbers,ormarketpenetrationcanbeuseful.
Butbecarefulasyoudothis.Youshouldbesensitivetothefactorsyouareconsidering
becausetheycomefromadifferenttimeandadifferentmarket,andmaynotberelevantto
yourownbusiness.Berespectfulofthesedifferences,andifatallpossibleadjustyournum-
berstoreflectthem.Theseadjustmentswilladdtocredibilitytoyourplan.
We’ve seen plans and pitches in which entrepreneurs simply apply somebody else’s
growthrateorprofitabilitytotheirownprojections.Andpotentialinvestorswonderifthose
projectionsarerelevanttoyourbusiness.It’sanaturalreaction,soanticipateit.
So,yes,useresultsfromsimilarcompaniestohelpbuildyourearlyprojections.Butdoit
carefullyandwithadjustmentsforyourspecifics.Then,itwillgiveyourplancredibility.
2.3 Where to find benchmarks for your SaaS and Software BusinessTherearemanygreatsourcestofindandcheckbenchmarksonline.Theycovercountless
insightsonthegeneralbusinesseconomics,funding,salesandmarketing,customersuccessas
wellasproductandsoftwaredevelopment.
However,theyarenoteasytofind,theyonlyfocusonspecificfunctionsortopics, it is
difficulttoputthemintocontext,theycomeinPDFformatandtheycannotbesearchedand
compared.Onsuchabasis, itbecomesreallyhardtocheckthemoutandmakemeaningful
decisions.
ThisiswhywesetupLean-Marks.comtocoverthebestsourcesofpubliclyavailableSaaS
andSoftwarebenchmarksinoneplaceforthefollowingtargetgroups:
• Entrepreneurs–requirebenchmarkstounderstandtheuniteco-
nomicsofacustomer,buildtheirbusinesscase,evaluatetheirstart-
ups’performance
• OperationalExecutives–usebenchmarkstoassesstheirfunctional
performance,e.g.revenueandcustomergrowth,spendinglevels,..
• CFOs–needbenchmarkstoassesstheircompanies’performanceandgrowthplans
againstspecificpeercompanies
• Investors–havetobeabletoevaluatetheperformanceoftheirportfoliocompanies
Fig. 1: Lean-Marks
On Lean-Marks(seefigure1),youcankickoffsearchingforbenchmarkswithafulltext
search(e.g.enterthekeyword“quota”).
• Lean-Marks shows relevant results for your search (seefigure2).With the search
baronyourright,youcanrefineyoursearch(e.g.searchbybenchmarkpublicationor
searchingbyseveralkeywordcategories).
• Eachbenchmarkisreferenced,taggedandvisuallyrepresented(seefigure3).
• AllbenchmarksourcescoveredonLean-Marksenjoyhighsocialmediaactivityand
virality.Lean-Marksisyourstartingpointtodigdeeperintothem.
This ebook and the corresponding e-book provide a subset of benchmarkswhich are
availableonLean-Marks.
IfyoucomeacrossotherbenchmarksourceswhichLean-marksshouldcover,pleaselet
us know.

8 975 Best Practice SaaS Benchmarks for your Business Case | © MoveToSaaS.com 75 Best Practice SaaS Benchmarks for your Business Case | © MoveToSaaS.com
Fig. 2: Lean-Marks Search Results and Search Bar
Fig. 3: Lean-Marks Benchmark Example
3. Benchmark Sources CoveredThisistheoverviewofBenchmarkSourceswhichLean-Markscurrentlycovers.Please
refertotheappendixforanin-depthdescriptionofeachsource.
SaaSModelsandSce-
narios in the Cloud,
2015
Aggregated Benchmarks for your SaaS Business
Model
PeriodicTablesofSaaS
Metrics,2014
“PeriodicTables”ofB2BDigitalMarketingMetrics,
SaaSSalesMetricsandSaaSFinancial&Operating
Metrics
Benchmarking Pub-
lic SaaS Companies,
2014
KeybenchmarksofPublicSaaScompanies;revenue,
customersuccess,sales,quotas,etc
SaaSSurvey,2014
Growth,Salesmodels,Targetcustomers,Go-to-mar-
ketapproach,CAC,Contract,Pricing,Services,Sales
commissions,Grossmargin,OPEX,Cost structure,
Churnandretention,etc
YourDailyDoseofIn-
bound,2015
Withthepowerful,easytouse,integratedsetofap-
plications, businesses can attract, engage, and de-
light customers by delivering relevant, helpful, and
personalizedinboundexperiences
B2BSalesConversion
Rates,2014
B2BSalesConversionRates–LeadtoOpportunity,
LeadtoDeal
Annual SaaS Metric
SurveyReport,2014
SaaS and customer metrics, Acquisition, renewals
and upsells, Retention and Acquisition costs, Free
trialsvsFreemium,Churn,etc
Sales Development
and Inside Sales Re-
ports on Metrics &
Compensation,2014
TeamStructure(numberofreps,territories,experi-
ence level, average tenure, ramp up), SalesQuotas
(basis, Quota based on ACV, Average number of
deals,Quotaachievement),Salesefficiency(average
numberofdailydials,dialattemptsandconnects)
InsightSquared–New
BenchmarksforInside
SalesTeams,2014
Conversion rates, Average deal sizes, Number of
bookingsperrep,Salescycles,Saleseffort,Winrates,
Salescycles,Saleseffortetc.

10 1175 Best Practice SaaS Benchmarks for your Business Case | © MoveToSaaS.com 75 Best Practice SaaS Benchmarks for your Business Case | © MoveToSaaS.com
SaaS Incentive Com-
pensation Benchmark
Report,2014
Incentiveplandesign,Quotasize,Quotaattainment,
Salesattritionetc
AverageSalaryRanges
forSalesJobs,2015
AverageSalaryRangesforSalesJobsinSoftwareIn-
dustries
Behavioral Cues of
Customer Satisfac-
tion,2014
Customer Satisfaction by Countries, Industry, Po-
litenessofcustomers,Emailprovideretc.
State of B2B Mobile
GrowthMetrics,2015
MetricsforMobileappswhicharethenextbigwave
in B2B SaaS
MSP Global Pricing
Survey,2014
IT services that MSPs deliver on the ex-
isting and emerging types of services
they offer, incl. current service pricing and future
pricingexpectations,
4. SaaS Benchmarks for your Business PlanIfyoustartbuildingyourbusinesscase,youhavetomakeafewchoices.Areyoustarting
fromscratchandbuildingyourownExcelmodel,orcanyoureuseanoldermodelwhichyou
usedbefore,orcouldyouevenuseamodelsomeoneelsehasbuilt?Maybeyouwanttotask
expertsliketheguysatMoveToSaaStohelpyoubuildyourmodelwithsimulationandreport-
ingcapabilities.However,ifyouaresickofExcel,youcouldalsouseaservicelikeLEAN-CASE
tocreateandshareyourcase.
Inallcases,foranyoftheseoptions,youhavetodealwithbusinessassumptionswhich
typicallyfallintoafewcategories.Benchmarksinthosecategorieshelpyoutomakeyourplan
better.ForThisebook,weareapplyingthesamecategoriesasusedbytheLean-Caseservice.
Inthefollowingchapters,wedescribe
• SaaSBenchmarksforSalesCostandSalesTargetsto capture
o On-TargetEarnings(OTE)ofsalesstaff
o Salescommissions
o AnnualSalesTargets(Quota)
• SaaSBenchmarkstocalculatetheAverageContractValue
• SaaSBenchmarksonLeadCost,andPipelineConversion to capture the customer ac-
quisitionprocesswithcostofleadsandpipelineconversionparameters
• SaaSBenchmarksonChurnandGrossMargintokeep-and-growcustomersandcap-
turethecustomerretentionprocesswithchurnandexpansionratesandtheprofit-
abilityofservicedeliverywithgrossmargins
• SaaSBenchmarksonKeyMetricssuchasCustomerAcquisitionCost(CAC),Custom-
erLifetimeValue(CLTV),PaybackandtheCLTV/CACRatio
• SaaSBenchmarksonOpex,ProductdevelopmentandCloudServices
Inaddition,pleasechecktheappendixformoredetailsonallTopSaaSBenchmarkPubli-
cationsandSources whichwehaveleveragedinthisebook.
Foreachchapterabove,wehaveselectedagroupdofrelevantbenchmarks.Eachbench-
markisdescribedinthesamestructureprovidingyouashortdescriptionwithdeeplinksas
showninthefigurebelow.

12 1375 Best Practice SaaS Benchmarks for your Business Case | © MoveToSaaS.com 75 Best Practice SaaS Benchmarks for your Business Case | © MoveToSaaS.com
Fig. 4: Example – Benchmark descriptions
LeanMarksprovidesyouthebenchmarksource,thebenchmarkdescription,themajor
messagebehindthebenchmarksandtagswhereyoufindsimilar benchmarks.Atanytime,you
canclickonthelinkstofindadditionalinformationprovidedonLean-Marks.
Fig. 5: Lean-Marks Benchmark Example
IfyouwanttolookupdefinitionsofSaaSMetricswhilereadingthroughthebenchmarks,
pleaserefertoourpost LeanSaaSMetrics–TheDefinitiveGuidetocreatebusinessimpact.
FeelfreetolaunchtheLean-CaseSimulationDashboard to create your SaaS case.
Enjoy the read! And please share the link to This ebook and the ebook with the world.

14 1575 Best Practice SaaS Benchmarks for your Business Case | © MoveToSaaS.com 75 Best Practice SaaS Benchmarks for your Business Case | © MoveToSaaS.com
5. SaaS Benchmarking – Sales Cost and Sales TargetThis ebook provides SaaS entrepreneurs, Business Managers and Inves-
tors with the top 75 best practice benchmarks for your SaaS and Software busi-
ness. Within this chapter we are covering Benchmarks to derive your Selling Cost.
SalesBenchmarksarerelevantto
• captureOn-TargetEarnings(OTE)ofsalesstaff
• captureSalescommissionsand
• captureAnnualSalesTargets(Quota)
DependingonyourSalesModelandyourlocationyourSalesCostcanvarysignificantly,
e.g.thecostforaDirectFieldSalesReparesignificantlyhigherthanforanInsideSalesRep,
thecostofaSalesManagerinSanFranciscoissignificantlyhigherthanintheMidWest.Itis
relevanttocapturetheyearlytotal-cost-to-companyinyoursalesplanwhichdependsonyour
SalesModel.
Ifyouaresellingviaadirectsalesforce,youmustcapturethefullyloadedcostoftheSales-
force.IftheSalesUnitrepresentsapartnerchannel,youmustcapturethecommissionsyou
paytothepartner.IftheSalesunitrepresentsaninbound/outboundsalesteam,youshould
capturethetotalcostofthatteam.
Andlastbutnotleast,thequotaofaSalesUnitdrivesitsperformancewhichagainvery
muchdependsonyoursalesmodelaswellasyourcostofselling.
5.1 Benchmarks to capture On-Target Earnings (OTE) of sales staff
On-Target Earnings by Types of Sales Reps
FieldSalesRepsearnmost($220k),3.4timesmorethanSalesEngi-
neer($64k)
FINANCIAL METRICS– SALES COMP & QUOTA– ON TARGET
EARNINGS– ALL SALES TEAM ATTRIBUTES– TEAM TYPESALES
DEVREPS– INSIDESALES– FIELD/OUTSIDESALES
On-Target Earning per Inside Sales Rep
OTEforISRsarevaryinggreatlybetween60-130$k
FINANCIAL METRICS– SALES COMP & QUOTA– ON TARGET
EARNINGS– ALL SALES TEAMATTRIBUTES– TEAM TYPEINSIDE
SALES
On-Target Earnings by Types of Sales Reps
FieldSalesReps(SRs)make70%moreinOTEthanBusinessDevelop-
mentRepsand215%morethanInsideSRs
FINANCIAL METRICS– SALES COMP & QUOTA– ON TARGET
EARNINGS– ALLSALESTEAMATTRIBUTES– TEAMTYPE– SALES
DEVREPS– INSIDESALES– FIELD/OUTSIDESALES
Ratio Of Sales to Headcount in Public Companies by Years since Founding
Theratioincreasesfrom1.5inYear1to2.1inYear7
ALLSALESTEAMATTRIBUTES– TEAMPROFILE– STRUCTURE
Years of Experience Required per Inside Sales Rep
Averageexperiencepriortohireis2.7years
ALLSALESTEAMATTRIBUTES– TEAMTYPE– INSIDESALES– TEAM
PROFILE– EXPERIENCE
Average Tenure per Inside Sales Rep
AverageTenureperInsideSalesReppaverages2.5years
ALL SALES TEAM ATTRIBUTES – TEAM TYPE– INSIDE SALES–
TEAMPROFILE– TENURE

16 1775 Best Practice SaaS Benchmarks for your Business Case | © MoveToSaaS.com 75 Best Practice SaaS Benchmarks for your Business Case | © MoveToSaaS.com
Annual Attrition Rates / Turnover for Inside Sales Reps
Mostcompanieshaveannualsalesattritionof15-25%
Ratio between Executive and Inside Sales Reps within Inside Sales Team
AverageExecutivetoRepRatio:1:7
ALLSALESTEAMATTRIBUTES– TEAMTYPE– INSIDESALES– TEAM
PROFILE– STRUCTURE– MANAGEMENT
Average On-Target Earnings per Sales Development Rep
OTEaverage$72.1kwitha64%basecomponent
FINANCIAL METRICS– SALES COMP & QUOTA– ON TARGET
EARNINGS– ALLSALESTEAMATTRIBUTES– TEAMTYPE– SALES
DEVREPS
Share of Incentive Components in Variable Compensation of Sales Development Rep
Aquarterofcompaniestielargestshareofcompensationtowonop-
portunities
FINANCIALMETRICS– SALES COMP & QUOTA– QUOTA BASE–
ALLSALESTEAMATTRIBUTES– TEAMTYPE– SALESDEVREPS
Total Annual Variable Pay for Sales Representatives
SalesRepresentativesinsmallercompaniesmakeanaveragevariable
payof$100k,theymakesignificantlylessinlargercompanies
FINANCIAL METRICS – SALES COMP & QUOTA– ON TARGET
EARNINGS– ALLSALESTEAMATTRIBUTES– TEAMTYPE– FIELD/
OUTSIDESALES
Inside Sales Salaries (Median – U.S. National Average)
InsideSalesSalariesstarta$45kperyear
MedianSalariesofSalesRepresentatives(IncentiveOnly)
MedianOTEof sales reps (incentiveonly) startsat$54kper
year
FINANCIALMETRICS– SALESCOMP"A– ONTAR-
GET EARNINGS– ALL SALES TEAM ATTRIBUTES– TEAM
TYPE– SALESDEVREPS– INSIDE SALES– FIELD/OUTSIDE
SALES
MedianSalariesofAccountManagementManager/Director
Mediansalaryofaccountmanagementmanagerstartsat$113
k per year
FINANCIALMETRICS– SALESCOMP"A– ONTAR-
GETEARNING
MedianSalariesofAccountExecutive(USNationalAverage)
Mediansalaryofaccountexecutivemanagerstartsat$77kper
year
FINANCIALMETRICS– SALESCOMP"A– ONTAR-
GETEARNING
MedianSalariesofCustomerServiceRepresentative
Mediansalaryofcustomerservicerepstartsat$33kperyear
FINANCIALMETRICS– SALESCOMP"A– ONTAR-
GETEARNINGS

18 1975 Best Practice SaaS Benchmarks for your Business Case | © MoveToSaaS.com 75 Best Practice SaaS Benchmarks for your Business Case | © MoveToSaaS.com
MedianSalariesofSalesEngineer
Mediansalaryofsalesengineerstartsat$64kperyear
FINANCIALMETRICS– SALESCOMP"A– ONTAR-
GET EARNINGS– ALL SALES TEAM ATTRIBUTES– TEAM
TYPE– SALESDEVREPS
6. Benchmarks to capture Sales Commissions
AverageCommissionsbySalesActivity
Average Sales Commission for New Business are at 8-9% of
ARRQuota
FINANCIAL METRICS– SALES COMP & QUOTA– SALES
COMMISSIONS– ALL PROCESSES– CUSTOMER LIFETIME
VALUE– RENEWAL– EXPANSION (UP-/CROSS SELL)– ALL
SALESTEAMATTRIBUTESTEAMTYPE– SALESDEVREPS–
INSIDESALES– FIELD/OUTSIDESALES
AverageSalesCommissionsbySalesActivity
SalesCommissionaverage8-9%forNewBusiness,6%forUp-
sellBussinessand2%forRenewalBusiness
FINANCIAL METRICS– SALES COMP & QUOTA– SALES
COMMISSIONS– ALL SALES TEAM ATTRIBUTES– TEAM
TYPE– SALESDEVREPS– INSIDE SALES– FIELD/OUTSIDE
SALES
SalesCommissionsbySalesModel
MedianSalesCommissionforInsideSalesat9%andforField
Salesat10%
FINANCIAL METRICS– SALES COMP & QUOTA– SALES
COMMISSIONS– COMPANY PROFILE– SALES MODEL–
FIELD SALES– INSIDE SALES– ONLINE SALES– CHANNEL
SALES

20 2175 Best Practice SaaS Benchmarks for your Business Case | © MoveToSaaS.com 75 Best Practice SaaS Benchmarks for your Business Case | © MoveToSaaS.com
7. Benchmarks to capture Annual Sales Targets (Quota)
SalesQuotaperYearbySalesFunctions
QuotaforOutsideSalesRepsisupto3xhigherthanforInside
SalesReps
FINANCIALMETRICS– SALES COMP "A– QUOTA–
ALL SALES TEAM ATTRIBUTES– TEAM TYPE– SALES DEV
REPS– INSIDESALES– FIELD/OUTSIDESALES
ARRQuotaperQuarterandperYearbySalesFunctions
Quota forFSR($800k-$1300k/year) isalmost2timeshigher
thanthatofISR($630k-$720k/year)
FINANCIALMETRICS– SALES COMP "A– QUOTA–
ALL SALES TEAM ATTRIBUTES– TEAM TYPE– SALES DEV
REPS– INSIDESALES– FIELD/OUTSIDESALES
RatioofQuotaandSalarybySalesFunctions
ISRandFSRhavesomewhatsimilarratios
FINANCIALMETRICS– SALESCOMP"A– ONTAR-
GETEARNINGS– QUOTA– ALLSALESTEAMATTRIBUTES–
TEAMTYPE– SALESDEVREPS– INSIDESALES– FIELD/OUT-
SIDESALES
SalesQuotaforInsideandOutsideSalesReps
Quota forOutside Sales Reps ismuch higher than for Inside
SalesReps
FINANCIAL METRICS– SALES COMP & QUOTA– QUO-
TA– ALL SALES TEAMATTRIBUTES– TEAM TYPE– INSIDE
SALES– FIELD/OUTSIDESALES
QuotaBaseforInsideSalesRepsCompensation
Three quarter of companies assign their inside sales reps individual
oversharedquotas
FINANCIALMETRICS– SALES COMP & QUOTA– QUOTA BASE–
ALLSALESTEAMATTRIBUTES– TEAMTYPE– INSIDESALES
RelativeWinRateofInsideSalesTeambyDealSizeQuartile
Largedeals(quartile4)are20%lesslikelytobewonthanaveragedeals
FINANCIAL METRICS– SALES COMP & QUOTA– DEALS WON–
COMPANYPROFILE– CONTRACT&PRICING– CONTRACTSIZE–
ALLSALESTEAMATTRIBUTES– TEAMTYPE– INSIDESALES
QuotaAttainmentofFirstLineManagerandSalesTeambyCompany
Size
WhileSalesManagersachieve81%ofquota,SalesTeamsachievean
averageof75%
FINANCIALMETRICS– SALESCOMP"A– QUOTAACHIEVE-
MENT– ALLSALESTEAMATTRIBUTES– TEAMTYPE– FIELD/OUT-
SIDESALES

22 2375 Best Practice SaaS Benchmarks for your Business Case | © MoveToSaaS.com 75 Best Practice SaaS Benchmarks for your Business Case | © MoveToSaaS.com
8. SaaS Benchmarking – Annual Contract Value (ACV)ThisebookprovidesSaaSentrepreneurs,BusinessManagersandInvestorswiththetop
75bestpracticebenchmarksforyourSaaSandSoftwarebusiness.Withinthischapterweare
coveringBenchmarkstocalculatetheAnnualContractValue.
TheAnnualContractValue(ACV)istheaveragevalueofaservicecontractpaidfor12
months.ItisagoodindicationtounderstandAverageACVindifferentindustriesandfordif-
ferentsolutions.
TheACVcandependonvariousfactors
•Focusonnewbusinessorupsellbusiness
•CompanyGrowth(fastergrowingcompaniestendtohaveahighershareofupsellbusi-
ness)
•SalesModel(theACVofanInsideSalesModelislowerthantheACVofaFieldSales
Model)
•PricingofServicePlans
•ContractLength(ifcompaniessellonmonthlybasis,theymeasureMonthlyRecurring
Revenues(MRR)insteadACV–typicallythiscanbecomparedifMRRaremultipliedby12)
AverageRevenuesperCustomerforSelectedPublicSaaSCompanies
Vevaaearns$780krevenuepercustomer,muchmorethanothercom-
panies
FINANCIALMETRICS– CONTRACTVALUE– REVENUES– ARR
MedianAnnualContractSize(ACV)perCustomer
Medianannualcontractsize (subscriptioncomponentonly)atabout
$21Kperyear
FINANCIALMETRICS– CONTRACTVALUE– ACV
ShareofUpsellBusinessbyGrowthRate
Fastestgrowingcompanies(>75%YoYrevenuegrowth)havehigher
shareofUpsellBusiness
EXPANSION (UPGRADE)– FINANCIAL METRICS– GROWTH–
GROWTHRATE– ALLPROCESSES– CUSTOMERLIFETIMEVALUE–
EXPANSION(UP-/CROSSSELL)
RelativeDealSizeandBookingsofInsideSalesTeamsbySlowvs.Fast
GrowingCompanies
Fastgrowingcompanieswinlargerdeals(2.8xonaverage)thanslow-
growing companies
FINANCIAL METRICS– SALES COMP & QUOTA– BOOKINGS–
GROWTH– GROWTH RATE– COMPANY PROFILE– CONTRACT
& PRICING– CONTRACT SIZE– ALL SALES TEAM ATTRIBUTES–
TEAMTYPE– INSIDESALES
RelativeDealSizeofInsideSalesTeamsbyWonvs.LostDeals
Lostdealsare1.9timeslargerthanwondealsonaverage
FINANCIALMETRICS – SALESCOMP"A – DEALSWON –
ALLSALESTEAMATTRIBUTES – TEAMTYPE – INSIDESALES
MRRperDealandNumberofClosedDealsperQuarterbySalesFunc-
tions
FSRcloseslessdealsbutlargerdealsthanISR
FINANCIAL METRICS– CONTRACT VALUE– MRR– ALL SALES
TEAM ATTRIBUTES– TEAM TYPE– SALES DEV REPS– INSIDE
SALES– FIELD/OUTSIDESALES

24 2575 Best Practice SaaS Benchmarks for your Business Case | © MoveToSaaS.com 75 Best Practice SaaS Benchmarks for your Business Case | © MoveToSaaS.com
MRRBookingsbyCompanyGrowthRateandbySource
Hyper Growth companies get mostMRR bookings from new logos
whileScaleModelpeersfromrenewals
FINANCIAL METRICS– SALES COMP & QUOTA– BOOKINGS–
CONTRACTVALUE– MRR– GROWTH– GROWTHRATE
CompaniesbyPricingFactorsandbyContractLength
COMPANY PROFILE– CONTRACT & PRICING– CONTRACT
LENGTH– PRICINGMETRIC
ProfessionalServicesMetrics(Revenue,BillableHours,HourlyRate,
TargetUtilization)
54%SaaScompaniesofferProfessionalServiceonboarding,earning
25%ACVfromPSrevenue
COMPANYPROFILE– SERVICETYPE– PROFESSIONALSERVICES
9. SaaS Benchmarking – Lead Cost and Pipeline Conversion
This ebook provides SaaS entrepreneurs, Business Managers and Inves-
tors with the top 75 best practice benchmarks for your SaaS and Software busi-
ness. Within this chapter we are covering Benchmarks to get customers.
Benchmarksonthecustomerlifecyclearerelevantfor2phases–toget-a-customeraswellas
tokeep-and-growthem.
TheGet-a-Customerphaseisdividedintotwostagestoconvertaleadintoapayingcus-
tomer:
•Get-a-Lead–definingthecosttoacquireaqualifiedleadacrossleadchannels
•Convert-a-Lead–defining thepipeline stagesandconversionparameters toconvert
leadsfromonepipelinestagetothenext–andfinallyintopayingcustomers
9.1 Benchmarks to get leadsTheGet-a-Leadphasedefinesthecosttoacquirealeadacrossleadchannels.
CostofLeadscandependonanumberoffactors:
• LeadChannel
• IndustryTargetsegment
• ShareofPaidvsUnpaidLeadsfortherespectiveLeadChannel
NumberofMonthlyVisitorstoCompanyWebsitebyIndustry
Numberofmonthlyvisitorsofsoftwareindustryissimilartootherin-
dustries
COMPANYPROFILE – SERVICEOFFERING – SAAS – SW – HW – MIX
– ALLPROCESSES – AWARENESS – SALESDEVELOPMENT – CUS-
TOMERLIFETIMEVALUE – ACQUISITION
NumberofMonthlyLeadsbyIndustry
Numberofmonthlyleadsinsoftwareindustryissimilartootherindus-
tries
ALL PROCESSES – AWARENESS – SALES DEVELOPMENT – CUS-
TOMERLIFETIMEVALUE – ACQUISITION
26 2775 Best Practice SaaS Benchmarks for your Business Case | © MoveToSaaS.com 75 Best Practice SaaS Benchmarks for your Business Case | © MoveToSaaS.com
NumberofMonthlyOpportunitiesbyIndustry
Numberofmonthlyopportunitiesinsoftwareindustryissimilartooth-
erindustries
COMPANYPROFILE – SERVICEOFFERING – SAAS – SW – HW – MIX
– ALLPROCESSES – AWARENESS – SALESDEVELOPMENT – CUS-
TOMERLIFETIMEVALUE – ACQUISITION
Costs per Lead by Industry
Softwarecompaniesarepayinghighercostsperleadthanotherindus-
tries
CAC – COMPANYPROFILE – SERVICEOFFERING – SAAS – SW – HW
– MIX – ALLPROCESSES – CUSTOMERLIFETIMEVALUE – ACQUISI-
TION
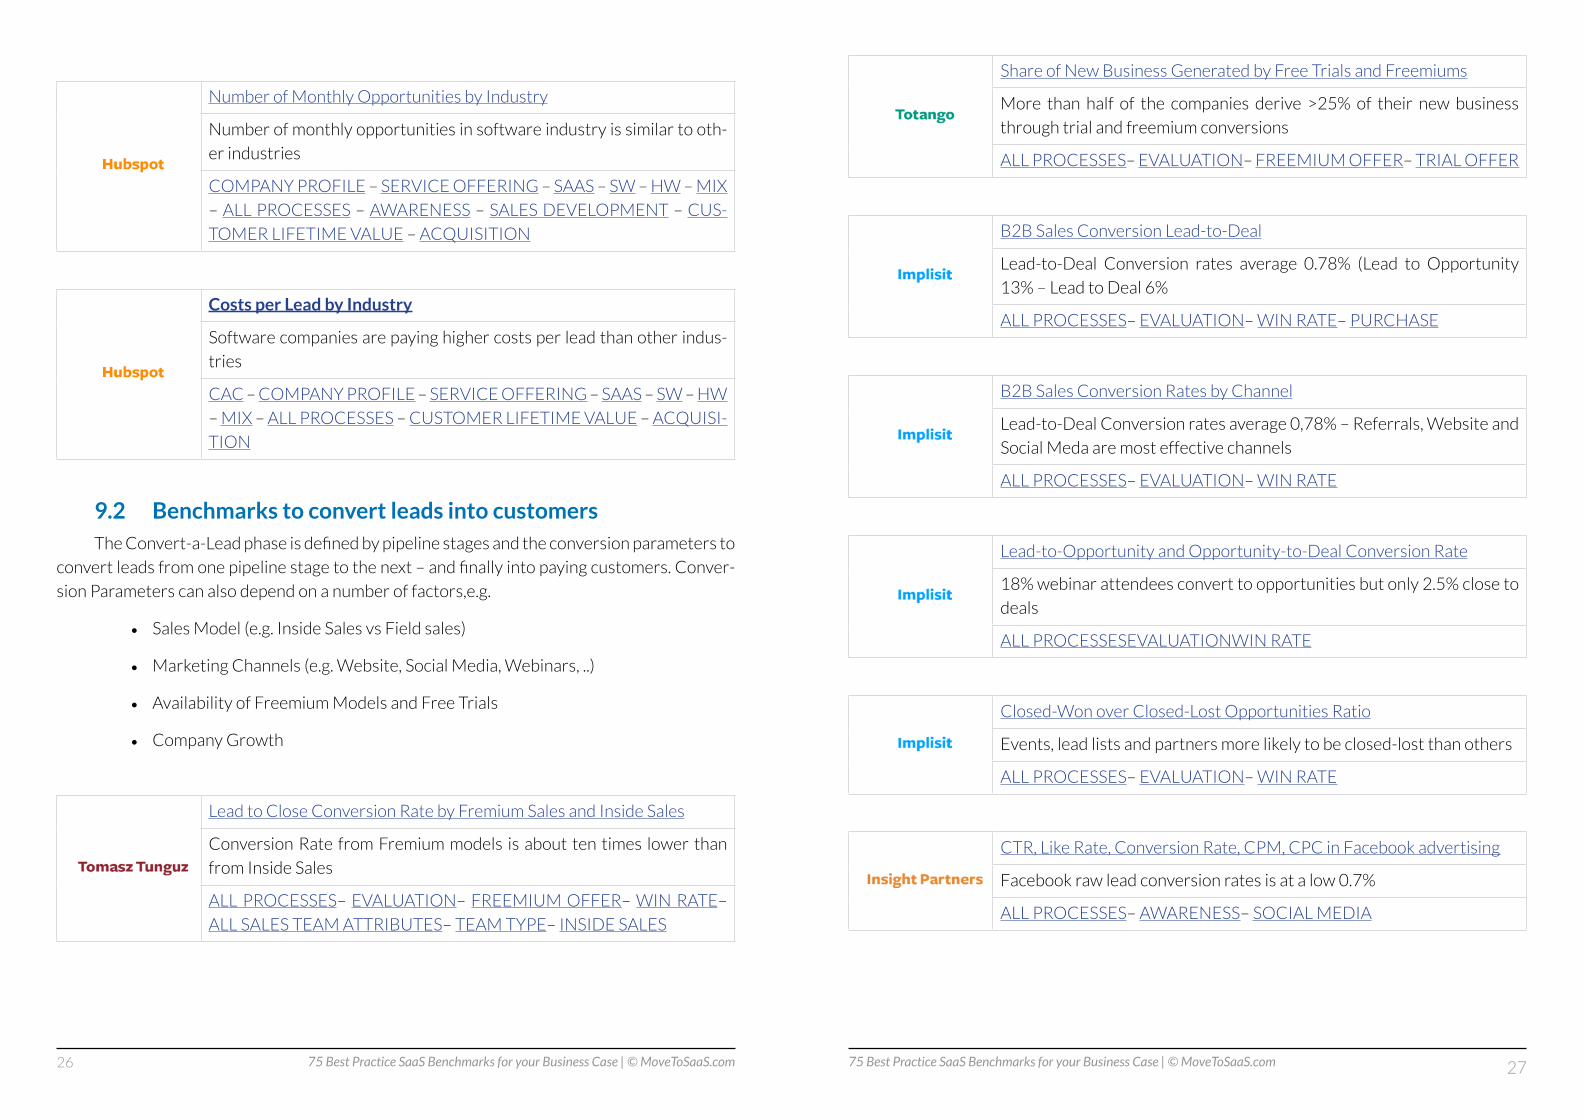
9.2 Benchmarks to convert leads into customersTheConvert-a-Leadphaseisdefinedbypipelinestagesandtheconversionparametersto
convertleadsfromonepipelinestagetothenext–andfinallyintopayingcustomers.Conver-
sionParameterscanalsodependonanumberoffactors,e.g.
• SalesModel(e.g.InsideSalesvsFieldsales)
• MarketingChannels(e.g.Website,SocialMedia,Webinars,..)
• AvailabilityofFreemiumModelsandFreeTrials
• CompanyGrowth
LeadtoCloseConversionRatebyFremiumSalesandInsideSales
ConversionRate fromFremiummodels isabout tentimes lowerthan
fromInsideSales
ALLPROCESSES– EVALUATION– FREEMIUMOFFER– WINRATE–
ALLSALESTEAMATTRIBUTES– TEAMTYPE– INSIDESALES
ShareofNewBusinessGeneratedbyFreeTrialsandFreemiums
More than half of the companies derive >25% of their new business
throughtrialandfreemiumconversions
ALLPROCESSES– EVALUATION– FREEMIUMOFFER– TRIALOFFER
B2BSalesConversionLead-to-Deal
Lead-to-Deal Conversion rates average 0.78% (Lead to Opportunity
13%–LeadtoDeal6%
ALLPROCESSES– EVALUATION– WINRATE– PURCHASE
B2BSalesConversionRatesbyChannel
Lead-to-DealConversionratesaverage0,78%–Referrals,Websiteand
SocialMedaaremosteffectivechannels
ALLPROCESSES– EVALUATION– WINRATE
Lead-to-OpportunityandOpportunity-to-DealConversionRate
18%webinarattendeesconverttoopportunitiesbutonly2.5%closeto
deals
ALLPROCESSESEVALUATIONWINRATE
Closed-WonoverClosed-LostOpportunitiesRatio
Events,leadlistsandpartnersmorelikelytobeclosed-lostthanothers
ALLPROCESSES– EVALUATION– WINRATE
CTR,LikeRate,ConversionRate,CPM,CPCinFacebookadvertising
Facebookrawleadconversionratesisatalow0.7%
ALLPROCESSES– AWARENESS– SOCIALMEDIA
28 2975 Best Practice SaaS Benchmarks for your Business Case | © MoveToSaaS.com 75 Best Practice SaaS Benchmarks for your Business Case | © MoveToSaaS.com
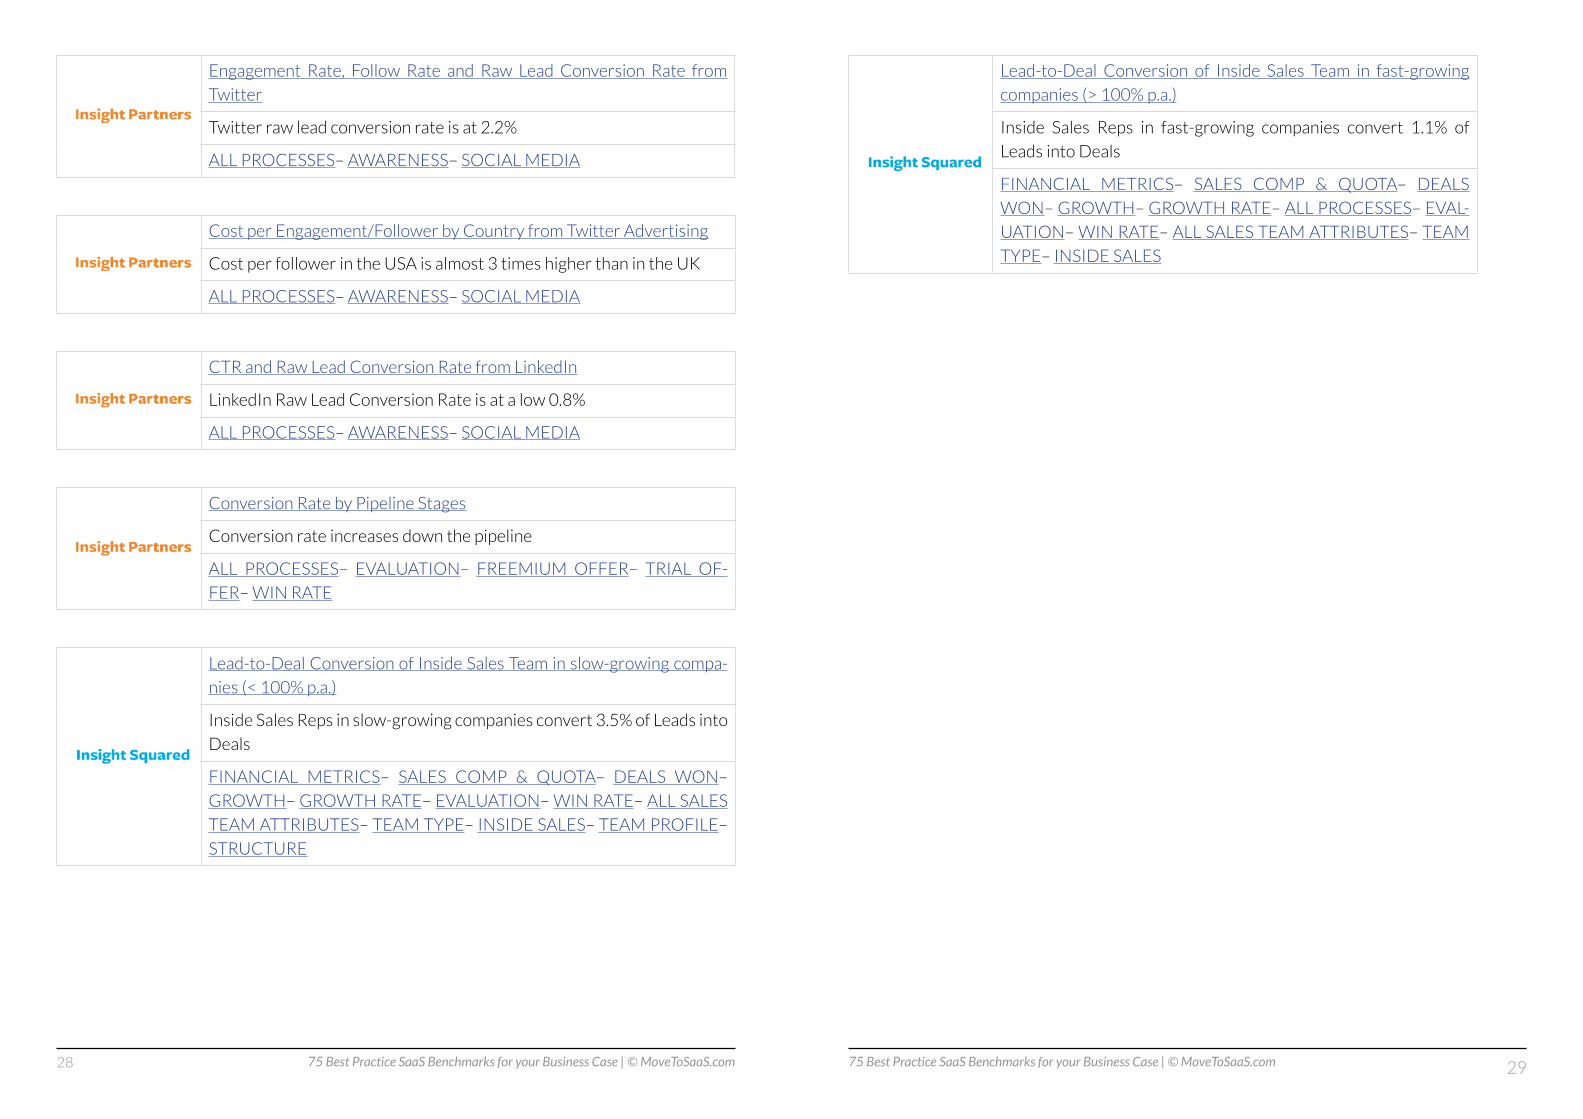
Engagement Rate, Follow Rate and Raw Lead Conversion Rate from
Twitterrawleadconversionrateisat2.2%
ALLPROCESSES– AWARENESS– SOCIALMEDIA
CostperEngagement/FollowerbyCountryfromTwitterAdvertising
CostperfollowerintheUSAisalmost3timeshigherthanintheUK
ALLPROCESSES– AWARENESS– SOCIALMEDIA
CTRandRawLeadConversionRatefromLinkedIn
LinkedInRawLeadConversionRateisatalow0.8%
ALLPROCESSES– AWARENESS– SOCIALMEDIA
ConversionRatebyPipelineStages
Conversionrateincreasesdownthepipeline
ALL PROCESSES– EVALUATION– FREEMIUM OFFER– TRIAL OF-
FER– WINRATE
Lead-to-DealConversionofInsideSalesTeaminslow-growingcompa-
nies(<100%p.a.)
InsideSalesRepsinslow-growingcompaniesconvert3.5%ofLeadsinto
Deals
FINANCIAL METRICS– SALES COMP & QUOTA– DEALS WON–
GROWTH– GROWTHRATE– EVALUATION– WINRATE– ALLSALES
TEAMATTRIBUTES– TEAMTYPE– INSIDESALES– TEAMPROFILE–
STRUCTURE
Lead-to-Deal Conversion of Inside Sales Team in fast-growing
companies(>100%p.a.)
Inside Sales Reps in fast-growing companies convert 1.1% of
LeadsintoDeals
FINANCIAL METRICS– SALES COMP & QUOTA– DEALS
WON– GROWTH– GROWTHRATE– ALLPROCESSES– EVAL-
UATION– WINRATE– ALLSALESTEAMATTRIBUTES– TEAM
TYPE– INSIDESALES

30 3175 Best Practice SaaS Benchmarks for your Business Case | © MoveToSaaS.com 75 Best Practice SaaS Benchmarks for your Business Case | © MoveToSaaS.com
10. SaaS Benchmarking – Churn and Gross MarginThis ebook provides SaaS entrepreneurs, Business Managers and Inves-
tors with the top 75 best practice benchmarks for your SaaS and Software busi-
ness. Within this chapter we are covering Benchmarks to keep and grow customers.
TheKeep-and-Growphaseissplitintotwostagestomaximizeretentionanddealprofitability
with paying customers
• Retaincustomers–definingcustomerchurnimportanttocalculatethecustomer
lifetimeaswellasrevenueexpansionofpayingcustomers
• Deliverprofitaby–definingtheprofitabilityofapayingcustomeralsobeingrel-
evanttocalculatethecustomerlifetimevalue
10.1 Benchmarks to retain customersTheMonthlyChurnRate is thepercentageofMonthlyRecurringRevenueswhichare
“churning,”thatis,beinglostonamonthlybasis.Ingeneral,thereisanimportantdistinction
between“RevenueChurn”and“CustomerChurn”.WhereasRevenueChurncanresultfrom
customersdowngradingtheirsubscription,CustomerChurnresultsfromCustomerswhodis-
continue their subscriptions in a given month.
Ontheotherhand,youhavetoconsidertheMonthlyExpansionRatewhichistheper-
centageof increase inmonthlyrecurringrevenuereceivedfromexistingcustomerswhoin-
creasetheirpurchasesofservices.Thiscanbeachievedbysellingmoreunitswithinthecus-
tomer’splanorbytheupgradeofacustomerintoahigherservicetier.Ideally,expansionrates
arehigherthanchurnrates–deliveringanegativenetchurn.
ChurnImpactonRevenueGrowth
ReducingMonthlyChurnfrom4%to0%doublesMRRwithin2
years
FINANCIAL METRICS– REVENUE CHURN– CUSTOMER
CHURN– GROWTH– REVGROWTH
SalesandMarketingSpendRequiredtoDoubleRevenuebyDif-
ferentChurnRates
Whenchurnratesrise,morecapitalisburnttomaintainthesame
revenue
FINANCIALMETRICS– CAC– CHURN– REVENUE CHURN–
OPEX– S&M– GROWTH– REVGROWTH
AnnualNetDollarRetentionfromExistingCustomers
103%medianannualnetdollarretentionrates includingchurn
andupsell’sbenefits.
FINANCIAL METRICS– CHURN– REVENUE CHURN– ALL
PROCESSES– CUSTOMERLIFETIMEVALUE– RENEWAL
PreferredMethodtoMeasureChurn
Majority of companiesmeasures churn by the number of cus-
tomerlost
FINANCIAL METRICS– CHURN– REVENUE CHURN– CUS-
TOMERCHURN
AnnualizedRevenueChurn
35%ofcompaniesreporthighchurn(>10%),while31%haveme-
diumchurn(5-10%)
FINANCIALMETRICS– CHURN– REVENUECHURN
MonthlyChurnbyGrowthRateofCompanies
Fastest growing companies (>75% YoY revenue growth) have
thelowestchurn
FINANCIAL METRICS– CHURN– REVENUE CHURN– CUS-
TOMERCHURN– GROWTH– GROWTHRATE
32 3375 Best Practice SaaS Benchmarks for your Business Case | © MoveToSaaS.com 75 Best Practice SaaS Benchmarks for your Business Case | © MoveToSaaS.com
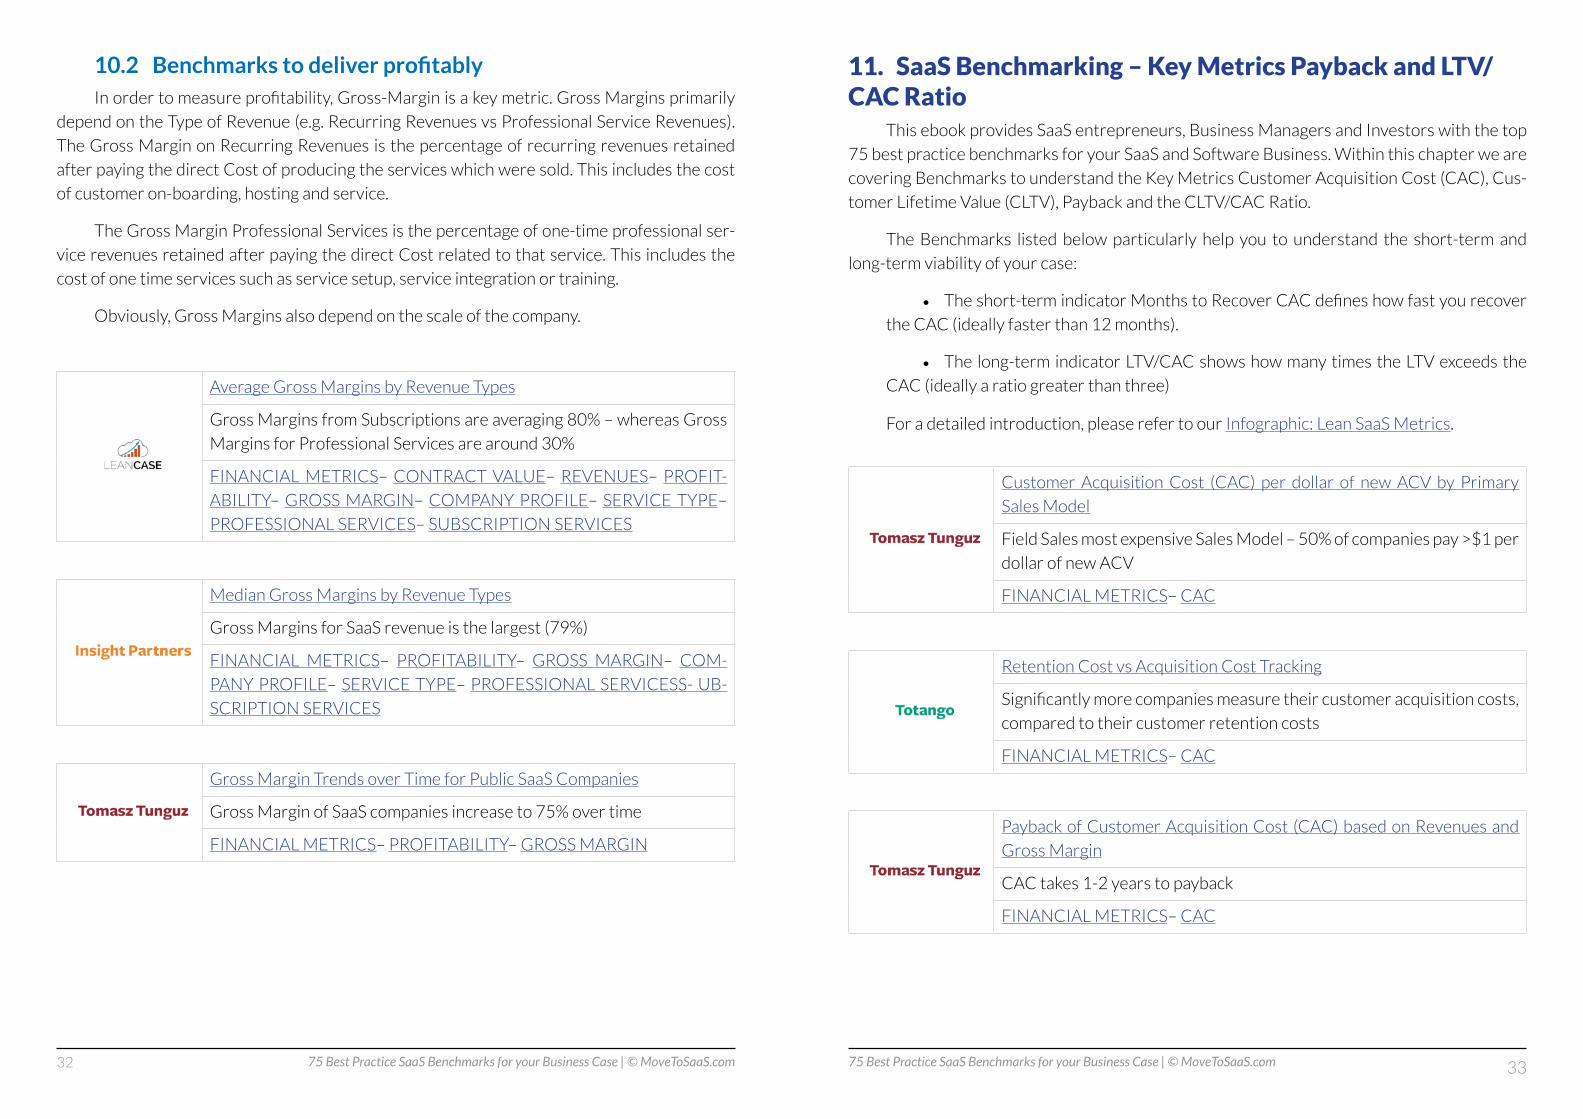
10.2 Benchmarks to deliver profitablyInordertomeasureprofitability,Gross-Marginisakeymetric.GrossMarginsprimarily
dependontheTypeofRevenue(e.g.RecurringRevenuesvsProfessionalServiceRevenues).
TheGrossMarginonRecurringRevenuesisthepercentageofrecurringrevenuesretained
afterpayingthedirectCostofproducingtheserviceswhichweresold.Thisincludesthecost
ofcustomeron-boarding,hostingandservice.
TheGrossMarginProfessionalServicesisthepercentageofone-timeprofessionalser-
vicerevenuesretainedafterpayingthedirectCostrelatedtothatservice.Thisincludesthe
costofonetimeservicessuchasservicesetup,serviceintegrationortraining.
Obviously,GrossMarginsalsodependonthescaleofthecompany.
AverageGrossMarginsbyRevenueTypes
GrossMarginsfromSubscriptionsareaveraging80%–whereasGross
MarginsforProfessionalServicesarearound30%
FINANCIALMETRICS– CONTRACTVALUE– REVENUES– PROFIT-
ABILITY– GROSSMARGIN– COMPANYPROFILE– SERVICETYPE–
PROFESSIONALSERVICES– SUBSCRIPTIONSERVICES
MedianGrossMarginsbyRevenueTypes
GrossMarginsforSaaSrevenueisthelargest(79%)
FINANCIAL METRICS– PROFITABILITY– GROSS MARGIN– COM-
PANYPROFILE– SERVICETYPE– PROFESSIONALSERVICESS-UB-
SCRIPTIONSERVICES
GrossMarginTrendsoverTimeforPublicSaaSCompanies
GrossMarginofSaaScompaniesincreaseto75%overtime
FINANCIALMETRICS– PROFITABILITY– GROSSMARGIN
11. SaaS Benchmarking – Key Metrics Payback and LTV/CAC Ratio
ThisebookprovidesSaaSentrepreneurs,BusinessManagersandInvestorswiththetop
75bestpracticebenchmarksforyourSaaSandSoftwareBusiness.Withinthischapterweare
coveringBenchmarkstounderstandtheKeyMetricsCustomerAcquisitionCost(CAC),Cus-
tomerLifetimeValue(CLTV),PaybackandtheCLTV/CACRatio.
TheBenchmarks listedbelowparticularly help you to understand the short-term and
long-termviabilityofyourcase:
• Theshort-termindicatorMonthstoRecoverCACdefineshowfastyourecover
theCAC(ideallyfasterthan12months).
• The long-termindicatorLTV/CACshowshowmanytimestheLTVexceedsthe
CAC(ideallyaratiogreaterthanthree)
Foradetailedintroduction,pleaserefertoourInfographic:LeanSaaSMetrics.
CustomerAcquisitionCost (CAC) per dollar of newACVbyPrimary
SalesModel
FieldSalesmostexpensiveSalesModel–50%ofcompaniespay>$1per
dollarofnewACV
FINANCIALMETRICS– CAC
RetentionCostvsAcquisitionCostTracking
Significantlymorecompaniesmeasuretheircustomeracquisitioncosts,
comparedtotheircustomerretentioncosts
FINANCIALMETRICS– CAC
PaybackofCustomerAcquisitionCost (CAC)basedonRevenuesand
GrossMargin
CAC takes 1-2 years to payback
FINANCIALMETRICS– CAC

34 3575 Best Practice SaaS Benchmarks for your Business Case | © MoveToSaaS.com 75 Best Practice SaaS Benchmarks for your Business Case | © MoveToSaaS.com
12. SaaS Benchmarking – General Cost, Mobile Product and Cloud Service Pricing
ThisebookprovidesSaaSentrepreneurs,BusinessManagersandInvestorswiththetop
75bestpracticebenchmarksforyourSaaSandSoftwarebusiness.Withinthischapterweare
coveringafewoperationalBenchmarks.
Therearemanymoreoperationalbenchmarkswhichyoucanlookatandexploredirectly
onLean-Marks.Wepickedthreecategoriesforthisebook
• Benchmarksongeneralcoststructures
• BenchmarksforMobileProductDevelopmentand
• BenchmarksforCloudServicesPricing
12.1 Benchmarks for General Cost Structure
ExpensesandProfitabilityMetricsbyCompanyGrowthRate
Hyper Growth Companies spend more (1.5-2 times) on S&M, R&D,
G&Athanaverage(ScaleModel)
FINANCIALMETRICS– OPEX– S&M– R&D– G&A– PROFITABILITY–
GROWTH– GROWTHRATE
12.2 Benchmarks for Mobile Product Development
MobileProductDevelopmentExpenses asProportionofRevenueby
RevenueRange
Mostcompanieswithrevenue>$2Mspendupto20%revenueonmo-
bileproductdevelopment
OPEX– R&D
MobileDevelopmentTimebyStrategy
80%companieswhosemobilestrategyissecondarypublishappwithin
6 months
RevenueGrowthtoMobileMonthlyActiveUsersGrowth
MAUstartsslowbutpicksupatexpansionstage(85%atrevenue$2M-
10M)
FINANCIALMETRICS– GROWTH– GROWTHRATE– REVGROWTH–
COMPANYPROFILE– COMPANYSIZE
MedianGAAPRevenueGrowthRatebyMobileStrategy
CompaniesfocusingonmobilegrowsRev1.8timesmorethancompa-
nies focusing on web
FINANCIALMETRICS– GROWTH– GROWTHRATE– REVGROWTH
MobileMonetizationbyMobileProductStrategy
70%companiesfocusingonwebdonotmonetizetheirmobilesupple-
mentary strategy
12.3 Benchmarks for Cloud Services Pricing
CloudServicesPricingforCloudExchangeemailservicespermailbox
per month
Cloud Services Pricing for Cloud Exchange email services between
5-10$permailboxpermonth
OPEX– R&D– PROVIDERS– HOSTINGMETHODS
CloudServicesPricingforCloudStorageServicesperGBpermonth
PricingforCloudStorageServicesaround0.25$perGBpermonth
OPEX– HOSTING– PROVIDERS– HOSTINGMETHODS

36 3775 Best Practice SaaS Benchmarks for your Business Case | © MoveToSaaS.com 75 Best Practice SaaS Benchmarks for your Business Case | © MoveToSaaS.com
CloudServicesPricingforCloudBackupServicesperGBpermonth
PricingforCloudBackupServicesaround0.50$perGBpermonth
OPEX– HOSTING– PROVIDERS– HOSTINGMETHODS
CloudServicesPricingforCloudSharePointServicesperuserpermonth
PricingforCloudSharePointServiceslessthan5$perGBpermonth
OPEX– HOSTING– PROVIDERS– HOSTINGMETHODS
Cloud Services Pricing for Private Cloud Services per environment
(4vCPUsand4GB/100GBwith2VMs)permonth
PricingforstandardPrivateCloudServicesaround300$permonth
OPEX– HOSTING– PROVIDERS– HOSTINGMETHODS
Cloud Services Pricing for CloudMonitoring Services for 25 devices
and2500metricspermonth
PricingforCloudMonitoringServicesaround500$permonth
OPEX– HOSTING– PROVIDERS– HOSTINGMETHODS
13. Appendix A - SaaS Benchmarking – Top Benchmark Publications and Sources
ThisebookprovidesSaaSentrepreneurs,BusinessManagersandInvestorswiththetop
75bestpracticebenchmarksforyourSaaSandSoftwarebusiness.Withinthischapterweare
coveringtheBenchmarksSourcesusedbyLean-Marks.
A.1 Lean-Case – SaaS Models and Scenarios in the Cloud, 2015
Source LinkLean-Case – SaaS Models and Scenarios in the Cloud, 2015
Publisher Lean-Case
Published 2015
Basecompares benchmarks across various benchmark pro-
viders
Description
WithLean-Case,youcanleverageaSaaSBusinessCasemodelingservicetoplotatrans-
parentGo-to-SaaSbusinesscasetakingyourassumptionsbasedonrelevantbenchmarksinto
account.YoucanuseaprovenSaaSbusinessmodel, insteadofworryingaboutbuildingone
yourself.Lean-Caseleveragesauniteconomicsapproachtoevaluatetheviabilityofthego-
to-marketstrategyandthedynamicsofhiringnewsalesunits.Lean-Caseallowsyoutounder-
stand,plan,simulateandmanagethecash-flowgap,lifetimevaluesvsCAC,revenuerecogni-
tion,cashandexpenseprojectionsandprofitmarginseffectively.Itenablesyoutopresentand
shareanupdatedP&LforthenewSaaSproductlinewithyourpeers,investorsorboardina
winning way.

38 3975 Best Practice SaaS Benchmarks for your Business Case | © MoveToSaaS.com 75 Best Practice SaaS Benchmarks for your Business Case | © MoveToSaaS.com
A.2 Insight Partners – Periodic Tables of SaaS Metrics, 2014
Source LinkInsight’s Periodic Tables of B2B Digital Marketing Metrics, SaaS Sales Metrics and SaaS Financial Oper-ating Metrics
Publisher Insight Venture Partners
Published 2014
Base Insight’sPortfolioCompanies
Description
InsightVenturePartnersisaleadingglobalprivateequityandventurecapitalfirmfound-
ed in1995.The companyhas raisedmore than$8billionand invested inmore than200+
growth-stagesoftware,eCommerce, internet,anddata-servicescompanies.InsightVenture
hascreatedaseriesofPeriodicTablesforSaaSandSoftwarecompanies,including
Insight’s“PeriodicTableofB2BDigitalMarketingMetrics”providesthestatisticsandtac-
ticaltrendsthatInsightVenturePartnershascollectedfromitsportfoliocompaniesandob-
servedacrosstheindustry.ThePeriodicTablereflectsthecomplexityofthesoftwaremarket-
inglandscapebutisnotanexhaustivelistofallmarketingactivities
Insight’s“PeriodicTableofSaaSSalesMetrics”iscompiledfrombenchmarkinformation
gatheredfromitsSaaSportfoliocompaniesandpubliclyavailablesources.ThePeriodicTable
representsthecoremetricsthatshouldbemanagedbySalesExecutives
Insight’s“Periodic Table of SaaS Financial&OperatingMetrics” provides a framework
forthe‘dashboard’ofFinancialandOperatingmetricsthatcanbeusedtomonitortheoverall
healthandoperatingefficiencyofaSaaSbusiness,alongwithsomeadditionalstatisticsthat
speaktotacticaltrendsthatInsightVenturePartnershasobservedacrosstheindustry
ThesePeriodicTablesshouldbeusedinconjunction.ThePeriodicTablesfor‘SaaSSales
Metrics’and‘B2BDigitalMarketingMetrics’providetheunderpinningsofthebenchmarkfi-
nancialresultsthatappearinthe‘SaaSFinancialandOperatingMetrics’.Severalkeymetrics
varysignificantlyasafunctionofcompanysizeandmaturity,soinordertomorepreciselyrep-
resentthesebenchmarksthedatahasbeenbrokenintotwosegments:
• HyperGrowthcompanies(<$50Minannualrevenueand/orgrowing>50%p.a.)
and
• ScaleModelcompanies(>$50Minannualrevenueand/orgrowing<50%p.a.))
A.3 Tomasz Tunguz – Benchmarking Public SaaS Companies, 2014
Source Link Benchmarking SaaS Companies
Publisher Tomasz Tunguz – Redpoint Ventures
Published 2014
Base
Description
TomaszTunguzisaPartneratRedpointVentures.Heblogsatwww.tomtunguz.com.For
thisdeckonSlideshare,Tomaszanalyzedabasketof41publiclytradedSaaSCompanies.For
eachcompany,theprogresswasmeasuredyear-by-yearsincefounding.Thecompanieswere
segmentedbytheirACV.ThedeckincludesKeybenchmarksforSaaScompaniessuchasrev-
enue,customersuccess,sales,quotas,etc.

40 4175 Best Practice SaaS Benchmarks for your Business Case | © MoveToSaaS.com 75 Best Practice SaaS Benchmarks for your Business Case | © MoveToSaaS.com
A.4 Pacific Crest – SaaS Survey, 2014
Source Link 2014 Pacific Crest SaaS Survey – Part 1
Publisher ForEntrepreneurs / David Skok – Pacific Crest
Published 2014
Base
Description
DavidSkok,afivetimeserialentrepreneurturnedVCatMatrix,andDavidSpitz(@dspitz)
from PacificCrest,aninvestmentbankingfirmwithaspecificfocusonSaaS,worktogetherona
yearlybasis.In2014,theysurveyed200SaaScompaniesonavarietyoftopicssuchasgrowth
rates,CAC(costtoacquireacustomer),grossmargins,churnrates,etc.Thegoalofthesurvey
istoprovideusefuloperationalandfinancialbenchmarkingdata.
InLean_Markswearereferencinga fewsamplesof thissurvey.Thereport’sfirstpart
2014PacificCrestSaaSSurvey–Part1coversmetricson:
• Growth(mediangrowthratebycompanysize,salesmodel,targetcustomers)
• Go-to-marketApproach(primarysalesmodel,primarysalesmodelbymedianini-
tialcontractsize)
• Customer-acquisition-cost(CAC)(CACforfor$1ofnewACV,CACandshareof
newACVonnewcustomersvs.upsellsvs.renewals,CACbyprimarysalesmodel)
• Contracting&Pricing (medianannualcontractsize (ACV)percustomer, share
ofnewACVonnewcustomersvs.existingcustomers,newACVfromFreemiums/Free
trials),averagecontract length,averagebillingperiod,contract lengthbycontractsize,
primarypricingmetric)
• ProfessionalServices ImpactonGo-to-Market(in%of1st-yearACVby target
customer),subscriptiongrossmargins)
• SalesCommissions(bymediancontractsize,forrenewals,upsellsandmulti-year
deals)
Thereport’ssecondpart2014PacificCrestSaaSSurvey–Part2coversmetricson:
• CostStructure(grossmargin,OPEX(S&M,R&D,G&A,EBITDA,FCF),growthrate,
mediancoststructurebysizeandSales&Marketingspendvs.projectedgrowthrate)
• Churnand retention(annual grossdollar churn, annual customer churn, churn
bycontractlength,contractsize,primarydistributionmode,annualnetdollarretention
fromexistingcustomers)
• CapitalRequirements(capitalraised,analysisofcompaniesbycapitalraised,capi-
talefficiencyexpectations–medianlevelsforthegroup,actual/expectedtimeandinvest-
mentrequiredtoreach,ACVatwhichyouexpecttohaveFCF+)

42 4375 Best Practice SaaS Benchmarks for your Business Case | © MoveToSaaS.com 75 Best Practice SaaS Benchmarks for your Business Case | © MoveToSaaS.com
A.5 HubSpot Blogs – Your Daily Dose of Inbound, 2015
Source Link HubSpot Blogs
Publisher HubSpot Blogs
Published 2015
Base 900Markerters–7000+Businesses
Description
HubSpotwas founded in2006asa resultofa simpleobservation:peoplehave trans-
formedhowtheylive,work,shop,andbuy,butbusinesseshavenotadapted.Thismismatch
ledBrianHalliganandDharmeshShahtocreatethevisionfortheinboundexperienceandto
developHubSpot’splatformtosupportit.Withthepowerful,easytouse,integratedsetofap-
plications,businessescanattract,engage,anddelightcustomersbydeliveringinboundexperi-
encesthatarerelevant,helpful,andpersonalized.HubSpotis,afterall,onamissiontomake
theworldmoreinbound,onebusinesstransformationafteranother.This“DemandGenera-
tionBenchmarks&Trends:SoftwareMarketerEdition”reportconsistsofdatafromover900
othermarketersacrossallindustries.You’llseestatslike:
• Funnel benchmarks – including visitors, leads, MQLs and opportunities – for
companieshavingthemostsuccess(andthosethataren’t)
• Cost per lead benchmarks by revenue achievement, annual revenue, industry
andcompanysize
• Emailopenandclickthroughrates
• Marketinginvestmentsbytactic
A.6 Implisit – B2B Sales Conversion Rates, 2014
Source LinkB2B Sales Conversion Rates – Lead to Opportunity, Lead to Deal
Publisher Implisit
Published 2014
Base 100++
Description
ImplisitincreasesSalesWinRateswithPredictiveAnalyticsAlgorithmsthatidentifypatterns
andsentimentincustomeremailsandrecommendinstantimprovements.Implisittechnologyup-
datesyourCRMseamlesslyandeffortlessly.Theuniquefeaturesmatchclientandprospectcom-
municationstoCRMrecords,andcreatemissingcontacts.Inaddition,Implisitwillupdateyour
CRMfieldstoprovideyouwithaccurateandup-to-dateforecastatanytime.Implisitpublishesim-
pressiveinfographics,eBooks,whitepapersandmanualstohelpyougetthemostoutofyourCRM.

44 4575 Best Practice SaaS Benchmarks for your Business Case | © MoveToSaaS.com 75 Best Practice SaaS Benchmarks for your Business Case | © MoveToSaaS.com
A.7 Totango – Annual SaaS Metric Survey Report, 2014
Source Link Totango – Annual SaaS Metric Survey Report
Publisher Totango
Published 2014
Base 500SaaSprofessionals(500companies)
Description
Totangoprovidescompanieswithcustomerinsightsthathelpunderstandwhichcustom-
ersneedattentionandwhy,bymonitoringcustomerbehaviorandusageinapplications–along
withcriticalrelationshipdatafromCRM,billing,andothersystems.
In2014,Totango surveyedover500SaaSprofessionalsfrom500companiesaboutthe
keyperformanceindicatorsusedtoruntheirbusinesses,revealinguniqueinsightsintoSaaS
trends.Theparticipatingcompaniesinclude:
• 93companieswithannualrevenue<$1M
• 190companieswithannualrevenuebetween$1Mand$10M
• 112companieswithannualrevenuebetween$10Mand$50M
• 39companieswithannualrevenuebetween$50Mand$100M
• 50companieswithannualrevenue>100$M
Thesurveyrevealsresultsfor:
• Satisfaction with SaaS metrics
• Differentfocusesoncustomeracquisition,renewalsandupsells
• Mostimportantcustomermetrics
• RetentionandAcquisitioncosts
• NewbusinesscomingfromFreetrialsversusFreemium
• Churn measurements
• Revenueincreasefromexistingcustomers
A.8 The Bridge Group – Sales Development and Inside Sales Reports on Metrics & Compensation, 2014
Source Link The Bridge Group – Resources
Publisher The Bridge Group, Inc.
Published 2015
Base >200B2BTechnologyCompanies
Description
TheBridgeGroupspecializes inbuilding,expandingandoptimizing insidesalesstrate-
giesforsmarttechnologycompanies.TheBridgeGrouppublishedsomegreatInsideSalesRe-
sources:
The2014SalesDevelopmentReportonMetrics&Compensationistheirfifthroundof
researchsince2007withafocusonhowmetrics&compensationchangeovertime.Inthis
round,222B2BtechnologycompanieswithSalesDevelopmentTeamsweresurveyed,most
offerSaaSandSoftwaresolutions.Thereportcovers theSalesDevelopmentModel tasked
withPipelinegeneration,appointmentsetting, leadqualificationandoutboundprospecting.
Thereportreveals:
• HowtheSalesDevelopment(SDR)Groupsaremadeup(numberofreps,territo-
ries,experiencelevel,averagetenure,rampup,teamstructure)
• SDRQuotas (basisofquota, averagequotabasedonACV,averagenumberof
deals,quotaachievement)
• Salesefficiency(averagenumberofdailydials,dialattemptsandconnects)
• Incentives&Compensation(OTE,durationofaSPIF)
The2015SaaSInsideSalesReportonMetrics&Compensationcoversthemetricsfor
InsideSalesGroupswithinSaaScompanies,definedasRepsowningtheentiresalescycleas
anindividualcontributorand/orRepsinateamsellingmodelsharingaterritorywithafield
partner.Thereportreveals:
• HowInsideSalesGroupsaremadeup(numberofreps,territories,segmentation
intohuntersandfarmers,experiencelevel,averagetenure,rampup)

46 4775 Best Practice SaaS Benchmarks for your Business Case | © MoveToSaaS.com 75 Best Practice SaaS Benchmarks for your Business Case | © MoveToSaaS.com
• Salesquotas (basisofquota, averagequotabasedonACV,averagenumberof
deals,quotaachievement)
• Salesefficiencymetrics (averagenumberofdailydials,dialsattemptsandcon-
nects)
• Incentives&Compensation(OTE)
• Topchallengesforsalesteams
AuthorsPeterGraceyandMattBertuzzihavebuiltTheBridgeGroup–SalesDevelop-
mentOutbound Index–an IndexontransactionalCRMdata,afteranalyzingmorethan40
outboundprospectorsandlargevolumesoflead,activity,andopportunitydata.TheIndexcon-
sistsof3KPIs:
• ReachRate:Whatpercentageofaccountsengageinatleastonemeaningful,for-
ward-progressingsalesconversation?
• PassRate:WhatpercentageofreachedaccountsarepassedbyaSDRtoaSales
counterpart?
• PipelineRate:WhatpercentageofSDR-passedaccountsareacceptedintothe
salespipeline?
A.9 InsightSquared – New Benchmarks for Inside Sales Teams, 2014
Source LinkInsightSquared – New Benchmarks for Inside Sales Teams
InsightSquared
Published 2014
Base 50+companies
Description
Authors Zorian Rotenberg and Nick Christman from InsightSquared aggregated 12
monthsofdetailedsalesdataformorethan50growingsoftwarecompanieswithinsidesales
teamstoprovideyouwithsomebenchmarksthathelpmeasuresalesteam’sperformanceon
somenewdimensions.
Thebenchmarkanswersanumberofimportantquestions:
• Howdoesthesalesprocessdifferforcompaniesgrowingatmorethan20%per
year?(Conversionrates,Averagedealsizes,Numberofbookingsperrepetc.)
• Arebigdealsworthit?(Salescycles,Saleseffort,Winrates,Dollarpereffort,etc.)
• How much performance variance within your sales team should you
expect?(Numberofdeals,Dealsizes,Winratesbyrepperformancequartileetc.)
• Areyouspendingtoomuchchasingbaddeals?(Win/Losscycles,Win/Lossdeal
sizes,Salestasksperwin/lossdealetc.)
Theauthorssplitsoftwarecompaniesintotwogroupsbasedonsalesgrowth:
• Fastgrowth:100%+growthinthelast12months
• Slowgrowth:0-100%growthintthelast12months

48 4975 Best Practice SaaS Benchmarks for your Business Case | © MoveToSaaS.com 75 Best Practice SaaS Benchmarks for your Business Case | © MoveToSaaS.com
A.10 Xactly – SaaS Incentive Compensation Benchmark Report, 2014
Source LinkXactly – SaaS Incentive Compensation Benchmark Report
Publisher Xactly Corporation
Published 2014
Base >100companies
Description
Xactlytakesincentivecompensationfromadarkarttoascience,providingdecision-mak-
erswiththedatainsightstheyneedtotapthemotivationalpoweroftheirincentivecompensa-
tion.
Xactly analyzedthesalesandincentivecompensationpatternsofSaaScompaniesdur-
ing2013topinpointtheimpactofcompensationonsalesperformance.Inthisdynamic,high-
growthenvironment,incentivecompensationcanplayakeyroleindeterminingthesuccessor
failureofabusiness.Forthestudy,Xactlyleverageditsbigdataplatformthatincludesaggre-
gatedandanonymousempiricaldata.
Thefindingsreveal:
• Incentiveplandesign
• Medianquota size foraprimaryquota-carrying sales representative (Account
Executive)
• Average quota attainment
• Salesattrition
A.11 Salary.com – Average Salary Ranges for Sales Jobs, 2015
Source LinkAverage Salary Ranges for Sales Jobs in the Software & Networking Industry
Publisher Salary.com
Published 2015
Base U.S. National Average
Description
IfyouwanttolearnaboutaveragesalaryrangesforSales(mostlyintheU.S.),thenyou
cansimplybrowseAverageSalaryRangesforSalesJobsonSalary.Com.Thereareawiderange
ofjobsintheSalescategoryandtheirpayvariesgreatly.Ifyouknowthepaygradeofthejob
youaresearchingforyoucannarrowdownthislisttoonlyviewSalesjobsthatpaylessthan
$30K,$30K-$50K,$50K-$80K,$80K-$100K,ormorethan$100K. Ifyouareunsurehow
muchyourSalesjobpaysyoucanchoosetoeitherbrowseallSalessalariesbeloworyoucan
searchallSalessalaries.OtherrelatedcategoriesyoumaywishtobrowseareMarketingjobs
andCustomerServicesjobs.

50 5175 Best Practice SaaS Benchmarks for your Business Case | © MoveToSaaS.com 75 Best Practice SaaS Benchmarks for your Business Case | © MoveToSaaS.com
A.12 Zendesk Bechmark – Behavioral Cues of Customer Satisfaction, 2014
Source Link Zendesk Bechmark – Behavioral Cues of Customer
Publisher Zendesk
Published 2014
Base over25,000customers
Description
TheZendeskBenchmarkcombinessupportdatafromover25,000participatingZendesk
customers.Thisdataisaglobal,up-to-datesourceofcustomersupportknowledge.AndBench-
markreportsarebuiltintoyourZendesk,soquantitativeinsightisalwayscloseathand.
TheBehavioralCuesofCustomerSatisfactionWhitepaperprovidesinsightsintoCus-
tomerSatisfaction,forexampleby:
• Countries
• Industry
• Politenessofcustomers
• Emailprovider
• …andmore
UsetheZendeskBenchmarktomeasureyoursupportqualityonseveralmetrics,com-
pareyourcompanytoyourcompetitors,anddiscovernewstrategiestoraiseyourcustomer
satisfaction.
A.13 Openview – State of B2B Mobile Growth Metrics, 2015
Source Link State of B2B Mobile Growth Metrics
Publisher Openview Venture Partners
Published 2015
Base 60
Description
OpenViewVenturePartnersisanAmericanventurecapitalfirmbasedinBoston.Open-
Viewspecializes inexpansionstagesoftware,newmedia, Internet, and technologyenabled
companies.Mobileappsarethenextbigwave inB2BSaaS.Aswasthecasewiththe initial
adoptionofSaaS,Openviewfeelsthatthereisaneedfornewmetricsthatcanserveasmore
appropriateandaccurate indicatorsofmobileperformance.TheaccesstoSaaSmetricshas
playedamajorrole inthe industry’sdramaticgrowth.Withthem,SaaSentrepreneurshave
beenbetterabletounderstandwhattomeasure,whereto invest,andwhentopullcertain
leverstodrivemoreeffective,sustainablegrowthintheircompanies.Intheemergenceofthe
emergenceofmobileB2BSaaS,OpenviewseesanewoffshootofthetraditionalSaaSmodel.
MobileSaaSbusinessesare fundamentallydifferent fromtheirnon-mobilecounterparts. In
fact,duetothebring-your-own-devicemovementanddifferenteconomicmodels,currentus-
ersandusergrowthcanoftenmatterasmuch, ifnotmore,thancurrentrecurringrevenue.
Openview had several conversations with founders and investors in themobile B2B SaaS
spacewhounanimouslyagreethatmobileB2BSaaSneedsadistinctsetofmetricstomeasure
performanceandgrowth.Thesurvey’srespondentsincludedover60seniorexecutiveswho
sharedtheircompany’sdatainseveralkeycategories,helpingtobetterunderstandtheele-
mentsthatbestreflectaB2BSaaScompany’smobilehealth.

52 5375 Best Practice SaaS Benchmarks for your Business Case | © MoveToSaaS.com 75 Best Practice SaaS Benchmarks for your Business Case | © MoveToSaaS.com
A.14 Kaseya – MSP Global Pricing Survey, 2014
Source Link Kaseya’s MSP Global Pricing Survey
Publisher Kaseya
Published 2014
Base 700MSPsfrom30countries
Description
KaseyaprovidesITsystemsmanagementsoftwarethathelpsmanagedserviceproviders
(MSPs)andmid-marketenterprisesdrivegrowth,innovation,andmostimportantly,custom-
ersuccess.Kaseya’ssolutionsareusedbymorethan10,000customersworldwidetoman-
ageoverfivemilliondevicesacrossawidevarietyofindustries.Kaseyahasaleadingposition
amongMSPsaroundtheglobe.ThisleadingmarketpositiongivesKaseyaauniqueperspective
fromwhichtostudybothpricingandservicedeliverytrendsintheglobalITservicesindustry.
Theresultsprovidevisibilityintothetypes–andportfolios–ofITservicesthatMSPsdeliver
toclients,includingmanagedservicesofferedbyawiderangeofMSPsfromthemanysmall
providerstosomeofthelargestandmostprogressiveMSPsinthemarkettoday.Kaseyagath-
ereddetailsfromKaseyaMSPsontheexistingandemergingtypesofservicestheyoffer,their
currentservicepricingandfuturepricingexpectations,andonthekeychallengestheircus-
tomersface,withparticularemphasisonthemostimportantITservicemanagementtrends
today—cloudandmobility.Thefindingsaregatheredfromownersandoperatorsofnearly
700MSPfirmsofallsizes,spreadacrossmorethan30countries.
About the Author
Eckhard OrtweinEntrepreneur | SaaS Consultant | M&A Advisor
Connect with me if you want to talk about SaaS
BusinessModels,SaaSInvestmentsandSaaSStrategies.
I am a Serial Entrepreneur co-founding cyber-security
startup accells acquired by Ping Identity in 2014 and
co-founding the m-payment startup paybox acquired
bySybase/SAP in2008.WithMoveToSaaS,wespecial-
ize inbusinessmodellingandsimulation,financialplan-
ning,benchmarkingandboardcommunicationforSaaScompaniesandSaaSstartupsaswell
asforSoftwarecompanieswhichwanttoMove-to-SaaS.We’vebeenparticularlysuccessful
withstartupsandcompaniesthatarestrugglingtocreateafinancialplanfortheirfundraising,
thatareconcernedaboutcreatingabusinessmodelsimulatingtheirstrategicoptions,thatare
unhappyabouttheinefficienciesincommunicatingregularlywiththeirboardsandinvestors
andthataredisappointedabouttheirfinancialperformanceversuspeers.Weareproviding
customizedsolutionsforlargercompanies,buthavealsobeenabletocreatestandardtools
andprocessesforstartups.Ihavemorethan20yearsworkingasastartupfounder,industry
executiveandmanagementconsultantforglobalcorporationsandstart-upsintelecommuni-
cations,professionalandfinancialserviceandconsumergoodsindustries.
![arXiv:2005.12873v3 [cs.DC] 7 Jun 2020processing benchmarks [12]. They studied about distributed and parallel benchmarks for graph analyzers, graph database benchmarks, benchmarks for](https://static.fdocuments.us/doc/165x107/60c4e778df2cd14e603091d9/arxiv200512873v3-csdc-7-jun-2020-processing-benchmarks-12-they-studied-about.jpg)


![Benchmarks - June, 2013 | Benchmarks Onlineit.unt.edu/sites/default/files/benchmarks-06-2013.pdf · Benchmarks - June, 2013 | Benchmarks Online 4/26/16, 8:52:25 AM] Skip to content](https://static.fdocuments.us/doc/165x107/5f9d6dd4a6e586755376b37d/benchmarks-june-2013-benchmarks-benchmarks-june-2013-benchmarks-online.jpg)