7164-499-2
16
Open Comparisons 2009 Public Health (including the indicator Smoking habits) 2009 Public Health EXTRACTED AND TRANSLATED FROM ÖPPNA JäMFÖRELSER 2009 – FOLKHäLSA
-
Upload
sveriges-kommuner-och-landsting -
Category
Documents
-
view
213 -
download
1
description
http://webbutik.skl.se/bilder/artiklar/pdf/7164-499-2.pdf
Transcript of 7164-499-2

Open Comparisons 2009Public Health (including the indicator Smoking habits)
2009Public Health
ExtractEd and translatEd from ÖPPna jämfÖrelSer 2009 – folkHälSa

For information about the contents of this report contact the following people: Karin Berensson (project manager) at the swedish association of local authorities and regions, phone +46 8 452 76 90 anders Åberg at the national Board of Health and Welfare, phone +46 75 247 32 81 cecilia Wadman at the swedish national Institute of Public Health, phone +46 63 19 97 26
This report can be ordered from the following websites: swedish association of local authorities and regions, salar: www.skl.se/web/english.aspxnational Board of Health and Welfare: www.socialstyrelsen.se/englishswedish national Institute of Public Health: www.fhi.se/en/the report can also be ordered by phone + 46 8 709 99 90 or e-mail: [email protected]. domestic calls: 020-31 32 30, fax 020-31 32 40.
IsBn 978-91-7164-499-2
layout and production: Kombinera aB Photography: carina Gran/folio BildbyråTranslation: Jennifer Evans/changeling translations aBPrinting: Edita. Västerås 2010
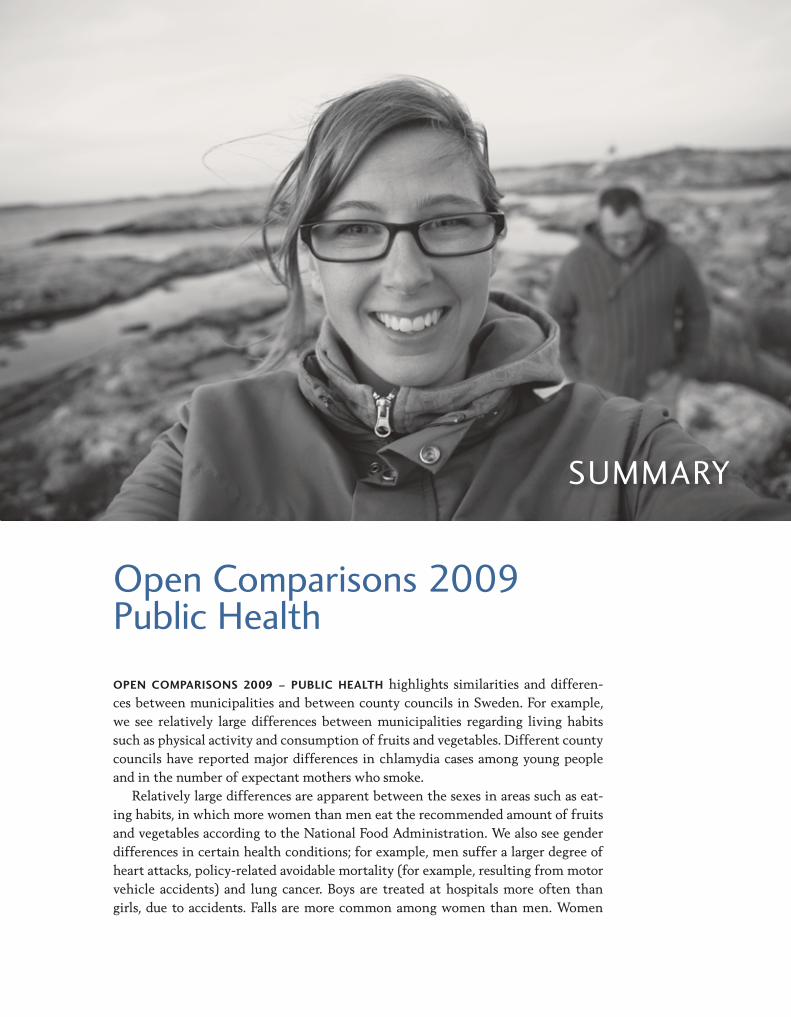
summary
OPEN COMPARISONS 2009 – PUBLIC HEALTH highlights similarities and differences between municipalities and between county councils in Sweden. For example, we see relatively large differences between municipalities regarding living habits such as physical activity and consumption of fruits and vegetables. Different county councils have reported major differences in chlamydia cases among young people and in the number of expectant mothers who smoke.
Relatively large differences are apparent between the sexes in areas such as eating habits, in which more women than men eat the recommended amount of fruits and vegetables according to the National Food Administration. We also see gender differences in certain health conditions; for example, men suffer a larger degree of heart attacks, policyrelated avoidable mortality (for example, resulting from motor vehicle accidents) and lung cancer. Boys are treated at hospitals more often than girls, due to accidents. Falls are more common among women than men. Women
open comparisons 2009 Public Health

4 oPEn comParIsons 2009 – PuBlIc HEaltH
have a higher average life expectancy than men. Differences between the sexes are also apparent in terms of social activities; women are more active socially than men. A larger proportion of women than men describe themselves as afraid to go out alone for fear of attack.
From an equity perspective most of the variables we have investigated show that people with a higher level of education have greater advantages. However, this does not include mental wellbeing and risky alcohol habits.
This is the first report of open comparisons in the public health field. It was generated through a collaboration between the Swedish Association of Local Authorities and Regions (SALAR), the National Board of Health and Welfare (NBHW) and the Swedish National Institute of Public Health (SNIPH). By providing comparisons of a number of important indicators of public health on the municipal and county council levels, Open Comparisons 2009 – Public Health aims to provide greater transparency into what municipalities and county councils achieve, and also to stimulate improvement efforts. However, many other players are responsible for trends in public health in addition to the municipalities and county councils/ regions, and it may prove difficult to demand responsibility from an individual municipality or county council. The public health situation is also affected by structural factors such as age distribution, education and employment in the population; these factors are often difficult to influence in individual municipalities/county councils. Yet municipalities and county councils are so important to public health that the authorities felt these open comparisons would still be useful. The hope is that they will continue to contribute to deeper discussion and analysis, which will help in setting priorities and developing public health measures on the local and regional levels. The report also aims to contribute to greater knowledge about what leads to good public health, and what county councils and municipalities can do to further improve it.
Public health work aims to promote good health and prevent illness. This means that we must influence factors that are important for health, sometimes long before it is possible to see results in perceived or documented health. When a long time passes between a measure and its results, it can be hard to relate the results back to a particular measure or a specific player. This report summarises both living conditions and living habits that are important to the general health condition of the population. Often we are asked for “health factors”, things that have a positive effect on health. This report aims to reflect this, although the data often reflect ill health rather than good health.
The indicators, which are based on data from registries and surveys, are described in terms of background, incidence and possible effects on public health. In addition the report describes the resources of municipalities and county councils – how these authorities can affect the indicators.
Some challenges for Open Comparisons 2009 – Public Health were clear at an early stage. One of the first challenges was being able to produce data from an equity perspective. Public health is by definition an expression of the health status of a population, taking into account levels of health and their distribution between social groups. We have worked with renowned researchers in the field and jointly
5oPEn comParIsons 2009 – PuBlIc HEaltH
arrived at a distribution of data based on level of education – higher or lower. The ambition was to present all indicators from an equity perspective; however, the data do not allow such a division, so the final report shows only the county council level and is primarily based on surveys.
A second challenge is to report as many indicators as possible on the municipal level. Municipal survey data are based on four different population surveys: the national population survey, Hälsa på lika villkor (Health on Equal Terms) 2006–2008 (SNIPH, national data and data selected by the county councils themselves), Liv & hälsa (Life & Health) 2008 (the county councils in Uppsala, Sörmland, Västmanland, Värmland and Örebro), Folkhälsa i Skåne (PublicHealth Survey in Skåne) 2008, (Region Skåne) and Hälsoenkät Stockholms län (Stockholm County Health Survey) 2006, (Stockholm County Council).
Parts of the NBHW registry statistics are also reported on the municipal level. The report shows 21 indicators divided into three classes: living conditions, living
habits and health effects. This division is debatable, not least because several of the indicators could easily fall under more than one of the headings.
The indicators are:
LIVING CONDITIONS
Social participationSocial support – reliance on others Secure environment Qualification for uppersecondary school LIVING HABITS
Physical activity Eating habits – fruits and vegetables Smoking habits Maternal smoking during early pregnancyRisky alcohol habits HEALTH EFFECTS
Selfassessed general state of health Mental wellbeing Average life expectancy Policyrelated avoidable mortality Acute myocardial infarction (AMI)Lung cancer Injuries among children Falls among people aged 65 or older Induced abortion among teenagersChlamydia in the ages 15 to 29 Obesity Dental health

6 oPEn comParIsons 2009 – PuBlIc HEaltH
The report also relates background factors that are important for analysing the results, as they reflect key conditions for good public health.
Data are presented in maps for municipal comparisons and in graphs for county council comparisons. In addition, total comparative data for the municipal and county council levels are presented in tables. Open Comparisons 2009 – Public Health follows the layout of previous reports for municipalities and county councils. On the municipal level the results for the individual indicators are divided up such that the 25% of municipalities with the best results are shown in green and the next 50% are shown in yellow. The 25% of municipalities with the poorest results are shown in red. On the county council level, the distribution is the top third of county councils in green, the middle third in yellow and the bottom third in red. Data from the report are also presented in various Swedish databases.

7oPEn comParIsons 2009 – PuBlIc HEaltH
Smoking habits
Smoking is the single greatest risk factor for illness and premature death in the developed world today. In Sweden about 7,000 people a year die of smokingrelated illnesses, although there has been a positive trend as the number of smokers has decreased. Cigarette smoke contains more than 4,000 chemical substances, at least 50 of which are carcinogenic. Smoking affects nearly every organ of the body, and people subjected to secondhand smoke are also at risk. About 90% of all lung cancer cases and 20% of cardiovascular disease cases are believed to be due to smoking. Smokers are also more likely to use other drugs, such as alcohol. Financial calculations show that a single smoker costs society SEK 1.2 million more than a nonsmoker during his or her lifetime, calculated in the form of net costs for health care, sickness benefits, early retirement and care of the elderly (30). Three of four adult smokers want to quit smoking, and many want professional help (31). Today there are many effective and cost effective methods of smoking cessation, but they are in insufficient supply. A doctoral thesis from Umeå University shows that it is possible to prevent tobacco use among young people through joint support from school and parents (32).
It is unusual that young people start smoking after age 19. This is why preventive work is so important at an early age. Child care and schools have a particularly important role in prevention of tobacco use. Other important efforts from the municipality’s side include making sure that the tobacco laws are followed in terms of sales restrictions and bans on smoking in places of business. Establishing municipal action plans, collaborating with other players such as study associations, sports clubs and volunteer organisations, employment agencies and so on, also helps with tobacco prevention.
Providing information on the harmful effects of tobacco and offering support to patients and expectant parents for smoking cessation, both in general health care and prior to surgery, are tasks that the county councils carry out. Studies show that smokers have a greater risk of complications in connection with appendix and hernia operations, among others. Offering support in smoking cessation a few weeks before an operation can reduce that risk of complications (33). Other measures being conducted in the county councils include creating an action plan to promote a tobaccofree staff.
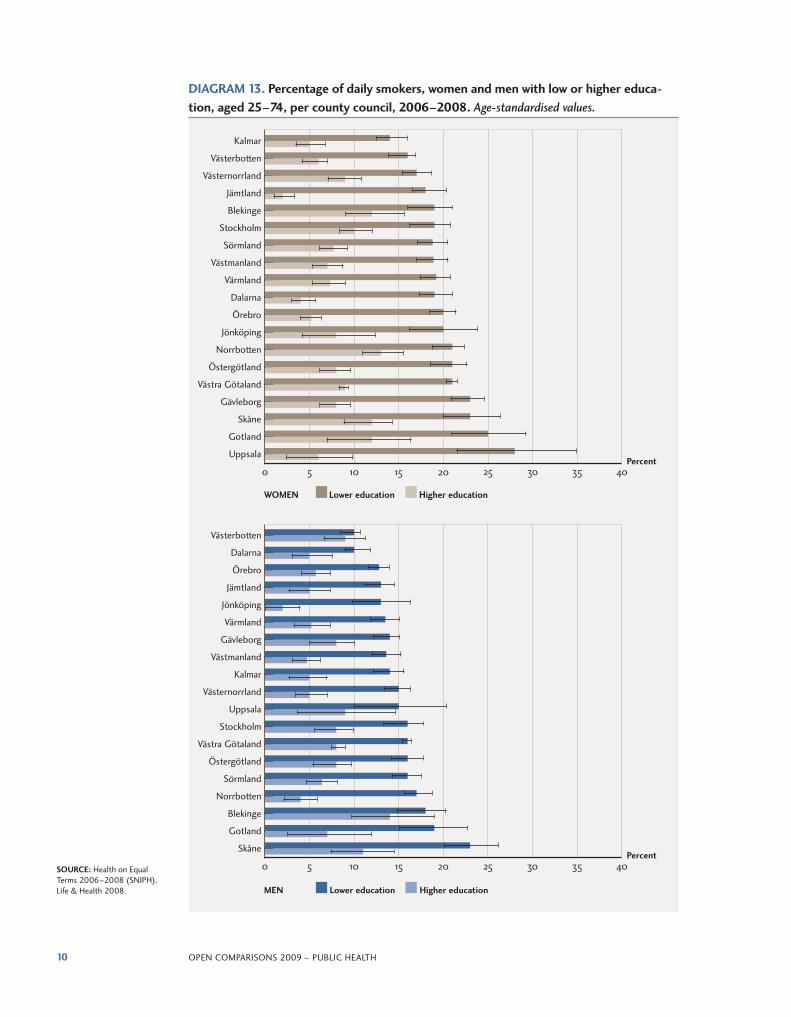
All four of the population surveys – Health on Equal Terms 2006–2008 (SNIPH), Life & Health 2008, PublicHealth Survey in Skåne 2008 and Stockholm County Health Survey 2006 – have a question about daily smoking. This indicator is shown as a percentage of daily smokers per gender on the municipal and county council levels and divided up by level of education. (There is no division per level of education for the county councils of Halland and Kronoberg due to insufficient data.)
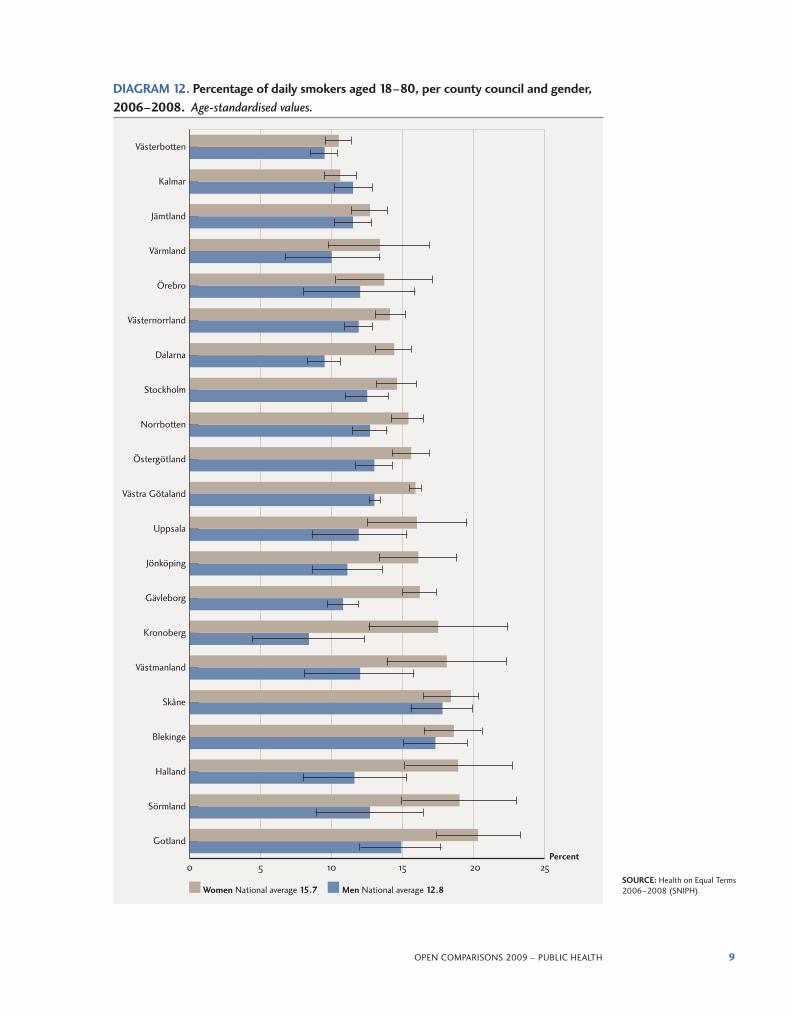
The results show that a greater proportion of women smoke than men. The number of daily smokers is higher among people with a lower level of education than among those with a higher level.

8 oPEn comParIsons 2009 – PuBlIc HEaltH
MAP 4. Percentage of daily smokers aged 18–80, per municipality, 2006–2008. Age-standardised values.
PROPORTION NUMBER OF SMOKERS MUNICIPALITIES
4.0–11.5% 67
11.6–16.0% 132
16.1–25.9% 69
Insufficient data 22
SOURCE: Health on Equal terms 2006–2008, (snIPH), life & Health 2008, Public-Health survey in skåne 2008 and Health survey 2006 (stockholm county).
9oPEn comParIsons 2009 – PuBlIc HEaltH
Västerbotten
Kalmar
Jämtland
Värmland
Örebro
Västernorrland
Dalarna
Stockholm
Norrbotten
Östergötland
Västra Götaland
Uppsala
Jönköping
Gävleborg
Kronoberg
Västmanland
Skåne
Blekinge
Halland
Sörmland
Gotland
0 5 10 15 20 25Percent
Women National average 15.7 Men National average 12.8SOURCE: Health on Equal terms 2006–2008 (snIPH).
DIAGRAM 12. Percentage of daily smokers aged 18–80, per county council and gender, 2006–2008. Age-standardised values.
10 oPEn comParIsons 2009 – PuBlIc HEaltH
Västerbotten
Dalarna
Örebro
Jämtland
Jönköping
Värmland
Gävleborg
Västmanland
Kalmar
Västernorrland
Uppsala
Stockholm
Västra Götaland
Östergötland
Sörmland
Norrbotten
Blekinge
Gotland
Skåne
0 5 10 15 20 25 30 35 40
0 5 10 15 20 25 30 35 40
Kalmar
Västerbotten
Västernorrland
Jämtland
Blekinge
Stockholm
Sörmland
Västmanland
Värmland
Dalarna
Örebro
Jönköping
Norrbotten
Östergötland
Västra Götaland
Gävleborg
Skåne
Gotland
Uppsala
WOMEN Lower education Higher education
MEN Lower education Higher education
Percent
Percent
SOURCE: Health on Equal terms 2006–2008 (snIPH), life & Health 2008.
DIAGRAM 13. Percentage of daily smokers, women and men with low or higher educa-tion, aged 25–74, per county council, 2006–2008. Age-standardised values.

11oPEn comParIsons 2009 – PuBlIc HEaltH
Comparisons between municipalities. for precise definitions and sources, please see the individual indicators and the description of Indicators appendix.
Smoking habits Percentage daily smokers aged 18–80, 2006–2008
Municipality Total Men Woman
Confidence interval Confidence interval Confidence interval
nationwide 14.4 14.2 14.5 12.8 12.5 13.1 15.7 15.4 15.9
ale 15.5 13.4 17.6 14.0 11.0 16.9 16.8 13.9 19.8
alingsås 13.0 10.8 15.2 10.0 7.0 13.0 15.3 12.1 18.4
alvesta
aneby
arboga 12.5 8.7 16.3 13.2 7.0 19.4 12.2 7.6 16.8
arjeplog 11.9 7.7 16.0
arvidsjaur 13.4 9.2 17.6 9.2 4.0 14.5 17.0 10.7 23.3
arvika 12.5 8.9 16.1 11.0 6.1 15.8 13.8 8.5 19.1
askersund 13.8 10.7 16.9 10.3 6.1 14.5 16.9 12.5 21.4
avesta 11.7 8.6 14.8 15.4 10.2 20.6 8.6 4.9 12.3
Bengtsfors 16.1 13.9 18.3 14.2 11.1 17.2 17.8 14.6 21.0
Berg 10.6 7.8 13.3 9.1 5.1 13.0 11.7 7.9 15.6
Bjurholm 7.5 4.7 10.2 3.4 0.7 6.1 11.5 6.7 16.3
Bjuv 16.6 12.6 20.6 12.2 7.2 17.1 20.3 14.1 26.5
Boden 16.3 13.7 19.0 10.1 6.9 13.3 21.3 17.4 25.3
Bollebygd 16.6 13.1 20.1 16.2 10.9 21.4 17.0 12.3 21.7
Bollnäs 13.5 10.8 16.2 16.9 12.5 21.3 10.8 7.5 14.1
Borgholm 12.5 8.3 16.8 6.4 1.9 10.9 18.1 11.3 24.9
Borlänge 10.9 8.9 13.0 15.0 11.5 18.6 7.7 5.4 10.1
Borås 18.3 16.1 20.5 14.9 12.0 17.9 21.4 18.2 24.6
Botkyrka 21.6 18.4 24.7 22.8 18.0 27.6 20.6 16.4 24.8
Boxholm
Bromölla 13.6 9.6 17.7 10.4 5.4 15.4 16.5 10.3 22.7
Bräcke 17.5 14.1 20.8 21.5 16.2 26.8 13.9 9.8 18.1
Burlöv 16.5 12.7 20.3 15.7 10.5 20.9 16.9 11.4 22.3
Båstad 11.4 8.0 14.8 9.6 5.1 14.1 13.0 7.9 18.0
dals-Ed 16.6 14.4 18.8 15.1 12.0 18.2 17.9 14.7 21.0
danderyd 10.7 8.5 13.0 9.2 6.0 12.3 11.9 8.8 15.1
degerfors 12.7 9.8 15.6 9.1 5.3 12.8 16.8 12.2 21.3
dorotea 13.4 9.9 16.9 16.0 10.5 21.4 11.0 6.5 15.5
Eda 17.4 13.2 21.6 14.8 9.1 20.4 20.2 14.3 26.1
Ekerö 12.6 10.2 14.9 11.0 7.7 14.3 13.8 10.5 17.1
Eksjö
Emmaboda 16.6 11.4 21.8
Enköping 13.5 10.7 16.4 12.9 8.6 17.3 13.9 10.1 17.7
Eskilstuna 14.7 12.9 16.4 15.2 12.6 17.9 14.2 12.0 16.4
Eslöv 17.7 14.9 20.5 14.9 11.2 18.6 21.6 17.3 25.9
Essunga 9.6 7.2 12.1 11.6 7.8 15.4 7.8 4.7 10.8
fagersta 12.8 9.1 16.6 11.2 6.1 16.4 14.9 9.3 20.4
falkenberg
falköping 14.6 12.0 17.1 13.4 9.8 17.0 15.6 12.0 19.2
falun 11.3 9.4 13.1 4.3 2.5 6.0 16.7 13.8 19.6
filipstad 15.6 10.7 20.4 12.1 5.3 19.0 19.8 12.9 26.7
finspång 9.8 6.4 13.3 10.2 4.8 15.5 9.6 5.2 14.1
NOTE: the table shows an excerpt of 44 out of a total of 290 municipalities.
12 oPEn comParIsons 2009 – PuBlIc HEaltH
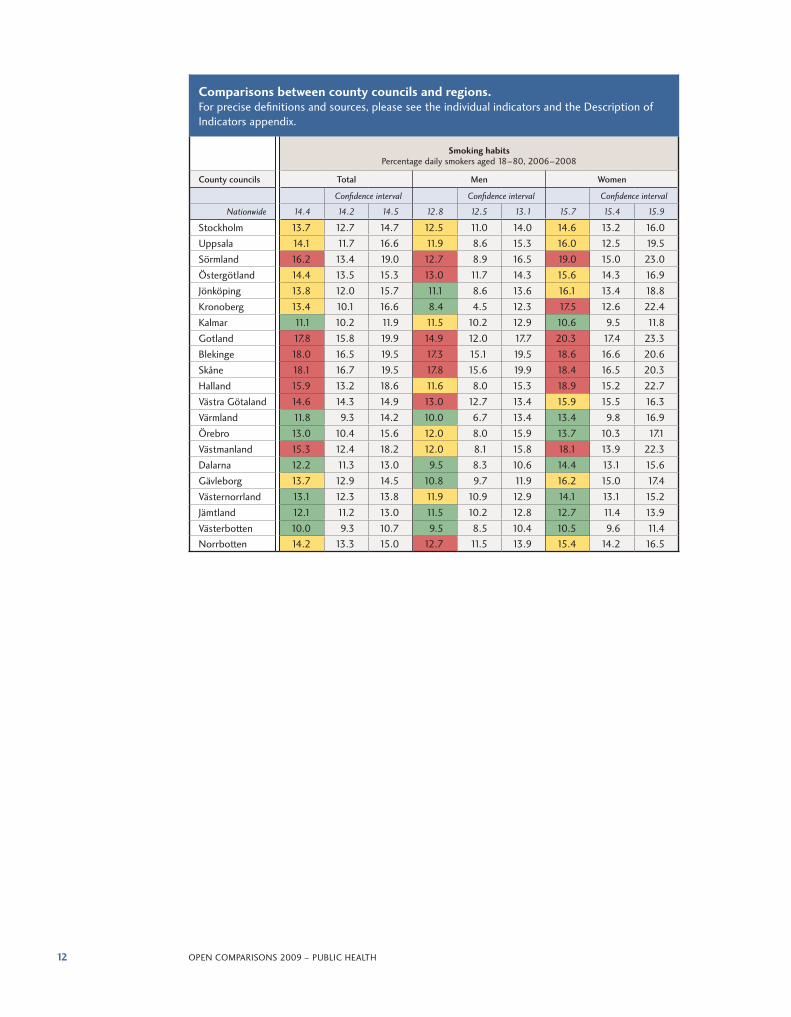
Comparisons between county councils and regions. for precise definitions and sources, please see the individual indicators and the description of Indicators appendix.
Smoking habits Percentage daily smokers aged 18–80, 2006–2008
County councils Total Men Women
Confidence interval Confidence interval Confidence interval
nationwide 14.4 14.2 14.5 12.8 12.5 13.1 15.7 15.4 15.9
stockholm 13.7 12.7 14.7 12.5 11.0 14.0 14.6 13.2 16.0
uppsala 14.1 11.7 16.6 11.9 8.6 15.3 16.0 12.5 19.5
sörmland 16.2 13.4 19.0 12.7 8.9 16.5 19.0 15.0 23.0
Östergötland 14.4 13.5 15.3 13.0 11.7 14.3 15.6 14.3 16.9
Jönköping 13.8 12.0 15.7 11.1 8.6 13.6 16.1 13.4 18.8
Kronoberg 13.4 10.1 16.6 8.4 4.5 12.3 17.5 12.6 22.4
Kalmar 11.1 10.2 11.9 11.5 10.2 12.9 10.6 9.5 11.8
Gotland 17.8 15.8 19.9 14.9 12.0 17.7 20.3 17.4 23.3
Blekinge 18.0 16.5 19.5 17.3 15.1 19.5 18.6 16.6 20.6
skåne 18.1 16.7 19.5 17.8 15.6 19.9 18.4 16.5 20.3
Halland 15.9 13.2 18.6 11.6 8.0 15.3 18.9 15.2 22.7
Västra Götaland 14.6 14.3 14.9 13.0 12.7 13.4 15.9 15.5 16.3
Värmland 11.8 9.3 14.2 10.0 6.7 13.4 13.4 9.8 16.9
Örebro 13.0 10.4 15.6 12.0 8.0 15.9 13.7 10.3 17.1
Västmanland 15.3 12.4 18.2 12.0 8.1 15.8 18.1 13.9 22.3
dalarna 12.2 11.3 13.0 9.5 8.3 10.6 14.4 13.1 15.6
Gävleborg 13.7 12.9 14.5 10.8 9.7 11.9 16.2 15.0 17.4
Västernorrland 13.1 12.3 13.8 11.9 10.9 12.9 14.1 13.1 15.2
Jämtland 12.1 11.2 13.0 11.5 10.2 12.8 12.7 11.4 13.9
Västerbotten 10.0 9.3 10.7 9.5 8.5 10.4 10.5 9.6 11.4norrbotten 14.2 13.3 15.0 12.7 11.5 13.9 15.4 14.2 16.5
13oPEn comParIsons 2009 – PuBlIc HEaltH
References
30. tobak och avvänjning. stockholm: swedish national Institute of Public Health; 2004. report r 2004:29.
31. nygren K, editor. liv & Hälsa i norrland. luleå: county council of norrbotten, umeå: county council of Västerbotten, Östersund: county council of Jämtland, Härnösand: county council of Västernorrland; 2003. report 2003:1. available from: http://www.nll.se/upload/IB/lg/sekr/fh/rapp/norrland2003.pdf
32. nilsson m. Promoting health in adolescents: preventing the use of tobacco [doctoral thesis]. umeå: umeå universitet; 2009. available from: http://urn.kb.se/resolve?urn=urn:nbn:se:umu:diva-21239
33. lindström d. the impact of tobacco use on postoperative complications [doctoral thesis]. stockholm: Karolinska institutet; 2008. available from: http://diss.kib.ki.se/2008/978-91-7409-071-0/thesis.pdf

14 oPEn comParIsons 2009 – PuBlIc HEaltH
Sweden’s democratic system
Three democratic levelsSweden is divided into 290 municipalities, 18 counties and two regions (Västra Götaland and Skåne). There is no hierarchical relation between municipalities, counties and regions, since all have their own selfgoverning local authorities with responsibility for different activities. The current Local Government Act defines the roles of municipalities, county councils and regions as follows:
• Municipalities are responsible for matters relating to the inhabitants of the municipality and their immediate environment.
• The main task of the county councils and regions is healthcare. • The Swedish Parliament, or Riksdag, is the supreme political decision
making body in Sweden.
Local government has a long tradition in Sweden. Municipalities, county councils and regions are responsible for providing a significant proportion of all public services. They have a considerable degree of autonomy and have independent powers of taxation.
The role of the municipalitiesSweden’s 290 municipalities are responsible for a larger share of public services in comparison with the situation in most other countries. For example the municipalities are responsible for social services, childcare and preschools, elderly care, primary and secondary education, planning and building issues, health and environmental protection, emergency services and emergency preparedness.
The activities of the county councils and regions The activities of Sweden’s 18 county councils and two regions cover two main areas: healthcare and regional development. The activities include primary care for everyone with health problems, county and regional healthcare, dental care and regional activities.


you can order a copy of the main report, Öppna jämförelser 2009 – folkhälsa, at www.skl.se/publikationer
Price: sEK 100 exclusive of Vat, postage and service charge.
you can also download a copy of the report in Pdf format (swedish) from
swedish association of local authorities and regions: www.skl.se/publikationer
national Board of Health and Welfare: www.socialstyrelsen.se/publikationer
swedish national Institute of Public Health: www.fhi.se/publikationer
IsBn 978-91-7164-499-2
Open Comparisons 2009Public Health
THIS IS A TRANSLATED ExCERPT from the first report on open comparisons in the public health field, Öppna jämförelser 2009 – Folkhälsa. The main report is the first step in a more longterm improvement effort. It compares indicators related to living conditions, living habits and health effects on the municipal and county council levels. Municipalities and county councils are responsible for many issues related to health determinants and public health. The indicators are presented on maps for the municipal level and graphs for the county council level. Some indicators are also shown on the county council level for different levels of education. The table appendix to the report shows the values and ranking of the various indicators for municipalities and county councils as well as background variables, which are not ranked.
This excerpt contains the summary of the main report and all information on one of the indicators, smoking habits.
The health situation in Sweden in general is very good. By offering the opportunity to make comparisons in the public health field, we hope to stimulate analysis, discussion and further improvements.
Other contributors to this project are Region Skåne and the county councils of Stockholm, Uppsala, Sörmland, Värmland, Västmanland and Örebro.
swedish association of
local authorities and regions
118 82 stockholm
Phone +46 8 452 70 00
[email protected], www.skl.se
swedish national Institute of Public Health
831 40 Östersund
Phone +46 63 19 96 00
www.fhi.se
national Board of Health and Welfare
106 30 stockholm
Phone +46 75 247 30 00
www.socialstyrelsen.se
ExtractEd and translatEd from ÖPPna jämfÖrelSer 2009 – folkHälSa