7164-380-3
42
Local government financial equalisation Information about the equalisation system for Swedish municipalities and county councils in 2008
-
Upload
sveriges-kommuner-och-landsting -
Category
Documents
-
view
212 -
download
0
description
http://webbutik.skl.se/bilder/artiklar/pdf/7164-380-3.pdf
Transcript of 7164-380-3
Local government financial equalisation
Information about the equalisation system for Swedish municipalities and county councils in 2008

Local government financial equalisation
Information about the equalisation system for Swedish
municipalities and county councils in 2008

2 Local government financial equalisation 2008
Ministry of Finance
Department for Public Administration
Local Government Finance Division
SE-103 33 Stockholm
Tel +46 8 405 10 00
www.sweden.gov.se
Swedish Association of Local Authorities and Regions
SE-118 82 Stockholm Visitors Hornsgatan 20
Tel +46 8 452 70 00 Fax 08-452 70 50
[email protected], www.skl.se
© Ministry of Finance and the Swedish Association
of Local Authorities and Regions
1st edition, September 2008
Text and calculations Henrik Berggren, Andreas Hermansson
Graphic design and production Elisabet Jonsson
Cover photo Satellitdata, Metria, © www.worldsat.ca
Printed by Ljungbergs Tryckeri ab, Klippan
Paper Truecard 1 gloss 220 gr (cover), Maxioffset 120 gr (insert)
Fonts BerlingNova och Charlotte Sans skl
isbn 978-91-7164-380-3

Foreword
This brochure provides an overview of the equalisation system and thechanges made since 2005, when the present system was introduced.Some comparisons are made between the present system and thesystem in operation before 2005.
The present system is based on the proposal that the Governmentpresented to the Riksdag (Swedish Parliament) in May 2004. The Riks-dag approved the proposal in October 2004. The Government addres-sed some later proposals for changes in the 2007 Spring Fiscal PolicyBill. The Riksdag approved the alterations to the system in June 2007.Some further references are given on page 35.
We hope that this brochure will help to increase understanding ofthe equalisation system and spread knowledge about its purpose,structure and function so that further discussion of the system canbuild on at least a general awareness of it.
Local government financial equalisation is an update of an earlier re-port. The revisions have been made by Henrik Berggren at the Swe-dish Association of Local Authorities and Regions and Andreas Her-mansson at the Ministry of Finance.
Stockholm, June 2008
Dan Johansson Maj-Lis ÅkerlundLocal Government Finance Division Section for Economic AnalysisDepartment for Public Administration Swedish Association of LocalMinistry of Finance Authorities and Regions
3
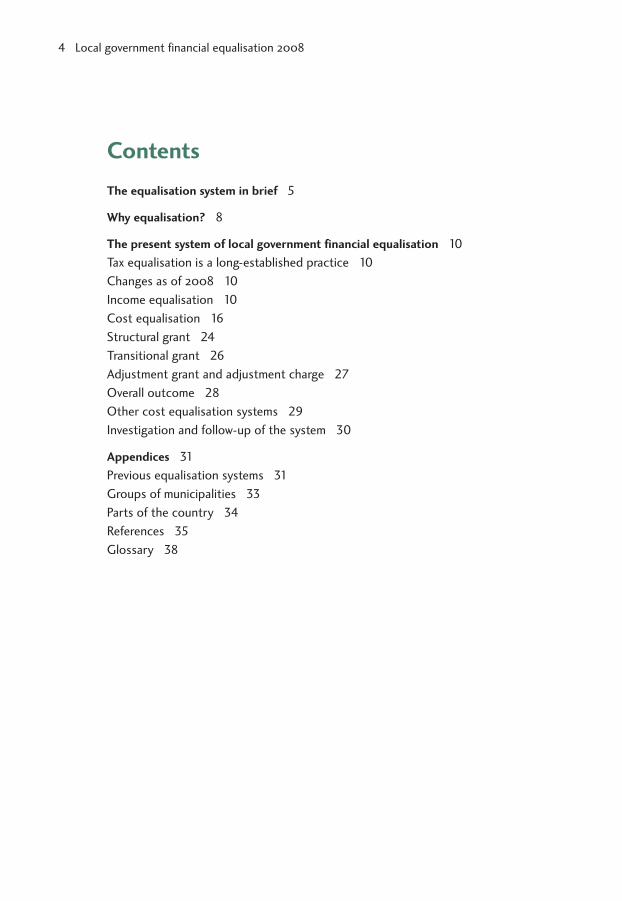
Contents
The equalisation system in brief 5
Why equalisation? 8
The present system of local government financial equalisation 10
Tax equalisation is a long-established practice 10
Changes as of 2008 10
Income equalisation 10
Cost equalisation 16
Structural grant 24
Transitional grant 26
Adjustment grant and adjustment charge 27
Overall outcome 28
Other cost equalisation systems 29
Investigation and follow-up of the system 30
Appendices 31
Previous equalisation systems 31
Groups of municipalities 33
Parts of the country 34
References 35
Glossary 38
4 Local government financial equalisation 2008

The equalisation system in brief
On 1 January 2005 the present system of local government financialequalisation came into operation. It has the same purpose as theprevious system: to put all municipalities and county councils in Swe-den on an equal financial footing to deliver equal levels of services totheir residents, irrespective of the income of local authority residentsand other structural factors. The intention is for differences in localtaxes to largely reflect differences in efficiency and in levels of servi-ces and charges and not to be due to differences in structural condi-tions. The equalisation system can be divided up intofive separate parts: income equalisation, cost equalisa-tion, a structural grant, a transitional grant and an ad-justment grant/charge.
Income equalisation results in an equalisation of taxincome (cf. page 8) between municipalities andbetween county councils. The income equalisationgrant is calculated on the basis of the differencebetween the local authority’s own taxable incomeand a tax equalisation base that corresponds to 115 percent of the national average tax capacity for munici-palities and 110 per cent for county councils. Municipalities and coun-ty councils whose taxable income exceeds these levels have to pay anincome equalisation charge to the Government instead.
One fundamental difference between the system in operation upuntil 2004 and the present system is that horizontal income equalisa-tion between local authorities now consists of an equalisation grantmainly financed by the Government. Thus, the general governmentappropriation for municipalities and county councils was terminatedwhen the new system came into force in 2005.
Cost equalisation evens out differences in structural costs. They can beof two kinds. One is that the need for local authority services varies;for example, municipalities with many older residents have a greaterneed of elderly care. The other is that the cost of producing a particu-lar service varies; for example, schools can cost more in sparsely po-pulated municipalities as teaching there may have to be given insmaller classes and the pupils more often need school transport.
5
The system consists of
five separate parts:
• income equalisation
• cost equalisation
• a structural grant
• a transitional grant
• an adjustment
grant/charge
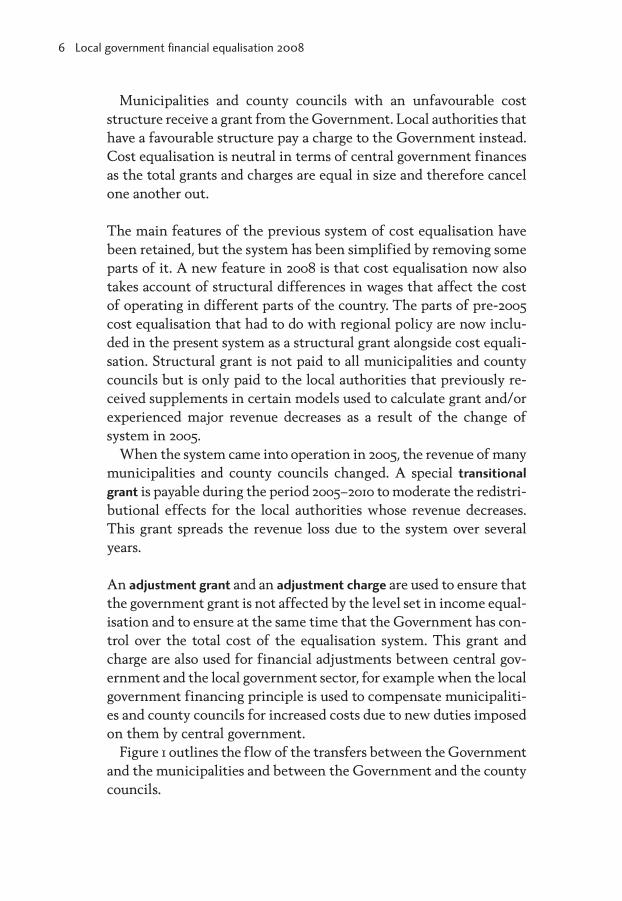
Municipalities and county councils with an unfavourable coststructure receive a grant from the Government. Local authorities thathave a favourable structure pay a charge to the Government instead.Cost equalisation is neutral in terms of central government financesas the total grants and charges are equal in size and therefore cancelone another out.
The main features of the previous system of cost equalisation havebeen retained, but the system has been simplified by removing someparts of it. A new feature in 2008 is that cost equalisation now alsotakes account of structural differences in wages that affect the costof operating in different parts of the country. The parts of pre-2005cost equalisation that had to do with regional policy are now inclu-ded in the present system as a structural grant alongside cost equali-sation. Structural grant is not paid to all municipalities and countycouncils but is only paid to the local authorities that previously re-ceived supplements in certain models used to calculate grant and/orexperienced major revenue decreases as a result of the change ofsystem in 2005.
When the system came into operation in 2005, the revenue of manymunicipalities and county councils changed. A special transitional
grant is payable during the period 2005–2010 to moderate the redistri-butional effects for the local authorities whose revenue decreases.This grant spreads the revenue loss due to the system over severalyears.
An adjustment grant and an adjustment charge are used to ensure thatthe government grant is not affected by the level set in income equal-isation and to ensure at the same time that the Government has con-trol over the total cost of the equalisation system. This grant andcharge are also used for financial adjustments between central gov-ernment and the local government sector, for example when the localgovernment financing principle is used to compensate municipaliti-es and county councils for increased costs due to new duties imposedon them by central government.
Figure 1 outlines the flow of the transfers between the Governmentand the municipalities and between the Government and the countycouncils.
6 Local government financial equalisation 2008
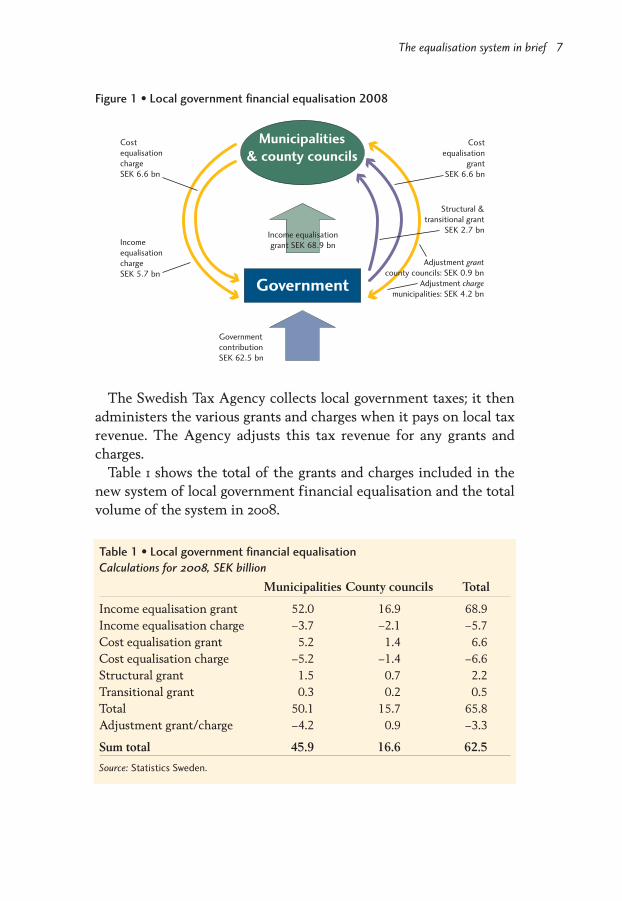
The Swedish Tax Agency collects local government taxes; it thenadministers the various grants and charges when it pays on local taxrevenue. The Agency adjusts this tax revenue for any grants andcharges.
Table 1 shows the total of the grants and charges included in thenew system of local government financial equalisation and the totalvolume of the system in 2008.
The equalisation system in brief 7
Municipalities
& county councils
Government
Income equalisation
grant SEK 68.9 bn
Government
contribution
SEK 62.5 bn
Cost
equalisation
charge
SEK 6.6 bn
Income
equalisation
charge
SEK 5.7 bn
Cost
equalisation
grant
SEK 6.6 bn
Structural &
transitional grant
SEK 2.7 bn
Adjustment grant
county councils: SEK 0.9 bn
Adjustment charge
municipalities: SEK 4.2 bn
Figure 1 • Local government financial equalisation 2008
Table 1 • Local government financial equalisation
Calculations for 2008, SEK billion
Municipalities County councils Total
Income equalisation grant 52.0 16.9 68.9Income equalisation charge –3.7 –2.1 –5.7Cost equalisation grant 5.2 1.4 6.6Cost equalisation charge –5.2 –1.4 –6.6Structural grant 1.5 0.7 2.2Transitional grant 0.3 0.2 0.5Total 50.1 15.7 65.8Adjustment grant/charge –4.2 0.9 –3.3
Sum total 45.9 16.6 62.5
Source: Statistics Sweden.
Why equalisation?
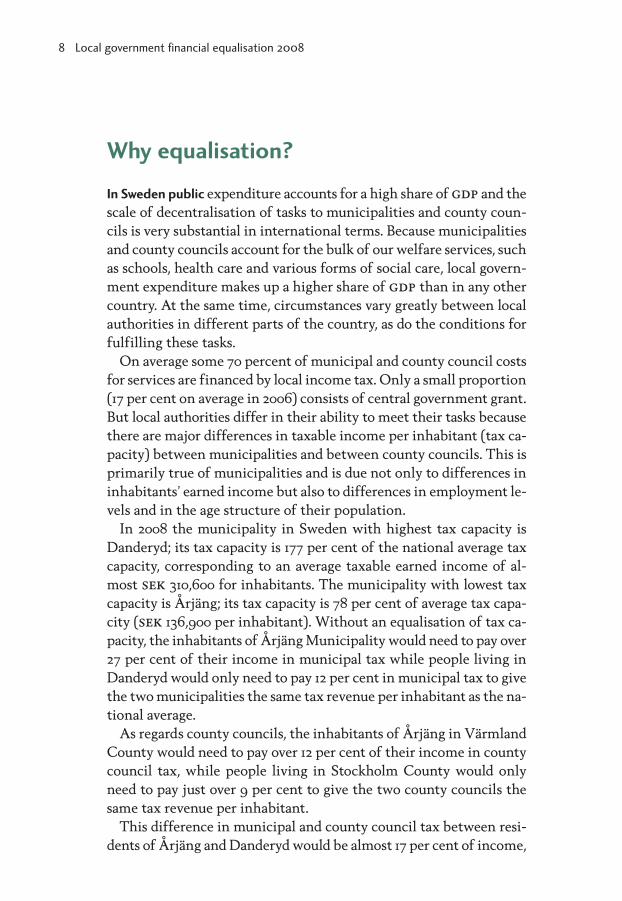
In Sweden public expenditure accounts for a high share of gdp and thescale of decentralisation of tasks to municipalities and county coun-cils is very substantial in international terms. Because municipalitiesand county councils account for the bulk of our welfare services, suchas schools, health care and various forms of social care, local govern-ment expenditure makes up a higher share of gdp than in any othercountry. At the same time, circumstances vary greatly between localauthorities in different parts of the country, as do the conditions forfulfilling these tasks.
On average some 70 percent of municipal and county council costsfor services are financed by local income tax. Only a small proportion(17 per cent on average in 2006) consists of central government grant.But local authorities differ in their ability to meet their tasks becausethere are major differences in taxable income per inhabitant (tax ca-pacity) between municipalities and between county councils. This isprimarily true of municipalities and is due not only to differences ininhabitants’ earned income but also to differences in employment le-vels and in the age structure of their population.
In 2008 the municipality in Sweden with highest tax capacity isDanderyd; its tax capacity is 177 per cent of the national average taxcapacity, corresponding to an average taxable earned income of al-most sek 310,600 for inhabitants. The municipality with lowest taxcapacity is Årjäng; its tax capacity is 78 per cent of average tax capa-city (sek 136,900 per inhabitant). Without an equalisation of tax ca-pacity, the inhabitants of Årjäng Municipality would need to pay over27 per cent of their income in municipal tax while people living inDanderyd would only need to pay 12 per cent in municipal tax to givethe two municipalities the same tax revenue per inhabitant as the na-tional average.
As regards county councils, the inhabitants of Årjäng in VärmlandCounty would need to pay over 12 per cent of their income in countycouncil tax, while people living in Stockholm County would onlyneed to pay just over 9 per cent to give the two county councils thesame tax revenue per inhabitant.
This difference in municipal and county council tax between resi-dents of Årjäng and Danderyd would be almost 17 per cent of income,
8 Local government financial equalisation 2008
i.e. a tax difference of almost sek 28,000 per year, for a middle inco-me earner in Årjäng compared with a person on the same income inDanderyd.
In addition, on account of differences in the need for municipalservices, partly due to differences in population age structure, thecost differences between municipalities can be considerable.
The cost of elderly care in Håbo Municipality, which has the lowestproportion of older people in the country, has been calculated in costequalisation as some sek 3,200 per municipal inhabitant. In DoroteaMunicipality, which has a very high proportion of older people, thiscost has been calculated as almost sek 17,300 per municipal inhabi-tant. This difference corresponds to almost 9 per cent of municipaltax, based on the national average tax base per inhabitant. Withoutequalisation, a sparsely populated municipality with many elderly pe-ople in need of care would have difficulty providing elderly care un-less it levied a very high municipal tax.
In Sweden there has long been broad political consensus about theidea that people should have equal access to welfare, no matter wherein Sweden they live. These two examples point to the need for finan-cial equalisation both for tax income and for differences in structu-ral costs in order to put municipalities and county councils on an equ-al financial footing for the conduct of their activities.
Why equalisation? 9
The present system of local government
financial equalisation
Tax equalisation is a long-established practice
For most of the 20th century municipalities and county councils re-ceived some form of government grant in order to even out the dif-ferences in their financial situation.
The system that ended in 2005 had been in place since 1996. Buteven before 1996 there had long been systems intended to equalise fi-nancial conditions between municipalities and between county coun-cils. An overview of earlier equalisation systems is given on pages31–32.
Changes as of 2008
The equalisation system that came into force in 2005 has beenreviewed, and some of the changes presented in the inquiry reportPartial review of local government financial equalisation have been putinto effect. As of 2008 cost equalisation for both municipalities andcounty councils includes a model that is intended to provide compen-sation for extra costs arising because wages are higher in certain partsof the country. For the municipalities, the settlement structure mo-del has been altered so as to better reflect regional differences in mu-nicipalities’ building costs. For the county councils, the supportingmaterial for the health and medical care model has been updated tobetter reflect actual health care costs.
Income equalisation
Under income equalisation the Government finances the bulk of theequalisation of income between local authorities. Before 2005 muni-cipalities and county councils received a general government grant.When this grant was abolished, an income equalisation grant was in-troduced instead. It is based on the difference between the taxable in-come of local authorities and a tax equalisation base that correspondsto 115 per cent of the national average tax capacity for municipalitiesand 110 per cent for county councils. Municipalities and county coun-
10 Local government financial equalisation 2008

cils whose taxable income exceeds these levels have to pay an incomeequalisation charge to the Government instead.
For municipalities entitled to grant, the grant is calculated on thebasis of 95 per cent of the national average tax rate in 2003 and forcounty councils entitled to grant, the calculation is based on 90 percent of national average tax rate in the same year. For municipalitiesand county councils that are liable to pay a charge, the charge is ba-sed on 85 per cent of average tax rate instead. When tax rates are setin the calculation of grants and charges, account has also to be takenof differences in tax shifts between municipalities and county coun-cils in each county as a result of changes of responsibilities from 1991.One such tax shift was when the municipalities took over responsi-bility for services and health care for older people and persons withdisabilities from the county councils in the early 1990s.
The changes of responsibilities that took place in the 1990s in-volved municipalities taking over responsibility from county councilsfor several services. Changes of responsibility can also occur in theopposite direction. This has been regulated financially through taxshifts that have resulted in municipalities increasing their taxes andcounty councils making corresponding cuts in taxes. As tax shiftshave taken place at different levels in different counties, this must betaken into account in the calculation. So the existing differences incounty-level tax rates depend on the extent to which municipalitieshave taken over services from county councils and not on what taxrates the municipalities in the county have chosen.
In income equalisation for 2008, 11 municipalities and one countycouncil have to pay an income equalisation charge.
The Government finances a large part of the income equalisationgrant. Part of the central government funds used for this purposecome from the former general grant to local government and formerspecific grants. The charge is used to part-finance equalisation. Thecharge for the local authorities that pay into the present system is lo-wer than in the system that was in force until 2005. This is for two re-asons: first, the county-level tax rate used to calculate the charge hasbeen reduced to 85 per cent and, second, the charge is only calculatedon the part of the tax base that exceeds 115 per cent and 110 per centof tax capacity respectively, compared with 100 per cent in theprevious equalisation system.
The present system of local government financial equalisation 11
12 Local government financial equalisation 2008
Government
Income
equalisation
charge SEK 3.7 bn
Tax capacity, %
100
115
Municipalities
1–290
Income
equalisation
grant SEK 52 bn
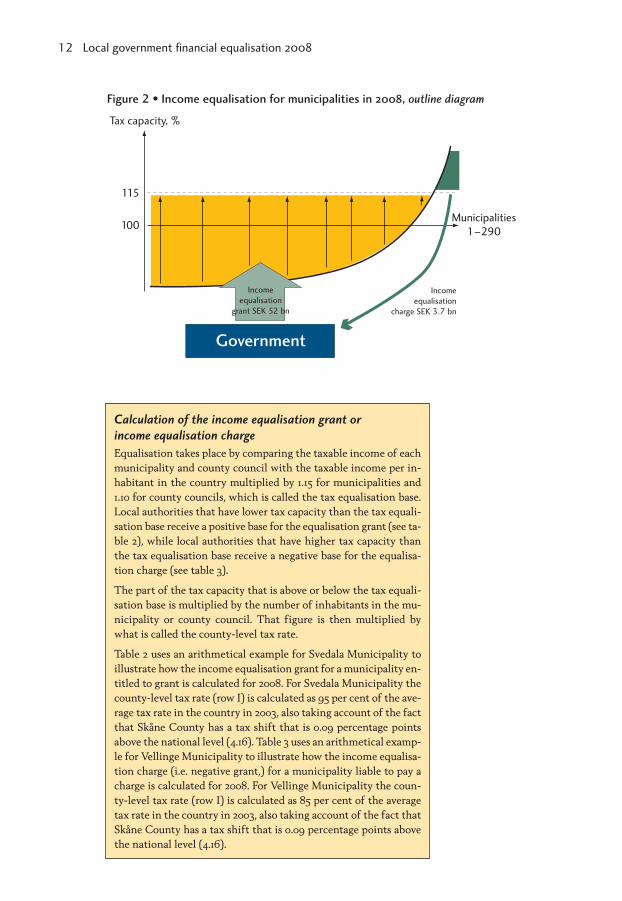
Figure 2 • Income equalisation for municipalities in 2008, outline diagram
Calculation of the income equalisation grant or
income equalisation charge
Equalisation takes place by comparing the taxable income of eachmunicipality and county council with the taxable income per in-habitant in the country multiplied by 1.15 for municipalities and1.10 for county councils, which is called the tax equalisation base.Local authorities that have lower tax capacity than the tax equali-sation base receive a positive base for the equalisation grant (see ta-ble 2), while local authorities that have higher tax capacity thanthe tax equalisation base receive a negative base for the equalisa-tion charge (see table 3).
The part of the tax capacity that is above or below the tax equali-sation base is multiplied by the number of inhabitants in the mu-nicipality or county council. That figure is then multiplied bywhat is called the county-level tax rate.
Table 2 uses an arithmetical example for Svedala Municipality toillustrate how the income equalisation grant for a municipality en-titled to grant is calculated for 2008. For Svedala Municipality thecounty-level tax rate (row I) is calculated as 95 per cent of the ave-rage tax rate in the country in 2003, also taking account of the factthat Skåne County has a tax shift that is 0.09 percentage pointsabove the national level (4.16). Table 3 uses an arithmetical examp-le for Vellinge Municipality to illustrate how the income equalisa-tion charge (i.e. negative grant,) for a municipality liable to pay acharge is calculated for 2008. For Vellinge Municipality the coun-ty-level tax rate (row I) is calculated as 85 per cent of the averagetax rate in the country in 2003, also taking account of the fact thatSkåne County has a tax shift that is 0.09 percentage points abovethe national level (4.16).

The present system of local government financial equalisation 13
Greater
GöteborgGreater
Stockholm
Greater
Malmö
9,132 to 13,257 (92)
6,861 to 9,132 (95)
0 to 6,861 (92)
–18,174 to 0 (11)
Municipalities
2,630 to 4,048 (7)
2,321 to 2,630 (6)
0 to 2,321 (7)
–1,014 to 0 (1)
County councils
Figure 3 • Income equalisation 2008
SEK per inhabitant
Source: Statistics Sweden.
Table 2 • Calculation of income equalisation grant for Svedala Municipality 2008
A Adjusted tax base for the municipality in 2008, sek 3,299,754,888B Municipal population, 1 November 2007 19,104C Adjusted tax base for Svedala, sek/inhabitant, A/B 172,726D Adjusted national average tax capacity, sek/inhabitant 175,415E Municipal tax capacity, proportion of average tax capacity, %, C/D 98.5
F Percentage for tax equalisation base, whole country, % 115
G Municipality’s tax equalisation base, sek, B*D*F 3,853,797,384H Base for equalisation grant, sek, G–A 554,042,496I County-level tax rate, 95 per cent * national average
(20.64)+0.09 (4.25–4.16), adjusted for differences in tax shifts 19.70
J Municipality’s income equalisation grant, sek/inhabitant, H*I/B/100 5,713
K Municipality’s income equalisation grant, sek, J*B 109,141,152

Tax increases and reductions do not affect the grant or charge
Because the county-level tax rates are locked at the 2003 level, muni-cipalities and county councils cannot influence their grants or char-ges in income equalisation by altering their own tax rate. So changesin a local authority’s own tax rate only result in an increase or de-crease in the local authority’s own tax revenue.
In combination with a high level of compensation, the fact that thecounty-level tax rate is independent of the tax rate in a particular mu-nicipality or county council can result in negative marginal effects.Municipalities and county councils whose own tax rate is lower thanthe county-level tax rate experience a reduction of their overall in-come when their own tax base increases. This is one of the reasonswhy the county-level tax rate for municipalities and county councilsliable to pay a charge is only 85 per cent.
Which local authorities get grants and which local authorities pay?
The main charge-payers are suburban municipalities in StockholmCounty. Stockholm Municipality is the only one of the three metro-politan municipalities to pay a charge. Sparsely populated municipa-lities and the groups of other small municipalities (see page 33) re-ceive the largest grants per inhabitant. In income equalisation forcounty councils only Stockholm County Council pays a charge in2008. County councils in the rest of the country receive a grant.
Equalisation level
The equalisation level, i.e. the municipality’s own tax revenue inclu-ding equalisation set in relation to the national average, is between
14 Local government financial equalisation 2008
Table 3 • Calculation of income equalisation charge for Vellinge Municipality 2008
A Adjusted tax base for the municipality in 2008, sek 6,854,276,541B Municipal population, 1 November 2007 32,575C Adjusted tax base for Vellinge, sek per inhabitant, A/B 210,415D Adjusted national average tax capacity, sek/inhabitant 175,415E Municipal tax capacity, proportion of average tax capacity, %, C/D 120.0
F Percentage for tax equalisation base, whole country, % 115
G Municipality’s tax equalisation base, sek, B*D*F 6,571,265,169H Base for equalisation grant, sek, G–A 283,011,372I County-level tax rate, 85 per cent * national average 2003
adjusted for differences in tax shifts 17.63J Municipality’s income equalisation charge, sek/inhabitant,
H*I/B/100 –1,532K Municipality’s income equalisation charge, sek, J*B –49,904,900

113 and 115 per cent for municipalities whose own tax capacity is be-low the guaranteed level. For municipalities whose own tax capacityis above the guaranteed level, the level of equalisation is between 115
The present system of local government financial equalisation 15
SE
K p
er
inh
abit
ant
–2,000
0
2,000
4,000
6,000
8,000
10,000
12,000
ChargeGrant
Oth
er
< 12
,50
0 in
hab
.
Oth
er 1
2,5
00
–
25
,00
0 in
hab
.
Oth
er
> 2
5,0
00
inhab
.
Man
ufa
cturi
ng
munic
ipal
itie
s
Sp
arse
ly p
op
.
munic
ipal
itie
s
Co
mm
ute
r
munic
ipal
itie
s
Met
rop
olit
an
munic
ipal
itie
s
Sub
urb
an
munic
ipal
itie
s
Larg
e ci
ties
Net
Figure 4 • Outcome of income equalisation for municipalities in 2008
SEK/inhabitant per municipality group*, weighted average
*According to the classification of the Swedish Association of Local Authoritiesand Regions. See page 33 for how the municipality groups are defined.
Source: Statistics Sweden.
SE
K p
er
inh
abit
ant
–1,500
–1,000
–500
0
500
1,000
1,500
2,000
2,500
ChargeGrant
Northern SwedenSouthern SwedenEastern Sweden
excl. Stockholm County
Stockholm County
Net
Figure 5 • Outcome of income equalisation for county councils in 2008
SEK/inhabitant per part of the country group*, weighted average
*According to Statistics Sweden’s classification. See page 34 for which countycouncils are included in each part of the country.
Source: Statistics Sweden.
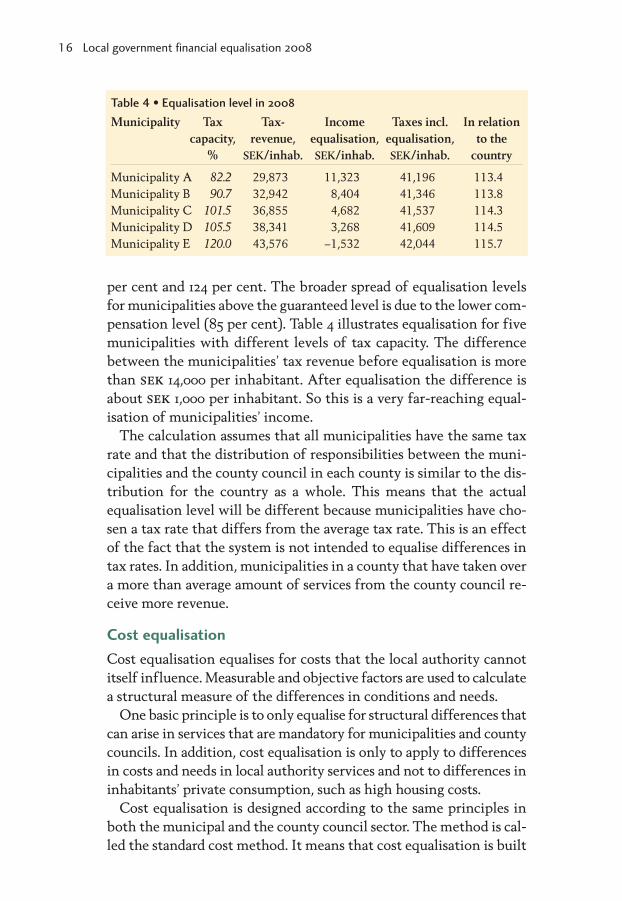
per cent and 124 per cent. The broader spread of equalisation levelsfor municipalities above the guaranteed level is due to the lower com-pensation level (85 per cent). Table 4 illustrates equalisation for fivemunicipalities with different levels of tax capacity. The differencebetween the municipalities’ tax revenue before equalisation is morethan sek 14,000 per inhabitant. After equalisation the difference isabout sek 1,000 per inhabitant. So this is a very far-reaching equal-isation of municipalities’ income.
The calculation assumes that all municipalities have the same taxrate and that the distribution of responsibilities between the muni-cipalities and the county council in each county is similar to the dis-tribution for the country as a whole. This means that the actualequalisation level will be different because municipalities have cho-sen a tax rate that differs from the average tax rate. This is an effectof the fact that the system is not intended to equalise differences intax rates. In addition, municipalities in a county that have taken overa more than average amount of services from the county council re-ceive more revenue.
Cost equalisation
Cost equalisation equalises for costs that the local authority cannotitself influence. Measurable and objective factors are used to calculatea structural measure of the differences in conditions and needs.
One basic principle is to only equalise for structural differences thatcan arise in services that are mandatory for municipalities and countycouncils. In addition, cost equalisation is only to apply to differencesin costs and needs in local authority services and not to differences ininhabitants’ private consumption, such as high housing costs.
Cost equalisation is designed according to the same principles inboth the municipal and the county council sector. The method is cal-led the standard cost method. It means that cost equalisation is built
16 Local government financial equalisation 2008
Table 4 • Equalisation level in 2008
Municipality Tax Tax- Income Taxes incl. In relationcapacity, revenue, equalisation, equalisation, to the
% SEK/inhab. SEK/inhab. SEK/inhab. country
Municipality A 82.2 29,873 11,323 41,196 113.4Municipality B 90.7 32,942 8,404 41,346 113.8Municipality C 101.5 36,855 4,682 41,537 114.3Municipality D 105.5 38,341 3,268 41,609 114.5Municipality E 120.0 43,576 –1,532 42,044 115.7
up of a number of separate models. The various models refer to ser-vices like childcare or elderly care.
The service-based structure of cost equalisation has both advant-ages and disadvantages. By treating each area separately it is possibleto capture the very different conditions that apply to different ser-vices. It is also possible to adjust cost equalisation when the serviceschange.
The main disadvantage is that this equalisation is extensive with alarge number of factors and models. But, on the other hand, a simplersystem risks missing certain structural costs, resulting in a less fairsystem. So the design of cost equalisation is a trade-off between sim-plicity and fairness.
For municipalities nine services are included in equalisation, whilefor county councils three activities are included – health and medicalcare, wage structure and compensation for revenue slippage in theevent of population increase. There is also one service with shared re-sponsibility, namely public transport.
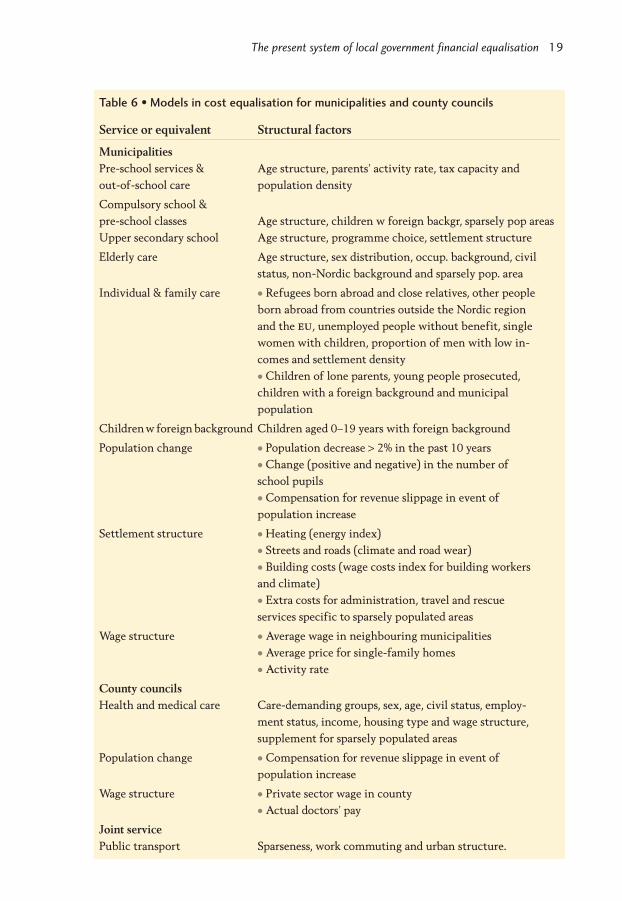
Differences in standard costs are intended to reflect differences instructural costs, i.e. costs that municipalities and county councils can-not themselves control. The different services and variables in eachmodel are set out in Table 6 on page 19.
What does cost equalisation cover?
As mentioned above, cost equalisation covers age structure, ethnicity,socioeconomic conditions and geography, as well as extra structuralcosts for wages as of 2008. The model for each service uses factors thatexplain the extra structural costs associated with that particular ser-vice. Table 5 shows the categories of extra costs for which the systemprovides compensation in each model.
The present system of local government financial equalisation 17
Government
Cost
equalisation
charge SEK 5.2 bn
Favourable
structure
Grant/charge
Average Municipalities
1–290
Cost
equalisation
charge SEK 5.2 bn
Unfavourable
structure
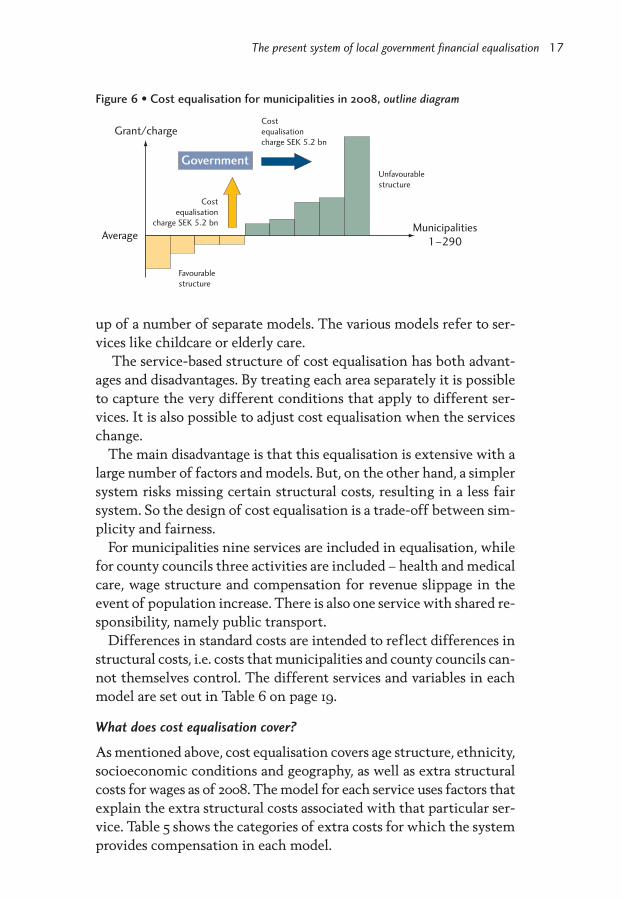
Figure 6 • Cost equalisation for municipalities in 2008, outline diagram

Services included in cost equalisation
The standard cost in the various models is obtained by multiplyingthe various variables by the national average cost for each service. Forexample, the standard cost for compulsory school is obtained bymultiplying the proportion of children of school age by the nationalaverage cost per pupil and by multiplying the proportion of pupilsborn outside Sweden, Norway and Denmark by the average cost formother tongue instruction. Moreover, extra costs are calculated forsmall schools and school transport.
Cost equalisation does not and is not intended to take account ofthe actual costs of municipalities or county councils. The standardcost is the cost that the municipality or county council would have ifit ran the service at an average cost level, taking account of its ownstructural factors under cost equalisation. The use of the nationalaverage cost means that equalisation is carried out to the average ser-vice level, quality, charge level and efficiency. If a municipality or
18 Local government financial equalisation 2008
Table 5 • Extra structural costs by category
Service Age Ethni- Socio- Geo-city economic graphy
conditions
MunicipalitiesPre-school services and out-of-school care • • •
Compuls. school & pre-school classes • • •
Upper secondary school • • •
Elderly care • • • •
Individual & family care (•) • • •
Children with foreign background (•) •
Population change (•)Settlement structure •
Wage structure
County councilsHealth and medical care • • •
Population changeWage structure
Joint servicePublic transport •
Note.: (•) means that age is included as a factor but that it is not the primary objective ofequalisation in that particular model. The wage structure models are not included in anyof the categories specified.
The present system of local government financial equalisation 19
Table 6 • Models in cost equalisation for municipalities and county councils
Service or equivalent Structural factors
MunicipalitiesPre-school services & Age structure, parents’ activity rate, tax capacity and out-of-school care population density
Compulsory school &pre-school classes Age structure, children w foreign backgr, sparsely pop areasUpper secondary school Age structure, programme choice, settlement structure
Elderly care Age structure, sex distribution, occup. background, civilstatus, non-Nordic background and sparsely pop. area
Individual & family care • Refugees born abroad and close relatives, other people born abroad from countries outside the Nordic region and the eu, unemployed people without benefit, single women with children, proportion of men with low in-comes and settlement density• Children of lone parents, young people prosecuted, children with a foreign background and municipal population
Childrenw foreign background Children aged 0–19 years with foreign background
Population change • Population decrease > 2% in the past 10 years• Change (positive and negative) in the number of school pupils• Compensation for revenue slippage in event of population increase
Settlement structure • Heating (energy index)• Streets and roads (climate and road wear)• Building costs (wage costs index for building workers and climate)• Extra costs for administration, travel and rescue services specific to sparsely populated areas
Wage structure • Average wage in neighbouring municipalities• Average price for single-family homes• Activity rate
County councilsHealth and medical care Care-demanding groups, sex, age, civil status, employ-
ment status, income, housing type and wage structure, supplement for sparsely populated areas
Population change • Compensation for revenue slippage in event of population increase
Wage structure • Private sector wage in county• Actual doctors’ pay
Joint servicePublic transport Sparseness, work commuting and urban structure.
county council has higher costs because it provides a higher than ave-rage service level, this must be financed through higher taxes, moreefficient services or a higher level of charge-financing. In the case oflower costs, the opposite is true. No local authority is “punished” or“favoured” because it has a cost level that differs from the averagecost level.
Calculation of grant or charge in cost equalisation
The total of the standard costs for all the models is called the muni-cipality’s or county council’s structural cost. If the structural cost ishigher than the national average, the municipality or county councilreceives a grant corresponding to the difference to the average. Themunicipality or county council is regarded as having an unfavourablestructure in relation to other municipalities or county councils.
If the structural cost is below the national average, the municipal-ity or county council is regarded as having a favourable structure inrelation to other municipalities or county councils and therefore paysa charge in the corresponding way.
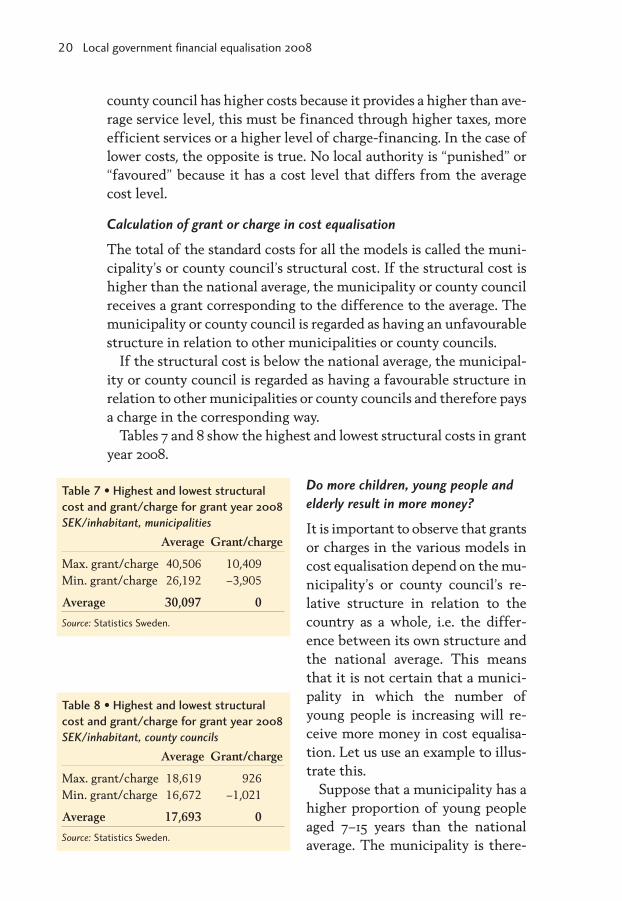
Tables 7 and 8 show the highest and lowest structural costs in grantyear 2008.
Do more children, young people and
elderly result in more money?
It is important to observe that grantsor charges in the various models incost equalisation depend on the mu-nicipality’s or county council’s re-lative structure in relation to thecountry as a whole, i.e. the differ-ence between its own structure andthe national average. This meansthat it is not certain that a munici-pality in which the number ofyoung people is increasing will re-ceive more money in cost equalisa-tion. Let us use an example to illus-trate this.
Suppose that a municipality has ahigher proportion of young peopleaged 7–15 years than the nationalaverage. The municipality is there-
20 Local government financial equalisation 2008
Table 7 • Highest and lowest structural
cost and grant/charge for grant year 2008
SEK/inhabitant, municipalities
Average Grant/charge
Max. grant/charge 40,506 10,409Min. grant/charge 26,192 –3,905
Average 30,097 0
Source: Statistics Sweden.
Table 8 • Highest and lowest structural
cost and grant/charge for grant year 2008
SEK/inhabitant, county councils
Average Grant/charge
Max. grant/charge 18,619 926Min. grant/charge 16,672 –1,021
Average 17,693 0
Source: Statistics Sweden.
fore deemed to have an unfavourable structure in cost terms and, asa result, it receives a supplement in the model for compulsory school.If, over time, the proportion of young people in the municipality in-creases as much as in the country as a whole, the difference will re-main unchanged. So the supplement for compulsory school will notbe altered. In this case, the municipality’s cost increase is deemed tobe the same as for the country as a whole.
The fact that a municipality gets more children, young people andolder people does not guarantee the municipality a higher grant in theway that the former specific grants did. Cost equalisation is an equal-isation system, not a grant system. The important thing in terms ofequalisation is how much the municipality’s age structure deviatesfrom the national average age structure.
So there is no direct link between the trend in the number of pupilsor older people, for example, and central government grant to muni-cipalities and county councils. Any additional funding for municipa-lities and county councils is provided when the Riksdag and the Go-vernment decide to increase the appropriation for municipalities andcounty councils in the central government budget. The result of thisdecision is seen as a change in an adjustment item (see page 27). Ifmunicipal or county council costs change because central govern-ment changes their duties, then compensation is provided through anadjustment in line with the local government financing principle.
Annual update of cost equalisation
In order for cost equalisation to take account of conditions in the in-dividual municipality or county council in each individual year, manyof the factors on which this equalisation is based must be updated an-nually. For the municipalities this primarily applies to age structureand the factors that reflect the municipality’s socio-economic struc-ture. For the county councils it applies to the factors that govern theoutcome of the model for health and medical care. It is perfectly na-tural for updates of certain models to lead to a variation in the out-come of cost equalisation for an individual municipality/countycouncil from year to year. As both grants and charges vary from yearto year, the sum that is redistributed also varies.
How much is redistributed?
The size of the redistribution in the various models depends both onthe cost of the service concerned and the size of the structural differ-ences. Elderly care is the municipal service that costs most, and most
The present system of local government financial equalisation 21

money is also redistributed in that model. Individual and family carecosts less than half as much as elderly care. However, in this area thereare major structural differences that push up the amount redistribu-ted in the model. The sum total of the redistribution made in the va-rious models exceeds the total redistribution in cost equalisation.This is because a municipality can receive a supplement in one modelat the same time as the municipality has a deduction in another mo-del. No municipality receives supplements in every model; however,a few municipalities have a deduction in every model. Each model isself-financed – that is to say that the supplements and deductionscancel one another out.
22 Local government financial equalisation 2008
Table 9 • Redistribution and number of grant and charge municipalities in the
models used in cost equalisation in 2008
Model sek Number of municipalities w.million supplement deduction
Net total 5,198 150 140Children with foreign background 466 25 265Wages 685 42 248Population change 906 153 137Settlement structure 961 77 213Public transport 1,065 59 231Upper secondary school 1,959 245 45Compulsory (upper & secondary) school 3,972 205 85Childcare 4,271 59 231Individual and family care 4,292 30 260Elderly care 6,503 206 84
Table 10 • Redistribution and number of grant and charge county councils in
the models used in cost equalisation in 2008
Model sek Number of municipalities w.million supplement deduction
Net total 1,360 6 15Health care 1,399 11 10of which sparsely populated areas 487 13 8Population change 0 0 0Public transport 1,356 1 20Wages 207 3 18
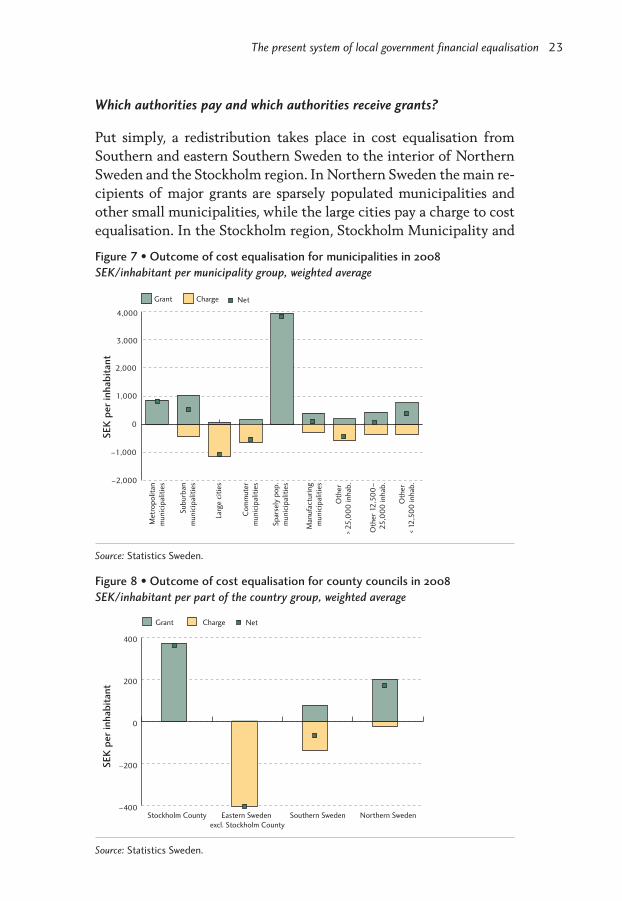
Which authorities pay and which authorities receive grants?
Put simply, a redistribution takes place in cost equalisation fromSouthern and eastern Southern Sweden to the interior of NorthernSweden and the Stockholm region. In Northern Sweden the main re-cipients of major grants are sparsely populated municipalities andother small municipalities, while the large cities pay a charge to costequalisation. In the Stockholm region, Stockholm Municipality and
The present system of local government financial equalisation 23
SE
K p
er
inh
abit
ant
–2,000
–1,000
0
1,000
2,000
3,000
4,000
ChargeGrant
Oth
er
< 12
,50
0 in
hab
.
Oth
er 1
2,5
00
–
25
,00
0 in
hab
.
Oth
er
> 2
5,0
00
inhab
.
Man
ufa
cturi
ng
munic
ipal
itie
s
Sp
arse
ly p
op
.
munic
ipal
itie
s
Co
mm
ute
r
munic
ipal
itie
s
Met
rop
olit
an
munic
ipal
itie
s
Sub
urb
an
munic
ipal
itie
s
Larg
e ci
ties
Net
Figure 7 • Outcome of cost equalisation for municipalities in 2008
SEK/inhabitant per municipality group, weighted average
Source: Statistics Sweden.
SE
K p
er
inh
abit
ant
–400
–200
0
200
400
ChargeGrant
Northern SwedenSouthern SwedenEastern Sweden
excl. Stockholm County
Stockholm County
Net
Figure 8 • Outcome of cost equalisation for county councils in 2008
SEK/inhabitant per part of the country group, weighted average
Source: Statistics Sweden.

most suburban municipalities are grant recipients. In Southern Swe-den it is mostly large cities and suburban municipalities that pay acharge. In some parts of eastern Southern Sweden there are munici-palities that receive substantial grants. Among county councils thelargest grants go to Stockholm and to certain county councils inNorthern Sweden.*
Structural grant
Structural grant consists of the parts of the previous equalisationsystem that have to do with regional policy and that are no longer tobe included in cost equalisation. Structural grant has therefore beenremoved from cost equalisation and is intended to reinforce munici-
24 Local government financial equalisation 2008
Greater
GöteborgGreater
Stockholm
Greater
Malmö
1,082 to 10,409 (80)
0 to 1,082 (70)
–776 to 0 (70)
–3,905 to –776 (70)
Municipalities
282 to 926 (3)
0 to 282 (3)
–363 to 0 (8)
–1,021 to –363 (7)
County councils
Figure 9 • Cost equalisation 2008
SEK/inhabitant
Source: Statistics Sweden.
*Se Parts of the country, p. 34, for definitions of Southern, Eastern and Northern Sweden.
palities and county councils with a small population and/or labourmarket problems. The grant is based on two factors. The first is theprevious standard costs for business and employment promotion andfor a weak population base (municipalities) as well as compensationto small county councils that were included in cost equalisation up toand including 2004. The second is compensation to municipalitiesand county councils whose revenue loss exceeded a set level due tochanges in the equalisation system from 2005. Municipalities whosegrant reduction exceeds 0.56 per cent of their own tax base receive astructural grant corresponding to the excess amount. The correspond-ing figure for county councils is 0.28 per cent. For municipalities andcounty councils with an average tax base per inhabitant this grantcorresponds to some sek 850 and sek 425 per inhabitant respective-ly.
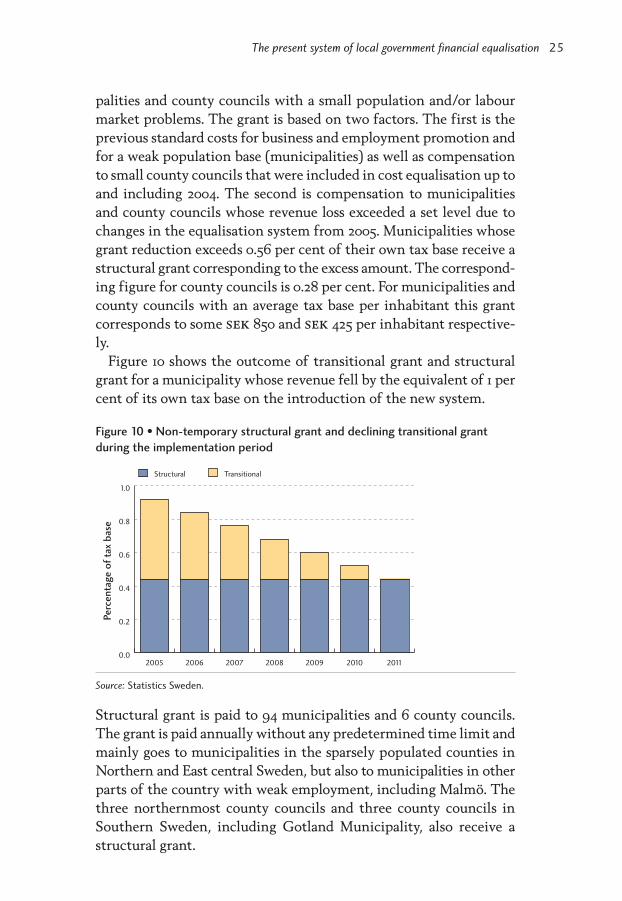
Figure 10 shows the outcome of transitional grant and structuralgrant for a municipality whose revenue fell by the equivalent of 1 percent of its own tax base on the introduction of the new system.
Structural grant is paid to 94 municipalities and 6 county councils.The grant is paid annually without any predetermined time limit andmainly goes to municipalities in the sparsely populated counties inNorthern and East central Sweden, but also to municipalities in otherparts of the country with weak employment, including Malmö. Thethree northernmost county councils and three county councils inSouthern Sweden, including Gotland Municipality, also receive astructural grant.
The present system of local government financial equalisation 25
Perc
en
tage o
f ta
x b
ase
0.0
0.2
0.4
0.6
0.8
1.0
TransitionalStructural
2011201020092008200720062005
Figure 10 • Non-temporary structural grant and declining transitional grant
during the implementation period
Source: Statistics Sweden.

Transitional grant
The municipalities and county councils that lost out when the pre-sent system was introduced receive compensation in the form of a tran-sitional grant over a period of up to six years (2005–2010). This givesmunicipalities and county councils with negative changes a certainamount of time to adjust their costs if the reduction exceeds a par-ticular level. The grant means that the annual revenue reductionmust not be larger than 0.08 per cent of their own tax base (or somesek 120 per inhabitant) for municipalities and 0.04 per cent for coun-ty councils (some sek 60 per inhabitant).
26 Local government financial equalisation 2008
Greater
GöteborgGreater
Stockholm
Greater
Malmö
451to 5,438 (47)
1 to 451 (47)
0 (196)
Municipalities
502 to 1,426 (3)
1 to 502 (3)
0 (14)
County councils
Figure 11 • Structural grant 2008
SEK/inhabitant
Source: Statistics Sweden.

Adjustment grant and adjustment charge
In the government-financed income equalisation system, costs forthe income equalisation grant increase in line with the growth of thelocal government tax base. So the Government cannot know in ad-vance what the final total will be. In view of the need to be able toinfluence the macroeconomic scope for the local government sectorand also central government finances, it is possible to influence thetotal grant budget for municipalities and county councils. There isalso a need to be able to make financial adjustments for changes of re-sponsibility between the local government sector and central govern-ment when the local government financing principle is applied.
The way the adjustment item in the equalisation system works isthat if the sum of all grants minus the charges paid in is less than theamount that the Government has decided to transfer to municipal-ities or county councils, then all municipalities or county councils re-ceive an adjustment grant corresponding to the difference. The ad-justment grant is paid as a uniform amount per inhabitant. If, instead,the sum of all grants minus the charges paid in is higher than theamount that central government has decided to transfer, then the dif-ference has to be recovered through an adjustment charge from allmunicipalities and county councils, calculated in the same way as theadjustment grant. This enables the Riksdag to decide how much fi-nance is to be allocated to municipalities and county councils.
The total government grant budget for 2008 is sek 62.5 billion. For2007 it amounted to sek 70.8 billion; but as a result of the introduc-tion of a municipal real estate charge, the Government grant budgetfor 2008 has been reduced by sek 12 billion, which corresponds to thecharge.
The present system of local government financial equalisation 27
Table 11 • Calculation of the adjustment charge for 2008
SEK billion and SEK/inhabitant
Municipalities County councils
Amount of appropriation 45.9 16.6
Sum of grants minus charges 50.1 15.7Difference –4.2 0.9
Adjustment charge/grant, sek per inhabitant –458 95
Source: Statistics Sweden.

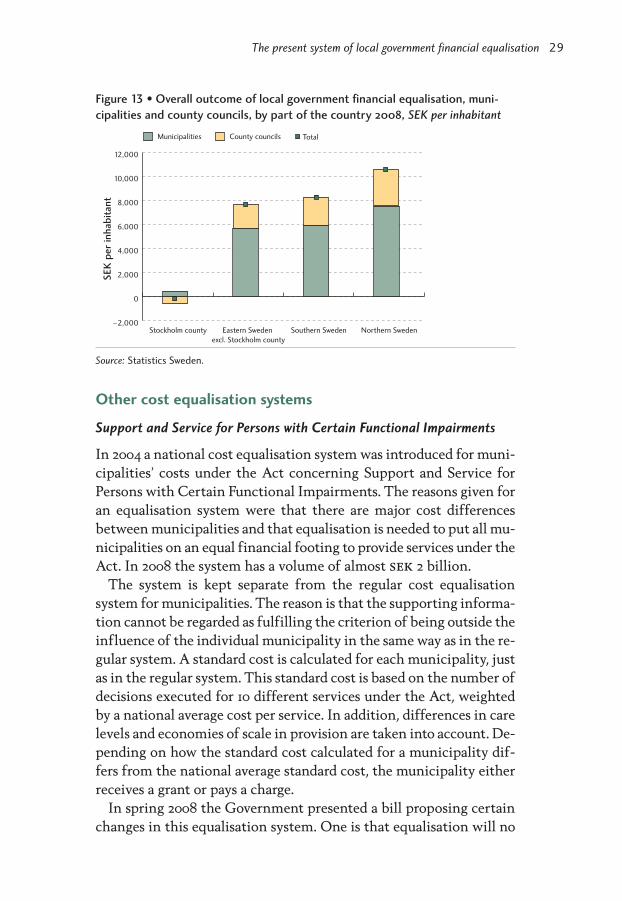
Overall outcome
The overall outcome of local government financial equalisation isshown in Figure 12 and Figure 13. We want to use these figures to il-lustrate, at a general level, the overall outcome of the local govern-ment finance systems in different parts of the country. The munici-palities and county councils are therefore described together here.
After these grants and charges, municipalities and county councilsare on an equal financial footing to conduct their activities. A largersum is redistributed between municipalities than between countycouncils. This is because the municipal sector accounts for a largershare of gdp.
Despite relatively large differences in age structure, socio-econo-mic conditions and geography, it is mainly the differences in the abi-lity to levy tax that drive the major redistribution between differentparts of the country.
In cash terms Southern Sweden receives most, followed by North-ern Sweden. The Stockholm region pays a net grant to the rest of thecountry.
If the number of people in different parts of the country is takeninto account, another picture emerges. Per inhabitant, Northern Swed-en receives the largest supplement for both municipalities and coun-ty councils. For Southern Sweden and East central Sweden there is nosignificant change in the outcome, with a certain overweight forcounty councils in Southern Sweden.
The Stockholm region is the only part of the country that pays anet charge in the equalisation system.
28 Local government financial equalisation 2008
SE
K b
illio
n
–5
0
5
10
15
20
25
30
35
County councilsMunicipalities
Northern SwedenSouthern SwedenEastern Sweden
excl. Stockholm county
Stockholm county
Total
Figure 12 • Overall outcome of local government financial equalisation, muni-
cipalities and county councils, by part of the country 2008, SEK billion
Source: Statistics Sweden.
Other cost equalisation systems
Support and Service for Persons with Certain Functional Impairments
In 2004 a national cost equalisation system was introduced for muni-cipalities’ costs under the Act concerning Support and Service forPersons with Certain Functional Impairments. The reasons given foran equalisation system were that there are major cost differencesbetween municipalities and that equalisation is needed to put all mu-nicipalities on an equal financial footing to provide services under theAct. In 2008 the system has a volume of almost sek 2 billion.
The system is kept separate from the regular cost equalisationsystem for municipalities. The reason is that the supporting informa-tion cannot be regarded as fulfilling the criterion of being outside theinfluence of the individual municipality in the same way as in the re-gular system. A standard cost is calculated for each municipality, justas in the regular system. This standard cost is based on the number ofdecisions executed for 10 different services under the Act, weightedby a national average cost per service. In addition, differences in carelevels and economies of scale in provision are taken into account. De-pending on how the standard cost calculated for a municipality dif-fers from the national average standard cost, the municipality eitherreceives a grant or pays a charge.
In spring 2008 the Government presented a bill proposing certainchanges in this equalisation system. One is that equalisation will no
The present system of local government financial equalisation 29
SE
K p
er
inh
abit
ant
–2,000
0
2,000
4,000
6,000
8,000
10,000
12,000
County councilsMunicipalities
Northern SwedenSouthern SwedenEastern Sweden
excl. Stockholm county
Stockholm county
Total
Figure 13 • Overall outcome of local government financial equalisation, muni-
cipalities and county councils, by part of the country 2008, SEK per inhabitant
Source: Statistics Sweden.
longer take account of any economies of scale. The changes are pro-posed to take effect from 2009.
Pharmaceuticals
Since 1998 the county councils have had formal responsibility forpaying for pharmaceutical benefits. However, the Government fi-nances the main part of these costs through a special governmentgrant. In 2008, this government grant amounts to sek 21.6 billion.There is no direct link between the prescription of pharmaceuticalsand the grant paid by the Government.
The government grant is allocated to individual county councilsthrough a special model that is intended to reflect differences inneeds and not actual consumption. Cost equalisation for pharmaceut-icals is conducted in a special system completely separate from the re-gular equalisation system for county councils.
The model is based on the consumption of pharmaceuticals by sexin different age groups, but account is also taken of socio-economicfactors like income, housing, employment and civil status. In addi-tion, separate compensation is provided for pharmaceuticals for cer-tain diseases that are expensive and that are unevenly distributedamong county councils. This applies to certain hereditary diseasesand the incidence of hiv.
Investigation and follow-up of the system
In 2005 an inquiry chair was appointed to continuously follow up thesystem of local government financial equalisation. The inquiry chairhas submitted two interim reports on the inquiry’s remit, one in 2006and one in 2007.
The 2006 report proposed the establishment of a permanent orga-nisation to follow up the equalisation system continuously. The Gov-ernment has assigned this task to the Swedish Agency for Public Man-agement. The Agency is to develop methods of following up local go-vernment financial equalisation and to continuously analyse and pro-pose updates of the various models. The Agency will make an annu-al report to the Government on the results.
The Government intends to appoint an all-party committee of in-quiry whose remit will include evaluating and studying the system oflocal government financial equalisation, including the changes im-plemented in 2008. In addition, alternative methods of income equal-isation with a longer-term perspective are to be studied. The commit-tee will be appointed in 2008.
30 Local government financial equalisation 2008
Previous equalisation systems
The 1966 tax equalisation system
For most of the 20th century municipalities and county councils received someform of government grant in order to even out the differences in their financialsituation. However, an equalisation system in the proper sense of the term wasnot introduced until 1966. The system consisted of two parts: income equalisa-tion along with a separate equalisation grant for municipalities and county coun-cils with high tax rates or a reduced grant for municipalities and county coun-cils with low tax rates. There were a number of specific grants alongside the equal-isation system. The main features of this system were to remain in force up un-til 1992, even though the system was modified on a number of occasions.
The 1993 reform of local government finance
In 1993 extensive changes were made to the systems of central governmentgrants to municipalities following proposals by the Local Government FinanceCommittee. The biggest change was that several specific government grantswere replaced by a general grant, i.e. “all the money in one pot”. The new centralgovernment equalisation grant for municipalities consisted of three parts: in-come equalisation, cost equalisation and a supplement for municipalities with alarge population decrease. However, criticism was directed at the cost equalisa-tion component in particular and a new inquiry was therefore appointed to re-view it. An additional problem was that not all municipalities were included inincome equalisation. Municipalities with a tax capacity that was higher than theguaranteed level fell outside the grant system. Therefore the government grantcould not be used for general financial adjustments between central governmentand the municipalities. In the case of the county councils, only small changeswere made in 1993.
1996 – a new government grant and equalisation system
The 1996 government grant and equalisation system consisted of four parts: in-come equalisation, cost equalisation, a general government grant and transition-al regulations. Unlike previous systems, all municipalities and county councilswere now included. Equalisation was now also neutral in terms of central govern-ment finances, as both income and cost equalisation were financed by munici-palities and county councils. Municipalities and county councils with a tax cap-acity below and/or structural costs above the average level received grants while
Appendices 31
other municipalities and county councils had to pay a charge. In principle the na-tional total of the charges was equal to the total amount of the grants.
Cost equalisation was designed according to the same principles in both themunicipal and county council sectors. The method is called the standard costmethod. It means that cost equalisation is built up of a number of models cal-culated using various factors. The various models refer either to specific servicesor to costs found in most services. Four government inquiries lay behind the 1996system: the Structural Costs Inquiry, the County Council Finances Inquiry, Local Go-vernment Income Equalisation – Alternative Models and the Central GovernmentGrant Commission.
Reviews of the 1996 system
From 2000 certain changes were made in the cost equalisation component of thesystem. These mainly affected childcare, individual and family social care andpublic transport. Moreover, a model was added to compensate the municipalitiesthat have high costs in childcare, compulsory school and upper secondary schoolon account of a high proportion of children with a foreign background. Forcounty councils, it involved changes for health and medical care.
In various contexts experts had commented on the scale and complexity of theequalisation system. In 1999 the Expert Group for Simplified Local Government
Equalisation was therefore tasked with examining various options to make thesystem simpler and more stable while fulfilling the fundamental intentions ofthe equalisation.
The Expert Group proposed that the outcome of cost equalisation be presen-ted in terms of three factors: an age factor, a social factor and a geographical fac-tor. In addition, some models used in cost equalisation would be simplified andsome would be removed from the equalisation system. The Expert Group’s pro-posals were not implemented, but several of them form part of the design of thesystem from 2005.
The Delegation for Continued Development of the Equalisation System for Mu-
nicipalities and County Councils examined certain specified parts of the equalisa-tion system. In spring 2000 it presented an interim report with proposals for howto handle the negative marginal effects in income equalisation. In addition, a re-structuring grant was proposed for county councils with a declining population,and the Delegation examined and updated the model for health and medicalcare.
32 Local government financial equalisation 2008
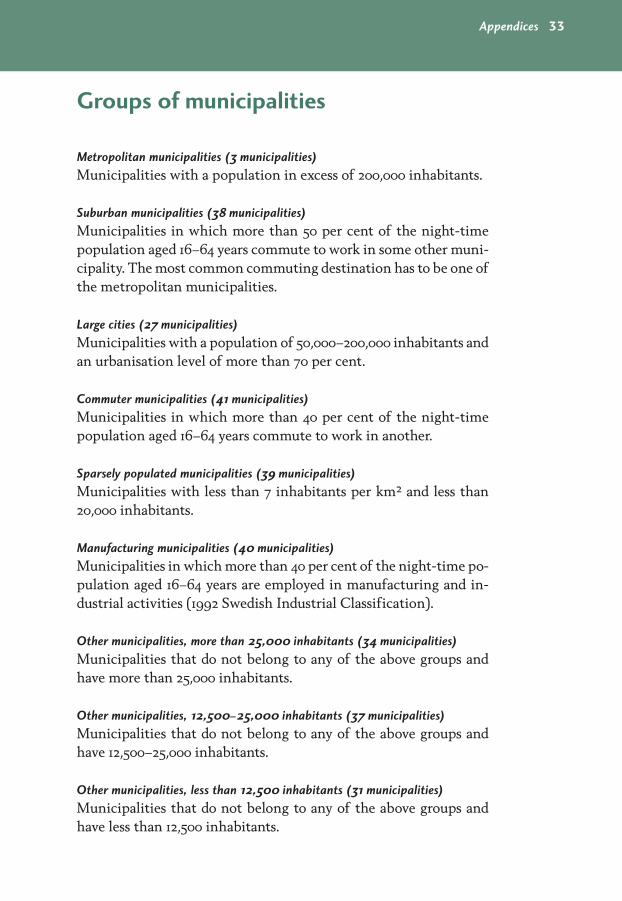
Groups of municipalities
Metropolitan municipalities (3 municipalities)
Municipalities with a population in excess of 200,000 inhabitants.
Suburban municipalities (38 municipalities)
Municipalities in which more than 50 per cent of the night-timepopulation aged 16–64 years commute to work in some other muni-cipality. The most common commuting destination has to be one ofthe metropolitan municipalities.
Large cities (27 municipalities)
Municipalities with a population of 50,000–200,000 inhabitants andan urbanisation level of more than 70 per cent.
Commuter municipalities (41 municipalities)
Municipalities in which more than 40 per cent of the night-timepopulation aged 16–64 years commute to work in another.
Sparsely populated municipalities (39 municipalities)
Municipalities with less than 7 inhabitants per km2 and less than20,000 inhabitants.
Manufacturing municipalities (40 municipalities)
Municipalities in which more than 40 per cent of the night-time po-pulation aged 16–64 years are employed in manufacturing and in-dustrial activities (1992 Swedish Industrial Classification).
Other municipalities, more than 25,000 inhabitants (34 municipalities)
Municipalities that do not belong to any of the above groups andhave more than 25,000 inhabitants.
Other municipalities, 12,500–25,000 inhabitants (37 municipalities)
Municipalities that do not belong to any of the above groups andhave 12,500–25,000 inhabitants.
Other municipalities, less than 12,500 inhabitants (31 municipalities)
Municipalities that do not belong to any of the above groups andhave less than 12,500 inhabitants.
Appendices 33
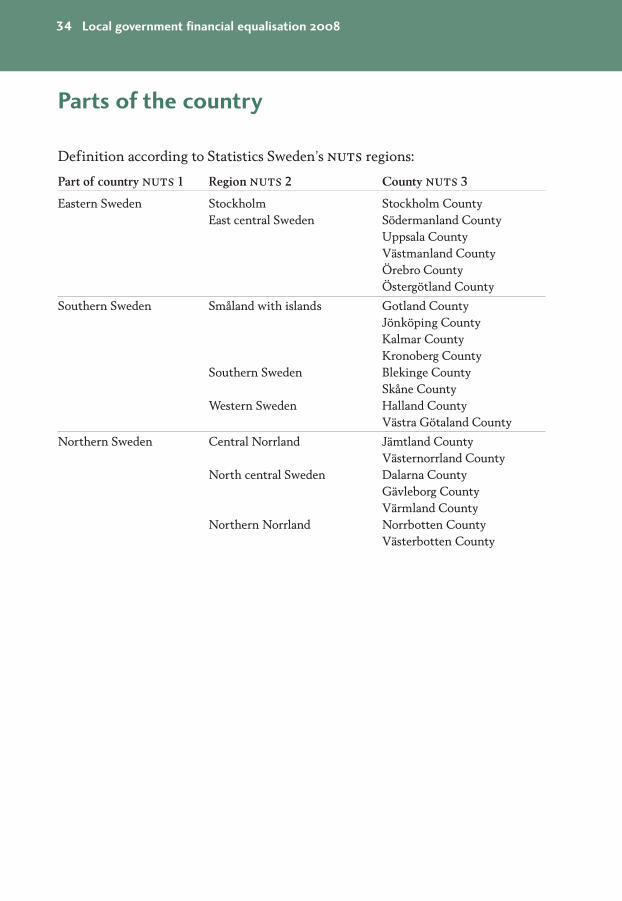
Parts of the country
Definition according to Statistics Sweden’s nuts regions:
Part of country nuts 1 Region nuts 2 County nuts 3
Eastern Sweden Stockholm Stockholm CountyEast central Sweden Södermanland County
Uppsala CountyVästmanland CountyÖrebro CountyÖstergötland County
Southern Sweden Småland with islands Gotland CountyJönköping CountyKalmar CountyKronoberg County
Southern Sweden Blekinge CountySkåne County
Western Sweden Halland CountyVästra Götaland County
Northern Sweden Central Norrland Jämtland CountyVästernorrland County
North central Sweden Dalarna CountyGävleborg CountyVärmland County
Northern Norrland Norrbotten CountyVästerbotten County
34 Local government financial equalisation 2008
References
A complete list of government inquiries, official reports, Government Bills, etc,and of special reports, information brochures and the relevant laws and govern-ment ordinances is provided in the Swedish 2008 edition of this report, Kommu-nalekonomisk utjämning (isbn 978-91-7164-350-6).
Websites
Government Officeswww.sweden.gov.se/
Statistics Swedenwww.scb.se/
Swedish Association of Local Authorities and Regionswww.skl.se
Appendices 35
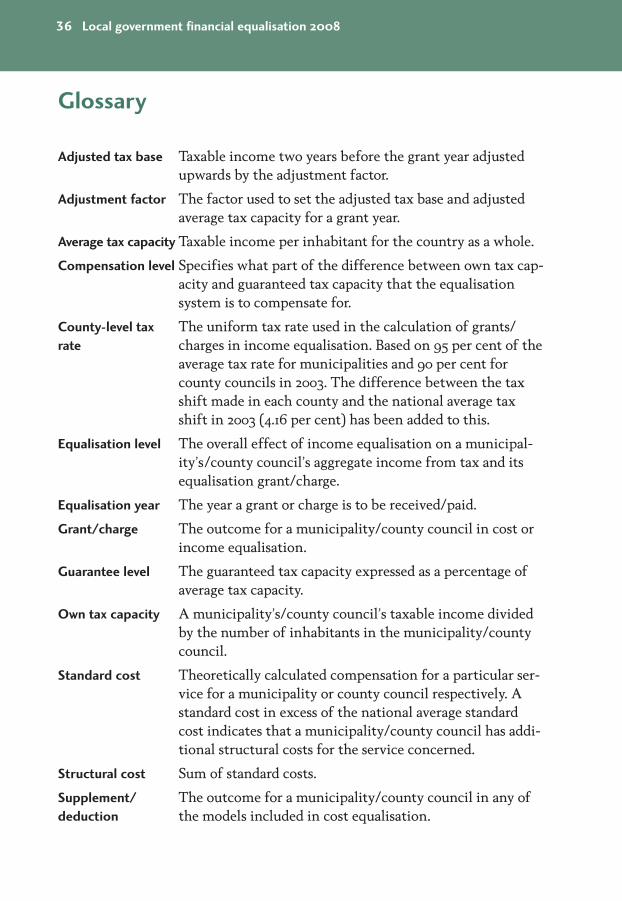
Glossary
Adjusted tax base Taxable income two years before the grant year adjustedupwards by the adjustment factor.
Adjustment factor The factor used to set the adjusted tax base and adjustedaverage tax capacity for a grant year.
Average tax capacity Taxable income per inhabitant for the country as a whole.
Compensation level Specifies what part of the difference between own tax cap-acity and guaranteed tax capacity that the equalisationsystem is to compensate for.
County-level tax The uniform tax rate used in the calculation of grants/ rate charges in income equalisation. Based on 95 per cent of the
average tax rate for municipalities and 90 per cent forcounty councils in 2003. The difference between the taxshift made in each county and the national average taxshift in 2003 (4.16 per cent) has been added to this.
Equalisation level The overall effect of income equalisation on a municipal-ity’s/county council’s aggregate income from tax and itsequalisation grant/charge.
Equalisation year The year a grant or charge is to be received/paid.
Grant/charge The outcome for a municipality/county council in cost orincome equalisation.
Guarantee level The guaranteed tax capacity expressed as a percentage ofaverage tax capacity.
Own tax capacity A municipality’s/county council’s taxable income dividedby the number of inhabitants in the municipality/countycouncil.
Standard cost Theoretically calculated compensation for a particular ser-vice for a municipality or county council respectively. Astandard cost in excess of the national average standardcost indicates that a municipality/county council has addi-tional structural costs for the service concerned.
Structural cost Sum of standard costs.
Supplement/ The outcome for a municipality/county council in any ofdeduction the models included in cost equalisation.
36 Local government financial equalisation 2008
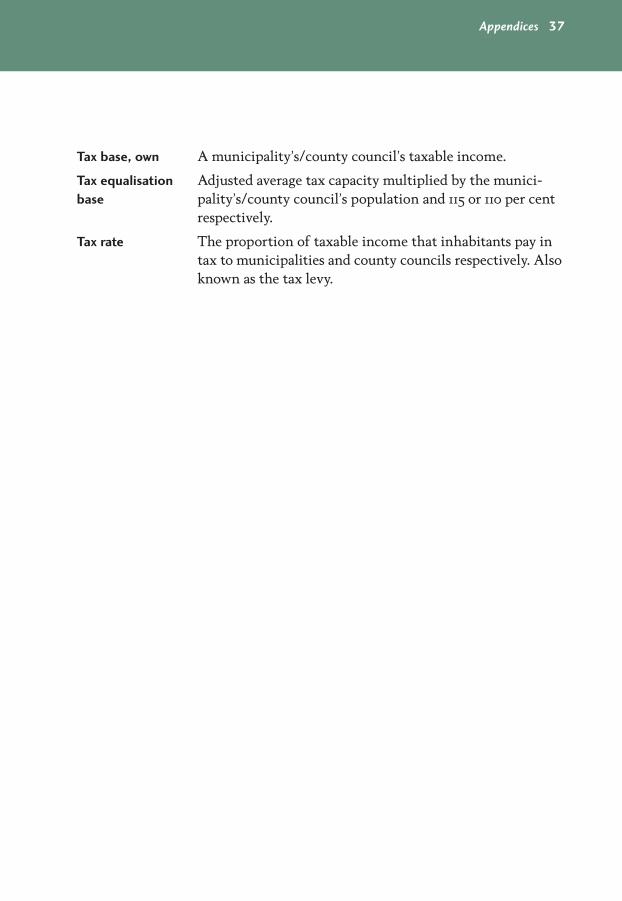
Tax base, own A municipality’s/county council’s taxable income.
Tax equalisation Adjusted average tax capacity multiplied by the munici-base pality’s/county council’s population and 115 or 110 per cent
respectively.
Tax rate The proportion of taxable income that inhabitants pay intax to municipalities and county councils respectively. Alsoknown as the tax levy.
Appendices 37

38 Local government financial equalisation 2008


Municipalties and county councils provide the bulk of our welfareservices. They are responsible for schools, health services and va-rious social services. Local government expenditure therefore ac-counts for a higher share of gdp than in any other country. At thesame time, circumstances vary greatly between municipalities,between county councils and between different parts of thecountry, as do the conditions for fulfilling these tasks.
This means that there is a need for financial equalisation con-cerning both income and structural differences. The purpose is toput all municipalities and county councils on an equal footing forthe conduct of their activities. The redistribution of resourcesthrough the equalisation system makes it possible to establishmore equal conditions for the provision of welfare services. Thatis the background to the equalisation system.
Local Government Financial Equalisation provides an overviewof the system that came into force on 1 January 2005. This up-dated edition includes the changes introduced on 1 January 2008.
Local Government Financial Equalisation can be ordered via pho-ne +46 8 709 59 90 or fax +46 8 709 59 80, stating the isbn-num-ber. The price is sek 150 excl. vat and postage.
The report can also be downloaded from our websites:www.skl.se and www.sweden.gov.se .
ISBN 978-91-7164-380-3
SE-118 82 Stockholm Visitors Hornsgatan 20
Tel +46 8 452 70 00 Fax +46 8 452 70 50
[email protected], www.skl.se