7 OPTIONS CONSIDERED - buildingqueensland.qld.gov.au · OPTIONS CONSIDERED NDMIP DETAILED BUSINESS...
18
OPTIONS CONSIDERED NDMIP DETAILED BUSINESS CASE 122 7 OPTIONS CONSIDERED CHAPTER SUMMARY AND CONCLUSIONS: ▪ This Chapter provides a summary of the options considered and assessed prior to and during the development of this DBC, and any relevant studies or assessments that have been taken into consideration. ▪ The PBC: - considered ten options to meet the (then) identified service need, including several sub- options - identified the three highest scoring options, improving MDWSS rules and operations, modernisation of MDWSS distribution infrastructure, and building a new Nullinga Dam - assessed these shortlisted options against a defined Base Case. ▪ These options have been updated and refined based on investigations and design activities undertaken during the development of this DBC. ▪ Non-infrastructure options - A detailed assessment of ten different initiatives for improving the current rules and operations were considered - Based on the findings of the assessment: ▪ the DBC has adopted the principle of exploring and converting MP to HP where there are customers able and willing to pay ▪ as part of ongoing operational reviews and activities: - DNRME should consider changing the water year to three months later than current stated in the water plan - Sunwater should continue to strengthen water ordering processes and consider potential opportunities for continuous sharing arrangements. - Currently, no additional capital or recurrent funding is forecast for these findings to be enacted and these initiatives are not considered any further in this DBC. ▪ Modernisation of MDWSS distribution infrastructure - In May 2018, $11.6 million from the NWIDF was awarded to Sunwater to deliver the six of the eleven modernization subprojects identified in the PBC, as part of the MDWSS Efficiency Improvement Project - Estimated cost per ML of the remaining unfunded subprojects all exceed $10,000 per ML, except for upgrade works for the Arriga Main Channel and East Barron, these two proposed channel works were further defined and assessed (all costs are real as of 2018/19) COMPONENT ARRIGA EAST BARRON TOTAL Yield (savings) 350 ML/a 1,450 ML/a 1,800 ML/a Implementation Costs $0.121M $7.219M $7.340M Construction Costs $0.249M $12.374M $12.623M O&M Costs (30 years) $1.040M $2.680M $3.720M
Transcript of 7 OPTIONS CONSIDERED - buildingqueensland.qld.gov.au · OPTIONS CONSIDERED NDMIP DETAILED BUSINESS...

OPTIONS CONSIDERED
NDMIP DETAILED BUSINESS CASE 122
7 OPTIONS CONSIDERED
CHAPTER SUMMARY AND CONCLUSIONS:
▪ This Chapter provides a summary of the options considered and assessed prior to and during the development of this DBC, and any relevant studies or assessments that have been taken into consideration.
▪ The PBC:
considered ten options to meet the (then) identified service need, including several sub-options
identified the three highest scoring options, improving MDWSS rules and operations, modernisation of MDWSS distribution infrastructure, and building a new Nullinga Dam
assessed these shortlisted options against a defined Base Case.
▪ These options have been updated and refined based on investigations and design activities undertaken during the development of this DBC.
▪ Non-infrastructure options
A detailed assessment of ten different initiatives for improving the current rules and operations were considered
Based on the findings of the assessment:
▪ the DBC has adopted the principle of exploring and converting MP to HP where there are customers able and willing to pay
▪ as part of ongoing operational reviews and activities:
DNRME should consider changing the water year to three months later than current stated in the water plan
Sunwater should continue to strengthen water ordering processes and consider potential opportunities for continuous sharing arrangements.
Currently, no additional capital or recurrent funding is forecast for these findings to be enacted and these initiatives are not considered any further in this DBC.
▪ Modernisation of MDWSS distribution infrastructure
In May 2018, $11.6 million from the NWIDF was awarded to Sunwater to deliver the six of the eleven modernization subprojects identified in the PBC, as part of the MDWSS Efficiency Improvement Project
Estimated cost per ML of the remaining unfunded subprojects all exceed $10,000 per ML, except for upgrade works for the Arriga Main Channel and East Barron, these two proposed channel works were further defined and assessed (all costs are real as of 2018/19)
COMPONENT ARRIGA EAST BARRON TOTAL
Yield (savings) 350 ML/a 1,450 ML/a 1,800 ML/a
Implementation Costs $0.121M $7.219M $7.340M
Construction Costs $0.249M $12.374M $12.623M
O&M Costs (30 years) $1.040M $2.680M $3.720M
OPTIONS CONSIDERED
NDMIP DETAILED BUSINESS CASE 123
CHAPTER SUMMARY AND CONCLUSIONS:
A detailed financial and economic appraisal was undertaken on these unfunded subprojects and the findings include a combined BCR of 0.25 and NPV of -$13.8M (discounted at 7 per cent real).
These works have not been considered any further in the DBC and it is acknowledged that should Sunwater choose to pursue any of these subprojects, they should be delivered as part of the existing MDWSS Efficiency Improvement Project.
▪ New Nullinga Dam solution
Concept engineering designs and cost estimates were developed for a range of different sized Nullinga Dam solutions, in addition to hydrological analysis and a comparative CBA.
Key findings from the design and analysis work includes:
▪ the maximum feasible yield of the Walsh River catchment is approximately 80,000 ML/a
▪ that a dam larger than 556 m AHD (74,000 ML/a) results in exponential increase in cost per/ML, with little yield gain coupled with rapid cost rises associated with both further expansion of the main dam wall and the primary saddle dam as well as a need for a second saddle dam
Two sizes of Nullinga Dam were selected for further evaluation (including a 545m AHD and 556m AHD solutions) having consideration for the known yields, anticipated demand (both with and without local producer expansion plans) and cost implications.
Concept development activities identified water distribution infrastructure works, both new and/or upgrades for existing assets, to support either a standalone approach, where distribution from a new Nullinga Dam would be separated from the allocation currently available from Tinaroo Falls Dam, or conjunctive scheme approach, where allocation from both a new Nullinga Dam and current Tinaroo Falls Dam would be managed as one total allocation
Based on the recommendations of the PBC, updated analysis and investigations, the following options have been selected for further consideration and analysis in the DBC.
▪ Reference Project 1, a Nullinga Dam (545m AHD) capable of supporting 58,000 ML/a, including consideration of both a standalone and conjunctive scheme solution, along with the associated distribution works.
▪ Reference Project 2, a Nullinga Dam (556m AHD) capable of supporting 74,000 ML/a, including consideration of a standalone solution, partially conjunctive and fully conjunctive scheme solution, along with the associated distribution works.
▪ Alternative options
Additional work was undertaken on a number of solutions previously discounted from analysis. These include trading distribution losses, raising of Tinaroo Falls Dam and North Johnston River scheme diversion. These solutions have not been adopted at this time, noting additional ongoing investigations are required, with continuing uncertainty on a range of environmental and social risks.
OPTIONS CONSIDERED
NDMIP DETAILED BUSINESS CASE 124
7.1 Purpose
This Chapter provides a summary of the options considered and assessed prior to and during the
development of this DBC.
7.2 PBC Options
The PBC finalised in 2017, generated a long list of options through consideration of strategic policy objective,
analysis of previous studies, investigative and design work undertaken for the PBC and the outcomes of
stakeholder consultation.
The long list of options considered in the PBC include:
▪ do minimum
▪ improve MDWSS rules and operation
▪ increase in on-farm water efficiency
▪ improve water trading
▪ modernise MDWSS distribution infrastructure and convert losses to new water allocations for sale
▪ raise Tinaroo Falls Dam
▪ utilise Quaid Dam/Mitchell Dam and build pipeline
▪ build Nullinga Dam
agricultural use – initially delivery to Walsh River only (no distribution infrastructure)
agricultural use – with distribution infrastructure
mixed use – Cairns urban and agricultural supply (historical proposed use for Nullinga Dam)
▪ build Nullinga Weir
▪ harvest water from the North Johnstone River and build pipeline.
The long list of options was filtered against criteria under the Building Queensland BCDF, as well as direct
service need specific considerations. The three highest scoring options, improving MDWSS rules and
operations, modernisation of MDWSS distribution infrastructure and building a new Nullinga Dam were
shortlisted and compared against a defined ‘do minimum’ option in the PBC.
These solutions are outlined below and includes a discussion of any relevant updated analysis or findings
from works undertaken in the development of the DBC, post finalisation of the PBC.
7.2.1 ‘Do minimum’ (Base Case)
The Base case for the PBC was based on the following key findings:
▪ as the identified service need is an opportunity, it is considered there is no base case in which any
sector will run out of water supply catastrophically
▪ when faced with scarcity during dry times, irrigators will reduce application of water on the lowest value
crops
▪ irrigators will also not expand (i.e. plant new crops) if the current supply situation indicates there is a
reasonable prospect of losing those crops and the associated capital investment
OPTIONS CONSIDERED
NDMIP DETAILED BUSINESS CASE 125
▪ the majority of irrigators in the MDWSS have adopted on-farm water efficiency measures to maintain or
improve crop yield per ML of water applied, and will continue to do so where it creates efficiencies for
their business operations
▪ the MDWSS is moving towards an efficient market for water, with temporary and permanent trading of
water promoting highest and best use
▪ recent dry conditions have increased water trading activity to address scarcity.
A defined Base Case is critical for a robust analysis of options. The refined Base Case for the DBC is presented
in detail in Chapter 8.
7.2.2 Improve MDWSS Rules and Operations
This option comprises a review of the MDWSS operating rules against the changed cropping and water use
practices of the modern scheme to increase operational performance and reduce current constraints. These
improvements are intended to increase water use within the MDWSS without undermining the current
supply or reliability of supply or creating new water allocations.
The PBC identified 11 potential opportunities to improve the MDWSS rules and operation. Since the
finalisation of the PBC, Sunwater has commenced and is committed to delivering one of these options, which
seeks to define the Design Flow Rate Entitlement (DFRE) and will ensure all irrigators are aware of their
specific entitlement in ML per day.
To consider the merits of the remaining 10 opportunities, a strategic assessment was undertaken, with a
summary of the options and findings provided in Table 7-1.
Table 7-1 MDWSS rule / operational improvement opportunities, strategic assessment summary
Initiative Description Findings / Recommendation
Changing the water year This would change the water year to match the
current demand patterns within the existing
crop mix in the region to better reflect higher
announced allocations at the start of the water
year. Consideration was made for moving the
year back or forward by 3 months.
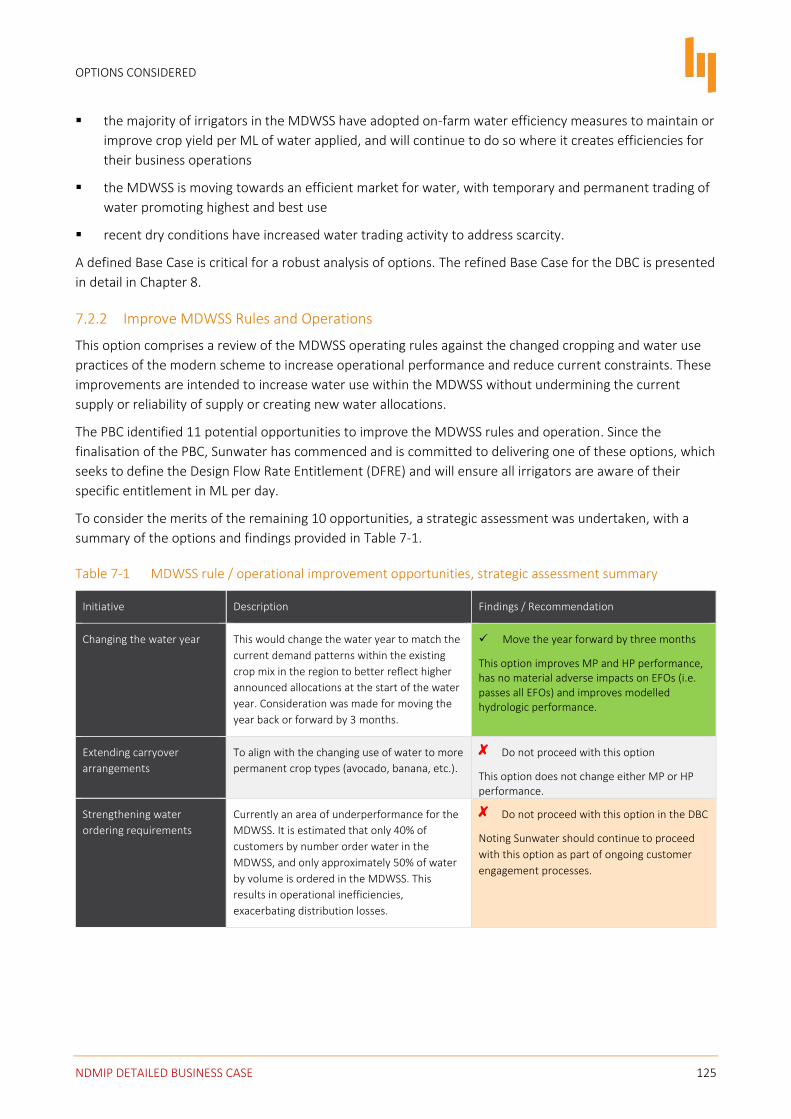
✓ Move the year forward by three months
This option improves MP and HP performance, has no material adverse impacts on EFOs (i.e. passes all EFOs) and improves modelled hydrologic performance.
Extending carryover
arrangements
To align with the changing use of water to more
permanent crop types (avocado, banana, etc.).
Do not proceed with this option
This option does not change either MP or HP performance.
Strengthening water
ordering requirements
Currently an area of underperformance for the
MDWSS. It is estimated that only 40% of
customers by number order water in the
MDWSS, and only approximately 50% of water
by volume is ordered in the MDWSS. This
results in operational inefficiencies,
exacerbating distribution losses.
Do not proceed with this option in the DBC
Noting Sunwater should continue to proceed
with this option as part of ongoing customer
engagement processes.

OPTIONS CONSIDERED
NDMIP DETAILED BUSINESS CASE 126
Initiative Description Findings / Recommendation
Utilising unused portion of
distribution loss allocation
Portion of the distribution losses allocation
would allow unused water to go to productive
use. This is to allow the market to determine
the highest productive use of this unused water
rather than staying within Tinaroo Falls Dam
and being part of the next water year’s
allocation.
Do not proceed with this option in as part
of a non-build option in the DBC
Further consideration of this option is provided
in Section 7.4.
Reducing the Transmission
and Operations Allowance
(TOA)
TOA is a volume of water set aside in Tinaroo
Falls Dam as part of the Announced Allocation
formula for the river transmission losses. This
volume is a large percentage of volume of the
water allocation to be delivered within the river
and could be reviewed to confirm the actual
requirement
Do not proceed with this option
Although this option improves MP performance, it breaches HP WASOs The number of days (over the long-term) that the water available to be taken by MP water allocations from the river downstream of the dam is estimated to increase by 50%. This suggests that existing TOA should not be reduced.
Increase MP water
allocations whilst
maintaining extent to which
WASOs are currently met
Increase the volume of MP water allocations
available whilst maintaining extent to which
WASOs are currently met.
Do not proceed with this option
A small increase in nominal volume of MP water allocations is possible whilst meeting the MP and HP WASOs
Converting MP water
allocations to HP
Enabling an increased volume of MP water
allocations to be converted to HP
✓ Consider further
This option warrants further consideration in
the short to medium term. Modelling shows
that the Water Plan (including its current
conversion factor) could accommodate
conversions that establish an additional HP
nominal volume of 40,000 ML, which might
increase to 60,000ML if further optimization of
the conversion factor were to occur
Continuous Sharing Changing the water accounting and sharing
rules from announced allocations to continuous
sharing (including restructuring the hydro-
power release arrangements (subject to
modelling being feasible within the study
timeframes)
✓ Consider further
This option may enable higher reliabilities for MP water allocations without impacting on HP water allocation performance
Additional water harvesting Allowing water harvesting by the scheme
whenever Tinaroo Falls Dam is spilling
Do not proceed with this option
Would likely fail several downstream EFOs
Combination of changes A combination of the above opportunities.
Combinations considered include:
- Change water year – three months later
and Convert MP to 40,000 ML of HP
- Change water year – three months later,
Convert MP to 40,000 ML of HP and
Additional Water harvesting
Do not proceed with this option
- Will fail MP WASO
- Will fail to meet downstream EFO and
MP WASO

OPTIONS CONSIDERED
NDMIP DETAILED BUSINESS CASE 127
Based on the findings of the assessment:
▪ the DBC has adopted the principle of exploring and converting MP to HP where there are customers able and willing to pay
▪ as part of ongoing operational reviews and activities:
DNRME should consider changing the water year to three months later than current stated in the water plan
Sunwater should continue to strengthen water ordering processes and consider potential opportunities for continuous sharing arrangements
No additional capital or recurrent funding is required for these findings to be enacted and are not considered any further in this DBC.
7.2.3 Modernise MDWSS
Sunwater currently has about 45,000 ML in water allocations for managing transmission losses in the
delivery system, comprising 8,000 ML of HP and 37,000 ML of MP entitlements. It is estimated that currently
the MDWSS is operating at around 70 to 80 per cent water conveyance efficiency. Elsewhere in Australia
where delivery system upgrades have been implemented, it has been possible to lift water conveyance
efficiency up to 90 per cent71.
The PBC identified eleven sub-projects with the potential to improve conveyance efficiency through reducing
system losses. Of the eleven improvement initiatives, identified in Figure 7-1, Sunwater has progressed a
number of initiatives identified in the PBC for the modernisation of the MDWSS.
Figure 7-1 MDWSS improvement initiatives
In May 2018, $11.6 million
from the NWIDF was awarded
to Sunwater to deliver the six
subprojects of the MDWSS
Efficiency Improvement
Project, with Sunwater
committing the remaining
$16.5 million of the estimated
$28.1 million capital cost.
These funded works will be
completed over the next few
years and are part of the
defined base case (refer
Chapter 8) and are identified in
Table 7-2.
In total, these works are expected to allow at least 8,304 ML/a of existing loss allocations available for sale to
the water market. Design work for the six sub-projects are being finalised, with construction expected to
occur between 2019 and 2021. Following confirmation of the delivery loss savings achieved, water is
expected to be made available by 2023.
71 Advice from MJA

OPTIONS CONSIDERED
NDMIP DETAILED BUSINESS CASE 128
Table 7-2 Improvement Initiatives, funded and unfunded
Funded Unfunded
▪ ‘EB4’. Construction of 4.5 kilometres pressurised pipeline system to replace open, earth channel.
▪ Southedge. Conversion of 7km downstream section of open channel to pressurised pipeline and automation of channel upstream to the West Barron Balancing Storage
▪ South Walsh. In-channel and stand-alone earthworks construction of additional 50 ML balancing storage and installation of automated control gates within main channels
▪ Atherton Creek. Conversion of 2.5km downstream section from open channel to pressurised pipeline and of channel upstream to the Nardellos Balancing Storage
▪ Biboohra Main Channel downstream of storage. Installation of 5 automated control gate.
▪ North Walsh. In-channel earthworks construction of additional 5 ML of balancing storage
▪ Arriga Main Channel and A02: 6.5 km pressurised pipeline system to replace open, earth channel and open pipeline
▪ Mareeba Main Channel: 10 km pressurised pipeline system to replace open, earth channel.
▪ Channel ‘M9’: Construction of 10 km pressurised pipeline system to replace open, earth channel.
▪ East Barron: In-channel earthworks construction of additional 20 ML of balancing storage and construction of 13 kilometres of pressurised pipe.
▪ Biboohra Main Channel upstream of storage: Conversion of 4.5km of open, earth channel and open pipeline to pressurised pipe.
To inform the DBC, Sunwater has undertaken further analysis of the remaining five sub-projects to confirm
their viability. The cost and yield estimates and associated cost per ML of the remaining sub-options are in
Table 7-3.
Table 7-3 Unfunded Channel Upgrades72
SUB-PROJECT YIELD (ML/A) COST $M $/ML73
Arriga Main Channel and A02 350 $0.247 $706
Mareeba Main Channel 390 $16.300 $41,800
Channel M9 340 $11.100 $32,650
East Barron 1,450 $13.546 $9,342
Biboohra Main Channel above storage 170 $3.650 $21,471
Given the high estimated cost per ML for the Mareeba Main Channel, Channel M9 and Biboohra Main
Channel works, a detailed economic and financial analysis was only undertaken on the Arriga Main Channel
and A02 and the East Barron sub-projects. The scope of these works and findings from the appraisal are
presented below.
7.2.3.1 Scope of upgrade work – Arriga channel system
This system consists of the Arriga Main Channel (AMC), composed of a 1,500m open channel and 3,500m
open ended low pressure reinforced concrete pipeline. The lateral channel, referred to as A2, consists of a
1,360m open ended reinforced concrete pipeline.
72 Munck & Associates (March 2019) 73 These costs per ML represent infrastructure costs over the estimated yield and are produced for comparative assessment, it is noted that these are not the water prices that are paid by customers.
OPTIONS CONSIDERED
NDMIP DETAILED BUSINESS CASE 129
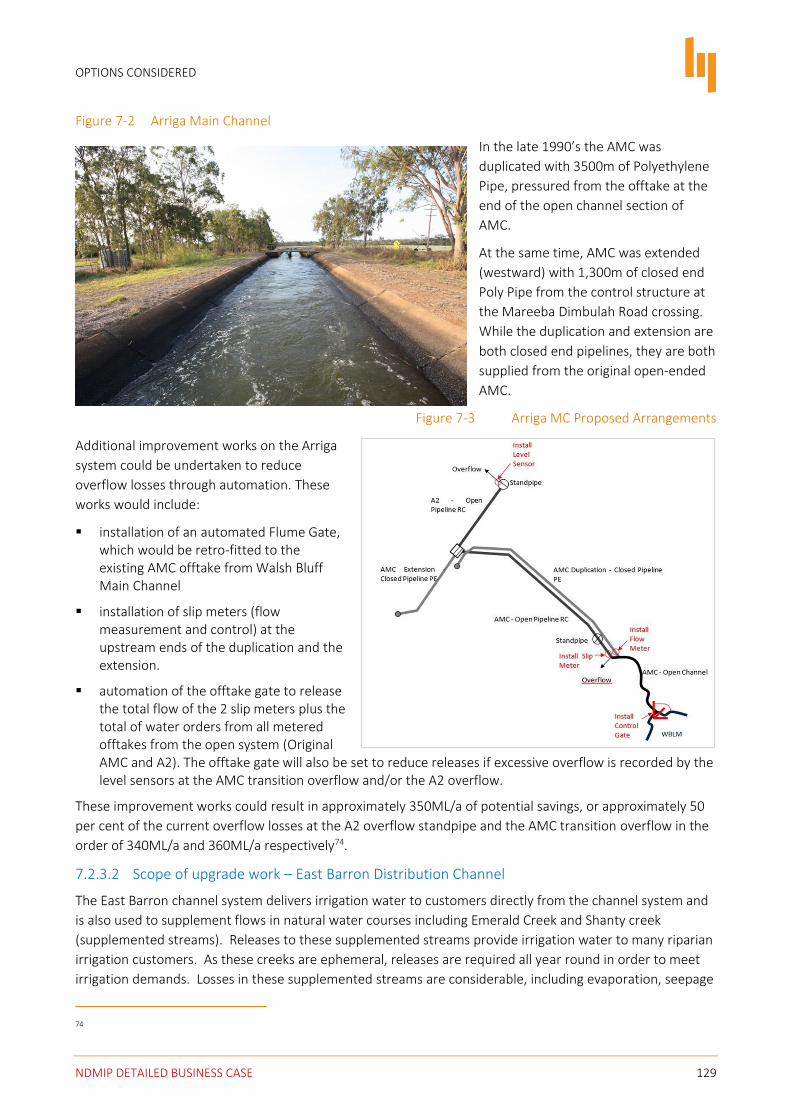
Figure 7-2 Arriga Main Channel
In the late 1990’s the AMC was
duplicated with 3500m of Polyethylene
Pipe, pressured from the offtake at the
end of the open channel section of
AMC.
At the same time, AMC was extended
(westward) with 1,300m of closed end
Poly Pipe from the control structure at
the Mareeba Dimbulah Road crossing.
While the duplication and extension are
both closed end pipelines, they are both
supplied from the original open-ended
AMC.
Figure 7-3 Arriga MC Proposed Arrangements
Additional improvement works on the Arriga
system could be undertaken to reduce
overflow losses through automation. These
works would include:
▪ installation of an automated Flume Gate, which would be retro-fitted to the existing AMC offtake from Walsh Bluff Main Channel
▪ installation of slip meters (flow measurement and control) at the upstream ends of the duplication and the extension.
▪ automation of the offtake gate to release the total flow of the 2 slip meters plus the total of water orders from all metered offtakes from the open system (Original AMC and A2). The offtake gate will also be set to reduce releases if excessive overflow is recorded by the level sensors at the AMC transition overflow and/or the A2 overflow.
These improvement works could result in approximately 350ML/a of potential savings, or approximately 50
per cent of the current overflow losses at the A2 overflow standpipe and the AMC transition overflow in the
order of 340ML/a and 360ML/a respectively74.
7.2.3.2 Scope of upgrade work – East Barron Distribution Channel
The East Barron channel system delivers irrigation water to customers directly from the channel system and
is also used to supplement flows in natural water courses including Emerald Creek and Shanty creek
(supplemented streams). Releases to these supplemented streams provide irrigation water to many riparian
irrigation customers. As these creeks are ephemeral, releases are required all year round in order to meet
irrigation demands. Losses in these supplemented streams are considerable, including evaporation, seepage
74

OPTIONS CONSIDERED
NDMIP DETAILED BUSINESS CASE 130
and most importantly downstream passing flows. Table 7-4 shows a summary of historical releases,
corresponding metered use and resultant losses.
Table 7-4 East Barron System Flow Summary (ML/a)
COMPONENT RELEASES METERED USE LOSSES
Emerald Creek 5,174 2,556 2,618
Shanty Creek 2,619 496 2,123
Total 7,793 3,052 4,741
It is proposed to construct pipelines along Malone and Kay Roads to supply customers on Emerald Creek and
Shanty Creek who are currently supplied by these supplemented streams. These overflow losses can further
be reduced with automation of East Barron Main Channel (EBMC), from the East Barron Balancing Storage
(EBBS) to the end. A schematic layout is shown at Figure 7-4.
Figure 7-4 Location of Malone and Kay Road Pipeline
The conceptual design information below has been
prepared using Sunwater’s in-house pipeline design
spreadsheet. The concept design includes:
▪ Malone road pipeline involves 5,900m of PE pipeline (Diameter, 630-560mm)
▪ Kay road pipeline involves 8,300m of PE pipeline (Diameter: - 900, 800, 710, 630mm)
▪ design flow rates based on Sunwater’s design parameters for new pipelines in the MDWSS
▪ design parameters are conservatively based on sugar cane demands of 1.6 litres per second per hectare (rationalised), noting that flow rates required for bananas are similar
▪ Pipelines are designed to support ‘water-on-demand’ requests.
The EBMC from the EBBS is an open channel system, approximately 6.3 km long. To deliver ‘water-on-
demand’, it will be necessary to ensure that sufficient supply is available from EBMC to meet such instant
demands, while minimising overflow losses if too much water is released from EBBS.
To manage this demand and supply requirements, the upgrade works will automate EBMC from the
balancing storage to the end. The works will include:
▪ an automated offtake gate from EBBS (Slip Meter)
▪ 9 overshot flume gates (fitted to existing check structures)
▪ slip meters installed at the start of the Malone Road and Kay Road pipelines
▪ overflow sensors located at the Emerald Creek overflow and at the end of EBMC (Shanty Creek).
The offtake gate (EBBS) is to be automated to release the total of both flow meters (at the start of each
proposed new pipeline), water orders from EBMC and existing laterals (open channel and open pipe laterals)
and an allowance for ongoing overflows required to keep the channel full

OPTIONS CONSIDERED
NDMIP DETAILED BUSINESS CASE 131
It should be noted that there are a few irrigations customers on both Emerald Creek and Shanty Creek that
are downstream of the proposed pipelines. As such, releases to both creeks (albeit at a much lower rate)
will still be required.
It is currently estimated that this project could achieve a 30 per cent reduction in current losses, equivalent
to 1,450ML/a for this project.
7.2.3.3 Findings
A detailed cost CBA and financial analysis were undertaken for the potential delivery of these unfunded
upgrade works. As shown in Table 7-5, these upgrade works have a combined BCR of approximately 0.25 and
NPV of -$13.8M (discounted at 7 per cent real).
Table 7-5 Summary of findings for additional modernisation works
Component Arriga East Barron Total
Yield (savings) ML/a 350 ML/a 1,450 ML/a 1,800 ML/a
Real Costs $M $M $M
Implementation Costs 0.121 7.219 7.340
Capital Costs 0.249 12.374 12.623
O&M (30 years) 1.040 2.68 3.720
Total Real Costs 1.410 22.273 23.683
Findings
Present Value of Costs (discounted at 7% real) $18.3M
Present Value of Benefits (discounted at 7% real) $4.5M
NPV -$13.8M
BCR 0.25
These works have not been considered any further in the DBC and it is acknowledged that should Sunwater
choose to fund and deliver any of these subprojects, they could be delivered as part of the existing MDWSS
Efficiency Improvement Project, noting additional synergies could result in cost savings not captured above.
7.2.4 Nullinga Dam
The PBC considered a Nullinga Dam with a full supply level of 540m AHD (168,000 ML capacity) capable of
delivering 55,400 ML/a of MP water as the Reference Project. The concept design of the Nullinga Dam as
part of the PBC only considered the delivery of MP water allocations to Walsh River customers and did not
include distribution infrastructure for delivery to existing MDWSS located elsewhere. A ‘river delivery, bulk
only’ Nullinga Dam simplified design, costing, water pricing, stakeholder engagement, water planning and
scheme operation.
Importantly, the PBC recognised the need to determine an appropriate dam size based on further demand
assessment and to match the volume of credible demand, rather than an arbitrary ‘pre-determined’ yield.
The investigations undertaken as part of the development of this DBC, as relate to the scale and scope of
both dam and water distribution infrastructure are discussed below.
OPTIONS CONSIDERED
NDMIP DETAILED BUSINESS CASE 132
7.2.4.1 Scope of dam infrastructure works
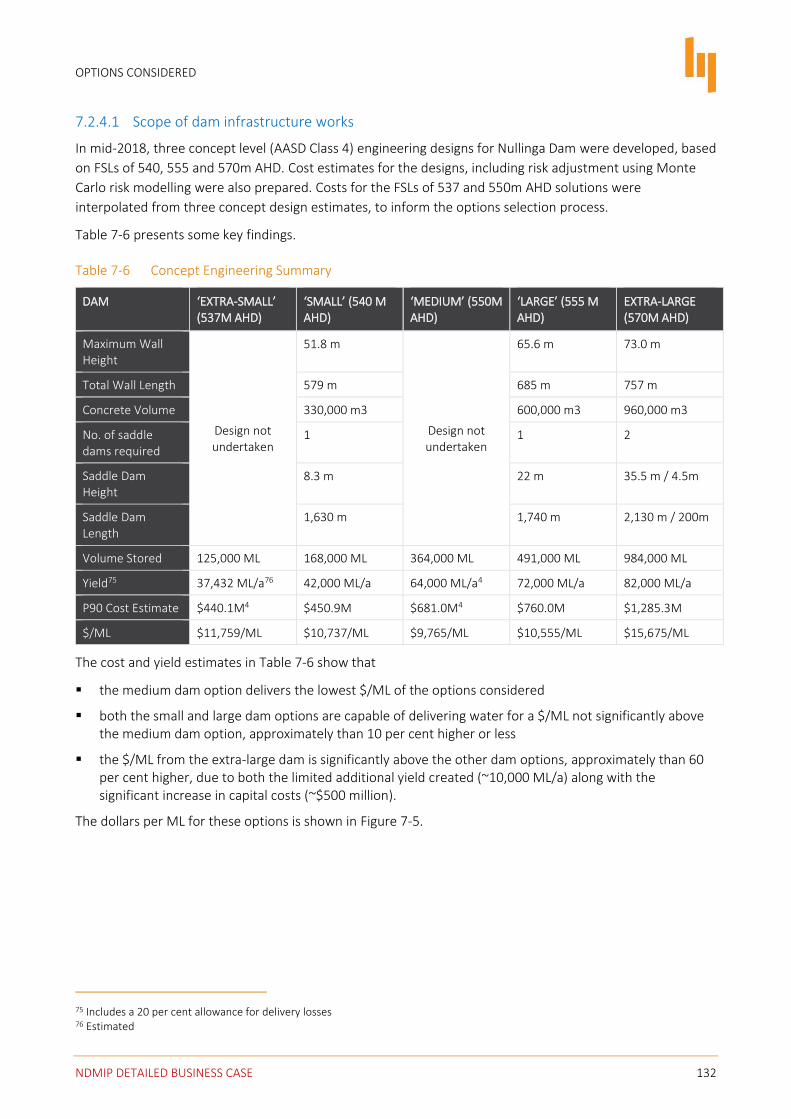
In mid-2018, three concept level (AASD Class 4) engineering designs for Nullinga Dam were developed, based
on FSLs of 540, 555 and 570m AHD. Cost estimates for the designs, including risk adjustment using Monte
Carlo risk modelling were also prepared. Costs for the FSLs of 537 and 550m AHD solutions were
interpolated from three concept design estimates, to inform the options selection process.
Table 7-6 presents some key findings.
Table 7-6 Concept Engineering Summary
DAM ‘EXTRA-SMALL’ (537M AHD)
‘SMALL’ (540 M AHD)
‘MEDIUM’ (550M AHD)
‘LARGE’ (555 M AHD)
EXTRA-LARGE (570M AHD)
Maximum Wall Height
Design not undertaken
51.8 m
Design not undertaken
65.6 m 73.0 m
Total Wall Length 579 m 685 m 757 m
Concrete Volume 330,000 m3 600,000 m3 960,000 m3
No. of saddle dams required
1 1 2
Saddle Dam Height
8.3 m 22 m 35.5 m / 4.5m
Saddle Dam Length
1,630 m 1,740 m 2,130 m / 200m
Volume Stored 125,000 ML 168,000 ML 364,000 ML 491,000 ML 984,000 ML
Yield75 37,432 ML/a76 42,000 ML/a 64,000 ML/a4 72,000 ML/a 82,000 ML/a
P90 Cost Estimate $440.1M4 $450.9M $681.0M4 $760.0M $1,285.3M
$/ML $11,759/ML $10,737/ML $9,765/ML $10,555/ML $15,675/ML
The cost and yield estimates in Table 7-6 show that
▪ the medium dam option delivers the lowest $/ML of the options considered
▪ both the small and large dam options are capable of delivering water for a $/ML not significantly above the medium dam option, approximately than 10 per cent higher or less
▪ the $/ML from the extra-large dam is significantly above the other dam options, approximately than 60 per cent higher, due to both the limited additional yield created (~10,000 ML/a) along with the significant increase in capital costs (~$500 million).
The dollars per ML for these options is shown in Figure 7-5.
75 Includes a 20 per cent allowance for delivery losses 76 Estimated

OPTIONS CONSIDERED
NDMIP DETAILED BUSINESS CASE 133
Figure 7-5 Nullinga Dam Options, yield and cost per ML
As identified in Chapter
5, the primary driver for
the development of a
Nullinga Dam is the
opportunity to expand
agricultural production.
The outcomes of the
demand assessment and
the RFI in particular has
shown that there is a
considerable volume of
potential demand. As a
consequence, the DBC
has considered how Nullinga Dam might be optimised to meet both a scenario that can cater with and
without proposed expansion plans proceeding.
To inform the process to optimise the dam size, a comparative CBA was undertaken based on the
preliminary findings of the demand assessment and hydrological modelling along with the concept-level cost
estimates. As this initial CBA was undertaken for comparative purposes, a number of simplifying assumptions
were made regarding the benefits associated with the potential Nullinga Dam solutions, including value-add
associated with production, utilisation of unused allocation and residual value. These base assumptions are
included in Table 7-7. Further details on the assumptions and methodology behind the comparative CBA are
available in Chapter 15.
Table 7-7 Assumptions for the comparative CBA
DESCRIPTION ASSUMPTION
Discount Rate 7 per cent, with 4 per cent and 10 per cent sensitivities
Base year 2019
Analysis period 30 years, with 50 years as a sensitivity
Capital cost estimates As per Table 7-6
Yield estimates As per Table 7-6
Margin returns As per Section5.4.3
Value Add Based on PBC estimates – 66% of margin return
Demand As per demand estimates at 24 September
Residual value Assumes 80-year dam operating life
The base case for the comparative CBA assumes that the extra water made available by the MDWSS
Efficiency Improvement Project goes to sugarcane production. In line with current trends in the MDWSS, it is
assumed that this water would transition from sugarcane to higher value uses, such as avocados, mangoes
and citrus, over time. This is due to agricultural production in the MDWSS being constrained by available
water (refer Chapter 5) and that, when access to water is constrained, water is transferred towards crops
with a higher gross margin.

OPTIONS CONSIDERED
NDMIP DETAILED BUSINESS CASE 134
In terms of the calculation of benefits, agricultural producers will benefit from increased application of
irrigation water to crops. The estimate comprises the gross margin associated with that crop per ML. This
approach assumes constant returns to water applied. It is assumed water is applied to both existing irrigated
crops and to existing currently non-irrigated crops. Where water from the proposed dam is used to augment
urban water supply, the benefit represents the delay/replacement of planned augmentation assets and their
operating costs. For the purposes of this analysis, it is assumed that supply is augmented by desalination
plants.
Four demand scenarios were considered as part of the comparative CBA, to assess the impact of CRC’s and
local operator demand on the analysis. Each scenario was run for each of the five dam size options. The
results of each scenario are included in Table 7-8.
Table 7-8 Results from comparative CBA (excl. residual values)
SCENARIO EXTRA SMALL (537 M AHD)
SMALL (540 M AHD)
MEDIUM (550 M AHD)
LARGE (555 M AHD)
EXTRA LARGE (570 M AHD)
Without local operator demand and CRC
0.40 0.39 0.26 0.23 0.14
With local operator demand, without CRC
0.54 0.58 0.58 0.58 0.39
With CRC, without local operator demand
0.40 0.39 0.26 0.23 0.14
With local operator demand and CRC
0.54 0.58 0.58 0.58 0.39
The overarching findings from this analysis include77:
Key findings from concept engineering design and the comparative analysis include78:
▪ all dam options investigated require a saddle dam
▪ the maximum feasible yield of the Walsh River catchment is approximately 80,000 ML/a79
▪ there are noticeable diminishing returns from investment in the extra-large versus the large sized dam, as the extra-large dam size provides little yield gain for a significant increase in costs, as reflected in the $/ML (refer Figure 7-5)
▪ under all scenarios:
the extra-large dam consistently delivers the lowest BCR
the small dam consistently delivers a better BCR than the extra-small dam
the medium and large dams result in the same (or similar) BCRs under all scenarios
▪ the optimum cost per ML of yield is at approximately 550m AHD, though the cost per ML does not increase significantly between 540m AHD and 555m AHD
77 These findings are true under the comparative analysis completed by MJA, whether or not residual values are included in the comparative CBA 78 These findings are true under the comparative analysis completed by MJA, whether or not residual values are included in the comparative CBA 79 Monthly reliability of 97.4%, based on ‘order of magnitude’ assessment of maximum possible yield, refer SMEC, Preliminary Design Report (Dec 2018)

OPTIONS CONSIDERED
NDMIP DETAILED BUSINESS CASE 135
▪ a dam smaller than 540m AHD results in increasing costs per ML of yield
▪ a dam larger than 556m AHD (74,000 ML/a) results in exponential increase in cost per/ML, with little yield gain coupled with rapid cost rises associated with both further expansion of the main dam wall and the primary saddle dam as well as a need for a second saddle dam
▪ Nullinga Dam cannot support the total demand for water in the MDWSS, at the stated price of $2,000 for MP and $3,000 for HP (per ML), as identified in the demand assessment undertaken for the DBC.
Ongoing uncertainty associated with the development of Nullinga Dam is the potential for local operators to
expand existing production in the MDWSS. To mitigate the impact of this uncertainty, two sizes of Nullinga
Dam were selected for further evaluation, including:
▪ a Nullinga Dam capable of supplying 58,000 ML/a of MP water
To deliver this volume of water, hydrologic modelling has determined that a Full Supply Level of 545 m AHD would be required. This is close to the size determined to deliver the lowest cost per ML that the catchment is capable of yielding.
▪ a Nullinga Dam capable of supplying 74,000 ML/a of MP water
Hydrologic modelling has determined that the maximum feasible yield of the Walsh River catchment is approximately 80,000 ML/a. In addition, the concept dam engineering investigations have shown that, beyond a dam of 556 m AHD, significant additional costs are incurred associated with both further expansion of the main dam wall and the primary saddle dam as well as a need for a second saddle dam. Hydrologic modelling shows the yield of the 556 m AHD Nullinga Dam to be 74,000 ML/a.
Table 7-9 Preliminary Engineering Summary
DAM ‘SMALL’ (545 M AHD) ‘LARGE’ (556 M AHD)
Maximum Wall Height 54.7 m 65.3 m
Total Wall Length 635 m 703 m
Concrete Volume 375,000 m3 687,000 m3
No. of saddle dams required 1 1
Saddle Dam Height 10.7 m 21.3 m
Saddle Dam Length 1,036 m 1,631 m
Volume Stored 256,000 ML 518,000 ML
Yield 58,000 ML/a 74,000 ML/a
P90 Cost Estimate $702.6M $974.6M
$/ML $12,114/ML $13,170/ML
7.2.4.2 Scope of distribution infrastructure works
In the development of the Nullinga Dam solutions, Sunwater assessed a number of options to deliver the
water to major demand areas identified in the RFI (refer Section 5.3.2.1). The concept development for the
distribution infrastructure considered the assets and service requirements under either:80
▪ a standalone approach
80 Nullinga Dam – Water Distribution Concept Report. Sunwater (Nov 2018).
OPTIONS CONSIDERED
NDMIP DETAILED BUSINESS CASE 136
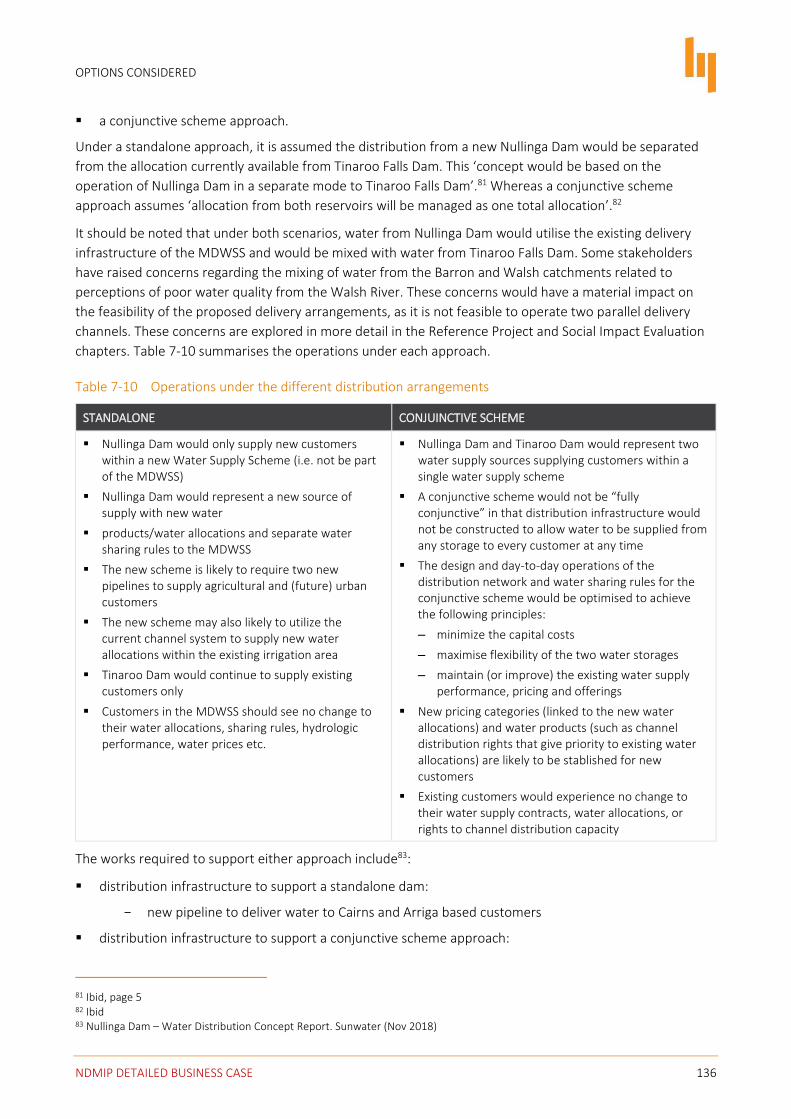
▪ a conjunctive scheme approach.
Under a standalone approach, it is assumed the distribution from a new Nullinga Dam would be separated
from the allocation currently available from Tinaroo Falls Dam. This ‘concept would be based on the
operation of Nullinga Dam in a separate mode to Tinaroo Falls Dam’.81 Whereas a conjunctive scheme
approach assumes ‘allocation from both reservoirs will be managed as one total allocation’.82
It should be noted that under both scenarios, water from Nullinga Dam would utilise the existing delivery
infrastructure of the MDWSS and would be mixed with water from Tinaroo Falls Dam. Some stakeholders
have raised concerns regarding the mixing of water from the Barron and Walsh catchments related to
perceptions of poor water quality from the Walsh River. These concerns would have a material impact on
the feasibility of the proposed delivery arrangements, as it is not feasible to operate two parallel delivery
channels. These concerns are explored in more detail in the Reference Project and Social Impact Evaluation
chapters. Table 7-10 summarises the operations under each approach.
Table 7-10 Operations under the different distribution arrangements
STANDALONE CONJUINCTIVE SCHEME
▪ Nullinga Dam would only supply new customers within a new Water Supply Scheme (i.e. not be part of the MDWSS)
▪ Nullinga Dam would represent a new source of supply with new water
▪ products/water allocations and separate water sharing rules to the MDWSS
▪ The new scheme is likely to require two new pipelines to supply agricultural and (future) urban customers
▪ The new scheme may also likely to utilize the current channel system to supply new water allocations within the existing irrigation area
▪ Tinaroo Dam would continue to supply existing customers only
▪ Customers in the MDWSS should see no change to their water allocations, sharing rules, hydrologic performance, water prices etc.
▪ Nullinga Dam and Tinaroo Dam would represent two water supply sources supplying customers within a single water supply scheme
▪ A conjunctive scheme would not be “fully conjunctive” in that distribution infrastructure would not be constructed to allow water to be supplied from any storage to every customer at any time
▪ The design and day-to-day operations of the distribution network and water sharing rules for the conjunctive scheme would be optimised to achieve the following principles:
– minimize the capital costs
– maximise flexibility of the two water storages
– maintain (or improve) the existing water supply performance, pricing and offerings
▪ New pricing categories (linked to the new water allocations) and water products (such as channel distribution rights that give priority to existing water allocations) are likely to be stablished for new customers
▪ Existing customers would experience no change to their water supply contracts, water allocations, or rights to channel distribution capacity
The works required to support either approach include83:
▪ distribution infrastructure to support a standalone dam:
new pipeline to deliver water to Cairns and Arriga based customers
▪ distribution infrastructure to support a conjunctive scheme approach:
81 Ibid, page 5 82 Ibid 83 Nullinga Dam – Water Distribution Concept Report. Sunwater (Nov 2018)
OPTIONS CONSIDERED
NDMIP DETAILED BUSINESS CASE 137
pipeline duplication and replacement for Arriga Channel system
new pipeline to deliver Cairns allocations
new West Barron pipeline (for larger dam solutions).
7.3 DBC Options
In addition to an updated and refined Base Case (refer Chapter 8), based on the recommendations of the
PBC, updated analysis and investigations, the following options have been selected for further consideration
and analysis in the DBC.
▪ Reference Project 1, a Nullinga Dam (545m AHD) capable of supporting 58,000 ML/a, including consideration of both a standalone and conjunctive scheme solution, along with the associated distribution works.
▪ Reference Project 2, a Nullinga Dam (556m AHD) capable of supporting 74,000 ML/a, including consideration of a standalone solution, partially conjunctive and fully conjunctive scheme solution, along with the associated distribution works.
The scope and scale of these works are further defined in Chapter 9.
7.4 Alternative options
Since the finalisation of the PBC, and during the development of this DBC, various studies and investigations
have been undertaken by Sunwater, local government and Commonwealth Government agencies, which
have provided Building Queensland with updated, improved or additional data/information options
presented in the PBC, for water storage and/or distribution within the MDWSS. This particularly includes:
▪ allocation of distribution loss
▪ raising of Tinaroo Falls Dam
▪ North Johnstone Diversion Scheme.
While an overview of these initiatives is further discussed below, it is acknowledged that this DBC focuses on
assessing the feasibility of appropriate Nullinga Dam options, in line with commitments under the NWIDF.
Alternative options, both raised in the PBC, or subsequently by third parties, have not been included in the
Base Case or Reference Projects given the scope of the DBC, and as a result of ongoing uncertainties relating
to environmental and/or social risks, with concept designs not as developed as the Nullinga Dam options.
7.4.1 Allocation of distribution loss
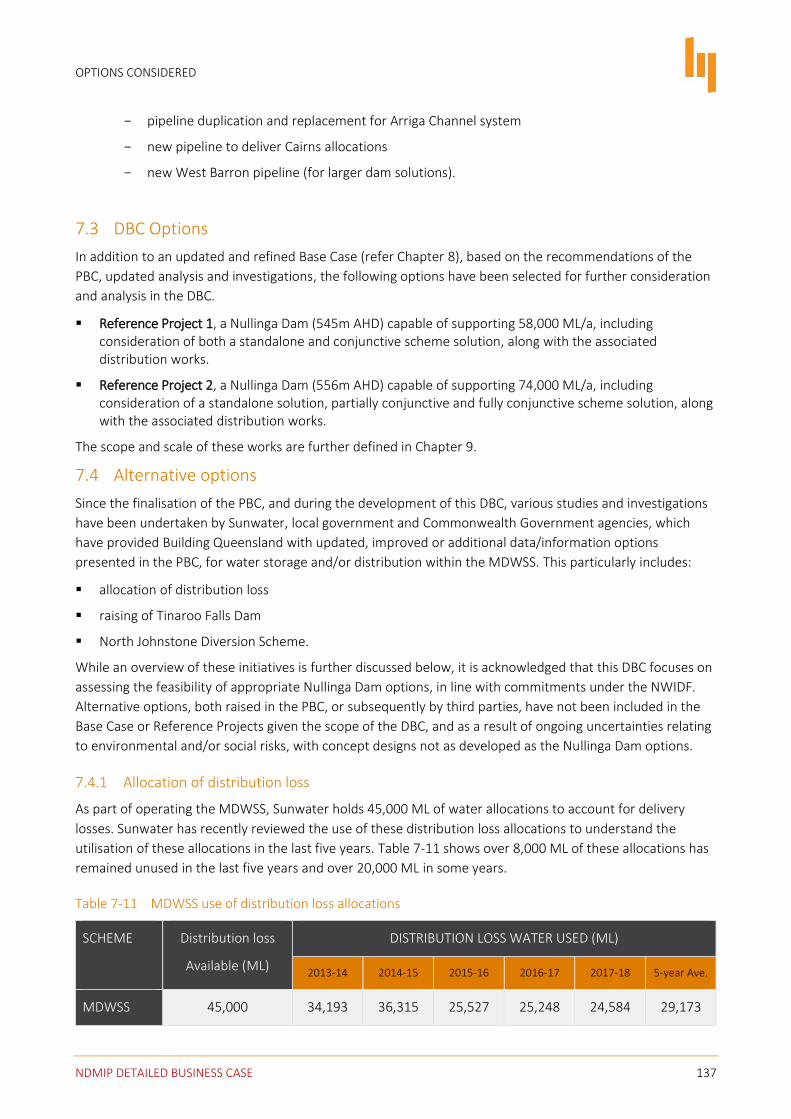
As part of operating the MDWSS, Sunwater holds 45,000 ML of water allocations to account for delivery
losses. Sunwater has recently reviewed the use of these distribution loss allocations to understand the
utilisation of these allocations in the last five years. Table 7-11 shows over 8,000 ML of these allocations has
remained unused in the last five years and over 20,000 ML in some years.
Table 7-11 MDWSS use of distribution loss allocations
SCHEME Distribution loss
Available (ML)
DISTRIBUTION LOSS WATER USED (ML)
2013-14 2014-15 2015-16 2016-17 2017-18 5-year Ave.
MDWSS 45,000 34,193 36,315 25,527 25,248 24,584 29,173

OPTIONS CONSIDERED
NDMIP DETAILED BUSINESS CASE 138
Sunwater has identified the potential to make between 5 and 15 per cent of the distribution loss allocations
to be made available for seasonal water assignment (temporary trading) within the water year. The exact
proportion would need to represent a balance between the potential benefits of trading Sunwater’s unused
water against the risk of ‘running short’ if dry conditions eventuate. In the latter case, Sunwater would be
obliged to go to the market and buy water to cover a shortfall in water required to deliver customer
allocations.
This option was not adopted in either the Base Case or Reference Projects at the time this DBC was
developed, noting:
▪ Sunwater continues to investigate:
the percentage of loss allocation to be made available on an annual basis
impact the MDWSS Channel Efficiency Improvement Project would have on the volume of water that may be available for temporary trading
▪ DNRME would need to
Consider the potential amend the water trading rules in the Barron Water Plan, noting it does not currently allow for the temporary trading of distribution loss allocations.
In addition to a range of unknowns, Sunwater would need to engagement with irrigators and other
stakeholders should a temporary trading of distribution loss allocations initiative be determined as
technically viable, commercially attractive and economically sustainable.
7.4.2 Tinaroo Fall Dam raising
This option considers the potential to raise the FSL of Tinaroo Falls Dam, to increase the potential yield of the
existing supply source for the MDWSS. This option was explored as part of the PBC (refer Section 7.2),
though it was not selected for further evaluation due to high potential capex, potential for inundation of
residential properties adjacent to the dam and limited stakeholder support.
7.4.3 North Johnstone Diversion Scheme
The North Johnstone Diversion Scheme involves transferring water from the North Johnstone River near
Malanda to Kenny Creek, a tributary of the Barron River upstream of Tinaroo Falls Dam. The PBC dismissed
this solution, largely based on the environmental concerns, which included: 84
▪ potential downstream impacts on aquatic and terrestrial flora and fauna and on the riverine and riparian habitats upon which they may depend
▪ a number of endangered, vulnerable and rare mammals, reptiles’ birds and frogs present were identified in the area of the offtake and the diversion routes
▪ any rainforest remnants are likely to contain a high species diversity and high probability of occurrence of rare and vulnerable species
▪ potential to impact two listed threatened ecological communities, 33 listed threatened species and 20 listed migratory species, of particular concern is the critically endangered:
Mabi Forest
Curlew Sandpiper
Eastern Curlew
84 Hyder Environmental (1999)

OPTIONS CONSIDERED
NDMIP DETAILED BUSINESS CASE 139
Mountain Mistfrog.
▪ potential downstream impacts on the Great Barrier Reef and associated aquatic flora and fauna and the North Johnstone River empties into the Great Barrier Reef Marine Park Area.
Since the development of the PBC, additional desktop studies85 have identified potential new alignments for the diversion which may negate some of these environmental concerns.
This option has not been adopted in either the Base Case or Reference Projects in this DBC, as it is noted:
▪ concept design is still at a very high level
▪ further technical investigations would need to be completed to understand the overall environmental impacts from a new alignment, and the extent to which the previously noted concerns are abated.
It is acknowledged that should the environmental concerns be adequately mitigated this solution could
potentially support allocations of 30,000 ML/a or more.86
85 Stantec (April 2019) 86 Ibid